A four parameter model for the solid-electrolyte interphase to predict battery aging during operation
Abstract
Accurately predicting aging of lithium-ion batteries would help to prolong their lifespan, but remains a challenge owing to the complexity and interrelation of different aging mechanisms. As a result, aging prediction often relies on empirical or data-driven approaches, which obtain their performance from analyzing large datasets. However, these datasets are expensive to generate and the models are agnostic of the underlying physics and thus difficult to extrapolate to new conditions. In this article, a physical model is used to predict capacity fade caused by solid-electrolyte interphase (SEI) growth in 62 automotive cells, aged with 28 different protocols. Three protocols parametrize the time, current and temperature dependence of the model, the state of charge dependence results from the anode’s open circuit voltage curve. The model validation with the remaining 25 protocols shows a high predictivity with a root-mean squared error of . A case study with the so-validated model shows that the operating window, i.e. maximum and minimum state of charge, has the largest impact on SEI growth, while the influence of the applied current is almost negligible. Thereby the presented model is a promising approach to better understand, quantify and predict aging of lithium-ion batteries.
1 Introduction
Lithium-ion batteries are the current benchmark technology for mobile energy storage because they combine high energy density and longevity. Nevertheless, different aging phenomena continuously decrease the usable capacity and limit the battery’s lifetime. This is a major challenge for battery electric vehicles (BEV), which require a battery lifetime of about 10 years. To ensure a certain remaining capacity in this timespan, a detailed understanding and quantification of the capacity fade in lithium-ion batteries is imperative.
Two main approaches exist to predict capacity fade in lithium-ion batteries. On the one hand, (semi-)empirical approaches based on simplified physical equations or data driven methods generate a precise aging quantification from large datasets 1, 2, 3, 4, 5, 6. However, obtaining the necessary datasets is costly and the resulting models can not easily be extrapolated or adapted to new cell chemistries. On the other hand, physics-based approaches model the underlying aging phenomena and infer equations to describe aging based on operating conditions 7, 8, 9, 10, 11, 12, 13, 14, 15, 16, 17.
Most physical battery aging models rely on resolving solid-electrolyte interphase (SEI) growth as the major cause of continuous capacity fade 18, 19, 20, 21. The SEI is a thin layer on the anode, which emerges in the initial battery cycle from electrochemical reactions of electrolyte molecules, electrons and lithium ions 22, 23, 24, 25, 26, 27, 28, 29. In subsequent cycles, the SEI shields electrolyte molecules from electrons, but continues to grow due to a leak current through the SEI.
During storage, the square-root-of-time () dependent capacity fade points to a self-limiting kinetic behind this continuous growth process 7, 8, 10, 15, 30. Diffusion of localized electrons, e.g. as neutral lithium interstitial atoms 31, 32, emerged as most likely growth limiting mechanism as it best captures the experimentally observed voltage dependence 33, 34, 15.
During operation, recent experiments of Attia et al. 35 reveal that SEI growth accelerates with increasing charging current and decreases with increasing discharging current. We orient us on these findings in our recent work 17 and extend the model of Single et al. 15 for the effect of battery operation. The resulting model shows good accordance with both, storage and operation capacity fade measurements.
In this paper, we use the long-term limit of our model from ref. 17 to describe capacity fade of 62 automotive grade pouch cells aged with 28 different protocols 36. Using differential voltage analysis (DVA), we first separate capacity fade into the three aging modes loss of active material on positive and negative electrode and loss of active lithium (LL), which we account to SEI growth 37, 38. Then, three protocols and the anode open circuit voltage (OCV) curve parametrize the time, current, temperature and state of charge (SoC) dependence of the model, while the remaining 25 protocols validate our model predictions. Finally, post-mortem experiments with experimental coin cells built from harvested electrode materials provide further complementary validation for the model’s assumptions.
2 Experimental
In the following section, we outline our experimental methods. Subsection 2.1 concisely presents the cell specifications and the test matrix. Figure 1 shows our methodology to separate capacity fade into different aging modes and isolate the influence of LL. During operation, we determine LL with DVA, presented in Subsection 2.2. Post mortem, we analyse heterogeneities using DVA as described in Subsection 2.3.
2.1 Aging test
The aging test comprises 62 automotive grade lithium ion pouch cells with a nominal capacity of and nominal voltage of . The cells contain a graphite anode and a blend cathode consisting of and . The aging procedure is detailedly described in ref. 36 and the aging conditions are listed in Table SI-1.
In short, the cycling protocol consists of a charging sequence with a constant power and subsequent constant voltage until reaching . Afterwards, a dynamic EV profile discharges the cell to with maximum currents of up to , followed by repetition of charge sustaining hybrid-EV profiles until the specified , which is the ratio of energy throughput stemming from EV and hybrid-EV driving, is met.Real driving profiles are the basis for EV and hybrid-EV profiles which roughly compare to the widely used WLTP profiles. To reveal the influence of these factors on aging, we use a central composite design of experiments. This approach varies the influencing factors around a common center point at , , , and . Additionally we perform one calendar aging test at and . Twofold measurement of each aging protocol and eightfold measurement of the center point results in 28 different conditions of the 62 cells, detailedly described in ref. 36 and listed in Table SI-1.
To track the capacity fade we conduct reference parameter tests (RPT) at after every two weeks of cycling. These tests consist of three 1C/1C cycles and one 1C/0.1C cycle between and with CCCV charging with a cut-off at 0.05C and CC discharging. Additionally we measure discharge pulses with a current of at , , and SoC. For this work we focus on the C/10 capacity fade as exemplarily shown in Figure 1a). In the context of the aging test a C-rate of 1C corresponds to the current that charges the cell within one hour based on a nominal capacity of . In our analysis in Subsection 4.4 we base the C-rate on the measured mean BoL capacity of . The measured capacity fade consists of an irreversible part and a reversible part originating from lateral flow of lithium into the anode overhang 39. To retrieve the bound charge in the anode overhang and thus isolate the irreversible part, we remove one cell for each aging condition from the aging test after about two years and discharge to SoC. Subsequently we perform another RPT after two to three months prior to post mortem analysis.

2.2 Isolating active lithium loss
We quantify the contribution of active material and active lithium loss on the overall capacity fade with the DVA fitting algorithm described by Fath et al. 40 based on the C/10 discharge. The algorithm relies on changes in the cell’s voltage curve relative to the begin of life (BoL), see Figure 1b). Loss of active material on the anode and cathode side stints the electrode potential curves and , respectively. In contrast, loss of lithium inventory, e.g. stemming from SEI growth or lithium plating, shifts the anode’s vs. the cathode’s potential curve 37, 38, 40.
The algorithm varies the BoL potential curves accordingly to fit the aged curves and consists of two parts exemplarily shown in Figure 1c). First, the algorithm varies the LL and the loss of active material on anode and cathode side until the peak positions match, see I in Figure 1c). Second, the algorithm fits the peak broadening observed in II-III in Figure 1c) as inhomogeneous aging by dividing the cell into seven parallelly connected cell segments. Each segment shows a particular LL according to a linear distribution around the previously determined mean LL 41, 42. From this distribution, the overall DVA results as weighted sum of the cell segments inverse 42, 40, 43. Both steps are repeated until the root mean square error (RMSE) between fitted and measured curve is minimal. Minimum and maximum of the fitted LL then indicate the homogeneity of lithium distribution inside the cell.
Fitting all available C/10 curves, we obtain a distribution of lithium loss (LL) across the cell throughout the entire course of aging, shown in Figure 1 d). Here, the orange crosses indicate the capacity fade resulting from LL and the orange area shows the inhomogeneity of lithium loss based on the previously fitted distribution. As we observe significant inhomogeneity after around two years, we also conducted post mortem experiments to validate our assumptions.
2.3 Post mortem analysis
As first step of our post mortem analysis, we uniformly discharge the cells with C/3 CCCV and C/50 cutoff to . Then, we open the cells in a glovebox with argon atmosphere and and levels below following the procedure described by Sieg et al. 42. To remove residues of conducting salt, we wash anode and cathode layers from the middle of the stack in a bath of dimethyl carbonate (DMC) for at least three minutes. Afterwards, we remove active material from one side of the electrode and cut coins with diameter (see Fig 1 d). From coins that are opposing in the original pouch cell configuration, we assemble experimental cells using the PAT-Cell Setup from EL-Cell with the FS-5P core cells according to Figure 1 e). The cells contain of a DMC/EC electrolyte, a thick double layered PE-fibre / PP-membrane separator, a metallic lithium reference electrode, and aluminum and copper plungers as current collectors. Lastly, each cell undergoes a formation procedure with CC cycles between and consisting of 2x , 2x , 2x , 1x .
We electrochemically test the so-formed cells at with a BaSyTec CTS system. Discharge capacity and potential curves result from charging three times to 4.2V CCCV with and cutoff and subsequently CC discharging with to , corresponding to a C-rate of at BoL.
3 Theory
In this subsection, we present our mathematical model to describe capacity fade during battery operation caused by SEI growth. We start with a half-cell cycling model followed by an SEI growth model. Concludingly, we summarize the implemented system of equations.
3.1 Half-Cell Cycling
The applied intercalation current changes the half-cell charge over time according to differential Equation 1
| (1) |
Here, we use the IUPAC convention and define the intercalation current as negative and the deintercalation current as positive. We obtain the overpotential from the intercalation current based on a symmetric Butler-Volmer approach
| (2) |
with Faraday’s constant , the universal gas constant and the temperature in Kelvin. The intercalation exchange current depends on the reaction rate and the SoC with the maximum capacity 44. In the following we state equations to describe capacity fade resulting from SEI growth.
3.2 SEI Growth
We rely on our model developed in ref. 17 to describe SEI growth during battery operation. From the multitude of possible reactions, we assume that the SEI predominantly forms from the reaction of lithium ions , electrons and electrolyte molecules, e.g. ethylene carbonate , according to reaction 3
| (3) |
Here, is the commonly observed SEI component lithium ethylene dicarbonate and is a gaseous residue. Assuming that lost lithium inventory is completely bound in the SEI with thickness , we linearly link both quantities with
| (4) |
Here, is the stoichiometric coefficient of lithium ions in the SEI formation reaction 3, is the mean molar volume of the resulting SEI components and denotes the active electrode surface. Over time, the SEI grows in thickness according to differential Equation 5
| (5) |
The SEI formation current density results from the diffusion of localized electrons, e.g. as lithium interstitial atoms , from the electrode to the electrolyte 31, 15, 17. We describe this process with the long-term limit of our model developed in ref. 17,
| (6) |
Here, and are the equilibrium concentration and the diffusivity of lithium atoms inside the SEI. The diffusivity depends on the temperature according to an Arrhenius kinetic
| (7) |
with the reference diffusivity and the activation energy . The overpotential for the formation of these lithium atoms depends on the OCV of the anode (see Figure SI-1), the intercalation overpotential , and the reference chemical potential of lithium atoms , which we gauge to 0, according to
| (8) |
3.3 Model Summary
In the following, we summarize our set of equations to determine active lithium loss due to SEI growth. We start with the differential equation to determine the SoC from the applied current profile
| (9) |
From the SoC and the current profile , we then calculate the SEI formation overpotential
| (10) |
Followingly, we determine the SEI thickness evolution with the semi-analytical solution of Equation 5 and Equation 6, Equation 11
| (11) |
Lastly, the active lithium loss LL results from the SEI thickness via
| (12) |
Overall, the model relies on four fitting parameters to describe SEI growth. The diffusivity and the initial SEI thickness quantify the calendaric SEI growth rate. The exchange current density affects the resulting overpotential and thereby describes the current dependence of SEI growth. Lastly, the activation energy specifies the temperature dependence of SEI growth. Implementing the model equations 9-11 as numerical integration with e.g. MATLABs trapz yields results for yearlong cycling protocols within seconds.
4 Results and Validation
In this section, we present the experimental and theoretical results obtained from the precedingly discussed experiments and model. We start by pointing out the dominant influence of lithium loss on capacity fade which we analyze with the DVA. Afterwards we compare the measured lithium loss of the test cells to our theoretical predictions and thereby parametrize and validate our model. Subsequently, a post mortem analysis shows the validity of our experimental and theoretical assumptions. Concludingly, we show the sensitivity of our SEI growth model to operating patterns and identify detrimental operating conditions.
4.1 Identifying the cause of capacity fade
Using the DVA fitting algorithm as presented in Subsection 2.2 we quantify the contribution of the aging modes loss of active lithium (LL) and active material losses on anode side (AMLn) and on cathode side (AMLp) to overall capacity loss.

Figure 2a) exemplarily shows measured and fitted dU/dQ curves at different times for the reference cell 39. In the measured curves we observe only slight changes in the peak positions, pointing to negligible active material losses 38. In the beginning, the peaks become sharper, which indicates a more homogeneous lithium distribution 42, possibly due to the anode overhang effect45, 39. After about 300 days the peaks broaden again, pointing towards a more heterogeneous lithium distribution due to heterogeneous aging, as we also observe in our post mortem analysis conducted after ending of test, see Section 4.3.
The results of the fitting algorithm in Figure 1b) support these observations and further show that AMLp exists but is not limiting. The fitted LL shows good accordance with the measured capacity loss except for a slight offset at BoL, which we attribute to a slight mismatch in initial balancing due to inhomogeneities.
We emphasize that overall capacity loss is not equal to the sum of LL, AMLp and AMLn. Instead, capacity loss stems from limitations at the lower or upper cutoff voltage, which in turn result from changes in electrode balancing due to the different aging modes. For example, the aging simulation with AMLp and LL in Figure 1b) shows, that LL shifts the steep anode potential and thus limits the lower cutoff potential, while AMLp is not significantly limiting the lower cutoff potential as it only slightly shifts the shallow cathode potential.
We observe similar trends with LL being the dominant aging factor for all cells. This allows us to focus our modeling approach on the main aging mechanism SEI growth as root-cause of LL and thus to keep the model simple. However, harsher aging conditions or different cell chemistries can induce more severe active material losses, where our simple approach might fall short.
4.2 Predicting lithium loss
4.2.1 Parametrization
As a first step, we use storage data to parametrize the initial SEI thickness and the diffusivity , see Equation 7. In this case, we solve Equation 11 analytically, because the SEI overpotential is constant in time. This leads to the well-known -dependence of SEI growth during battery storage 15
| (13) |
Figure 3 compares the remaining active lithium inventory predicted by our model with experimental data.
We see that the analytically derived SEI growth law, Equation 13, agrees excellently with the experimentally obtained capacity fade curves. In the following, we thus rely on the so-determined values for and and proceed to determine the two remaining fitting parameters.
Next, we parametrize the influence of charging current on SEI growth with the exchange current . For parametrization, we choose cell 39 from the reference cells 39-47, which were cycled at the same temperature as the storage cell and showed low variance among the eight fold measurement.

Before comparing our simulations with experiments, we illustrate the simulated SoC profile and the resulting SEI growth in Figure 4 a). The orange line indicates the SoC of the battery during one cycle profile, which was then repeated several times. For the center cells, the SoC was mostly kept around 30% with a charging/discharging sequence to 90% in between. This protocol largely influences the SEI growth, which is shown in the blue curve. We observe that SEI growth proceeds slowly in the 30% SoC phases. During charging to 90%, the SEI growth is fastest, followed by the storage at 90%. This accelerated growth results from the influence of intercalation overpotential and OCV on the SEI overpotential according to Equation 8, which is in line with previous capacity fade measurements 33, 34, 35.
Figure 4b) compares the average lithium loss in the center point cells with the simulated capacity fade. The distribution of LL (orange area) exhibits a hourglass shape. In the first 150 days lithium distribution becomes more homogeneous, possibly due to the anode overhang effect. After about 300 days lithium distribution becomes increasingly inhomogeneous due to heterogeneous aging, as we also observe in our post mortem analysis conducted after ending of test, see Section 4.3.
Overall, our mathematical SEI model agrees well with the experiments, especially in the homogeneous area between 200 and 400 days. However, between 0 and 100 days, we observe a deviation of experiment and simulation, primarily because the experimental active lithium inventory starts below 100%. We attribute this offset to experimental uncertainties, as the BoL electrode potentials that were used as basis for DVA fitting were measured well after test start. Hence the BoL cell can stem from a different production batch and thus show different initial lithium distribution resulting e.g. from the reversible anode overhang effect 45, 39. The kinks in the simulation profile result from the modular build-up of our simulation consisting of storage, cycle-profile and RPT phases. As each of these phases shows a different aging behaviour, we observe kinks between the profiles. After 800 days the active lithium inventory remains nearly constant in our simulation, because the battery is stored at a low SoC.
The intercalation reaction rate is not exclusive to our SEI model, but also a parameter in the commonly used Doyle-Fuller-Newman battery model 46. This enables a comparison of our value with values found in literature. Sauer and coworkers 47, 48 derived values ranging from to from electrochemical impedance spectroscopy (EIS). However, the determination of is ambiguous as the electrode active surface area is not easily attainable. As a consequence, Ng et al. 49 determine the exchange current of a cell with galvanostatic intermittent titration technique (GITT) to be around , which is comparable to our value of for a cell.
Building up on this parametrization, we next determine the dependence of SEI growth on temperature by fitting the diffusivity to the high temperature cells cycled at . The parameters as well as then result from the Arrhenius Equation 7 and the diffusivity , which we previously determined from storage data, see Figure 3. In Figure 4c), we again observe the hourglass shape of heterogeneity with a minimum around 200-400 days. Compared to the previous cell, the heterogeneity is even more pronounced in the long term and spans up to 10% at around 800 days. Our model shows good accordance to the average experimental values, but deviates in the long term. As we also observe the highest heterogeneity in this case, we account the long term deviation between simulation and experiment to additional thermal effects, which are not captured by our simple SEI growth model. These effects could comprise thermal SEI degradation, lithium plating or electrolyte dry out.
4.2.2 Validation
In this section, we validate our aging model with the remaining 25 protocols, which were not used for parametrization.
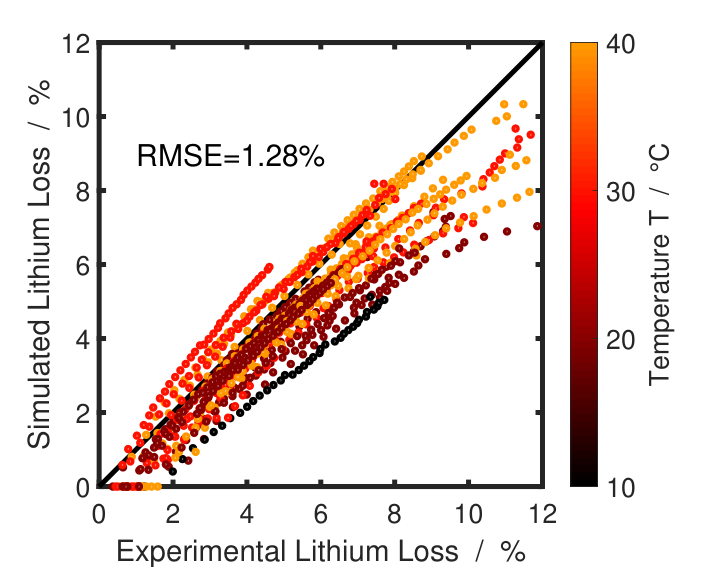
Figure 5 summarizes the validation results in a scatterplot, which compares the simulated and the experimentally measured lithium loss. The complete results of our aging simulations are listed in Figure SI-4. The points are colored according to the operating temperature of the cells, which ranged from to . In general, we observe a good accordance of simulation and experiments, which also reflects in the low root-mean-square error of . This underlines the outstanding global predicitivity of our model, which we obtained already after parametrizing the model with only three aging protocols.
However, we observe a systematic deviation of our simulated results from the experiments for temperatures below as well as high aging states with more than 10% lithium loss. We attribute this deviation to increased lithium plating at low temperatures as well as the large heterogeneity observed for these cells. Also the mentioned offset of measured LL at beginning of test amplifies the deviation. Followingly, we further validate these assumptions with post mortem analysis.
4.3 Post Mortem Validation
In Figure 6, we exemplarily illustrate the model predictions for three cells cycled with different protocols at different temperatures and compare them to the measured local LL from experimental cells prepared as part of the post mortem analysis.

Visually, we already suspect an accelerated degradation focused to the center of the electrode from the anode photographs of the three cells in Figure 6 due to the intensified blue coloring. Additionally cell 37 and 51 also exhibit shiny metallic grey spots that we attribute to lithium plating. Experimental cell measurement of particular anode areas allow to further evaluate heterogeneous capacity fading. For this purpose, we separate the electrode area into edge (), mid() and center () as indicated in Figure 1. Local LL of the respective areas are shown as points at the end of life in the bottom part plots of Figure 6.
We observe that especially the center shows the highest LL and thus drives inhomogeneity of lithium distribution for all three cells. In contrast, the edge and mid areas age more homogeneously and our model nicely accords to this experimental LL for the moderately aged cells shown in Figure 6 d) and e). However, we see a large deviation to the fitted mean LL for the more harshly aged cell 51, Figure 6 f). We attribute this model deviation to increased aging due to lithium plating in this case, as is also evident from the photograph in Figure 6 c). To further increase our model accuracy for these cases, inhomogeneous SEI growth and lithium plating should be considered in future works.
4.4 Identifying detrimental conditions
In this section, we conduct a sensitivity analysis to unravel particularly detrimental operating patterns. Subsequently, we study the impact of different, simplified real-life motivated user profiles on aging in a case study.
4.4.1 Sensitivity analysis

Figure 7a) shows the influence of current , SoC and temperature on aging compared to a central point, which is stored () with at . We observe that the influence of electrochemistry, i.e. applied current and SoC exceeds the influence of temperature. In particular, we observe the highest SEI current for charging at a rate of 1C. This influence arises from the intercalation overpotential , which increases the SEI overpotential (Equation 8) and thereby accelerates SEI growth. During discharging, in contrast, increasing the C-Rate has the adverse effect and decelerates the SEI growth until it is nearly suppressed at discharging with 1C. This is in good accordance with recent experiments of Attia et al. 35, who showed this asymmetry in SEI growth between charging and discharging and thus motivated our model extension in reference 17.
However, the shown influence of applied current on degradation is misleading, because the applied current also affects the cycle time. To emphasize this relationship, we also plot the normalized degradation rate as dashed yellow line in Figure 7a). This rate compares the mean cumulated SEI growth within one cycle. We observe three main effects: First, the influence of charging current on degradation is not as severe as we would expect solely from the yellow graph. Second, the degradation per cycle diverges for , because the long cycle times increase the calendaric aging. Third, the opposing effects of current and cycle time on the degradation rate lead to an optimum at around C/3. To further analyse the complex interrelation of charging current and cycle time, we conduct a case study with different charging profiles in Subsection 4.4.2.
Another major contribution to SEI growth arises from the state of charge. We observe in Figure 7a) that the SEI current closely follows the anode OCV-curve (see Figure SI-1), in line with the experimental results of Keil et al. 33, 34 and the model of Single et al. 15. This dependence causes cells stored at 60% SoC to age nearly four times as fast as cells stored at 50% SoC, while storage at 80% leads to a similar capacity fade as storage at 60%.
This trend also reflects in the depth of discharge , which we analyze in the following. Figure 7b) plots the remaining active lithium inventory after cycling for two years with , depending on the DoD. We simulate two different approaches; The blue curve shows a DoD variation around a mean SoC=50%, while the orange curve varies the DoD with a fixed maximum SoC=100%.
The blue curve shows that increasing the DoD around a mean SoC causes accelerated aging up to a plateau of 91% active lithium inventory at 50% DoD. This dependence results from the SoC-dependence of aging, see Figure 7a). In the regime of 0-50% DoD, the battery experiences increasing share of SoCs larger than 60%, which according to Figure 7a) increases aging. In the regime of 50-100% this trend is balanced by the decreased aging for SoCs below 20% leading to the observable plateau. In comparable experiments, Ecker et al. 50 and Hoog et al. 51 observed an approximately linear dependency of capacity degradation with increasing DoD when cycling NMC/graphite cells around a mean SoC of 50%. Contradictory Sarasketa-Zabala et al. 52 showed a more complex dependency for LFP/graphite cells with the highest capacity fade between 10% and 50% DoD and lower capacity fade at very high and very small DoD, again while cycling around a mean SoC of 50%.
The orange curve shows that for cycling around a fixed maximum SoC of 100%, increasing the DoD results in slower aging. Again, this trend originates from the influence of SoC on aging, depicted in Figure 7a). A systematic DoD variation from 100% maximum SoC is not reported as often in literature, but results from Rechkemmer et al. 53 for hint to accelerated degradation at high DoD which is in contrast to our predictions based on anode SoC. Also Laresgoiti et al. 54 derive an exponential acceleration of SEI-growth with increasing DoD from their SEI cracking approach as the particles undergo greater volume change. Benavente-Araoz et al. 55 on the other hand observed a significantly higher degradation for cycling between 65-95% SoC compared to 20-95 % which is qualitatively in line with the SoC dependence as predicted in our model.
Summing up the depth of discharge dependence of aging predicted by our model compared to literature 50, 51, 52, 53, 54, 55, we at most partially reproduce the experimentally observed trends. Accordingly, the influence of DoD on aging arises not only from a shift of the anode OCV, but also from additional effects. For example, the DoD affects particle volume changes and thus may cause SEI fracture or loss of electrical contact of individual particles. To capture these effects and increase our model predictivity in this respect, extending the present simplistic SEI model for mechanics seems promising 56, 57.
4.4.2 Case Study
We now apply our model to study battery aging in different, real-life motivated battery user profiles. We consider three electric vehicle enthusiasts: standard driver Stan (blue), range anxious Robert (red) and aging optimizer Alfred (yellow), who travel to work back and forth every working day. All three drive steadily at and for simplicity discharge their EV with a range of constantly at C/10 for one hour at a constant temperature of .

Figure 8a) shows the SoC during each working week for the three drivers. Stan starts his working week with a fully charged battery and charges at home once the SoC is below . Robert also starts his week with a fully charged battery, but charges every time his battery falls below . Alfred carefully read the papers of Keil et al. 33, 34 and thus starts at and recharges only if the SoC is below . At the end of each working week, all three recharge their EV to their initial SoC and don’t move their EVs over the weekend. They all try different charging rates, starting from the standard charging rate C/8 shown in the darkest color, over the brighter C/3, up to the brightest 1C. In the course of one week, all three drive the same range and thus also have the same charge throughput.
In Figure 8b), we show the loss of cyclable lithium after three years for each driver. We clearly see that range anxious Robert’s EV shows the highest capacity loss of , closely followed by standard driver Stan with . In contrast, aging optimizer Alfred only loses of his EV’s starting capacity. The different charging rates, colored in brighter colors, hardly affect the battery aging and cause only an increase about to from C/8 to 1C for standard driver Stan.
We best comprehend the different aging characteristics with the sensitivity analysis of our model shown in Figure 7a). Range anxious Robert and standard driver Stan operate their batteries mostly at high SoCs, contrary to aging optimizer Alfred. Following the red curve in Figure 7a), we see that Robert and Stan are thus mostly on the highest graphite stage, which exhibits nearly the fourfold degradation rate compared to the second graphite stage on which Alfred mostly operates his battery. This is the main cause of accelerated aging that we see in Figure 8b).
Surprisingly, the charging current plays only a minor role, although according to the yellow line in Figure 7a) it should have the largest impact on the degradation rate. However, because the charging time shortens with increasing current, this dependence is misleading as we also showed with the dashed yellow line in Figure 7a). The presented user-profiles further enrich this analysis and show that degradation depends rather on the charge throughput than the applied charging rate. However, our simplistic model only considers SEI growth as aging mechanism. For lithium plating we would expect a major effect of fast charging rates on aging.
Summarizing the findings of our experimentally validated aging model, we predict that battery aging depends mainly on the operating window, i.e. maximum and minimum SoC. Charging current and temperature, in contrast, have only a minor influence.
However, our predictions are based on a homogeneous SEI growth model with some inherent shortcomings. First of all, DVA and post mortem analysis reveal heterogeneous aging within the cells. Implementing our model in three-dimensional thermal and electrochemical battery models will help to resolve heterogeneous SEI growth 58, 59, 60. Furthermore, we observe excessive lithium plating in the cell center, which results presumably from thermal hotspots 61. Extending our model for a plating kinetic will not only help to predict these heterogeneities, but also increase our model predictivity for low temperatures. In the long-term, the locally strong aging will eventually cause ”sudden death” of specific cell areas due to electrolyte dry-out. Coupling our SEI-growth model to the percolation model of Kupper et al. 62 is a promising approach to capture this effect. Lastly, DVA reveals an OCV-curve change over time, which will also affect the aging kinetics. Future works can rely on our SEI growth model and refine it for these secondary aging modes to further increase the model predictivity.
5 Conclusion
We applied an electrochemical SEI growth model 17 to predict active lithium loss in 62 automotive grade batteries cycled with 28 different protocols 36. The simplicity of our model allows us to to parametrize the state of charge, time, current and temperature dependence of the model with only three protocols and the open circuit voltage curve of the anode. The validation with the remaining 25 protocols shows remarkable accordance of predicted and measured active lithium loss with a global root-mean-squared error of 1.28%. Thus, our methodology reduces the set of experiments to parametrize a global aging prediction.
For the first time, our so-validated model quantitatively predicts how operating conditions affect battery lifetime. Along three exemplary use cases, we show that the battery operating window, i.e. minimum and maximum state of charge, mainly drives aging. In contrast, temperature and current play only a minor role. These insights help in deriving battery design and usage recommendations to prolong lifetime.
Future works can further refine and extend our model for several effects. In particular, post mortem analysis of aged cells with differential voltage analysis reveal lithium plating and heterogeneous aging inside the cells. Extending the model for lithium plating is straightforward, because we assume lithium atom mediated SEI growth. To resolve heterogeneous aging, implementing our model in three-dimensional cell simulations is a promising approach 58, 59, 60.
Acknowledgements
Lars von Kolzenberg gratefully acknowledges funding and support by the German Research Foundation (DFG) within the research training group SiMET under the project number 281041241/GRK2218. The support of the bwHPC initiative through the use of the JUSTUS HPC facility at Ulm University is acknowledged. This work contributes to the research performed at CELEST (Center for Electrochemical Energy Storage Ulm-Karlsruhe). We also thankfully acknowledge Mercedes-Benz AG for funding of the extensive cyclic aging test. We thank Timm Konstantin Groch for his support in the post mortem analysis.
Conflict of interest
The authors declare no conflict of interest.
References
- [1] Stefan Käbitz, Jochen Bernhard Gerschler, Madeleine Ecker, Yusuf Yurdagel, Brita Emmermacher, Dave André, Tim Mitsch, and Dirk Uwe Sauer. Cycle and calendar life study of a graphite—LiNi1/3Mn 1/3Co1/3O2 Li-ion high energy system. Part A: Full cell characterization. Journal of Power Sources, 239:572–583, 2013.
- [2] Johannes Schmalstieg, Stefan Käbitz, Madeleine Ecker, and Dirk Uwe Sauer. A holistic aging model for Li(NiMnCo)O2 based 18650 lithium-ion batteries. Journal of Power Sources, 257:325–334, 2014.
- [3] Jens Groot, Maciej Swierczynski, Ana Irina Stan, and Søren Knudsen Kær. On the complex ageing characteristics of high-power LiFePO4/graphite battery cells cycled with high charge and discharge currents. Journal of Power Sources, 286:475–487, 2015.
- [4] Severin Lukas Hahn, Mathias Storch, Ramanathan Swaminathan, Bjrn Obry, Jochen Bandlow, and Kai Peter Birke. Quantitative validation of calendar aging models for lithium-ion batteries. Journal of Power Sources, 400(August):402–414, 2018.
- [5] Kristen A. Severson, Peter M. Attia, Norman Jin, Nicholas Perkins, Benben Jiang, Zi Yang, Michael H. Chen, Muratahan Aykol, Patrick K. Herring, Dimitrios Fraggedakis, Martin Z. Bazant, Stephen J. Harris, William C. Chueh, and Richard D. Braatz. Data-driven prediction of battery cycle life before capacity degradation. Nature Energy, 4(5):383–391, 2019.
- [6] Samuel Greenbank and David Howey. Automated feature extaction and selection for data-driven models of rapid battery capacity fade and end of life. IEEE Transactions on Industrial Informatics, page 1–1, 2021.
- [7] M. Broussely, S. Herreyre, P. Biensan, P. Kasztejna, K. Nechev, and R. J. Staniewicz. Aging mechanism in Li ion cells and calendar life predictions. Journal of Power Sources, 97-98:13–21, 2001.
- [8] Harry J. Ploehn, Premanand Ramadass, and Ralph E. White. Solvent Diffusion Model for Aging of Lithium-Ion Battery Cells. Journal of The Electrochemical Society, 151(3):A456–A462, 2004.
- [9] John Christensen and John Newman. A Mathematical Model for the Lithium-Ion Negative Electrode Solid Electrolyte Interphase. Journal of The Electrochemical Society, 151(11):A1977–A1988, 2004.
- [10] M. B. Pinson and M. Z. Bazant. Theory of SEI Formation in Rechargeable Batteries: Capacity Fade, Accelerated Aging and Lifetime Prediction. Journal of the Electrochemical Society, 160(2):A243–A250, 2012.
- [11] M. Tang, S. Lu, and J. Newman. Experimental and Theoretical Investigation of Solid-Electrolyte-Interphase Formation Mechanisms on Glassy Carbon. Journal of the Electrochemical Society, 159(11):A1775–A1785, 2012.
- [12] D. Li, D. Danilov, Z. Zhang, H. Chen, Y. Yang, and P. H. L. Notten. Modeling the SEI-Formation on Graphite Electrodes in LiFePO4 Batteries. Journal of the Electrochemical Society, 162(6):A858–A869, 2015.
- [13] Fabian Single, Birger Horstmann, and Arnulf Latz. Dynamics and morphology of solid electrolyte interphase (SEI). Physical Chemistry Chemical Physics, 18(27):17810–17814, 2016.
- [14] Fabian Single, Birger Horstmann, and Arnulf Latz. Revealing SEI Morphology: In-Depth Analysis of a Modeling Approach. Journal of The Electrochemical Society, 164(11):E3132–E3145, 2017.
- [15] Fabian Single, Arnulf Latz, and Birger Horstmann. Identifying the Mechanism of Continued Growth of the Solid–Electrolyte Interphase. ChemSusChem, 11(12):1950–1955, 2018.
- [16] Supratim Das, Peter M. Attia, Martin Z. Bazant, and William Cuehl. Electrochemical kinetics of sei growth on carbon black: Part II. Modeling. Journal of the Electrochemical Society, 166(4):E107–E118, 2019.
- [17] Lars von Kolzenberg, Arnulf Latz, and Birger Horstmann. Solid–Electrolyte Interphase During Battery Cycling: Theory of Growth Regimes. ChemSusChem, 13(15):3901–3910, 2020.
- [18] Rosamaría Fong, Ulrich von Sacken, and J. R. Dahn. Studies of Lithium Intercalation into Carbons Using Nonaqueous Electrochemical Cells. Journal of The Electrochemical Society, 137(7):2009–2013, 1990.
- [19] Petr Novák, Felix Joho, Roman Imhof, Jan-Christoph Panitz, and Otto Haas. In situ investigation of the interaction between graphite and electrolyte solutions. Journal of power sources, 81:212–216, 1999.
- [20] A Naji, J Ghanbaja, B Humbert, P Willmann, and D Billaud. Electroreduction of graphite in LiClO4-ethylene carbonate electrolyte. Characterization of the passivating layer by transmission electron microscopy and Fourier-transform infrared spectroscopy. Journal of power sources, 63(1):33–39, 1996.
- [21] Aiping Wang, Sanket Kadam, Hong Li, Siqi Shi, and Yue Qi. Review on modeling of the anode solid electrolyte interphase (SEI) for lithium-ion batteries. npj Computational Materials, 4(1):1–26, 2018.
- [22] E. Peled. The Electrochemical Behavior of Alkali and Alkaline Earth Metals in Nonaqueous Battery Systems—The Solid Electrolyte Interphase Model. Journal of The Electrochemical Society, 126(12):2047, 1979.
- [23] E Peled, D Golodnitsky, G Ardel, and V Eshkenazy. The Sei Model - Application to Lithium Polymer Electrolyte Batteries. Electrochimica Acta, 40(13-14):2197–2204, 1995.
- [24] E. Peled. Advanced Model for Solid Electrolyte Interphase Electrodes in Liquid and Polymer Electrolytes. Journal of The Electrochemical Society, 144(8):L208–L210, 1997.
- [25] D. Aurbach, B. Markovsky, M. D. Levi, E. Levi, A. Schechter, M. Moshkovich, and Y. Cohen. New insights into the interactions between electrode materials and electrolyte solutions for advanced nonaqueous batteries. Journal of Power Sources, 81-82:95–111, 1999.
- [26] Doron Aurbach. Review of selected electrode-solution interactions which determine the performance of Li and Li ion batteries. Journal of Power Sources, 89(2):206–218, 2000.
- [27] Martin Winter. The solid electrolyte interphase - The most important and the least understood solid electrolyte in rechargeable Li batteries. Zeitschrift fur Physikalische Chemie, 223(10-11):1395–1406, 2009.
- [28] Peng Lu, Chen Li, Eric W Schneider, and Stephen J Harris. Chemistry, impedance, and morphology evolution in solid electrolyte interphase films during formation in lithium ion batteries. The Journal of Physical Chemistry C, 118(2):896–903, 2014.
- [29] William Huang, Peter M. Attia, Hansen Wang, Sara E. Renfrew, Norman Jin, Supratim Das, Zewen Zhang, David T. Boyle, Yuzhang Li, Martin Z. Bazant, Bryan D. McCloskey, William C. Chueh, and Yi Cui. Evolution of the Solid-Electrolyte Interphase on Carbonaceous Anodes Visualized by Atomic-Resolution Cryogenic Electron Microscopy. Nano Letters, 19(8):5140–5148, 2019.
- [30] Birger Horstmann, Fabian Single, and Arnulf Latz. Review on multi-scale models of solid-electrolyte interphase formation. Current Opinion in Electrochemistry, 13:61–69, 2019.
- [31] Siqi Shi, Peng Lu, Zhongyi Liu, Yue Qi, Louis G. Hector, Hong Li, and Stephen J. Harris. Direct calculation of Li-ion transport in the solid electrolyte interphase. Journal of the American Chemical Society, 134(37):15476–15487, 2012.
- [32] Fernando A. Soto, Yuguang Ma, Julibeth M. Martinez De La Hoz, Jorge M. Seminario, and Perla B. Balbuena. Formation and Growth Mechanisms of Solid-Electrolyte Interphase Layers in Rechargeable Batteries. Chemistry of Materials, 27(23):7990–8000, 2015.
- [33] Peter Keil, Simon F. Schuster, Jörn Wilhelm, Julian Travi, Andreas Hauser, Ralph C. Karl, and Andreas Jossen. Calendar Aging of Lithium-Ion Batteries. Journal of The Electrochemical Society, 163(9):A1872–A1880, 2016.
- [34] Peter Keil and Andreas Jossen. Calendar Aging of NCA Lithium-Ion Batteries Investigated by Differential Voltage Analysis and Coulomb Tracking. Journal of The Electrochemical Society, 164(1):A6066–A6074, 2017.
- [35] Peter M. Attia, Supratim Das, Stephen J. Harris, Martin Z. Bazant, and William C. Chueh. Electrochemical kinetics of sei growth on Carbon Black: Part I. experiments. Journal of the Electrochemical Society, 166(4):E97–E106, 2019.
- [36] Jochen Stadler, Carsten Krupp, Madeleine Ecker, Jochen Bandlow, Bernd Spier, and Arnulf Latz. Investigation and modeling of cyclic aging using a design of experiment with automotive grade lithium-ion cells. Journal of Power Sources, 521:230952, 2022.
- [37] Ira Bloom, Jon Christophersen, and Kevin Gering. Differential voltage analyses of high-power lithium-ion cells. Journal of Power Sources, 139(1-2):304–313, 2005.
- [38] Matthieu Dubarry, Cyril Truchot, and Bor Yann Liaw. Synthesize battery degradation modes via a diagnostic and prognostic model. Journal of Power Sources, 219:204–216, 2012.
- [39] Meinert Lewerenz, Philipp Dechent, and Dirk Uwe Sauer. Investigation of capacity recovery during rest period at different states-of-charge after cycle life test for prismatic li(ni1/3mn1/3co1/3)o2-graphite cells. Journal of Energy Storage, 21:680–690, 2019.
- [40] Johannes Philipp Fath, Daniel Dragicevic, Laura Bittel, Adnan Nuhic, Johannes Sieg, Severin Hahn, Lennart Alsheimer, Bernd Spier, and Thomas Wetzel. Quantification of aging mechanisms and inhomogeneity in cycled lithium-ion cells by differential voltage analysis. Journal of Energy Storage, 25:100813, 2019.
- [41] Meinert Lewerenz and Dirk Uwe Sauer. Evaluation of cyclic aging tests of prismatic automotive linimncoo2-graphite cells considering influence of homogeneity and anode overhang. Journal of Energy Storage, 18:421–434, 2018.
- [42] Johannes Sieg, Mathias Storch, Johannes Fath, Adnan Nuhic, Jochen Bandlow, Bernd Spier, and Dirk Uwe Sauer. Local degradation and differential voltage analysis of aged lithium-ion pouch cells. Journal of Energy Storage, 30(1):101582, 2020.
- [43] Matthieu Dubarry, George Baure, Carlos Pastor-Fernández, Tung Fai Yu, W. Dhammika Widanage, and James Marco. Battery energy storage system modeling: A combined comprehensive approach. Journal of Energy Storage, 21:172–185, 2019.
- [44] Arnulf Latz and Jochen Zausch. Thermodynamic derivation of a Butler-Volmer model for intercalation in Li-ion batteries. Electrochimica Acta, 110:358–362, 2013.
- [45] Johannes Philipp Fath, Lennart Alsheimer, Mathias Storch, Jochen Stadler, Jochen Bandlow, Severin Hahn, Ralf Riedel, and Thomas Wetzel. The influence of the anode overhang effect on the capacity of lithium-ion cells – a 0d-modeling approach. Journal of Energy Storage, 29:101344, 2020.
- [46] Thomas F. Fuller, Marc Doyle, and John Newman. Simulation and Optimization of the Dual Lithium Ion Insertion Cell. Journal of The Electrochemical Society, 141(1):1–10, 1994.
- [47] Madeleine Ecker, Thi Kim Dung Tran, Philipp Dechent, Stefan Käbitz, Alexander Warnecke, and Dirk Uwe Sauer. Parameterization of a Physico-Chemical Model of a Lithium-Ion Battery. Journal of The Electrochemical Society, 162(9):A1836–A1848, 2015.
- [48] Johannes Schmalstieg, Christiane Rahe, Madeleine Ecker, and Dirk Uwe Sauer. Full Cell Parameterization of a High-Power Lithium-Ion Battery for a Physico-Chemical Model: Part I. Physical and Electrochemical Parameters. Journal of The Electrochemical Society, 165(16):A3799–A3810, 2018.
- [49] Benjamin Ng, Paul T. Coman, William E. Mustain, and Ralph E. White. Non-destructive parameter extraction for a reduced order lumped electrochemical-thermal model for simulating Li-ion full-cells. Journal of Power Sources, 445(October 2019), 2020.
- [50] Madeleine Ecker, Nerea Nieto, Stefan Käbitz, Johannes Schmalstieg, Holger Blanke, Alexander Warnecke, and Dirk Uwe Sauer. Calendar and cycle life study of li(nimnco)o2-based 18650 lithium-ion batteries. Journal of Power Sources, 248:839–851, 2014.
- [51] Joris de Hoog, Jean-Marc Timmermans, Daniel Ioan-Stroe, Maciej Swierczynski, Joris Jaguemont, Shovon Goutam, Noshin Omar, Joeri van Mierlo, and Peter van den Bossche. Combined cycling and calendar capacity fade modeling of a nickel-manganese-cobalt oxide cell with real-life profile validation. Applied Energy, 200:47–61, 2017.
- [52] E. Sarasketa-Zabala, I. Gandiaga, E. Martinez-Laserna, L. M. Rodriguez-Martinez, and I. Villarreal. Cycle ageing analysis of a lifepo4/graphite cell with dynamic model validations: Towards realistic lifetime predictions. Journal of Power Sources, 275:573–587, 2015.
- [53] Sabrina Kathrin Rechkemmer, Xiaoyun Zang, Weimin Zhang, and Oliver Sawodny. Calendar and cycle aging study of a commercial limn2o4 cell under consideration of influences by cell progress. Journal of Energy Storage, 30:101547, 2020.
- [54] Izaro Laresgoiti, Stefan Käbitz, Madeleine Ecker, and Dirk Uwe Sauer. Modeling mechanical degradation in lithium ion batteries during cycling: Solid electrolyte interphase fracture. Journal of Power Sources, 300:112–122, 2015.
- [55] Fabian Benavente-Araoz, Maria Varini, Anders Lundblad, Saúl Cabrera, and Göran Lindbergh. Effect of partial cycling of nca/graphite cylindrical cells in different soc intervals. Journal of The Electrochemical Society, 167(4):040529, 2020.
- [56] Giuseppe F. Castelli, Lars von Kolzenberg, Birger Horstmann, Arnulf Latz, and Willy Dörfler. Efficient Simulation of Chemical–Mechanical Coupling in Battery Active Particles. Energy Technology, 9(6), 2021.
- [57] Lars Gunther von Kolzenberg, Arnulf Latz, and Birger Horstmann. Chemo-mechanical model of sei growth on silicon electrode particles. Batteries & Supercaps, 2021.
- [58] L. J. Bolay, T. Schmitt, O. S. Mendoza-Hernandez, Y. Sone, A. Latz, and B. Horstmann. Degradation of lithium-ion batteries in aerospace. In 2019 European Space Power Conference (ESPC), pages 1–3, 2019.
- [59] Linda J. Bolay, Tobias Schmitt, Simon Hein, Omar S. Mendoza-Hernandez, Eiji Hosono, Daisuke Asakura, Koichi Kinoshita, Hirofumi Matsuda, Minoru Umeda, Yoshitsugu Sone, Arnulf Latz, and Birger Horstmann. Microstructure-resolved degradation simulation of lithium-ion batteries in space applications. Journal of Power Sources Advances, 14(February):100083, 2022.
- [60] M. Chouchane, O. Arcelus, and A. A. Franco. Heterogeneous Solid‐Electrolyte Interphase in Graphite Electrodes Assessed by 4D‐Resolved Computational Simulations. Batter. Supercaps, pages 1–8, 2021.
- [61] Mathias Storch, Johannes Philipp Fath, Johannes Sieg, Dragoljub Vrankovic, Carsten Krupp, Bernd Spier, and Ralf Riedel. Temperature and lithium concentration gradient caused inhomogeneous plating in large-format lithium-ion cells. Journal of Energy Storage, 41:102887, 2021.
- [62] Christian Kupper, Björn Weißhar, Sascha Rißmann, and Wolfgang G. Bessler. End-of-life prediction of a lithium-ion battery cell based on mechanistic aging models of the graphite electrode. Journal of the Electrochemical Society, 165(14):A3468–A3480, 2018.