Explain, Edit, and Understand: Rethinking User Study Design
for Evaluating Model Explanations
Abstract
In attempts to “explain” predictions of machine learning models, researchers have proposed hundreds of techniques for attributing predictions to features that are deemed important. While these attributions are often claimed to hold the potential to improve human “understanding” of the models, surprisingly little work explicitly evaluates progress towards this aspiration. In this paper, we conduct a crowdsourcing study, where participants interact with deception detection models that have been trained to distinguish between genuine and fake hotel reviews. They are challenged both to simulate the model on fresh reviews, and to edit reviews with the goal of lowering the probability of the originally predicted class. Successful manipulations would lead to an adversarial example. During the training (but not the test) phase, input spans are highlighted to communicate salience. Through our evaluation, we observe that for a linear bag-of-words model, participants with access to the feature coefficients during training are able to cause a larger reduction in model confidence in the testing phase when compared to the no-explanation control. For the BERT-based classifier, popular local explanations do not improve their ability to reduce the model confidence over the no-explanation case. Remarkably, when the explanation for the BERT model is given by the (global) attributions of a linear model trained to imitate the BERT model, people can effectively manipulate the model.11 1 The code used for our study is available at: https://github.com/siddhu001/Evaluating-Explanations.
Introduction
Owing to their remarkable predictive accuracy on supervised learning problems, deep learning models are increasingly deployed in consequential domains, such as medicine (Kim et al. 2019; Aggarwal et al. 2021), and criminal justice (Kleinberg et al. 2017). Frustrated by the difficulty of communicating what precisely these models have learned, a large body of research has sprung up proposing methods that are purported to explain their predictions (Doshi-Velez and Kim 2017; Lipton 2018; Guidotti et al. 2018). Typically, these so-called explanations take the form of saliency maps, attributing the prediction to a subset of the input features, or assigning weights to the features according to their salience. To date, while hundreds of such attribution techniques have been proposed (Ribeiro, Singh, and Guestrin 2016; Hendricks et al. 2016; Sundararajan, Taly, and Yan 2017; Smilkov et al. 2017), what precisely it means for a feature to be salient remains a point of conceptual ambiguity. Thus, many proposed techniques are evaluated only via visual inspection of a few examples where the highlighted features agree with the author’s (and reader’s) intuitions. Across papers, one common motivation for such attributions is to improve human “understanding” of the models (Ribeiro, Singh, and Guestrin 2016; Doshi-Velez and Kim 2017; Sundararajan, Taly, and Yan 2017). However, whether these attributions confer understanding is seldom evaluated explicitly and there is relatively little work that characterizes what explanations enable people to do.
One suggestion to evaluate model understanding is to use simulatability as a proxy for understanding—i.e., if a participant can accurately predict the output of the model on unseen examples (Doshi-Velez and Kim 2017). Following this idea, a few prior studies examine if explanations help humans predict model output (Chandrasekaran et al. 2018; Hase and Bansal 2020). Such studies are typically divided into a training and a test phase. In the training phase, participants see a few input, output, explanations triples, and in the test phase, they are asked to guess the model output for unseen examples.22 2 Chandrasekaran et al. 2018 present model explanations during the testing phase, whereas Hase and Bansal 2020 do not include explanations at test time, as explanations could “leak” model output (see Pruthi et al. 2020; Jacovi and Goldberg 2020.). Many prior studies on evaluating model explanations have reached negative results, noting that they do not definitively aid humans in predicting model behavior on visual question answering (Chandrasekaran et al. 2018) and text classification tasks (Hase and Bansal 2020).
In this paper, we rethink the user design for evaluating model explanations for text classification tasks, and propose two key changes. First, we provide participants with query access to the model: they can alter input documents to observe how model predictions and explanations change in real time. Second, we extend the simulation task by prompting participants to edit examples to reduce the model confidence towards the predicted class. While prior work (Kaushik, Hovy, and Lipton 2019) prompts humans to edit examples for data augmentation, editing exercises haven’t been explored for evaluating explanations. This editing exercise allows us to capture detailed metrics, e.g., average confidence reduced, which, as we shall later see, can be used to compare relative utility of different explanation techniques.
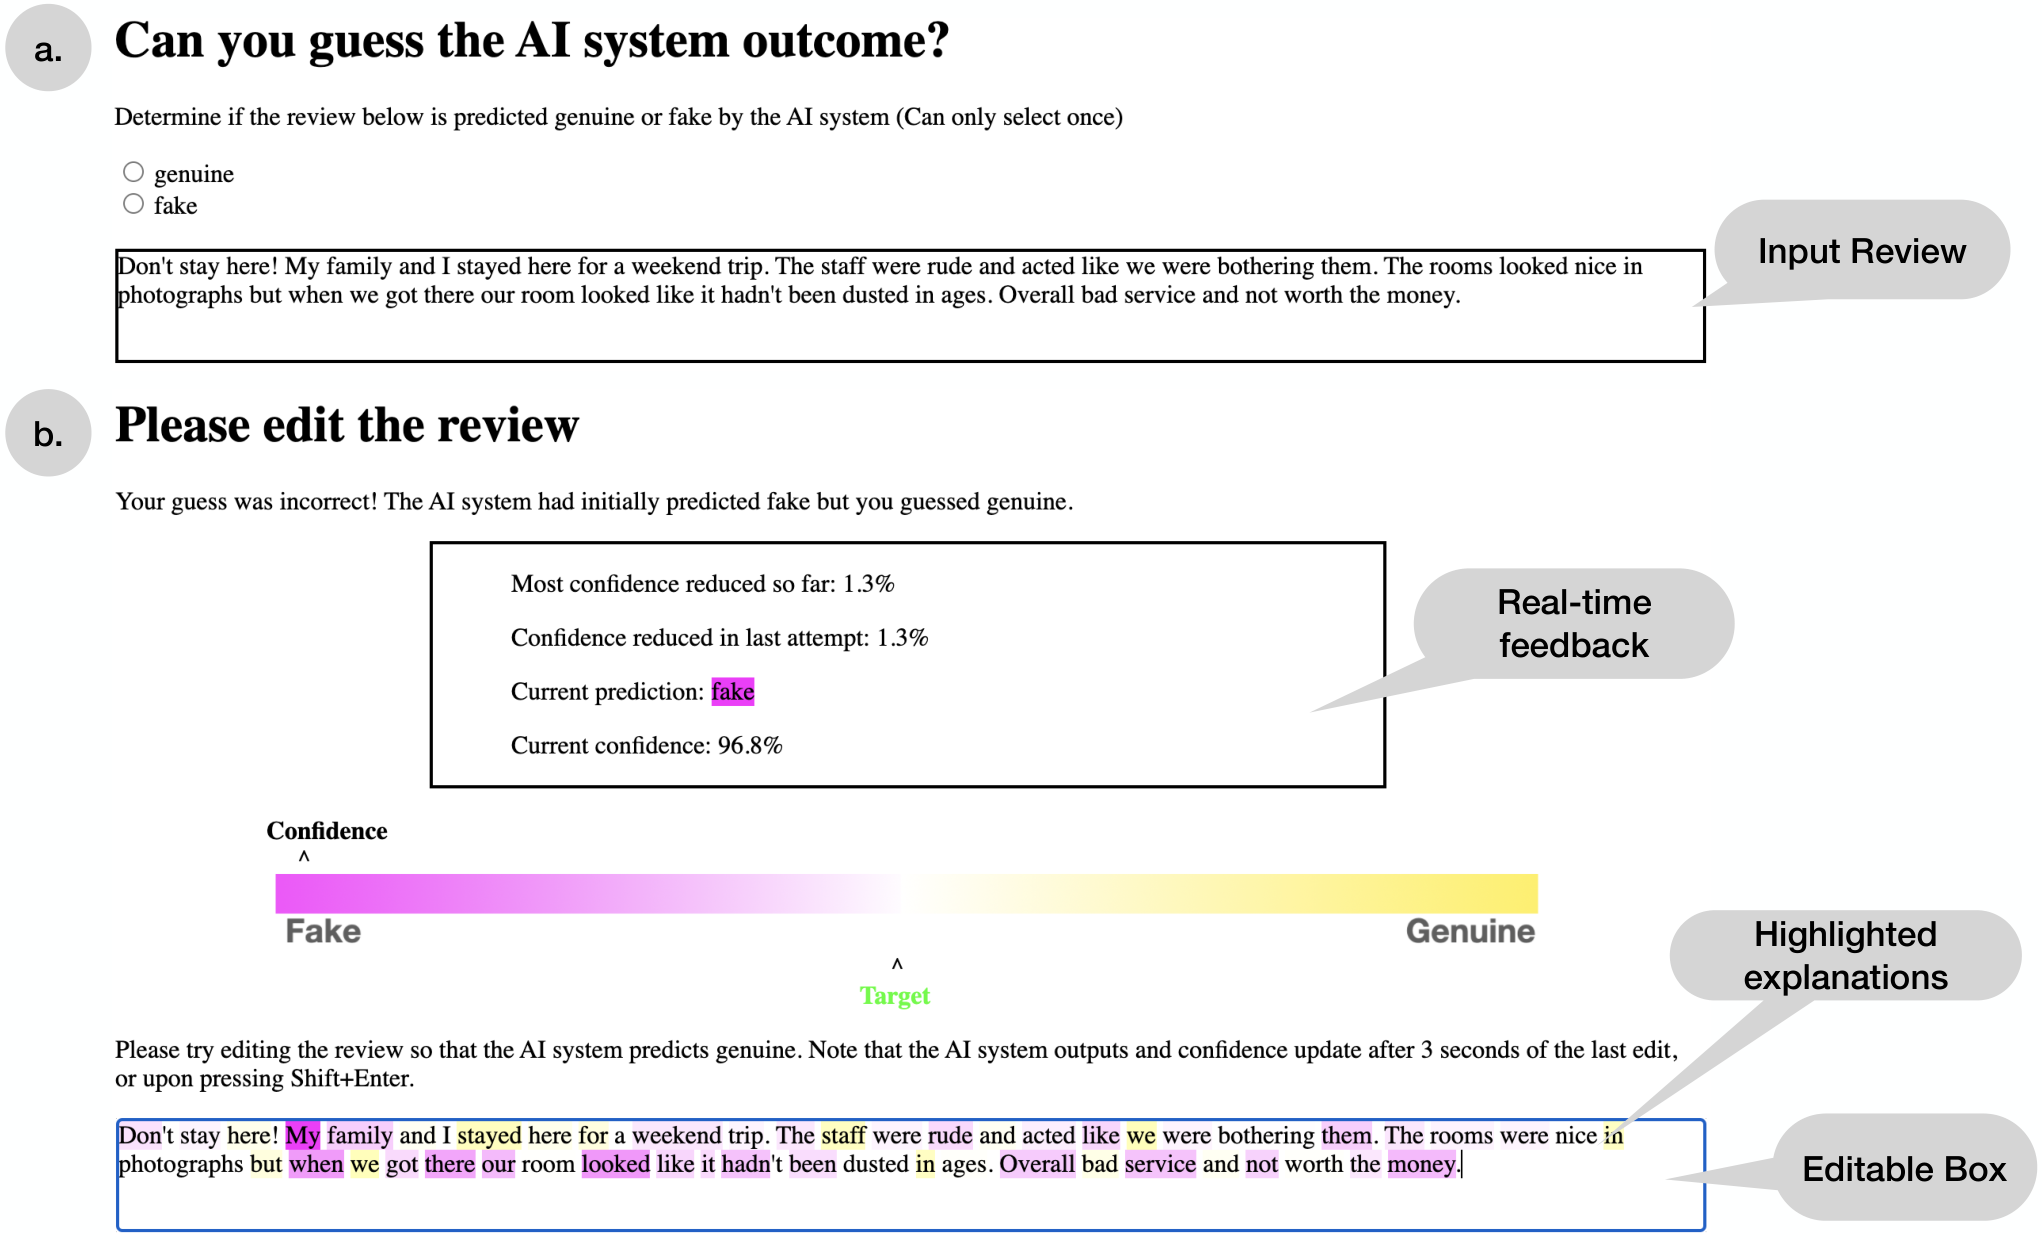
We perform a crowdsourcing study using the proposed paradigm on a deception detection task, with machine learning models that are trained to detect whether hotel reviews are genuine or fake (Ott et al. 2011). In this task, the human performance is only slightly better than that of random guessing, while machine learning models are significantly more accurate, making it an interesting testbed for studying whether attributions help people to understand the associations employed by the models. In our study, the participant first guesses whether the given hotel review is classified as fake or genuine (see Figure 1). We then prompt the participant to edit the review such that the model confidence towards the predicted class is reduced. During the training phase, we present attributions by highlighting input spans. For instance, the attribution in Figure 1 suggests that the model associates tokens “My” and “family” with the fake class, perhaps indicating that fake reviews tend to mention external factors instead of details about the hotel. In our setup, a participant could test any such hypotheses, by editing the example and observing the updated predictions, outputs, and attributions immediately.
Through our study, we seek to answer the question: Which (if any) attribution techniques improve humans’ ability to guess the model output, or edit the input examples to lower the model confidence? From the evaluation methodology standpoint, we assess if the interactive environment with query access to the models makes it possible to distinguish the relative value of different attributions. For these research questions, we compare popular attribution techniques—LIME (Ribeiro, Singh, and Guestrin 2016) and integrated gradients (Sundararajan, Taly, and Yan 2017), against a no-explanation control.
Our evaluation reveals that (i) for both a linear bag-of-words model and a BERT-based classifier, none of the explanation methods definitively help participants to simulate the model’s output more accurately at test time (when explanations are unavailable); (ii) however, access to feature coefficients from a linear model during training enables participants to cause a larger reduction in the model confidence at test time; and (iii) most remarkably, feature coefficients and global cue words33 3 Words that correspond to the largest feature coefficients. from a linear (student) model trained to mimic a (teacher) BERT model significantly help participants to manipulate BERT. Additionally, we notice that participants respond to the highlighted spans, as over of all the edits are performed on these spans. Our comparisons lead to quantitative differences among evaluated attributions, underscoring the efficacy of our paradigm.
Related Work
We briefly discuss past attempts to evaluate explanation methods, both via user studies and automated metrics.
Simulatability-based Evaluation.
Model simulatability measures human ability to predict the model output on fresh examples. It is a prominent metric to evaluate explanation methods, and is treated as a proxy for model understanding (Doshi-Velez and Kim 2017). Using simulatability, a recent study evaluates five different explanation generation schemes for text and tabular classification tasks (Hase and Bansal 2020). Their study runs two different types of tests: (i) forward simulation which measures simulatability on unseen examples without explanations, after presenting participants training examples with explanations; and (ii) counterfactual simulation which captures participants’ ability to guess the model output of perturbed input examples while observing the true labels, predictions, and explanation for the original examples. The study concludes that for the text classification task, none of the five evaluated explanations definitively help participants better simulate the model in the forward simulation task (when explanations were provided only at training time). The participants in their study report found it difficult to retain the insights learned from the training phase during the testing phase. Another study examines the extent to which explanations from a VQA model help humans predict its responses and failures (Chandrasekaran et al. 2018). In their setup, visual saliency maps were provided both during the training and the testing phase. This study too leads to a similar conclusion: visual attributions do not help in simulating the VQA model. Another recent study measures simulatability of several regression models that estimate the value of real-estate listings (Poursabzi-Sangdeh et al. 2021). They observe that participants could simulate a linear model with features but fail to simulate one with features. They also note that participants could not correct model mistakes for any of the given models. Another paper investigates if humans could predict model output using explanations alone, and found erasure and attention-based explanations to be useful (Treviso and Martins 2020a).
Our work differs with the above studies in a number of ways: none of the prior studies allow participants to test out models for inputs of their choice (query access). Additionally, we ask participants to edit examples with a goal to reduce the model confidence, in an attempt to identify adversarial examples. This exercise allows us to capture detailed metrics, including the average amount of confidence reduced and number of examples successfully flipped. Furthermore, we interleave the training and test phase thereby mitigating retention issues reported in (Hase and Bansal 2020).
Other User Studies.
There have been several crowdsourcing studies that evaluate different aspects of explanations (Binns et al. 2018; Cai et al. 2019; Green and Chen 2019a; Green and Chen 2019b; Yin, Vaughan, and Wallach 2019; Kunkel et al. 2019). Mohseni, Zarei, and Ragan 2021 categorize these efforts based on the goals they aim to achieve, the intended audience, and the evaluation metrics. Few studies measure if explanations enable participants to better predict the task output (i.e., the ground truth) instead of the model output—specifically, if explanations help participants gain sufficient insights to distinguish genuine reviews from fake reviews (Lai and Tan 2019; Lai, Liu, and Tan 2020). Lertvittayakumjorn and Toni 2019 evaluate if explanations help in identifying the better performing model. Lastly, a recent study examines saliency maps for an age-prediction model, and concludes that none of the explanations impact human’s trust in the model (Chu, Roy, and Andreas 2020).
Automated Metrics.
A variety of automated metrics to measure explanation quality have been proposed in the past. However, many of them can be easily gamed (Hooker et al. 2019; Treviso and Martins 2020b; Hase et al. 2020a) (see (Pruthi et al. 2020) for a detailed discussion on this point). A popular way to evaluate explanations is to compare the produced explanations with expert-collected rationales (Mullenbach et al. 2018; DeYoung et al. 2020). Such metrics only capture whether the produced explanations are plausible, but do not comment upon the faithfulness of explanations to the process through which predictions are obtained. A recently proposed approach quantifies the value of explanations via the accuracy gains that they confer on a student model trained to simulate a teacher model (Pruthi et al. 2020). Designing automated evaluation metrics is an ongoing area of research, and to the best of our knowledge, none of the automated metrics have been demonstrated to correlate with any human measure of explanation quality.
Evaluation through Iterative Editing
This section first describes our evaluation paradigm and discusses how it is different from prior efforts. We then introduce several metrics for evaluating model explanations.
Experimental Procedure
We divide our evaluation into two alternating phases: a training phase and a test phase. During the training phase, participants first read the input example, and are challenged to guess the model prediction. Once they submit their guess, they see the model output, model confidence and an explanation (explanation type varies across treatment groups). As noted earlier, several prior studies solely evaluate model simulatability (Hase and Bansal 2020; Chandrasekaran et al. 2018; Treviso and Martins 2020a; Poursabzi-Sangdeh et al. 2021). We extend the past protocols and further prompt participants to edit the input text with a goal to lower the confidence of the model prediction. As participants edit the input, they see the updated predictions, confidence and explanations in real time (see Figure 1). Therefore, they can validate any hypothesis about the input-output associations (captured by the model), by simply editing the text based on their hypothesis and observing if the model prediction changes accordingly. The editing task concludes if the participants are able to flip the model prediction, or run out of the allocated time (of three minutes). The instructions for the study prohibit participants to edit examples in a manner that changes the meaning of the text (more details in the next section).
The test phase is similar to the training phase except for an important distinction: explanations are not available during testing so that we can evaluate the insights participants have acquired without the support of explanations. Holding back the explanations at test time eliminates concerns that the explanations might trivially leak the output (see Pruthi et al. 2020 for a detailed discussions). In our study, after every two examples in the training stage, participants complete one test example. In contrast to past studies, where participants first review all the training examples before attempting the test examples, we show participants one test example after every two training examples. In the Hase and Bansal 2020 study, participants report that it was difficult to retain insights from the training phase during the later test round. Our interleaving procedure alleviates such concerns.
Metrics
While simulatability has been used as a proxy measure for model understanding (Hase and Bansal 2020; Chandrasekaran et al. 2018), we argue that simulating the model is a difficult task for people, especially after viewing only a few examples. Hence, we propose to compute detailed metrics that are based on participants’ ability to edit the example to lower the model confidence towards predicted class and to possibly flip model predictions. We believe that such metrics are finer-grained indicators for participant’s understanding of the model, since participants might not comprehend how different factors combine to produce the output, but they may identify a few input-output associations, which they can effectively apply in the manipulation exercise.
Based on this motivation, we measure three metrics (a) the simulation accuracy, (b) average reduction in model confidence, and (c) percentage of examples flipped. Following prior work (Chu, Roy, and Andreas 2020), we use mixed effects regression models to estimate these three quantities. For each experiment, a participant is randomly placed in one of the cohorts. All participants in the same cohort see the same training and test examples, irrespective of the experiment. Further, across different cohorts, test examples differ (but we use a fixed set of examples for training). We use multiple cohorts so as to not rely on a few test examples for our conclusions. The mixed effects models include fixed effect term for each treatment and a random effect intercept to determine the impact of the cohort to which a participant is assigned. Since mixture effect models can effectively handle random variability introduced due to different data samples and different participant cohorts, it is an appropriate choice to isolate the impact of each explanation type. The three mixed effects models can be described as
where the target corresponds to three evaluation metrics discussed above and is the intercept.
A Case Study of Deception Detection
We choose a deception detection task—distinguishing between fake and real hotel reviews (Ott et al. 2011)—as the backdrop for our crowdsourcing study. This is because prior studies have noted that humans struggle with this task while machine learning models are significantly more accurate. Our motivation for using this setup is that models exploit subtle, unknown and possibly counter-intuitive associations to drive prediction, providing an interesting testbed to evaluate whether attributions communicate such associations. Further, since human accuracy is low for this task, the participants do not have preconceived notions that could potentially conflate with the simulation task. Therefore, this task makes an interesting testbed to characterize how much explanations help humans in understanding the input-output associations that deception detection models exploit. The study comprises training, and testing examples in total, and lasts for minutes per participant.
| Model | Accuracy |
|---|---|
| Human Accuracy (Ott et al. 2011) | 60% |
| Logistic Regression | 87.8% |
| BERT | 89.8% |
| Model | Treatments |
|
Phase |
|
| ||||||
|---|---|---|---|---|---|---|---|---|---|---|---|
| Train | 8.2 [5.4, 11.6] | 8.0 [7.0, 9.0] | |||||||||
| Control | 53.1 [50.0, 57.0] | Test | 15.0 [10.8, 19.4] | 5.9 [4.3, 7.8] | |||||||
| Train | 36.7 [24.8, 49.3] | 21.3 [19.5, 23.1] | |||||||||
| Logistic Regression | Feature coefficients | 54.5 [51.0, 58.0] | Test | 16.0 [10.8, 21.6] | 8.9 [7.2, 10.6] | ||||||
| Train | 15.0 [11.6, 18.8] | 10.7 [8.6, 12.8] | |||||||||
| Control | 57.1 [54.0, 61.0] | Test | 12.4 [7.6, 18.1] | 9.2 [6.6, 11.9] | |||||||
| Train | 14.4 [10.5, 19.5] | 10.2 [8.2, 12.3] | |||||||||
| LIME | 56.4 [53.0, 60.0] | Test | 7.7 [4.4, 11.3] | 6.1 [4.1, 8.2] | |||||||
| Train | 23.6 [19.4, 28.0] | 16.5 [14.0, 19.2] | |||||||||
| Integrated gradients | 56.6 [54.0, 60.0] | Test | 13.6 [8.2, 19.3] | 10.4 [7.7, 13.3] | |||||||
| Train | 32.2 [27.1, 37.3] | 22.6 [19.7, 25.6] | |||||||||
| Feature coefficients (from a linear student) | 60.5 [57.0, 64.0] | Test | 21.3 [15.7, 27.4] | 14.9 [11.6, 18.4] | |||||||
| Train | 40.6 [32.0, 49.6] | 29.9 [26.8, 33.0] | |||||||||
| BERT | global cues (from a linear student) | 55.7 [51.0, 60.0] | Test | 31.6 [23.2, 40.8] | 23.6 [19.7, 27.6] |
What are permissible edits?
We ask participants not to alter the staying experience conveyed through the hotel review. If the review is positive, negative or mixed, then the edited version should maintain that stance. They are allowed to paraphrase and can remove or change information not relevant to the experience about the hotel. For instance, changing ‘‘My husband and I’’ to ‘‘We’’ is valid edit. However, inventing details that influence the experience about the hotel are not permitted (e.g., adding ‘‘The staff was unfriendly’’ is not allowed). To enforce these guidelines, we (1) discard submissions where the edit distances between the original and edited version is large44 4 We remove submissions where the word edit distance of the length of input review, or if half of original words are deleted. and then (2) manually inspect the edits to reject submissions that violate our instructions.
Machine Learning Models
We consider two machine learning models for our experiments. The first is a linear logistic regression model with unigram TF-IDF features. The second model is a BERT-based classification model (Devlin et al. 2019). We train, or finetune, these models using the deception review dataset (Ott et al. 2011). We use the original train/validation/test splits, which are class balanced (i.e., exactly half of the reviews are genuine). For the logistic regression model, we select hyperparameters, i.e. regularization strength and regularization penalty, via a -fold cross-validation, whereas we use the default parameters of the BERT model. The accuracy of the two models is significantly higher than the estimated human performance on this task, which is around (Table 1). We refer readers to (Ott et al. 2011) for details on the dataset and estimating human performance for this task.
Controls & Treatments
Participants are randomly placed into different control and treatment groups which vary based on the type of explanations offered and the choice of the machine learning model. For both the linear logistic regression model and the BERT model, we run a control study without explanations. For the linear model, we use feature coefficients of unigram features as explanations in the treatment group. For the BERT model, we use the following explanation-based treatments.
Local Explanations.
Local explanation refer to techniques that produce explanations by observing how the model’s predictions change upon perturbing the input slightly For the BERT classifier, we experiment with two widely-used local explanations: LIME (Ribeiro, Singh, and Guestrin 2016) and integrated gradients (Sundararajan, Taly, and Yan 2017). LIME produces an explanation using the feature coefficients of a linear interpretable model that is trained to approximate the original model in the local neighborhood of the input example. Integrated gradients are computed by integrating gradients of the log-likelihood of the predicted label along the line joining a starting reference point and the given input example. These explanations are presented to participants through highlights (see Figure 1).
| Model | Treatments |
|
Phase |
|
| ||||||
|---|---|---|---|---|---|---|---|---|---|---|---|
| Train | 29.3 [16.5, 42.1] | 13.8 [7.6, 19.9] | |||||||||
| Logistic Regression | 2.3 [-2.1, 6.7] | Test | 2.6 [-3.2, 8.4] | 2.9 [-0.2, 6.0] * | |||||||
| Train | -0.5 [-8.6, 7.6] | -0.3 [-6.4, 5.7] | |||||||||
| -0.0 [-5.5, 5.4] | Test | -4.4 [-12.5, 3.7] | -2.9 [-8.6, 2.8] | ||||||||
| Train | 8.8 [0.6, 16.9] | 6.7 [0.7, 12.6] | |||||||||
| -1.2 [-9.9, 3.1] | Test | 1.2 [-6.7, 9.1] | 1.0 [-4.6, 6.6] | ||||||||
| Train | 17.1 [8.8, 25.4] | 11.7 [5.7, 17.7] | |||||||||
| (from a linear student) | 3.4 [-2.0, 8.8] | Test | 7.3 [-0.8, 15.4]* | 5.0 [-0.7, 10.7]* | |||||||
| Train | 25.6 [17.5, 33.7] | 19.1 [13.3, 25.0] | |||||||||
| BERT | (from a linear student) | -1.7 [-6.9, 3.6] | Test | 18.7 [10.8, 26.6] | 14.3 [8.7, 19.9] | ||||||
Global Explanations.
Besides local explanations, we experiment with global explanations that indicate common input-output associations that the models exploit. To obtain global explanations for the BERT model, we take inspiration from prior work on knowledge distillation (Liu, Wang, and Matwin 2018) to first train a linear student model using BERT predictions on unseen hotel reviews. Since the original dataset from Ott et al. 2011 contains only reviews, we mine additional K hotel reviews from TripAdvisor.55 5 To download additional reviews we follow a protocol similar to the data collection process used for the original dataset. Note that we only require the BERT predictions for these reviews, rather than the ground truth labels. The student model achieves a simulation accuracy of 88.2% on the downloaded set of reviews. We then use the trained student model to identify the words with the highest feature weights associated with both the classes. We present the top- words for each class to participants during the training phase. Alongside these global cue words, we also highlight words in the input as per their feature coefficients of the student model. In a separate ablation study, we isolate the effect of these global cue words by removing them and only highlighting input tokens using the feature coefficients from the student.
Participant Details
We recruit study participants using Amazon Mechanical Turk platform. We use a lightweight recruitment study that consists of examples (without explanations) to select participants. We ask participants to guess the model prediction and edit the example to reduce the model confidence. Participants who guess the model prediction within seconds (which we believe is insufficient to read the review) are filtered out. We also remove participants who skip the editing exercise altogether, or whose edits are ungrammatical or alter the staying experience expressed in the review. For all our studies, we include workers who are residents in the United States, and have completed over HITs in the past and with atleast 99% approval rate. Workers selected from the recruitment test are encouraged to participate in the main study. For the main study, we pay the workers $20 and award a bonus of cents for each correct guess and 20 cents for every successful prediction flip. On an average, workers make 7.5 edits per review, and thus effectively see model predictions for 225 unique inputs. In total, we had participants in our main study, with in each of the treatment and control groups (except for one group, where participants were disqualified later for violating our instructions). The total cost to conduct our study is about 4000 USD.
Results & Analysis
Do explanations help humans simulate models?
First, we investigate if the query access to the model’s predictions and explanations during the training phase enables participants to understand the models sufficiently to simulate its output on unseen test examples. We do not find evidence of improved simulatability in Tables 2 and 3, where the simulation accuracy of participants—which is slightly better than random guessing—do not improve with access to explanations. While prior studies (Hase and Bansal 2020; Chandrasekaran et al. 2018) note similar findings, in our opinion, this is a stronger negative result for two reasons: first, in our study, participants can alter examples and observe model predictions and their explanations during the training phase. This exercise allows participants more access to predictions and explanations compared to prior studies. Second, even for linear models, which are thought to be inherently “interpretable,” explanations do not improve simulation accuracy. The explanations of linear bag-of-words model have not been examined for simulatability in the past.
Do explanations help humans perform edits that reduce the model confidence?
Next, we examine if participants gain sufficient understanding during the training phase to perform edits that cause the models to lower the confidence towards the originally predicted class. Here, we find that logistic regression coefficient weights help participants reduce the confidence of the logistic regression model: the average confidence reduced during the test phase, when they had access to explanations in training, is 3.0 points higher than the no-explanation control. This difference is statistically significant with a p-value . The benefits of such explanations during the training phase are large (over 13 points), which is unsurprising as the faithful explanations shown during the training phase can guide participants to effectively edit the document to lower model confidence. During the training phase, they are able to statistically significantly flip more predictions, however, this ability does not transfer to the test phase.
For the BERT model, neither LIME nor integrated gradients help participants flip more predictions at the test phase. Integrated gradients-based explanations are effective only during the training phase. In contrast, the feature coefficients, from a linear student model help participants reduce the model confidence of the BERT model—both at train and test time, demonstrating how associations from a simple student model can lead to actionable insights about the original BERT model. Including global cue words alongside feature coefficients markedly improves participant’s ability to manipulate the BERT model. This fact that among all the inspected methods, attributions from a linear student model are the most effective emphasizes the need to explicitly evaluate explanations with their intended users, instead of relying on the qualitative inspection of a few examples.
Another noteworthy result here is that we are able to quantitatively differentiate the effectiveness of different explanations using the “percentage of examples flipped” and “average confidence reduced” metrics from the editing exercise proposed in this paper. This contrasts with the the previously used simulatability metric, therefore, we recommend future studies on evaluation of interpretability techniques to consider (similar) editing tasks and metrics instead.
| First Edits | All Edits | ||||||
| Model | Treatments | Deletion | Substitution | Deletion | Substitution | ||
|
Feature coefficients | 48.5 [42.5, 54.6] | 43.0 [38.3, 47.9] | 40.4 [37.0, 43.8] | 41.8 [39.2, 44.6] | ||
| LIME | 56.8 [49.8, 63.7] | 67.2 [62.8, 71.5] | 39.2 [35.2, 43.2] | 49.2 [46.1, 52.2] | |||
| BERT | Integrated gradients | 48.1 [42.0, 54.3] | 50.8 [46.2, 55.4] | 32.4 [29.2, 35.6] | 45.9 [43.2, 48.6] | ||
|
42.5 [36.6, 48.5] | 47.1 [42.3, 52.0] | 33.9 [30.5, 37.3] | 42.4 [40.0, 44.8] | |||

Do participants edit tokens highlighted as explanations? Are their edits effective?
One other benefit of our framework is that, in contrast to previous studies, it allows us to directly monitor whether participants are paying attention to the explanations, specifically by measuring how they respond to highlighted words. To do so, we record the fraction of times edits are performed on a word that is among the top-% of highlighted words in a given input text. If there is no preference towards highlighted words, this value would be close to %. From Table 4, we see that the participants edit the highlighted words significantly more often, both with respect to first edits and all edits. For instance, across all explanations, for about 45-55% of examples, the first deleted or substituted word is a word among the top-% of highlighted words.
We further analyze if the edits on the top-% highlighted words are effective in reducing model confidence. In Figure 2, we plot the fraction of edits on highlighted words and their contribution in reducing model confidence. We compute their contribution by aggregating the fractional reduction in model confidence caused due to that edit. We inspect if these edits are more effective than those performed on the remaining words. We find that the edits on highlighted words are more effective, however, their effectiveness varies with different explanation types. Edits on words highlighted using integrated gradients and feature coefficients of the student model have larger contribution towards reducing model confidence than edits on the words highlighted via LIME. This result corroborates our previous findings suggesting that integrated gradients and feature coefficients from a student model are statistically significantly more helpful in reducing model confidence during the training phase
Do people use global cues?
For the treatment group wherein we present participants feature coefficients and global cue words from a linear student model as explanations for the BERT classifier, we determine the extent to which participants use the global cues. We report that around one in five edits utilizes global cues both during the training and the testing phase. The fraction of insertions that contain global cue words are 17.1% and 18.2% for training and testing respectively. Further, the percentage of deletions that contain these cue words are 21.2% in training and 17.3% in the testing phase. These results reveal that participants indeed incorporate global cue words while editing, and as shown in Tables 2 and 3, the edits performed when these cues are present are effective in lowering the model confidence and flipping predictions.
Conclusion
A common argument for providing explanations is that they (ought to) improve human’s understanding about a model; however, many prior studies note that they do not improve their ability to simulate the model (which is primarily used as a proxy for model understanding). In this work, we extend the prior evaluation paradigm by instead asking participants to edit the input examples with an objective to reduce model confidence towards the predicted class. This exercise allows us to compute detailed metrics, namely, the average confidence reduced and the percentage of examples flipped. We evaluate several explanation techniques for both a linear model and BERT-based classifier. Similar to past findings, we first note that for both these models, none of the considered explanations improve model simulatability. We also find that participants with access to feature coefficients during training can force a larger drop in the model confidence during testing, when attributions are unavailable. Interestingly, for BERT-based classifier, global cue words and feature coefficients, obtained using a linear student model trained to mimic its predictions, prove to be effective. These results reveal that associations from a linear student model could provide insights for a BERT-based model, and importantly, the editing paradigm could be used to differentiate the relative utility of explanations. We recommend future studies on evaluating interpretations to consider similar metrics.
Acknowledgements
We thank Michael Collins, Mansi Gupta, Bhuwan Dhingra and Nitish Kulkarni for their feedback. In addition, we acknowledge Khyathi Chandu, Aakanksha Naik, Alissa Ostapenko, Vijay Viswanathan, Manasi Arora and Rishabh Joshi for painstakingly testing the user interface of our study.
References
- Aggarwal et al. (2021) Aggarwal, R.; Sounderajah, V.; Martin, G.; Ting, A., Daniel S. W.and Karthikesalingam; King, D.; Ashrafian, H.; and Darzi, A. 2021. Diagnostic accuracy of deep learning in medical imaging: a systematic review and meta-analysis.
- Binns et al. (2018) Binns, R.; Kleek, M. V.; Veale, M.; Lyngs, U.; Zhao, J.; and Shadbolt, N. 2018. ’It’s Reducing a Human Being to a Percentage’: Perceptions of Justice in Algorithmic Decisions. In Mandryk, R. L.; Hancock, M.; Perry, M.; and Cox, A. L., eds., Proceedings of the 2018 CHI Conference on Human Factors in Computing Systems, CHI 2018, Montreal, QC, Canada, April 21-26, 2018, 377. ACM.
- Cai et al. (2019) Cai, C. J.; Reif, E.; Hegde, N.; Hipp, J. D.; Kim, B.; Smilkov, D.; Wattenberg, M.; Viégas, F. B.; Corrado, G. S.; Stumpe, M. C.; and Terry, M. 2019. Human-Centered Tools for Coping with Imperfect Algorithms During Medical Decision-Making. In Brewster, S. A.; Fitzpatrick, G.; Cox, A. L.; and Kostakos, V., eds., Proceedings of the 2019 CHI Conference on Human Factors in Computing Systems, CHI 2019, Glasgow, Scotland, UK, May 04-09, 2019, 4. ACM.
- Chandrasekaran et al. (2018) Chandrasekaran, A.; Prabhu, V.; Yadav, D.; Chattopadhyay, P.; and Parikh, D. 2018. Do explanations make VQA models more predictable to a human? arXiv preprint arXiv:1810.12366.
- Chang et al. (2020) Chang, S.; Zhang, Y.; Yu, M.; and Jaakkola, T. S. 2020. Invariant rationalization. arXiv preprint arXiv:2003.09772.
- Chu, Roy, and Andreas (2020) Chu, E.; Roy, D.; and Andreas, J. 2020. Are visual explanations useful? a case study in model-in-the-loop prediction. arXiv preprint arXiv:2007.12248.
- Devlin et al. (2019) Devlin, J.; Chang, M.-W.; Lee, K.; and Toutanova, K. 2019. BERT: Pre-training of Deep Bidirectional Transformers for Language Understanding. In Proceedings of the 2019 Conference of the North American Chapter of the Association for Computational Linguistics: Human Language Technologies, Volume 1 (Long and Short Papers), 4171–4186. Minneapolis, Minnesota: Association for Computational Linguistics.
- DeYoung et al. (2020) DeYoung, J.; Jain, S.; Rajani, N. F.; Lehman, E.; Xiong, C.; Socher, R.; and Wallace, B. C. 2020. ERASER: A Benchmark to Evaluate Rationalized NLP Models. In Jurafsky, D.; Chai, J.; Schluter, N.; and Tetreault, J. R., eds., Proceedings of the 58th Annual Meeting of the Association for Computational Linguistics, ACL 2020, Online, July 5-10, 2020, 4443–4458. Association for Computational Linguistics.
- Doshi-Velez and Kim (2017) Doshi-Velez, F.; and Kim, B. 2017. Towards a rigorous science of interpretable machine learning. arXiv preprint arXiv:1702.08608.
- Green and Chen (2019a) Green, B.; and Chen, Y. 2019a. Disparate Interactions: An Algorithm-in-the-Loop Analysis of Fairness in Risk Assessments. In danah boyd; and Morgenstern, J. H., eds., Proceedings of the Conference on Fairness, Accountability, and Transparency, FAT* 2019, Atlanta, GA, USA, January 29-31, 2019, 90–99. ACM.
- Green and Chen (2019b) Green, B.; and Chen, Y. 2019b. The Principles and Limits of Algorithm-in-the-Loop Decision Making. Proc. ACM Hum. Comput. Interact., 3(CSCW): 50:1–50:24.
- Guidotti et al. (2018) Guidotti, R.; Monreale, A.; Ruggieri, S.; Turini, F.; Giannotti, F.; and Pedreschi, D. 2018. A survey of methods for explaining black box models. ACM computing surveys (CSUR), 51(5): 1–42.
- Hase and Bansal (2020) Hase, P.; and Bansal, M. 2020. Evaluating Explainable AI: Which Algorithmic Explanations Help Users Predict Model Behavior? In Proceedings of the 58th Annual Meeting of the Association for Computational Linguistics, 5540–5552. Online: Association for Computational Linguistics.
- Hase et al. (2020a) Hase, P.; Zhang, S.; Xie, H.; and Bansal, M. 2020a. Leakage-Adjusted Simulatability: Can Models Generate Non-Trivial Explanations of Their Behavior in Natural Language? In Cohn, T.; He, Y.; and Liu, Y., eds., Findings of the Association for Computational Linguistics: EMNLP 2020, Online Event, 16-20 November 2020, volume EMNLP 2020 of Findings of ACL, 4351–4367. Association for Computational Linguistics.
- Hase et al. (2020b) Hase, P.; Zhang, S.; Xie, H.; and Bansal, M. 2020b. Leakage-Adjusted Simulatability: Can Models Generate Non-Trivial Explanations of Their Behavior in Natural Language? Findings of EMNLP.
- Hendricks et al. (2016) Hendricks, L. A.; Akata, Z.; Rohrbach, M.; Donahue, J.; Schiele, B.; and Darrell, T. 2016. Generating Visual Explanations. In Leibe, B.; Matas, J.; Sebe, N.; and Welling, M., eds., Computer Vision - ECCV 2016 - 14th European Conference, Amsterdam, The Netherlands, October 11-14, 2016, Proceedings, Part IV, volume 9908 of Lecture Notes in Computer Science, 3–19. Springer.
- Hooker et al. (2019) Hooker, S.; Erhan, D.; Kindermans, P.; and Kim, B. 2019. A Benchmark for Interpretability Methods in Deep Neural Networks. In Wallach, H. M.; Larochelle, H.; Beygelzimer, A.; d’Alché-Buc, F.; Fox, E. B.; and Garnett, R., eds., Advances in Neural Information Processing Systems 32: Annual Conference on Neural Information Processing Systems 2019, NeurIPS 2019, December 8-14, 2019, Vancouver, BC, Canada, 9734–9745.
- Jacovi and Goldberg (2020) Jacovi, A.; and Goldberg, Y. 2020. Aligning Faithful Interpretations with their Social Attribution. arXiv preprint arXiv:2006.01067.
- Kaushik, Hovy, and Lipton (2019) Kaushik, D.; Hovy, E.; and Lipton, Z. C. 2019. Learning the Difference that Makes a Difference with Counterfactually-Augmented Data. International Conference on Learning Representations (ICLR).
- Kim et al. (2019) Kim, M.; Yun, J.; Cho, Y.; Shin, K.; Jang, R.; Bae, H. J.; and Kim, N. 2019. Deep Learning in Medical Imaging.
- Kleinberg et al. (2017) Kleinberg, J.; Lakkaraju, H.; Leskovec, J.; Ludwig, J.; and Mullainathan, S. 2017. Human decisions and machine predictions.
- Kunkel et al. (2019) Kunkel, J.; Donkers, T.; Michael, L.; Barbu, C.; and Ziegler, J. 2019. Let Me Explain: Impact of Personal and Impersonal Explanations on Trust in Recommender Systems. In Brewster, S. A.; Fitzpatrick, G.; Cox, A. L.; and Kostakos, V., eds., Proceedings of the 2019 CHI Conference on Human Factors in Computing Systems, CHI 2019, Glasgow, Scotland, UK, May 04-09, 2019, 487. ACM.
- Lai, Liu, and Tan (2020) Lai, V.; Liu, H.; and Tan, C. 2020. “Why is ‘Chicago’ deceptive?” Towards Building Model-Driven Tutorials for Humans. In Proceedings of CHI 2020. ACM.
- Lai and Tan (2019) Lai, V.; and Tan, C. 2019. On human predictions with explanations and predictions of machine learning models: A case study on deception detection. In Proceedings of the Conference on Fairness, Accountability, and Transparency, 29–38. ACM.
- Lertvittayakumjorn and Toni (2019) Lertvittayakumjorn, P.; and Toni, F. 2019. Human-grounded evaluations of explanation methods for text classification. arXiv preprint arXiv:1908.11355.
- Lipton (2018) Lipton, Z. C. 2018. The mythos of model interpretability. Queue, 16(3): 31–57.
- Liu, Wang, and Matwin (2018) Liu, X.; Wang, X.; and Matwin, S. 2018. Improving the interpretability of deep neural networks with knowledge distillation. In 2018 IEEE International Conference on Data Mining Workshops (ICDMW), 905–912. IEEE.
- Mohseni, Block, and Ragan (2021) Mohseni, S.; Block, J. E.; and Ragan, E. 2021. Quantitative evaluation of machine learning explanations: A human-grounded benchmark. In 26th International Conference on Intelligent User Interfaces, 22–31.
- Mohseni, Zarei, and Ragan (2021) Mohseni, S.; Zarei, N.; and Ragan, E. D. 2021. A multidisciplinary survey and framework for design and evaluation of explainable AI systems. ACM Transactions on Interactive Intelligent Systems (TiiS), 11(3-4): 1–45.
- Mullenbach et al. (2018) Mullenbach, J.; Wiegreffe, S.; Duke, J.; Sun, J.; and Eisenstein, J. 2018. Explainable Prediction of Medical Codes from Clinical Text. In Walker, M. A.; Ji, H.; and Stent, A., eds., Proceedings of the 2018 Conference of the North American Chapter of the Association for Computational Linguistics: Human Language Technologies, NAACL-HLT 2018, New Orleans, Louisiana, USA, June 1-6, 2018, Volume 1 (Long Papers), 1101–1111. Association for Computational Linguistics.
- Ott et al. (2011) Ott, M.; Choi, Y.; Cardie, C.; and Hancock, J. T. 2011. Finding deceptive opinion spam by any stretch of the imagination. arXiv preprint arXiv:1107.4557.
- Poursabzi-Sangdeh et al. (2021) Poursabzi-Sangdeh, F.; Goldstein, D. G.; Hofman, J. M.; Wortman Vaughan, J. W.; and Wallach, H. 2021. Manipulating and measuring model interpretability. In Proceedings of the 2021 CHI Conference on Human Factors in Computing Systems, 1–52.
- Pruthi et al. (2020) Pruthi, D.; Bansal, R.; Dhingra, B.; Soares, L. B.; Collins, M.; Lipton, Z. C.; Neubig, G.; and Cohen, W. W. 2020. Evaluating Explanations: How much do explanations from the teacher aid students? arXiv preprint arXiv:2012.00893.
- Ribeiro, Singh, and Guestrin (2016) Ribeiro, M. T.; Singh, S.; and Guestrin, C. 2016. ” Why should i trust you?” Explaining the predictions of any classifier. In Proceedings of the 22nd ACM SIGKDD international conference on knowledge discovery and data mining, 1135–1144.
- Smilkov et al. (2017) Smilkov, D.; Thorat, N.; Kim, B.; Viégas, F.; and Wattenberg, M. 2017. Smoothgrad: removing noise by adding noise. arXiv preprint arXiv:1706.03825.
- Sundararajan, Taly, and Yan (2017) Sundararajan, M.; Taly, A.; and Yan, Q. 2017. Axiomatic attribution for deep networks. arXiv preprint arXiv:1703.01365.
- Treviso and Martins (2020a) Treviso, M. V.; and Martins, A. F. 2020a. Towards Prediction Explainability through Sparse Communication. arXiv preprint arXiv:2004.13876.
- Treviso and Martins (2020b) Treviso, M. V.; and Martins, A. F. T. 2020b. The Explanation Game: Towards Prediction Explainability through Sparse Communication. In Alishahi, A.; Belinkov, Y.; Chrupala, G.; Hupkes, D.; Pinter, Y.; and Sajjad, H., eds., Proceedings of the Third BlackboxNLP Workshop on Analyzing and Interpreting Neural Networks for NLP, BlackboxNLP@EMNLP 2020, Online, November 2020, 107–118. Association for Computational Linguistics.
- Yin, Vaughan, and Wallach (2019) Yin, M.; Vaughan, J. W.; and Wallach, H. M. 2019. Understanding the Effect of Accuracy on Trust in Machine Learning Models. In Brewster, S. A.; Fitzpatrick, G.; Cox, A. L.; and Kostakos, V., eds., Proceedings of the 2019 CHI Conference on Human Factors in Computing Systems, CHI 2019, Glasgow, Scotland, UK, May 04-09, 2019, 279. ACM.