Understanding the "Feeble Giant" Crater II with tidally stretched Wave Dark Matter2021Understanding the "Feeble Giant" Crater II with tidally stretched Wave Dark Matter–References
Abstract
The unusually large "dwarf" galaxy Crater II, with its small velocity dispersion, km/s, defies expectations that low mass galaxies should be small and dense. We combine the latest stellar and velocity dispersion profiles finding Crater II has a prominent dark core of radius kpc, surrounded by a low density halo, with a transition visible between the core and the halo. We show that this profile matches the distinctive core-halo profile predicted by "Wave Dark Matter" as a Bose-Einstein condensate, DM, where the ground state soliton core is surrounded by a tenuous halo of interfering waves, with a marked density transition predicted between the core and halo. Similar core-halo structure is seen in most dwarf spheroidal galaxies (dSph), but with smaller cores, kpc and higher velocity dispersions, km/s, and we argue here that Crater II may have been a typical dSph that has lost most of its halo mass to tidal stripping, so its velocity dispersion is lower by a factor of 3 and the soliton is wider by a factor of 3, following the inverse scaling required by the Uncertainty Principle. This tidal solution for Crater II in the context of DM, is supported by its small pericenter of kpc established by Gaia, implying significant tidal stripping of Crater II by the Milky Way is expected.
Keywords:
Dark Matter, Galaxies: dwarfs, Galaxies: kinematics and dynamics1 Introduction
A surprising diversity of dwarf galaxies has been steadily uncovered over the past decade, with many “ultra faint dwarfs" (Moskowitz & Walker 2020; Pakdil et al. 2018; Munoz et al. 2018; Koposov 2015; Read et al. 2006) that are much smaller and denser than the well studied class of dwarf spheroidal galaxies (dSph), and other “ghostly" dwarfs of very low surface brightness that are large and lower in density. The aptly named “feeble giant", Crater II, has been particularly puzzling, with its dwarf-like velocity dispersion of only km/s (Torrealba et al. 2016; Caldwell et al. 2017) and large size, over kpc, that strains the dwarf definition in terms of size. Despite the low velocity dispersion, the mass-to-light ratio of Crater II is large, (Caldwell et al. 2017; Ji et al. 2021; Sanders, Evans & Dehnen 2018) and appears to have a shallow, cored profile (Ji et al. 2021; Sanders, Evans & Dehnen 2018) and an old, but not ancient stellar population, dated to Gyrs (Torrealba et al. 2016; Caldwell et al. 2017), resembling in these respects the common class of dwarf Spheroidal galaxy (dSph) for which dark matter-dominated cores are commonly claimed. However, both the stellar surface brightness and the velocity dispersion of Crater II are much lower than the typical dSph dwarfs.
Recently it has become clear that the dark cores of the dSph galaxies match well an essential prediction for dark matter as a Bose-Einstein condensate, for which a standing wave, soliton forms a prominent core in every galaxy (Schive, Chiueh & Broadhurst 2014a). The first cosmological simulations in this context have revealed pervasive wave structure on the de Broglie scale, termed DM, (Schive, Chiueh & Broadhurst 2014a; Schive et al. 2014b; Schwabe, Niemeyer & Engels 2016; Hui et al. 2017; Mocz et al. 2017). This includes a stable soliton core formed at the center of each galaxy, corresponding to the ground state (Schive, Chiueh & Broadhurst 2014a), surrounded by a halo of excited states. A boson mass of eV provides cores of kpc typical of the dwarf spheroidal (Pozo et al. 2020; de Martino et al. 2018; Schive et al. 2014b), where the width of the soliton core is set simply by the de Broglie wavelength and is seen to vary between galaxies in the simulations, being larger for lower mass galaxies, reflecting their lower momentum. Here, the local de Broglie scale is , where is the local velocity dispersion that sets the momentum scale together with the boson mass .
This is a scalar field interpretation of DM described simply by a coupled Schrodinger-Poisson equation for the mean-field behavior that evolves only under self-gravity, for which the boson mass is the only free parameter. The most unique prediction is that a prominent standing wave comprises the ground state at the center of every galaxy, surrounded by an extensive halo of slowly varying density waves that fully modulate the halo density on the de Broglie scale by self-interference (Schive, Chiueh & Broadhurst 2014a; Schive et al. 2014b; Mocz et al. 2017; Veltmaat, Schwabe & Niemeyer 2019; Hui et al. 2021). Condensates are inherently non-relativistic, and hence DM is viable as dark matter, behaving as CDM on large scales, exceeding the de Broglie wavelength, as demonstrated by the pioneering simulations of Schive, Chiueh & Broadhurst 2014a. This DM interpretation makes several unique predictions, including a core profile with the unique soliton profile (see section 2) and a more significant soliton radius, , in lower mass galaxies , of lower momentum, as a consequence that the de Broglie wavelength sets the soliton radius. Following this scaling relation: found by Schive et al. 2014b and verified in independent simulations, (Schwabe, Niemeyer & Engels 2016; Niemeyer 2020).
The effect of tidal stripping in DM has been examined recently by Schive, Chiueh & Broadhurst 2020; Du et al. 2018 demonstrating the resilience of the soliton, which is self-reinforcing so that halo is stripped first, with an abrupt disruption of the soliton predicted to follow if significant tidal stripping of the soliton follows(Du et al. 2018). A steady loss of the halo is found in the DM simulation of Schive, Chiueh & Broadhurst 2020, for a typical dwarf of , following a circular orbit of kpc in a Milky Way sized halo, showing that the halo density drops relative to the soliton over several Gyrs with little change in the slope of the density profile of the halo. This behavior has been recently claimed to bracket the range of profiles found for dwarf spheroidal galaxies, which are observed to follow the predicted form with a clear core and halo structure seen in all the stellar profiles of the classical dwarf spheroidal galaxies (Pozo et al. 2020), and this is also supported by the generally lower level of the velocity dispersion seen in the halo relative to the core as predicted for DM (Pozo et al. 2020). This phenomenon is reinforced by Schive, Chiueh & Broadhurst 2020 as he already found that tidal stripping increases the density contrast between the core and the halo, as the halo is relatively easily stripped compared to the core. As mass outside the tidal radius is stripped, the core should relax, becoming less massive and hence more extended, obeying the uncertainty principle. With increased stripping such that the tidal radius becomes similar in size to the core radius, the core will be disrupted, perhaps rather abruptly, leaving just extended tails (Du et al. 2018). A recent dedicated DM simulation that explores the properties of the Eridanus II dwarf shows that under steady modest stripping, the core remains stable as the halo is reduced in density, leading to an enhanced contrast over time between the relatively dense core and the tenuous surrounding halo(Schive, Chiueh & Broadhurst 2020), and the range of core-to-halo variation predicted by this simulation has been shown to match well the family of profiles of dSph galaxies, indicating most are stripped at some level, relative to the more distant “isolated" dSphs (Pozo et al. 2020).
Here we determine whether this predicted momentum dependence of DM can account for the relatively unusual properties of Crater II, given that its relatively wide core and low-velocity dispersion relative to the classical dSphs seems to support this possibility qualitatively. Similarly, it has been proposed that an ultra-light boson of eV accounts for the large size and modest velocity dispersion stars within Antlia II, consistent with boson mass estimates for more massive dwarf galaxies with smaller dark cores (Schive, Chiueh & Broadhurst 2014a) and places Antlia II close to the lower limiting Jeans scale for galaxy formation permitted by the Uncertainty Principle for this very light boson mass. New spectroscopy data has revealed that Antlia II has a systematic velocity gradient that is comparable with its velocity dispersion (Ji et al. 2021) indicating that it has suffered tidal elongation or possibly rotating, at least in the outskirts where the sign change of the velocity gradient is apparent(Ji et al. 2021). The tidal field of Crater II is also thought to have had a significant effect given the small pericenter that is now established for Crater II in the latest ’Gaia’ based analysis (Ji et al. 2021), though it does not show any clear evidence for a velocity gradient nor visible elongation along its orbit, unlike the case of Antlia II where tidal effects appear more evident (Ji et al. 2021). Moreover, the range of core-to-halo variation predicted by this simulation has been shown to match well the family of profiles of dSph galaxies, indicating most are stripped at some level relative to the more distant “isolated" dSphs (Pozo et al. 2020).
Significant tidal stripping is now firmly expected for Crater II from its Gaia based orbit, which is confirmed to have a large ellipticity, with a current radius distance of 117 kpc (Torrealba et al. 2016), well within the Milky Way halo (Sanders, Evans & Dehnen 2018), and a pericenter of only kpc (Fritz et al. 2018; Battaglia et al. 2021), so that that significant tidal stripping is regarded to be likely, perhaps resulting in reduction in its mass, with the possible presence of visible tidal distortion(Ji et al. 2021).
The "ultra-light" boson mass solution explored here, with a mass of , is claimed to underestimate the observed amplitude of the Lyman- power spectrumIršič et al. 2017 on small scales. This argument relies on an uncertain analogy with previous “Warm" dark matter estimates, rather than employing a self consistent hydrodynamical DM simulation that are computationally too demanding currently. We also emphasize empirical evidence that AGN activity may significantly boost the forest power spectrum Madau & Haardt 2015; Padmanabhan & Loeb 2021, given the detections of double-peaked Ly emitters at high redshift, (Hu et al. 2016; Bosman et al 2020; Gronke et al. 2021) and the wide “gaps" in the forest at reported by (Becker et al. 2015), that imply sparsely distributed AGNs(Gangolli et a.l 2021) at such high redshifts may significantly boost the forest variance in the power spectrum above current standard CDM based predictions. These observations lend support to the proposal that AGN are responsible for the bulk of reionization (Madau & Haardt 2015), which would imply a different heating history and less uniform reionization, affecting the interpretation of the forest power spectrum, especially on small scales. Moreover, Zhang et al. 2018 points out that the lower mass limit suggested by Iršič et al. 2017 was computed without taking into account the small scale quantum pressure in the DM context that sets a Jeans scale inherent to Wave Dark Matter, which limits the formation of small scale structure.
The outline of this paper is as follows; firstly, we describe the radial structure and internal dynamics of the DM core in section 2 for comparison with the data. We then describe the tidal effects in section 3, predicted by recent DM simulations, and discuss the possible evolution of Crater II in section 4. Finally, in section 5, we discuss our conclusions regarding the origin of Crater II in the context of DM with significant tidal stripping.
2 Comparison of Wave Dark Matter Predictions with observations of Crater II.
Ultralight bosons, such as Axions, provide an increasingly viable interpretation of dark matter as explored in Widrow & Kaiser 1993; Hu et al. 2000; Arvanitaki et al. 2010; Bozek et al. 2015; Schive, Chiueh & Broadhurst 2014a; Hui et al. 2017. In the simplest case, without any self-interactions, the boson mass is the only free parameter, which if sufficiently light means the de-Broglie wavelength exceeds the mean free path, set by the mean cosmological density of dark matter, and thus satisfies the ground state condition for a Bose-Einstein condensate. In this case the density field is simply described by one coupled Schroedinger-Poisson equation, which in comoving coordinates reads:
| (1) | ||||
| (2) |
Here is the wave function, is the gravitational potential and is the cosmological scale factor. The system is normalized to the time scale , and to the length scale , and where is the current density parameter Widrow & Kaiser 1993(Check Schive, Chiueh & Broadhurst 2014a to understand how the simulations are normalized to the cosmological density where is used).
Recently it has proven possible with advanced GPU computing to make the first cosmological simulations that solve the above equations, (Schive, Chiueh & Broadhurst 2014a; Schwabe, Niemeyer & Engels 2016; Mocz et al. 2017; May & Springel 2021), demonstrating that large scale structure evolves into a pattern of filaments and voids that is indistinguishable from CDM (Schive, Chiueh & Broadhurst 2014a), as expected for this non-relativitc form of dark matter. However, the virialized halos formed in the DM simulations are very different from CDM, displaying a pervasive self interfering wave structure, with a solitonic core, representing the ground state that naturally explain the dark matter cores of dwarf spheroidal galaxies (Schive et al. 2014b). Surrounding the soliton core, there is an extended halo with a “granular" texture on the de-Broglie scale, due to interference of excited states, but which when azimuthally averaged follows closely the Navarro-Frank-White (NFW) density profile (Navarro, Frenk & White 1996; Woo & Chiueh 2009; Schive, Chiueh & Broadhurst 2014a; Schive et al. 2014b). This granular interference structure within the halo is predicted to produce noticeable lensing flux anomalies(Chan et al. 2020; Hui et al. 2021) that are pervasive and hence, statistically unlike the relatively rare sub-halo structure of CDM.
The fitting formula for the density profile of the solitonic core in a DM halo is obtained from cosmological simulations (Schive, Chiueh & Broadhurst 2014a; Schive et al. 2014b):
| (3) |
where the values of the constants are: , , ; is the boson mass and is the solitonic core radius. The latter scales with the product of the galaxy mass and boson mass, obeying the following the scaling relation which has been derived from our simulations Schive et al. 2014b:
| (4) |
Where . Beyond the soliton, at radii larger than a transition scale (), the simulations also reveal the halo is approximately NFW in form, presumably reflecting the non-relativistic nature of condensates beyond the de Broglie scale, and therefore the total density profile can be written as:
| (5) |
More explicitly, the scale radius of the solitonic solution, which represents the ground state of the Schrodinger-Poisson equation, is related to size to the halo through the uncertainty principle. From cosmological simulations, the latter is found to hold non-locally, relating a local property with a global one (for more details we refer to Schive et al. 2014b).
The classical dwarf galaxies are known to be dominated by DM, and so the stars are treated as tracer particles Gregory et al. 2019; McConnachie & Irwin 2006; McConnachie et al. 2006; Kang & Ricotti 2019 moving in the gravitational potential generated by DM halo density distribution.
In this context, the corresponding velocity dispersion profile can be predicted by solving the spherically symmetric Jeans equation:
| (6) |
where is the mass DM halo obtained by integrating the spherically symmetric density profile in Eq. (5), is the anisotropy parameter (see Binney & Tremaine 2008Binney & Tremaine 2008, Equation (4.61)), and is the stellar density distribution defined by the solitonic wave dark matter profile:
| (7) |
where,
| (8) |
Here, is the 3D scale radius of the stellar halo corresponding to the central stellar density, is the normalization of at the transition radius and the transition radius, , is the point where the soliton structure ends, and the halo begins at the juncture of the core and halo profiles. The equivalence of equations (7) (8) with equations (5) (3) respectively. This behavior we have now established holds generally for the well studied dSph galaxies which all fit well the soliton core profile and with extended halos Pozo et al. 2020. This behavior may be taken to imply simply that the stars trace the dark matter, as may be expected approximately in dark matter dominated galaxies of spheroidal morphology. Note also that the soliton form is closely similar to the standardly adopted Plummer form widely used to model dSph galaxies, where it fits well to several times the core radius but falls well short of the extended stellar halos now commonly found (Torrealba et al 2019; Chiti et al. 2021; Collins et al. 2021; Pozo et al. 2020).
Finally, the predicted velocity dispersion profile can be projected along the line of sight to compare with the observations, as presented in Figure 4:
| (9) |
where,
| (10) |
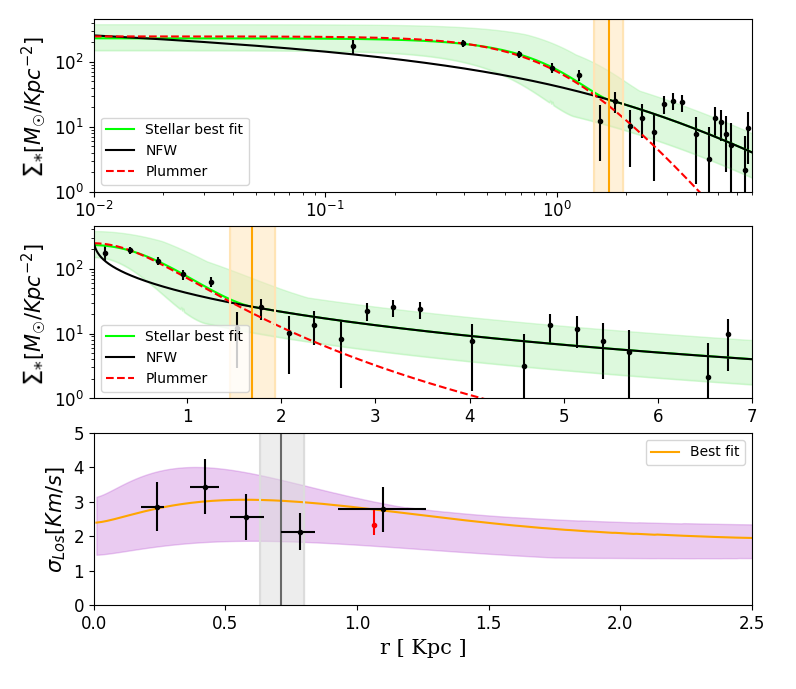
We now apply the above to the newly measured dispersion profile of Crater II dwarf galaxy, discovered by Torrealba et al. 2016 and some ideal DM cases. This unusual galaxy was identified in imaging data of the VST ATLAS survey and seemed to be located at 120 kpc from the sun. Designed to search for extended low-surface-brightness emission (Torrealba et al. 2016). The galaxy Crater II is one of the largest of the low mass dwarfs orbiting the Milky Way, with a half-light radius kpc, and also has a relatively low surface brightness dwarfs, similar to cases of Tuc II, Tuc IV, and UMa II. Its stellar velocity dispersion profile has recently been measured with deep spectroscopy by Caldwell et al. 2017 and found to be unusually low with a surprisingly low mean value of only traced to over 1kpc shown in 1 where we see the data is consistent with the characteristic DM form which peaks at the soliton radius and declines into the halo (see figure 1).
| Galaxy | Refs | |||||||
| (kpc) | (kpc) | Gyr | ||||||
| Crater II | Caldwell(2017) |
3 Tidal Effects
Below we describe different effects of the tidal stripping including the mass-loss, core enlargement and the core-halo density transition.
We firstly calculate the relation between ( halo mass) and (core mass) using Eq. (3) until the core radius, as indicated in Eq (5). After that, the core mass-loss rate is inferred for each orbit with the following formula (Du et al. 2018):
| (11) |
With the best fitting parameters values: (a,b,c)(5.89794 , , 1.6774), , the effect of the centrifugal force owing to synchronous rotation of the orbiting satellite, assuming it to be a rigid body, fixed to 3/2 for a soliton (Du et al. 2018) and , the density ratio between the central density of the soliton and the average density of the host within the orbital radius , (Du et al. 2018). Nevertheless, must be recalculated across the orbits due to the core density loss along each orbit:
| (12) |

For DM, the core and halo are coupled, with the ground state soliton surrounded by the halos of excited states. A Core-halo relationship has been established in the simulations, with more massive solitons formed in more massive halos that are denser because of the higher momentum. Mass loss by tidal forces readily strips the tenuous halo and, in turn, is expected to affect the soliton via the core-halo relation, but in a smaller proportion (Du et al. 2018).
Previously we have found an approximate proportionality between and the observed half light radius, , for local dSph galaxies in Pozo et al. 2020, of about 1.3. This ratio was has also been pointed out by Lazar et al. 2020; Schive, Chiueh & Broadhurst 2014a; Schive et al. 2014b. So as well as computing the mass loss due to tidal stripping using Eq (11), we continuously increment by updating the mass-loss in Eq. (3). Finally, we use the above ratio between and to increment across the orbits (see righthand panel of Fig.5). The enlargement of , (extracted from the simulations made by Schive, Chiueh & Broadhurst 2020, where it is defined in which ratio should the transition radius of a Milky way’s satellite dwarf galaxy increase due to Milky Way’s tidal forces: "The halo surrounding the central soliton is found to be vulnerable to tidal disruption; the density at r > decreases by more than an order of magnitude after 2 Gyr") will explain the observed ( density drop between the core and the halo, , where is the asymptotic central core stellar density and is the stellar density at the transition radius() ) changes in the halo of the galaxies.
4 Model Results
4.1 Crater II
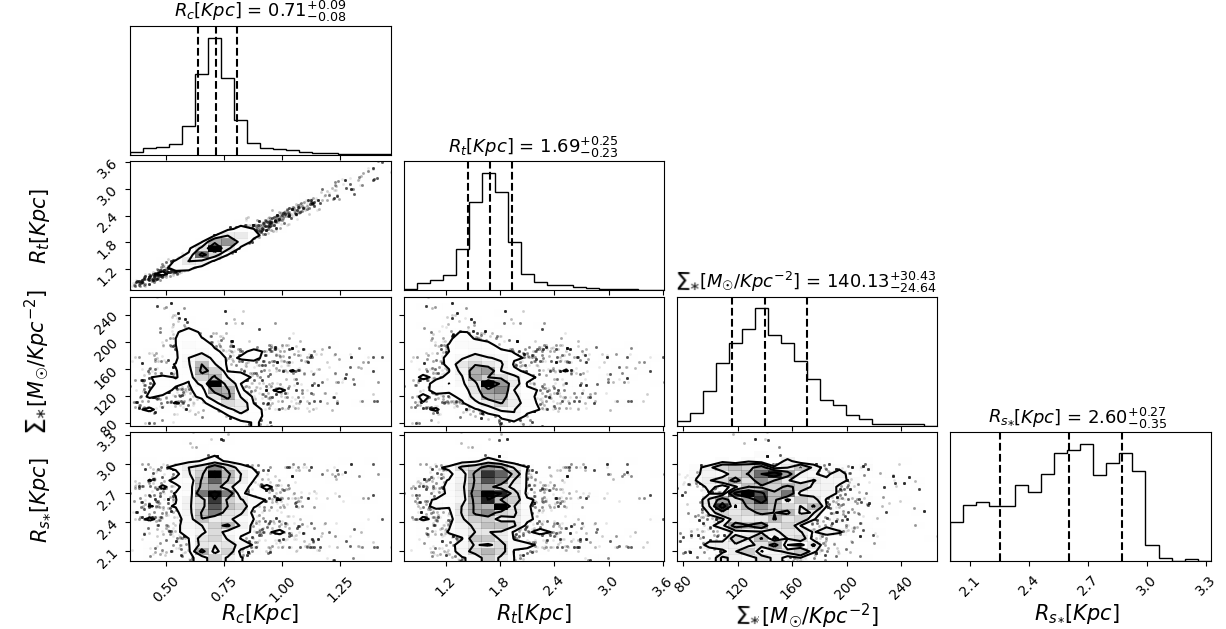
Here we compare the measured velocity dispersion and the stellar profile of Crater II with DM. We fit the data with the following free parameters; the core radius of the soliton profile given by Eq.(8), the transition radius between the core and the halo, the central 3D stellar density and the 3D scale radius of the stellar halo describing the scale radius of the NFW-like halo that we infer from fitting to the outer stellar profile beyond the transition radius. Note that the boson mass is fixed, with a value of eV, consistent with our previous dynamical work on dwarf galaxies in the context of DM Schive, Chiueh & Broadhurst 2014a; Schive et al. 2014b; Broadhurst et al. 2020; Pozo et al. 2020.
In generating our model profiles, we solve the spherically symmetric Jeans equation, described above, Eq. (6), subject to a total mass for Crater II of , that we obtain from fitting the core radius size ( Eq.(8) ) in the stellar profile data with a fixed boson mass of eV, which is consistent with the dynamical mass estimated by Caldwell et al. 2017 (see table (1) .The transition radius, , is expected to be two or three times larger than the core radius in simulations of DM Schive, Chiueh & Broadhurst 2014a; Schive et al. 2014b, which we show below is consistent with 2.4 that we derive here for Crater II.
The results are listed in table (1), and figure (1) shows the self-consistency of these data in both stellar and kinematic profiles. The transition radius, at which the profile changes from being dominated by the halo rather than the soliton is marked with a vertical orange line in Figure (1). The green and purple shadowed areas represent the 2 range, respectively. The comparison shown in Figure (1) between the models and the data represents a consistency check, where we simply employ the Jeans equations in making predictions for the velocity dispersion profile (purple model band in lower panel of Figure (1) when inputting the set of core+halo profiles that acceptably fit the stellar profile data (green model band Figure (1) and subject to a constraint on the total galaxy mass set by the mean level of velocity dispersion of about 3km/s. Note, the limited precision of the velocity dispersion data does not yet warrant a classic combined Jeans analysis.
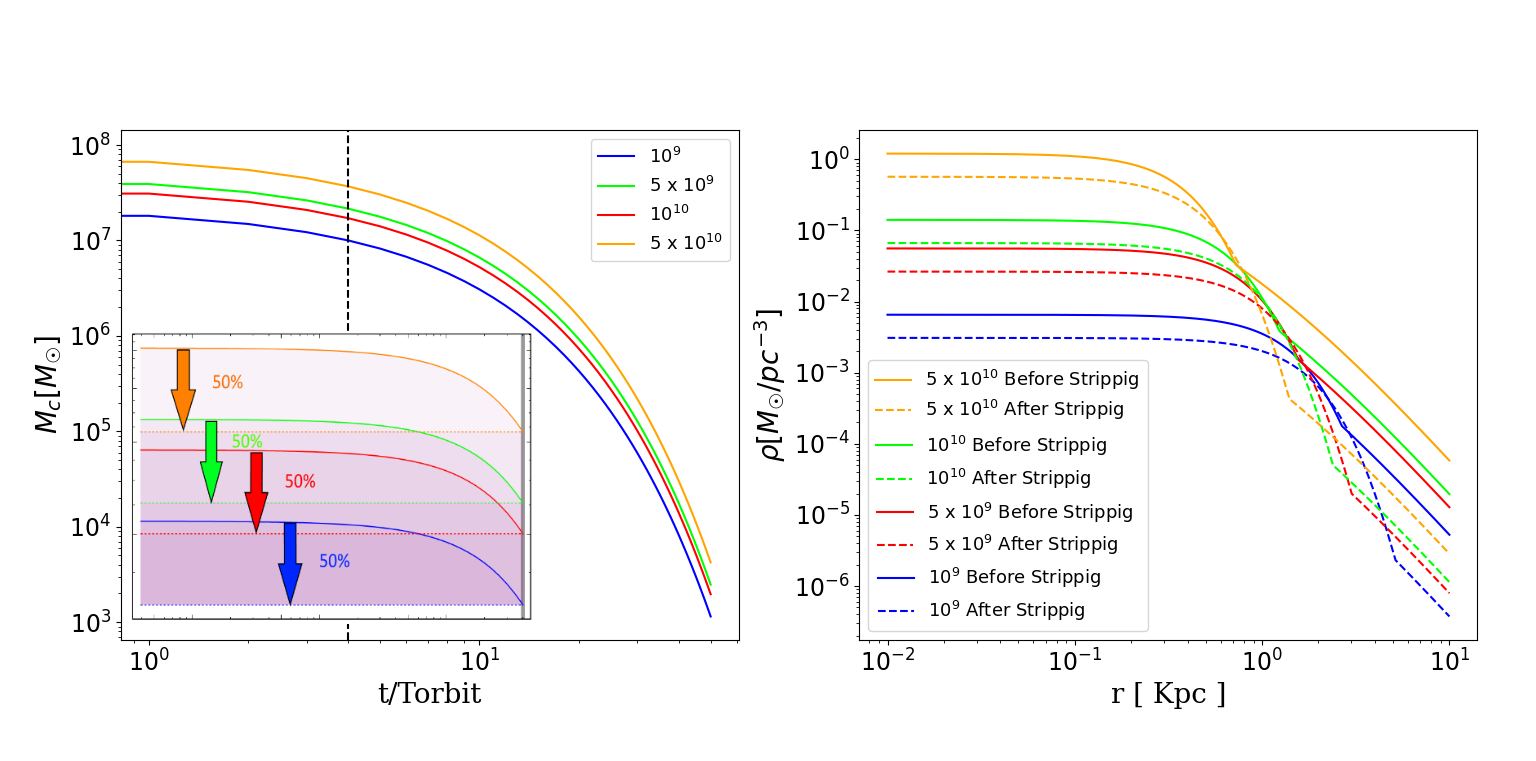
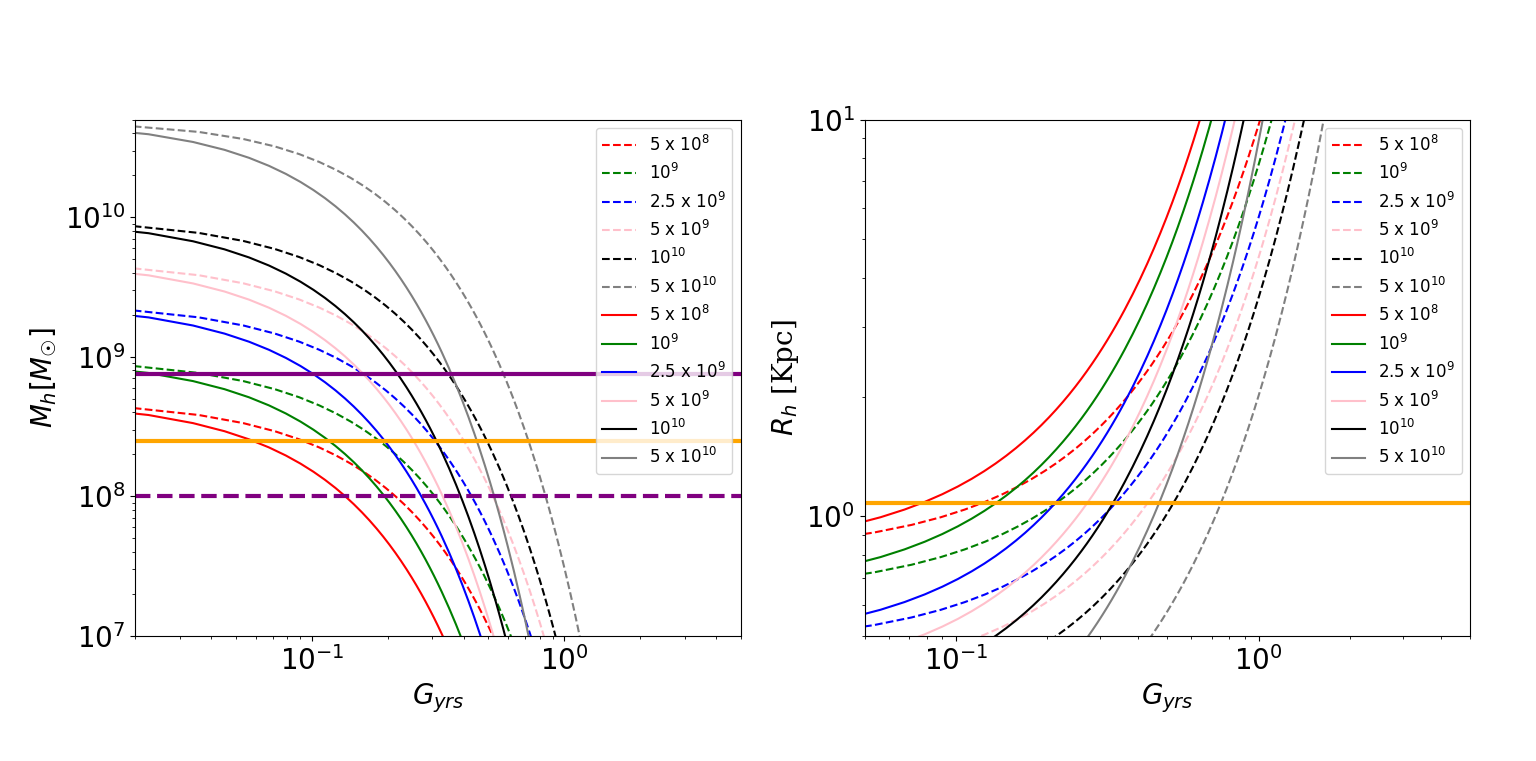
Figure (2) shows our predicted evolution of the stellar profile of Crater II as well as the change in the velocity dispersion profile for two choices of galaxy mass and spanning a mass loss of up to 50%. As a consequence of continued core mass loss (Du et al. 2018), a widening of the core is induced, described by Eq. (4). It is important to point out how both densities of core and halo seem to decrease, with the halo changes more strongly over time, in good agreement with the halo’s greater weakness against tidal forces (Schive, Chiueh & Broadhurst 2020). This tidally induced mass loss results in a reduction of the velocity dispersion while widening the core so that the dispersion profile has a less pronounced peak that shifts the larger radius, reflecting the widening core as tidal stripping proceeds as seen in Fig.5 for the parameters of Crater II. This is in line with the simulations of Fu et al. 2019 where prolonged tidal stripping should produce a drop in the mean velocity dispersion in conjunction with a half-light radius increasing (Fattahi et al. 2019; Sanders, Evans & Dehnen 2018; Torrealba et al 2019).
We conclude that the extended core size of kpc of Crater II is is the product of its low halo mass() and significant tidal stripping of the halo have have occurred which is natural in the DM context, while CDM struggles to explain the observed combination of low-velocity dispersion and large radius(Fattahi et al. 2019). Moreover, Fig.1 clearly show how a cuspy NFW profile is unable to explain the stellar density and kinematic behavior in the core, under the assumption that stars trace the dark matter. We also note that we have not adopted the commonly used Plummer profile for the stellar profile, preferring instead the soliton form that fits well the stellar profile of Crater II (Eq. (7)) derived in section 2.
4.2 General case
Here we predict the tidal evolution of dwarf galaxy profiles in the context of DM. Figure (3) shows how the soliton core mass should decrease with time over several Gyrs, according to Eq.(11). The soliton profile remains unchnaged until it becomes stripped, then the core relaxes into a softer profile during this process, (see figures (3) and (4). This right hand panel of Figure (3) shows the soliton becoming wider, indicated by the difference between thick and dashed lines of the same color, due to the halo mass loss described by Eq(4) and at the same time the amplitude of the density gap and the transition radius can be seen to increase as the halo is stripped. Similar behaviour is noticeable in the recent DM simulations of (Schive, Chiueh & Broadhurst 2020), where tidal stripping has been approximated for the orbiting dwarf Eridanus II.
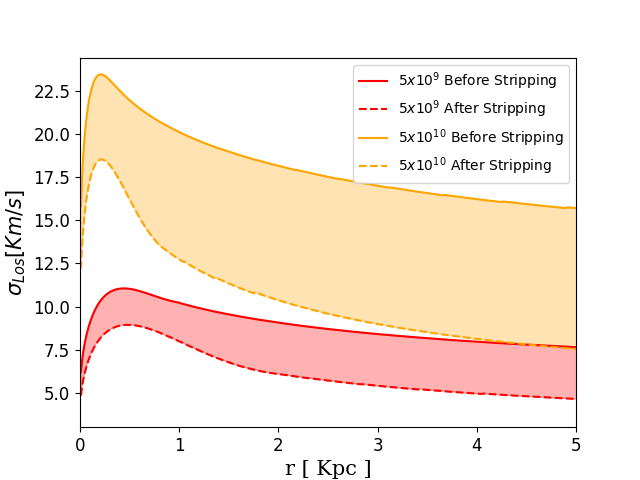
Figure (4) shows illustrative velocity dispersion profiles for a range of DM mass profiles highlighting the transition from the soliton core to the outer NFW-like outer profile (Schive, Chiueh & Broadhurst 2014a; Schive et al. 2014b; Vicens, Salvado & Miralda-Escudero 2018). The velocity dispersion profiles are listed in the right upper panel and cover one order of magnitude in the total mass starting from to . Solid and dashed lines differentiate the original ideal isolated profile from the stripped one for each system. In terms of the Jeans based calculation of the dispersion profile, the choice of is not very important, affecting the velocity dispersion well within the core, where is rises (or fall) sharply for a positive (or negative) value of beta and remains flat if isothermal. The data appear to favor a mildly negative value for as the dispersion of the innermost bin is lower than the mean, though quite uncertain, as can be seen in Figure 1 (lower panel), consistent with our adopted and this is similar to the value chosen by Caldwell et al. 2017 for modeling dwarf spheroidals, to counter the rising dispersion profile that would otherwise result from the “cusp” of an NFW profile. The main influence on the velocity dispersion profile is from the presence of the soliton core, rather than the choice of , because the soliton is dense relative to the halo (by a factor of about 30), generating a peaked form at about the core radius, as can be seen in Figure 4 and also in figure 1.
5 Discussion and Conclusions
The existence of Crater II, with its unusually large size and relatively low-velocity dispersion, has been a surprise as it strains the very definition of a "dwarf" galaxy with its large size and also because is it in significantly greater tension with CDM than the dSph galaxies (Amorisco 2019; Borukhovetskaya et al 2021), for which sizeable dark cores are often claimed, at odds with the standard prediction for collisionless CDM particles (or black holes) that low mass galaxies should be small and dense rather than large and diffuse like Crater II.
Instead, in this paper, we have shown that Crater II can be readily understood in the context of dark matter as a Bose-Einstein condensate by comparison with the profiles of galaxies generated in DM simulations (Schive, Chiueh & Broadhurst 2020), especially if tidal stripping is included. One of the most distinguishing features of DM is the prominent soliton core. This is quite unlike the usual smooth cores generally explored in other models, where the density turns over towards the center becoming constant, but instead, the solitonic core of DM is prominent, raised in density above the surrounding halo by a factor of , representing the ground state. Furthermore, the soliton density profile is characterized only by a radius set by the de Broglie Wavelength, with the same shape, irrespective of boson mass, scaling only with the momentum that sets the de Broglie wavelength, so that the soliton is smaller in radius and more massive for higher mass and more concentrated galaxies.
It should be emphasized that the simulations also make clear that there is a marked transition between the core and the halo, and we can see that Crater II does possess a well-defined core with such a visible transition in its stellar profile at a radius of kpc, shown in Figure 1, and this is despite the relatively low surface brightness of Crater II, for which the star counts are much lower than typical well studied dSph galaxies. The existence of this core is also supported by the velocity dispersion profile of Crater II, which we have shown is consistent with being peaked at about the stellar core radius, as we have shown is predicted for DM in Figures 3 & 4.
Deeper imaging and spectroscopy for Crater II can help considerably in clarifying the level of correspondence between the stellar profile and internal dynamics, in particular, it will be very helpful to see whether the velocity dispersion falls in the halo region beyond the current limit of kpc covered by existing dynamical measurements, where we predict the dispersion to be significantly lower than in the core for the DM profile, and quite unlike the rising profiles predicted by CDM for Crater II, which must be assumed to be hosted by a relatively massive galaxy of low concentration in the context of CDM (Amorisco 2019; Borukhovetskaya et al 2021).
We have also pointed out that the observed stellar profile behavior of Crater II is continuous with the distinctive core-halo structure that appears to be a general feature of the classical dSph galaxies, established in our earlier work Pozo et al. 2020, where we found that essentially all the well studied dSph galaxies have a prominent stellar core that accurately matches the unique soliton form, and also that the velocity dispersion profiles of these dSph galaxies generally peak near the stellar core radius and are lower in the halo. However, despite this qualitative similarity between Crater II and the dSph class, there is a clear difference in that the dSphs are about a factor three smaller, with a mean core radius of Kpc, compared to kpc for Crater II, and also in terms of the characteristic velocity dispersion which is about three times greater for the dSphs, with a mean level of km/s compared to only km/s for Crater II significantly higher than Crater II, and also of course, as the name "feeble giant" suggests, Crater II is relatively more extended and of unusually low surface brightness than typical dSph galaxies (Torrealba et al. 2016).
Our analysis of Crater II has examined the possibility that tidal stripping in the context of WaveDM may account for the rather extreme properties of this dwarf galaxy, with its relatively large size and low velocity dispersion. In support of this we show the stellar profile of the Crater II (upper panel Figure 1) is well fitted by a soliton core plus a shallow NFW halo and that this combined profile, that is generic to WaveDM, is consistent with the extended, shallow, velocity dispersion profile of Crater II, (lower panel Figure 1) where the low mean level of velocity dispersion of km/s corresponds to a total galaxy mass of about . The consistency we find here may indicate that the stellar core and DM core are similar in scale, though this is by no means conclusive at the current limited precision of the dispersion profile and relies to some extent the level of velocity anisotropy assumed, but may imply the stars behave essentially as tracer particles within the dark matter dominated potential. Detailed hydrodynamical simulations of gas and star formation within dwarf galaxy haloes will be required for a more definitive exploration of this relationship between stars and DM, that must include the relaxation effects understood to be significant in randomly deflecting stars orbiting through the de Broglie scale density fluctuations predicted for WaveDM halos (Schive, Chiueh & Broadhurst 2014a) and proposed as possible explanation for the increasing scale height of disk stars in the Milky Way with stellar age, by Church, Mocz & Ostriker 2019, and Bar-Or, Fouvry & Tremaine 2019. For now we content ourselves with the largely qualitative conclusion that tidal stripping of a DM dominated dwarf galaxy in the context of Wave DM can plausibly result in the unusual properties of Crater II, with an expansion of its soliton core in response to stripping of its DM halo, an effect that follows fundamentally from the Uncertainty Principle for WaveDM.
We have been able to understand these differences in the context of DM, as the possible consequence of tidal stripping. It is now understood that Crater II has a small pericenter within the Milky Way, so that tidal stripping should be significant and this we have shown provides an interpretation of Crater II as a stripped dSph galaxy. This possibility follows directly from considering how the soliton expands as the halo mass is stripped away, as proposed by Du et al. 2018 that is implied by the existence of a relatively clear relationship established in the DM simulations between the mass of a galaxy and the soliton core, which may act together with the strict inverse relationship required for a soliton (by the Uncertainty Principle), such that as galaxy mass is reduced by tidal stripping, the momentum associated with the soliton ground state is also lower and hence the soliton expands as the de Broglie Wavelength is larger following the inverse soliton mass-radius relation, with a reduce soliton density and hence lower velocity dispersion. We may conclude that in order for Crater II to have originated as a typical dSph, its core has expanded by approximately a factor of 2-3, and hence the core mass was 2-3 times higher and hence initially, the total mass would have been larger, assuming the core-halo mass scaling relation scaling is followed, i.e. . We can come to the same quantitative conclusion by comparing the velocity dispersion km/s of Crater II, which also differs by a factor of 3 with the typical km/s peak dispersion for the dSph’s. This agreement is quite compelling for the DM interpretation as this factor difference would not be expected, whereas for DM it is a requirement as the uncertainty principle dictates that the soliton obeys =, (taking as the width of the soliton wave packet) providing an approximate boson mass of eV, and because and vary inversely with a fixed product, this boson mass estimate is expected to be independent of tidal evolution, in the absence of extreme tidal disruption that may deform the soliton (Du et al. 2018). This value of is consistent with estimates for the cores of classical dSph galaxies, eV(Chen et al. 2017), and thus Crater II quantitatively reinforces the light boson solution for dark matter.
Acknowledgements
TJB thanks Gabriel Torrealba, Tzihong Chiueh and Simon White for useful conversations. Razieh Emami acknowledges the support by the Institute for Theory and Computation at the Center for Astrophysics. George Smoot is grateful to the IAS at HKUST for generous support. Also AP is thankful for the continued support of the DIPC graduate student program. This work has been supported by the Spanish project PID2020-114035GB-100 (MINECO/AEI/FEDER, UE). We thank the referee for a thorough reading and useful suggestions that have improved the paper.
Data Availability
The data underlying this article will be shared on reasonable request to the corresponding author.
References
- Abraham & van Dokkum (2014) Abraham R., Van Dokkum P. 2014, PASP, 126, 55A
- Amorisco (2019) Amorisco, N. C. 2019, MNRAS, 489L, 22A
- Aprile et al. (2018) Aprile, E. & Xenon Collaboration 2018, Phys. Rev. Lett., 121k, 1302A
- Arvanitaki et al. (2010) Arvanitaki A., Dimopoulos S., Dubovsky S., Kaloper N., March-Russell J. 2010, Phys. Rev. D, 81I, 3530A
- Bar-Or, Fouvry & Tremaine (2019) Bar-Or, B., Fouvry, J.-B., Tremaine, S. ¡ 2019, ApJ, 871, 28B
- Battaglia et al. (2021) Battaglia, G. , Taibi, S. , Thomas, G. F. , Fritz, T. K. 2021, arXiv:2106.08819
- Becker et al. (2015) Becker G. D., Bolton J. S., Madau P., Pettini M., Ryan-Weber E. V., Venemans B. P. 2015, MNRAS, 447, 3402B
- Beasley & Trujillo (2016) Beasley M. A., Trujillo I. 2016, ApJ, 830, 23B
- Bellazzini et al (2017) Bellazzini M., Belokurov V., Magrini L., Fraternali F., Testa, V., Beccari G., Marchetti A., Carini R. 2017, MNRAS, 467, 3751B
- Binney & Tremaine (2008) Binney J., Tremaine S. 2008, gady.book, B
- Borukhovetskaya et al (2021) Borukhovetskaya A., Navarro J. F., Errani Raphael., Fattahi A. 2021, arXiv:2112.01540
- Bose et al (2019) Bose S., Frenk C. S., Jenkins A., Fattahi A., Gómez F. A., Grand R. J. J., Marinacci F., Navarro J. F., Oman K. A., Pakmor R., Schaye J., Simpson C. M., Springel, V. 2019, MNRAS, 486, 4790B
- Bosman et al (2020) Bosman S. E. I., Kakiichi K., Meyer R. A., Gronke M., Laporte N., Ellis R. S. 2019, ApJ, 896, 49B
- Bozek et al. (2015) Bozek B., Marsh D. J. E.,Silk J.,Wyse R. F.G., 2015, MNRAS, 450, 1, 209B
- Broadhurst et al. (2020) Broadhurst T., De Martino I., Luu H. N. Smoot G. F., Tye S. -H. H. 2020, Phys. Rev. D , 101h, 3012B
- Caldwell et al. (2017) Caldwell N., Walker M. G., Mateo M., Olszewski E. W., Koposov S., Belokurov V., Torrealba G., Geringer-Sameth A., Johnson C. I. 2017, ApJ, 839, 20C
- Chamba, Trujillo & Knapen (2020) Chamba N., Trujillo I., Knapen J. H. 2020, å, 633L, 3C
- Chan et al. (2020) Chan J. H. H., Schive, H.-Y., Wong S.-K., Chiueh T., Broadhurst T. 2020, Phys. Rev. Lett., 125k1102C
- Chen et al. (2017) Chen S.-R., Schive H.-Y. , Chiueh T. 2017, MNRAS, 468, 1338C
- Chiti et al. (2021) Chiti A., Frebel A., Simon J. D., Erkal D., Chang L. J., Necib L., Ji A. P., Jerjen H., Kim D., Norris J. E. 2021, Nature Astro., 5, 392C
- Church, Mocz & Ostriker (2019) Church, B. V., Mocz, P., Ostriker, J. P. 2019, MNRAS, 485, 2861C
- Collins et al. (2021) Collins M. L. M., Read J. I., Ibata R. A., Rich R. M., Martin N. F., Peñarrubia J., Chapman S. C., Tollerud E. J., Weisz D. R. 2021, MNRAS, 505, 5686C
- de Martino et al. (2018) de Martino I., Broadhurst T., Tye S.-H. H., Chiueh T., Schive , 2018, Galaxies, 6, 10
- de Martino et al. (2017) de Martino I., Broadhurst T.,Tye S.-H. H., Chiueh T., Schive H.-Y, Lazkoz R., 2017, Phys. Rev. Lett., 119, 221103
- Di Cintio et al. (2019) Di Cintio A., Brook C. B. A., Dutton A. A., Macciò A. V., Obreja A., Dekel A. 2019, Highlights on Spanish Astrophysics X, 116D
- Du et al. (2018) Du X., Schwabe B., Niemeyer J. C. , Bürger D. 2018, Phys. Rev. D, 97f3507D
- Fattahi et al. (2019) Fattahi A., Navarro J. F., Frenk C. S., Oman K. A., Sawala T., Schaller M. 2018, MNRAS, 476, 3816F
- Fensch et al. (2019) Fensch J., van der Burg R. F. J., Jeřábková T., Emsellem E., Zanella A., Agnello A., Hilker M., Müller O., Rejkuba M., Duc P., Durrell P., Habas R., Lim S., Marleau F. R., Peng E. W., Sánchez Janssen R. 2019, å, 625A, 77F
- Ferrero et al. (2012) Ferrero I., Abadi M. G., Navarro J. F., Sales L. V., Gurovich S. 2012, MNRAS, 425, 2817F
- Fritz et al. (2018) Fritz T. K., Battaglia G., Pawlowski M. S., Kallivayalil N., van der Marel R., Sohn S. T., Brook C., Besla, G. 2018, å, 619A, 103F
- Fu et al. (2019) Fu S. W. Simon J. D., Alarcón Jara A. G. 2019, ApJ, 883, 11F
- Gangolli et a.l (2021) Gangolli N., D’Aloisio A., Nasir F., Zheng Z. 2021, MNRAS, 501, 5294G
- Gannon et a.l (2020) Gannon J. S., Forbes D. A., Romanowsky A. J., Ferré-Mateu A., Couch W. J., Brodie J. P. 2020, MNRAS, 495, 2582G
- Gregory et al. (2019) Gregory A. L., Collins M. L. M., Read J. I., Irwin, M. J., Ibata R. A., Martin N. F., McConnachie A. W., Weisz D. R. 2019, MNRAS, 485, 2010G
- Gronke et al. (2021) Gronke M., Ocvirk P., Mason C., Matthee J., Bosman S. E. I., Sorce J.G., Lewis J., Ahn K., Aubert D., Dawoodbhoy T., Iliev I. T., Shapiro P. R., Yepes G. 2021, MNRAS, 508, 3697G
- Haslbauer et al. (2019) Haslbauer M., Banik I., Kroupa P., Grishunin K. 2019, MNRAS, 489, 2634H
- Hu et al. (2000) Hu W.,Barkana R.,Gruzinov & A., 2000, Phys. Rev. Lett., 85, 1158H
- Hu et al. (2016) Hu E. M., Cowie L. L., Songaila A., Barger A. J., Rosenwasser B., Wold I. G. B. 2016, ApJ, 825L, 7H
- Hui et al. (2017) Hui L., Ostriker J. P., Tremaine S., Witten E., 2017, Phys. Rev. D, 95d, 3541H
- Hui et al. (2021) Hui L., Joyce A., Landry M. J., Li X. 2021, JCAP, 01, 011H
- Iršič et al. (2017) Iršič V., Viel M., Haehnelt M. G., Bolton J. S., Becker G. D. 2017, Phys. Rev. Letters, 119c, 1302I
- Ji et al. (2021) Ji Alexander P., Koposov Sergey E., Li Ting S., Erkal Denis, Pace Andrew B., Simon Joshua D., Belokurov Vasily, Cullinane Lara R., Da Costa Gary S., Kuehn Kyler, Lewis Geraint F., Mackey Dougal, Shipp Nora, Simpson Jeffrey D., Zucker Daniel B., Hansen Terese T., Bland-Hawthorn Joss, S5 Collaboration 2021, arXiv:2106.12656
- Kang & Ricotti (2019) Kang H. D., Ricotti M. 2019, MNRAS, 488, 2673K
- Koposov (2015) Koposov, S. E., Belokurov, V., Torrealba, G., Evans, N. Wyn 2015, ApJ, 805, 130K
- Lazar et al. (2020) Lazar A., Bullock J. S., Boylan-Kolchin M., Chan T. K., Hopkins P. F., Graus A. S., Wetzel A. El-Badry K., Wheeler C., Straight M. C., Kereš D., Faucher-Giguère C.-A., Fitts A., Garrison-Kimmel S. 2020, MNRAS, 497, 2393L
- Madau & Haardt (2015) Madau P., Haardt F. 2015, ApJ, 813L, 8M
- Martín-Navarro et al. (2019) Martín-Navarro I., Romanowsky A. J., Brodie J. P., Ferré-Mateu A., Alabi A., Forbes D. A., Sharina M. Villaume A., Pandya V., Martinez-Delgado D. 2019, MNRAS, 484, 3425M
- Marsh & Silk (2014) Marsh D. J. E.,Silk J., 2014, MNRAS, 437, 2652M
- May & Springel (2021) May S., Springel V. 2021, MNRAS, tmp, 1533M
- McConnachie & Irwin (2006) McConnachie A. W., Irwin M. J. 2006, MNRAS, 365, 1263M
- McConnachie et al. (2006) McConnachie, A. W., Arimoto N., Irwin M., Tolstoy E. 2006, MNRAS, 373, 715M
- Mocz et al. (2017) Mocz P., Vogelsberger M., Robles V. H., Zavala J., Boylan-Kolchin M., Fialkov A., Hernquist L. 2017, MNRAS, 471, 4559M
- Mocz et al. (2019) Mocz P., Fialkov A., Vogelsberger M., and others 2019, Phys. Rev. Lett., 123
- Moore (1994) Moore B. 1994, nature, 370, 629M
- Moskowitz & Walker (2020) Moskowitz A. G., Walker M. G. 2020, ApJ, 892, 27M
- Munoz et al. (2018) Muñoz R. R., Côté P., Santana F. A., Geha M., Simon J. D., Oyarzún G. A.,; Stetson P. B., Djorgovski S. G. 2018, ApJ, 860, 66M
- Navarro, Frenk & White (1996) Navarro, J. F., Frenk, C. S.,White, S. D. M., 1996, ApJ, 462, 563N
- Niemeyer (2020) Niemeyer J. C., 2020, PrPNP, 11303787N
- Pakdil et al. (2018) Mutlu-Pakdil B., Sand D., Carlin J. L., Spekkens K., Caldwell N., Crnojević D., Hughes A., Willman B., Zaritsky D. 2018, ApJ, 863, 25M
- Padmanabhan & Loeb (2021) Padmanabhan H., Loeb A. 2021, å, 646L, 10P
- Papastergis, Adams & Romanowsky (2017) Papastergis E., Adams E. A. K., Romanowsky A. J. 2017, å, 601L, 10P
- Peng & Lim (2016) Peng E. W.,Lim S. 2016, ApJ, 822L, 31P
- Pontzen & Governato (2012) Pontzen A., Governato F. 2012, MNRAS, 421, 3464P
- Pozo et al. (2020) Pozo A., Broadhurst T., de Martino I., Chiueh T., Smoot G. F., Bonoli S., Angulo R. 2020, arXiv:2010.10337
- Read et al. (2006) Read, J. I. , Wilkinson, M. I. , Evans, N. Wyn , Gilmore, G. , Kleyna, Jan T. 2006, MNRAS, 367, 387R
- Robles et al. (2019) Robles V. H., Bullock J. S., Boylan-Kolchin M., 2019, MNRAS, 483, 289R
- Sahni & Wang (2000) Sahni V., Wang L., 2000, Phys. Rev. D, 62j, 3517S
- Sanders, Evans & Dehnen (2018) Sanders J. L., Evans N. W., Dehnen W. 2018, MNRAS, 478, 3879S
- Schive, Chiueh & Broadhurst (2020) Schive H.-Y., Chiueh, T., Broadhurst T. 2020, Phys. Rev. Lett., 124t1301S
- Schive, Chiueh & Broadhurst (2014a) Schive H.-Y.,Chiueh T.,Broadhurst T., 2014a, Nature Physics , 10, 7, 496-499
- Schive et al. (2014b) Schive H.-Y.,Liao M.-H.,Woo T.-P.,Wong S.-K.,Chiueh T.,Broadhurst T., Pauchy Hwang W.-Y., 2014b, Phys. Rev. Lett. 113, 261302
- Schwabe, Niemeyer & Engels (2016) Schwabe B., Niemeyer J. C., Engels, J. F. 2016, Phys. Rev. D, 94d, 3513S
- Torrealba et al. (2016) Torrealba G., Koposov S. E., Belokurov V., Irwin, M. 2016, MNRAS 459, 2370T
- Torrealba et al (2019) Torrealba G., Belokurov V., Koposov S. E., Li T. S., Walker M. G., Sanders J. L., Geringer-Sameth A., Zucker D. B., Kuehn K., Evans N. W., Dehnen W., 2019, MNRAS 488, 2743T
- van Dokkum et al. (2019) van Dokkum P., Wasserman A., Danieli S., Abraham R., Brodie J., Conroy C., Forbes D. A., Martin C., Matuszewski M., Romanowsky A. J., Villaume A. 2019, ApJ, 880, 91V
- Veltmaat, Niemeyer & Schwabe (2018) Veltmaat J., Niemeyer J. C., Schwabe B., 2018, Phys. Rev. D, 98d, 3509V
- Veltmaat, Schwabe & Niemeyer (2019) Veltmaat J., Schwabe B., Niemeyer J. C. 2019, Phys. Rev. D, 101h, 3518V
- Vicens, Salvado & Miralda-Escudero (2018) Vicens J., Salvado J, Miralda-Escudero J., 2018, arXiv:18021.0513V
- Webster & Murdin (1972) Webster B. L., Murdin P. 1972, Nature, 235, 37W
- Widrow & Kaiser (1993) Widrow L.M.,Kaiser N., 1993, ApJ, 416, 71W
- Woo & Chiueh (2009) Woo T-P.,Chiueh T., 2009, ApJ, bf 697, 850W
- Yagi et al. (2016) Yagi M., Koda J., Komiyama Y., Yamanoi H. 2016, ApJS, 225, 11Y
- Zhang et al. (2018) Zhang J., Kuo J.-L., Liu H., Sming Tsai, Y.-L., Cheung K., Chu M.-C. 2018, ApJ, 863, 73Z