Holistic Interpretation of Public Scenes Using Computer Vision and Temporal Graphs to Identify Social Distancing Violations
Abstract
Social distancing measures are proposed as the primary strategy to curb the spread of the COVID-19 pandemic. Therefore, identifying situations where these protocols are violated has implications for curtailing the spread of the disease and promoting a sustainable lifestyle. This paper proposes a novel computer vision-based system to analyze CCTV footage to provide a threat level assessment of COVID-19 spread. The system strives to holistically interpret the information in CCTV footage spanning multiple frames to recognize instances of various violations of social distancing protocols, across time and space, as well as identification of group behaviors. This functionality is achieved primarily by utilizing a temporal graph-based structure to represent the information of the CCTV footage and a strategy to holistically interpret the graph and quantify the threat level of the given scene. The individual components are evaluated in a range of scenarios, and the complete system is tested against human expert opinion. The results reflect the dependence of the threat level on people, their physical proximity, interactions, protective clothing, and group dynamics, with a system performance of 76% accuracy.
keywords
COVID-19; computer vision; surveillance; artificial intelligence2 Department of Computer Science, University of Maryland, College Park, MD 20742, USA
3 Department of Informatics, Technical University of Munich, 85748 Garching, Germany; suren.sri@eng.pdn.ac.lk
4 School of Engineering, Cardiff University, Cardiff, Wales, CF24 3AA, UK
5 Department of Community Medicine, University of Peradeniya, Peradeniya 20400, Sri Lanka; samath.dharmaratne@mbbs.md ††corresponding: Correspondence: harshana.w@eng.pdn.ac.lk††firstnote: These authors contributed equally to this work.††reftitle: References
1 Introduction
COVID-19 is a viral infection that causes a wide range of complications, primarily in the respiratory system Zhao et al. 2020 along with other systems Long et al. 2020; Ellul et al. 2020. As per current statistics, even though the virus has a comparatively small case mortality rate, it has amassed a massive fatality count due to its high infectiousness. The World Health Organization (WHO) estimates that the virus has infected around 338 million people and claimed more than 5.72 million lives as of December 2021. Despite the availability of effective vaccines against virus spread, medical complications, and mortality, complete global vaccination coverage is still far overdue. Furthermore, emerging variants cast some non-trivial obstacles to vaccine efficiency Lopez Bernal et al. 2021; McCallum et al. 2021; Olliaro et al. 2021; Pormohammad et al. 2021. Therefore, mitigating the spread of the disease through social distancing, mask wearing, hand washing, sanitizing, and other practices of hygiene still remains indispensable by and large Abdullahi et al. 2020; Mukerjee et al. 2021 to restore normalcy whilst ensuring the safety of health.
People, being a social species, tend to exhibit group behaviors frequently. Therefore, even the most mindful persons may violate social distancing protocols occasionally Kashem et al. 2021; Ugail et al. 2021. Even such occasional violation of social distancing protocols may garner a risk of contracting COVID-19 depending on the proximity or duration of the violation Ren et al. 2021; Srivastava et al. 2021. Conversely, monitoring such violations of social distancing protocols (i.e., proximity, duration as well as the intensity of sudden events such as maskless cough or sneezing) provide vital tools for contact tracing, monitoring, and eventually pandemic control. In essence, observing social distancing protocol violations is a task with many caveats. Thus, automating this manual process needs meticulous analysis Grekousis and Liu 2021. The main two avenues of research have been (a) intrusive solutions where people are actively contributing to the measurement (by handheld devices, etc.) and (b) non-intrusive solutions with zero burden on the people (which could be deployed to any situation irrespective of who is being monitored).
The first type (intrusive techniques) requires a signal to be transmitted by the people being tracked; i.e., methods of this type require an active beacon by each tracked person. Such a wearable device based on an oscillating magnetic field for proximity sensing to monitor social distancing to prevent COVID-19 has been presented in Bian et al. 2020. This system was shown to be more robust than Bluetooth-sensing devices Fazio et al. 2020, especially in determining the distance threshold limit. However, it is practically difficult to deploy a solution of this type in a public space in a real-world situation. Thus, a non-intrusive solution is preferable for large-scale deployment in public spaces as the people who are being tracked are done so passively.
Research in non-intrusive techniques to monitor social distancing has led to a large body of work utilizing computer vision techniques. The major sub-tasks in those approaches are the detection and tracking of people, and the state of the art for these sub-tasks is now primarily dominated by convolution neural networks (CNNs). Most recent applications combine YOLO Shafiee et al. 2017 and deepSORT Wojke et al. 2017 to form powerful tools which can achieve object detection and tracking in real time, and it is used to tackle object recognition problems in different scenarios such as license plate recognition Chen et al. 2019, road marking detection Ye et al. 2020, pedestrian detection Chiang et al. 2021, agricultural production Wu et al. 2020, etc.
The work in Ansari and Singh 2021 is an example of a CNN framework built on the aforementioned detection and localization algorithms to detect people, calculate the Euclidean distance between them and spot social distancing violations. A similar approach using YOLOv3 is performed in Ahmed et al. 2021a; Ahmed et al. 2021b for birds-eye view (overhead) camera footage. However, such overhead viewpoints are not practically deployable in public settings. An SSD-based model is presented in Qin and Xu 2021, which also performs person detection and social distancing violation identification. The performance is compared for each of the deep learning models Faster RCNN, SSD, and YOLO. Reference Rahim et al. 2021 utilizes the YOLOv4 model for people detection in low light instances to enforce social distancing measures. In Su et al. 2021, a spatio-temporal trajectory-based social distancing measurement and analysis method is proposed. This problem has been further examined in Rezaei and Azarmi 2020; Yang et al. 2021; Punn et al. 2020.
While various solutions proposed in the literature strive to assess the adherence to social distancing protocols, they fall short of incorporating factors such as mask wearing, which is critical to the current COVID-19 pandemic. The presence or absence of a mask on a person greatly affects the efficacy of the social distancing protocols Eikenberry et al. 2020. Similarly, interperson interactions such as hugs, kisses, and handshakes are more severe concerns than mere distancing amongst individuals Kampf 2020; Warnes et al. 2015 as far as the person-to-person spreading of COVID-19 is concerned. The detection of mask-wearing Roy et al. 2020; Mohan et al. 2021; Loey et al. 2021; Wu et al. 2022; Hassan et al. 2021 as well as the detection of dyadic interactions Shinde et al. 2018; Sefidgar et al. 2015; Van Gemeren et al. 2018 has been explored in computer vision as isolated and distinct problems. However, to the best of the knowledge of the authors, those factors have not been incorporated into a unified and holistic solution for detecting violations of social distancing protocols in the literature Table 1. Ignoring such factors vastly undermines the robustness of vision-based techniques to tackle the social distancing problem of COVID-19.
| Social Distancing Measure | Specifics | Handled in Our System |
| Physical distancing Jones et al. 2020 | Singapore (1 m), South Korea (1.4 m) | ✓ |
| Mask wearing Kwon et al. 2021 | Practiced in most of the countries | ✓ |
| Close contacts Durkin et al. 2021 | Handshakes, hugging, etc. | ✓ |
| Hygiene practices Qian and Jiang 2020; Kwon et al. 2021 | Washing hands, sanitizing, etc. | |
| Restricted gathering Verani et al. 2020; Kwon et al. 2021 | Indoor gatherings | ✓ |
In this light, the system proposed in this paper analyzes the spatial and temporal interactions manifested over multiple frames. A single frame was analyzed to recognize how people adhere to social distancing measures such as keeping proper distance, mask wearing, and handshake interactions. The risk of spreading COVID-19 increases when an individual interacts with multiple people and the nature of the interaction. On the other hand, if a certain set of people are in a “bubble” and they remain so until the end of observation, there is no change in the risk of spreading COVID-19. This temporal analysis of identifying bio-bubbles is also included in our proposed model.
In this paper, the design, implementation, and testing of a complete end-to-end system comprising of a framework to fit in different computer vision and deep learning-based techniques, a representation to store the output of the deep learning models, and an interpretation technique to evaluate the threat level of a given scene are discussed. The key contributions of this paper are as follows:
- •
A deep learning-based system to monitor social distancing violations and COVID-19 threat parameters. The system can utilize multiple computer vision modules to extract different information from the video sequence such as the number of people, their location, their physical interactions, and whether they wear masks.
- •
A temporal graph representation to structurally store the information extracted by the computer vision modules. In this representation, people are represented by nodes with time-varying properties for their location and behavior. The edges between people represent the interactions and social groups.
- •
A methodology to interpret the graph and quantify the threat level in every scene based on primary and secondary threat parameters such as individual behavior, proximity, and group dynamics extracted from the graph representation.
2 Proposed Solution
This section explains the graph-based computer vision framework proposed to quantify the risk of COVID-19 transmission in various public scenarios. The input video feed from closed circuit television (CCTV) footage is first used to extract key information such as people, handshake interactions, and face masks through computer vision models. The proposed system then quantifies the risk of transmission of COVID-19 by encoding the extracted information into a temporal graph and interpreting it using a function for the threat of transmission developed in this paper. An overview of the proposed system is depicted in Figure 1.
The system takes a video stream as the input, where denotes the frame number. The video stream is considered to be captured from a CCTV system camera mounted at the desired vantage point with a known frame rate. is a three-dimensional matrix with the dimensions , where and denote the frame’s height and width, respectively.

The video feed, , was passed into a series of functions . Each processes a video frame and produces different information as
| (1) |
where denotes an output, such as the locations of people, handshake interactions, or the presence of face masks. While the functions s process individual frames, processing a sequence of frames is required to analyze this information across time. Therefore, a collection of trackers was employed to track the above-mentioned detections provided by s over time as
| (2) |
where is the state and is the tracking interpretations based on the sequential information.
The list of functions utilized to obtain spatial information necessary for detecting and localizing persons, interactions, and face masks follows:
- 1.
People detection () and tracking ().
- 2.
Distance estimation () and group identification ().
- 3.
Identifying and localizing physical interaction (handshakes) ().
- 4.
Mask detection ().
The information retrieved by the aforementioned functions, which is critical for calculating the social distancing violation measure, was encoded in a graph . Sections 2.1–2.4 define the functionality of each system component that works together to populate the graph , while Section 2.5 offers a full explanation of the data contained in the graph. Finally, graph was interpreted in the manner described in Section 2.6 in order to provide actionable insights based on the threat level analysis of the analyzed video. For ease of understanding, the notations used in this work are listed in a table in Abbreviations.
2.1 People Detection and Tracking
This section discusses the proposed framework’s people detection and tracking models. The people in the scene were detected using the detection model and then tracked over different frames using the tracking model. The detection model used for this purpose provides a bounding box for the person’s position, whilst the tracking model assigns each person a unique ID and tracks them through time.
The detection model provides a time-varying vector containing information on people’s spatial location. It is defined as , where is the number of bounding boxes and is a five-tuple that represents the bounding box representing a person at time . In , variables and represent the two-dimensional coordinates of the bounding box’s center, represents the bounding box’s aspect ratio, represents the bounding box’s height, and represents the detection’s confidence level, as shown in Figure 2. The tracker assigns an ID and updates bounding box information based on previous and current data. The output of the tracker is defined as , where is a six-tuple representing updated bounding box information with assigned ID, , for th person.

Given its robustness and real-time prediction capabilities, the YOLO network Bochkovskiy et al. 2020 for people detection () and the DeepSORT algorithm Wojke et al. 2017 for tracking () were used in this paper. DeepSORT by itself handles minor occlusions for people by the Kalman filtering mechanism. We implement another level of interpolation to handle the missed detections on top of this. Given an image, the YOLO network predicts the bounding boxes of many predefined object classes that are present in a scene. Following that, the output is created by applying non-max suppression Canny 1986 and filtering the bounding boxes belonging to people. The DeepSORT algorithm then assigns indices, , to these detected bounding boxes using the Mahalanobis distance and the cosine similarity of the deep appearance descriptors. The publicly available weights trained using the COCO dataset Lin et al. 2014 were used to initialize the weights of the YOLO model, whereas the weights trained using the MOT dataset Dendorfer et al. 2020 were used to initialize the DeepSORT model.
2.2 Distance Estimation
This section discusses the method for estimating the distance between identified individuals. The distance between people was estimated in three steps: first, by identifying the people’s standing locations in the video, then by performing perspective transform and finally by measuring their Euclidean distance Jiang et al. 2010.
First, the standing locations of the people (denoted by thick black dots in Figure 3) were determined using the bounding box data as follows,
| (3) |
The standing locations were then transformed via perspective transform from an overhead wall mount camera viewpoint to a two-dimensional bird’s eye viewpoint. The required transformation matrix was obtained as follows,
| (4) | ||||
where the values are matrices that contain the coordinates of four reference points in the video frame (refer blue trapezoid in Figure 3—left) and the corresponding coordinates of those four points in the two-dimensional plane. This two-dimensional plane is referred to as the “floor plane” (refer Figure 3—right). The projections were performed as,
| (5) |
where are the input coordinates from (3) and are the output coordinates on the floor plane. Finally, the distances between each pair of people and in frame were calculated as
| (6) |
Since the detected bounding boxes of people cannot be directly used to estimate distances between people due to the overhead camera viewing angle, the estimation is performed after perspective transform. The transform is performed based on the following assumptions. These assumptions hold for most of the scenes with a CCTV camera.
- 1.
All the people are on the same plane.
- 2.
The camera is not a fisheye-like camera.
- 3.
The camera is placed at an overhead level.

2.3 Group Identification
The group identification model discussed in this section utilizes the people detection, tracking and distance estimation models introduced in Sections 2.1 and 2.2. This was achieved by two algorithms and . was run on the information from individual frames, while analyzed the results from across time to properly deduce which people fall into groups based on sustained physical proximity.
Given a frame , a matrix called the distance matrix is created based on the calculated distances between people. The affinity matrix was then calculated as follows,
| (7) |
where is an input parameter that is used to introduce the camera and scene pair to a scale. This parameter acts as a threshold for the closeness of people in the 2D projected plane prior to clustering. Then, clustering was performed on to split the people into clusters.
| (8) |
According to the group identification model, a person is considered to be a member of a group if they are close to at least one member of the group. While conventional clustering algorithms attempt to minimize the distance between individual elements and the cluster center, this is not how humans behave. As a result, this result was obtained using spectral clustering of affinity matrices Von Luxburg 2007. Human behavior, on the other hand, cannot be analyzed in terms of discrete frames. As a result, a temporal analysis of the clusters was performed to determine the actual groups of people using a time threshold . The primary idea is that a group is detected only if it persists for a specified time period .
People were being clustered from a video frame at time as follows,
| (9) |
| (10) |
where and were considered to be in the same social group as per Equation (10). Social distancing violations between the people in the same social group was ignored in the proposed system as justified in Section 1. For cases involving a few people, a simplified algorithm based on naive thresholding of interpersonal distance violation occurrences was used instead of spectral clustering. When spectral clustering was used, was picked so that a group should be in proximity for 10 s. For the thresholding case, people spending upwards of of the time in proximity were considered groups.
2.4 Mask Detection
This section describes the model used to detect the presence/absence of masks. The framework’s mask recognition stage entails identifying and tracking the presence (or absence) of masks. The model used for this purpose computes the bounding box of the face as well as the degree of confidence in the presence of a mask. As with prior object detection models, this model outputs a time-varying vector representing the spatial localization information for faces as , where is the number of face bounding boxes at time and is a five-tuple representation of the bounding box encompassing a detected face at time . The variables , , and have the same definitions as those in Section 2.1. The confidence measure is a two-tuple in which indicates the probability of the presence of a mask and indicates the absence. Similar to Section 2.1, the tracking model returns a vector of the same size containing tracked bounding boxes for each .
Similar to Section 2.1, the YOLO network was utilized for mask detection and the DeepSORT algorithm was utilized for tracking the masks across frames. The YOLO model was first initialized with the pre-trained COCO weights and then fine-tuned using the images from the Moxa3k dataset Roy et al. 2020 as well as the UT and UOP datasets, which were labeled for mask detection. The DeepSORT model used the weights trained using the MOT dataset Milan et al. 2016 for initialization. The DeepSORT algorithm handles minor occlusions of masks. However, another layer of interpolation (such as for people detection) was not implemented because the algorithm is supposed to detect when people remove masks (i.e., people cannot disappear while masks can).
2.5 Graph Representation
The information extracted using different models in Sections 2.1–2.4 need to be combined to provide meaningful insights into the threat level of the given scene. This is accomplished by encoding the data into a graph structure. This section describes how the graph structure is modeled using the different outputs from the models for interpretation.
The information retrieved from the video is stored as a time-varying graph given by
| (11) | ||||
| and | ||||
| (12) | ||||
| (13) | ||||
where is the set of vertices and is the set of edges at time . Each person is denoted by a vertex which contains the features representing the person extracted from the video as time-varying vertex parameters. The vertex is given by
| (14) |
where is a two-tuple that represents the position of the person at time obtained through perspective transform to a bird’s-eye view position on a 2D plane (refer to Section 2.2). is two-tuple, which shows the confidence level that a person is wearing a mask at time . This information is extracted from depending on the index (refer to Section 2.4). is a matrix that represents the probability that two people belong to the same group (refer to Section 2.3). The edge is a binary value (0/1) that represents the presence (denoted by 1) or absence (denoted by 0) of an interaction between person and at time detected using Hassan et al. 2021. is stored as a sparsely filled adjacency matrix with null values for instances where interactions are not detected. A visual example of a frame and its constructed graph is shown in Fig. 4.
2.6 Threat Quantification
The information extracted from the models described in the proposed system in Sections 2.1–2.5 needs to be processed from the created temporal graph in order to provide a quantifiable metric that denotes the risk of transmission for the given scene/frame. In this section, the derivation of the threat level function which quantifies the threat of the given frame is described in detail.
Table 2 contains a list of the parameters that contribute to the spread of COVID-19. The parameters are divided into two categories: primary and secondary parameters, which will be discussed further in this section using the threat level function. First, we calculate the threat level contribution of each pair of people in the frame at time as described in (16). Then, we find the threat level of the particular frame as per (15).
| (15) |
| (16) |
is the set of parameters that directly attributes to the transmission of COVID-19 from one person to another. This includes the distance between people and the handshake interactions. As the distance between people (people coming close) and their interactions (handshakes) play a primary role in the COVID-19 virus transmission, these values were first considered as the primary parameters . The probability of two people shaking hands and the probability of them coming extremely close were represented as scalar values in the range , where 1 represents a high probability of occurrence (for the distance probability, is used as the threshold distance for being extremely close in this study).
is the set of secondary parameters which are relevant only when two people are in close proximity, and in such a case, these parameters can increase or decrease the probability of COVID-19 transmission accordingly. This includes whether people are wearing masks, since two people not wearing masks is irrelevant if they are far apart, and whether the persons belong to the same group.

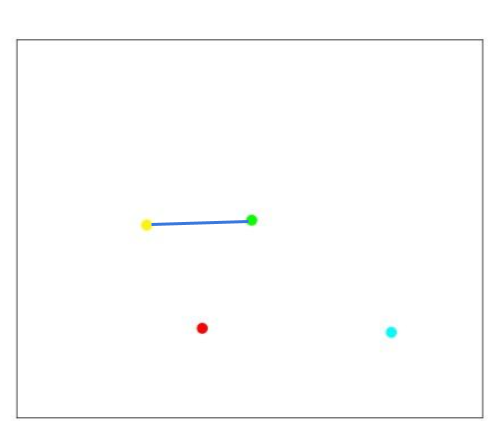
| Set | Notation | Description |
| Distance between people | ||
| Handshake interactions between people | ||
| People belonging to the same group | ||
| People wearing masks |
First, the mask-wearing probability was used to quantify the effect of masks in transmission. Furthermore, people belonging to the same group () have a similar effect on transmission, since it is assumed that the disease spread between them does not increase depending on what is happening in the video frame (it is more likely they were both infected or not, even before coming into the frame). The values of are in the range . is used as a tuneable parameter that dictates the influence of a particular parameter on the overall threat level. A higher value gives a lower significance to the corresponding in calculating the total threat . Because the influence of various factors varies depending on variations and different pandemics, the option can be used to change the influence of various parameters, and new parameters can be added to the threat-level equation based on consultations with appropriate authorities.
By substituting the parameters and setting , , the equation was rewritten as follows,
| (17) |
When analyzing the threat equation in Equation (16), it can be noted that when the secondary parameter probabilities decrease (i.e., ), the effect of the multiplicative term is higher. This implies that the effects of the primary parameters to the threat of the given scene are compounded when the two persons have worsening secondary parameters (i.e., are not wearing masks or when they are of different groups). It can also be observed that (17) does not carry any terms with the product. This could be intuitively understood because shaking hands requires them to be physically close, and thus, incorporating this term is redundant. While (17) is tuned for the implemented system, the generic form (16) can incorporate any number of parameters being extracted from a video scene.
3 Evaluation
In this section, we discuss the methodology used to evaluate the system. The proposed solution was executed on a chosen set of datasets as the input, and the results were evaluated using different metrics. The following subsections describe the datasets, the metrics, and the evaluation execution process in detail.
3.1 Datasets
Existing public datasets such as MOT Dendorfer et al. 2020; Milan et al. 2016; Leal-Taixé et al. 2015 and UT-interaction Ryoo and Aggarwal 2010 were chosen to evaluate the performance of the individual components of the system. However, there are no existing datasets to perform a holistic analysis. Thus, in order to analyze this, a new dataset was created from the University of Peradeniya premises, which is referred to as the UOP dataset.
The multiple object tracking (MOT) datasets are a set of image sequences with annotations for people localization and people IDs. Three datasets Dendorfer et al. 2020; Milan et al. 2016; Leal-Taixé et al. 2015 were used to evaluate the capability of an algorithm to uniquely identify and track a person through a video.
The University of Texas–Interaction (UTI) Ryoo and Aggarwal 2010; Ryoo and Aggarwal 2009 dataset comprises twenty video sequences of human interactions in two or four-people settings. The actions in the dataset include handshake, punch, point, kick, push and hug where each video spans roughly 1 min.
The UOP dataset Hassan et al. 2021 is a collection of ten video sequences that were collected from the University of Peradeniya premises by enacting a scene with human interactions such as handshakes, close contacts, and grouped conversations. These videos were recorded by a wall-mounted CCTV camera in the university corridor and waiting area. The video consists of either four or five persons, with each video spanning 1 min. The ground truth for this dataset was annotated manually for training and evaluation.
3.2 Evaluation Metrics
The outputs were evaluated on the given datasets based on the metrics average precision (AP) and the mean average precision (mAP). mAP is the key metric used in evaluating detector performance in prominent object detection tasks such as the PASCAL VOC challenge Everingham et al. 2010, COCO detection challenge Lin et al. 2014 and the Google Open Images competition Kuznetsova et al. 2018.
The average precision (AP) is the precision value averaged across different recall values between 0 and 1 Robertson 2008. This was computed as the area under the curve (AUC) of the precision vs. recall curve, which was plotted as a function of the confidence threshold of detection with a fixed intersection over union (IoU) for the bounding box threshold Padilla et al. 2020.
3.3 Model Evaluation
3.3.1 People Detection
The people detection component used here is the YOLO network, which is a well-established detector. Hence, no modifications were introduced to this segment of the detector. The YOLOv4 model which was used here is extensively compared in terms of frame rate and mAP in Shinde et al. 2018.
3.3.2 Group Identification
The group identification component was evaluated using the existing MOT datasets. Since the ground truth for the datasets considered in this work do not contain the group annotated information, an alternative methodology was required for evaluation. For this purpose, a visual inspection of frames was used to determine if two individuals belonged to the same group in a given frame.
3.3.3 Mask Detection
The mask detection component requires localized information about masks. Thus, the UT-interaction dataset was re-annotated. However, this dataset only consists of unmasked faces, and as such, the annotated UOP dataset was used together with the UT-interaction dataset to train and evaluate the mask detection component. The 17 videos from the UT-interaction dataset and the five videos from the UOP dataset were used for training. The dataset was annotated with the two class information: namely, masked and unmasked faces in frames, where the faces were visible and the presence of masks can be interpreted by a human.
The mask detection model was evaluated using both the AP and mAP measures. First, the model’s ability to localize the faces was determined by measuring the AP of the localization component of the models disregarding the class labels.
Next, the performance of the model in terms of both the localization and the accuracy was determined by the mean average precision (mAP) value. Note that since both the classes correspond to the same object (i.e., faces), this two-metric evaluation process helps us identify the specific shortcomings of the model considered. For instance, a high AP and a low mAP show poor mask detection (classification), whereas a high accuracy and low mAP denote poor face localization.
3.3.4 Threat Level Assessment (End-to-End System)
The threat level quantification algorithm was tested on the three datasets mentioned earlier. Since there is no publicly available ground truth for videos for this parameter, the results of the algorithm were evaluated by comparison with expert human input. For this purpose, 462 samples of frame pairs from video sequences were chosen. The system was then evaluated by observing the increment/decrement of the inferred threat level and comparing the results with the expert human input. The performance of the full system is evaluated using accuracy, precision, and recall.
The expert responses were obtained by showing a pair of frames and asking if the threat of COVID-19 spread has increased or decreased from the first frame to the second. Since a high disparity in identifying the impact of COVID-19 spread can exist amongst human experts in certain instances, ground truth cannot be established for such pairs of frames. To identify such instances, a thresholding minimum majority required to establish ground truth was set as 70%, and all frame pairs with a higher disparity (i.e., less than 70% majority) for any given choice were removed. In the evaluation conducted, five such frame pairs were identified and removed. One such frame pair is shown in Figure 5 to conclude this factor. As it can be observed, it is difficult to assess the change in threat for COVID-19 spread across these two frames.

4 Results and Discussion
The proposed system was implemented using the Python programming language alongside and Tensorflow and OpenCV libraries. The system is deployed on a high-performance computing server with NVIDIA GPU. The output of each component of the system as well as the final output of the entire system are discussed below.
4.1 People Detection and Tracking
The results shown in Figure 6 are indicative of the performance of the human detection and tracking segment of the proposed system. The first row shows a sequence of frames where people are detected properly and tracked with unique IDs. However, the model fails to perform satisfactorily in specific scenarios. The bottom row gives examples of the cases in which the model can fail. From left, (1) a person is not being identified because of occlusion, (2) the identified bounding box is smaller than the person due to occlusion, and (3) a person is going undetected due to the lack of contrast with the background. The model has an mAP = 65%.

As observed in Figure 6, a given frame from the output consists of multiple markings. The blue quadrilateral on the ground is the reference used for perspective transformation. The people detected are identified by uniquely colored rectangular bounding boxes. The location of each person in the 2D plane is marked using a black dot on the bottom edge of the respective bounding box. The threat level for the given frame is numerically displayed. Further details of the relevant markings will be discussed in the subsequent sections.
4.2 Distance Estimation
A scene consisting of four people from the UTI dataset is considered in Figure 7 to show how the distance between people contributes to the threat level. The distance between people is given by the distance activity matrix shown beside each frame in Figure 7. Each element (square) in the activity matrix denotes the proximity between the person IDs corresponding to the row and column indices. The color changes to a warmer shade (yellow) when the people are closer, and it becomes a colder shade (blue) when they are farther away.

Considering the frames in Figure 7, the person ID 2 and 3 can be observed to be closer in the second frame than in the first frame. This causes a higher contribution to the threat level between them in the second frame and a lower contribution to the threat level in the first frame. This is seen in the distance activity matrix by the blue shade turning to cyan, indicating closer proximity between those persons. The reader’s attention is drawn to the threat level shown in each frame. As it can be observed, when the distance activity matrix lightens up, the threat level has also risen.
The errors in people detection (Figure 6) can propagate to the distance estimation. While people going fully undetected is usually handled by interpolation, predicted bounding boxes becoming cropped due to the occlusion of feet leads to a faulty prediction for where the person’s feet are. Therefore, the calculation of distance between people becomes erroneous.
4.3 Group Identification
The results for a few frames for the group identification model are shown in Figure 8. An example from the UTI dataset and Oxford towncenter datasets is shown here. The frames with the persons detected are shown on the left and the group activity matrices showing the group characteristics are shown on the right. If two people are of the same group, the group activity matrix element corresponding to the row and column of the IDs of these two persons is shown in yellow, and otherwise, it is shown in blue. The people of the same group are also joined by a white line in the original frame to show this.
4.4 Mask Detection
Figure 9 shows the performance of the system in detecting the presence/absence of masks. One example from the UTI, UOP, and Moxa3K datasets is shown. Overall the system performs well while dealing with high-resolution images (Moxa3K). However, as the resolution drops (UTI/UOP), the efficacy reduces drastically. This can be observed in Table 3, which lists the numerical evaluation metrics (AP and mAP) for localization on different datasets. Another prominent failure case is when the proposed system is unable to detect the presence or the absence of masks when people face away from cameras.


| Dataset | AP/mAP /% |
| UT-interaction (Unmasked) | 29.30 |
| UOP (Masked) | 41.47 |
| Moxa3K | 81.04 |
4.5 Threat Level Assessment (End-to-End System)
To evaluate the proposed system performance, the threat level metric provided for each frame of a given scene is evaluated across multiple frames. The successful output of this value is evaluated by the full system for both datasets UTI (Figures 10–12) and Oxford (Figure 13). It should be noted that it is not the absolute values of the threat level that are significant but the increments or decrements between the frames.
Considering Figures 10–12, it can be observed that the threat level increases from top to bottom frames as 14.7, 16.9 and 20.0. From the first frame to the second frame (Figure 10 to Figure 11), we can see the distance activity matrix brightening in the right top and left bottom edges. This is due to the close proximity of persons ID 1 and 4. This leads to an increase in the threat level of the frame by 16.9 14.7 = 2.2. Similarly, when looking at the first and third frames (Figure 10 to Figure 12), this time, the interaction activity matrix brightens up in the third frame due to the handshake interaction in this frame. This also leads to an increase in threat level, which is by 20.0 14.7 = 5.3. It is also clearly observed in the threat activity matrix for the third frame in Figure 12, where the center squares brighten up to show a significant threat between persons 2 and 3. This increment (of 5.3) in the threat level is higher than the previous comparison (of 2.2) in Figure 10, and Figure 11 since the handshake interaction poses a higher threat than proximity alone. The same can be observed by comparing the second and third frames.
A simpler situation is analyzed in Figure 13. Here, there are only two people belonging to the same group, and they are present in the video throughout the time. However, there are no physical interactions such as shaking hands. Therefore, the only parameter that dictates the threat level is the number of people and their interpersonal distances in each frame. When analyzing Figure 13, the people in the first frame are moving away from each other until the second frame. This is why the threat level goes down from 95.0 to 46.0 from the first frame to the second. In the third frame, new people come into the frame, and they move closer to each other. Therefore, an increase in the threat level of 105.3 is observed. However, this dataset does not contain a rich set of scenes to evaluate all components of the proposed system.


4.6 Full System Evaluation
The performance of the full system in comparison to human expert responses is provided in Table 4 in terms of accuracy, precision, and recall. The complete system is evaluated on both the UTI and UOP datasets. However, it should be noted that the UTI dataset does not contain anyone wearing masks, and hence, the mask detection component does not contribute to the threat calculation here. It can be noted that the system performance is not biased toward either dataset and is able to generalize with considerable accuracy of nearly 76%.
| Test | Accuracy | Precision | Recall |
| UTI dataset | 75% | 75% | 75% |
| UOP dataset | 76% | 85% | 79% |
| Overall | 76% | 81% | 77% |
A few of the notable failure cases of the system are shown in Figures 14–17, where the threat level predicted was contrary to human expert opinion. Out of the four cases shown here, three of them failed to evaluate the proper threat value due to a failure in one of the components in the system pipeline. In Figure 14, the person indicated by the purple arrow was not detected by the person detection model due to occlusion. Similarly, in Figure 15, the two individuals hugging are detected as a single person. Since it is the proximity of the three individuals in Figure 14 and the hugging individuals in Figure 15 that pose a high threat to COVID-19 spread, the system fails to reflect this, deviating from the expert opinion. In Figure 16, the high proximity of the individuals in the first frame results in a high threat value for the first frame. However, the handshake interaction model fails to detect the interaction in the second frame, hence leading to a lower threat level output by the system and hence failing to identify the increase in threat for COVID-19 spread. In the case of Figure 17, since the system design was not accounted for incidents such as a pushing action as in the second frame, the system provides a higher threat value for the first frame contrary to human expert opinion.


However, there were a few rare cases where in retrospect, the system output was more plausible or instances where the failure of the system was unexplained. Considering Figure 18, the ground truth from human expert opinion was that the threat level decreases, which is explained by the handshake interaction in the first frame, which is a serious violation of social distancing protocols. However, the system output for threat value increases significantly in the second frame as a new person is identified in the far left. Since an increase in the number of people and the closer proximity of this new person in a given space should also be accounted for, this leads to the increased threat value predicted by the system. Meanwhile, Figure 19 is an instance where the system output states the threat of COVID-19 spread has increased, whereas human expert opinion is on the contrary. This deviation by the system is an edge case where the deviation is unexplained.


5 Conclusions
An end-to-end solution utilizing CCTV footage to provide a practical and versatile mechanism for monitoring crowds to identify possible instances of spreading COVID-19 is proposed in this paper. The proposed system detects people, their locations, their individual actions (wearing masks), and their dyadic interactions (handshakes) using deep learning-based video interpretation. This information is stored in temporal graphs to enable further insights such as identifying social groups. Finally, these temporal graphs undergo a more holistic interpretation using rule-based algorithms. This analysis uncovers the individual’s contributions to the spread of COVID-19 (not wearing masks) and pairwise contributions (handshakes, staying close to others) on a per frame basis. These results are brought together to calculate the total threat levels in frames. Finally, these outputs are examined against expert human opinion. Consistent accuracies over 75% across all datasets could be considered a strong indication of the robust performance of the proposed system.
Furthermore, this unified framework allows for the future incorporation of possible other future measures for curtailing the spread of COVID-19 or any other epidemics impacting the health and safety of society. Therefore, this proposed framework may be strengthened by incorporating additional COVID-19 specific features, and it could be adapted and adopted for similar other scenarios as well that may benefit from video or CCTV-based non-intrusive observations.
The proposed system evaluation is limited by the availability of datasets. While it was tested on existing datasets and a newly collected dataset, testing this on a wider range of diverse scenes is required. Moreover, threat level estimation is performed at the frame level. As a result, the contribution of the time of interactions such as approaching close to each other and shaking hands is not taken into account in our system. Future work could improve the system by processing the time series of the threat level (individual contributors such as interactions as well as the total score) by techniques such as moving averages and filtering.
Due to the widespread use of CCTV cameras, the proposed system is applicable to a wide variety of real-world scenarios. The decreasing performance-to-cost ratio of computing hardware has enabled even small organizations to acquire the system. The release of the codebase as free and open source software (FOSS) can accelerate both third-party deployment and solution improvement. However, concerns about privacy, bias, and fairness in conducting analytics on people’s CCTV footage should be addressed on an individual basis in accordance with the rules and regulations of individual organizations and countries.
Author Contributions
Conceptualization, G.J., J.H., S.S., R.G., P.E., V.H. J.E. and S.D.; Data curation, G.J., J.H. and S.S.; Formal analysis, G.J., J.H. and S.S.; Funding acquisition, R.G., P.E., V.H. J.E and S.D.; Methodology, G.J., J.H. and S.S.; Project administration, R.G., P.E., V.H. and J.E.; Software, G.J., J.H. and S.S.; Supervision, R.G., P.E., V.H., J.E. and S.D.; Validation, J.B.S., H.W.; Visualization, G.J., J.H., S.S., J.B.S., H.W.; Writing—original draft, G.J., J.H. and S.S.; Writing—review & editing, G.J., J.H., S.S., J.B.S., H.W., R.G., P.E., V.H. and J.E. All authors have read and agreed to the published version of the manuscript.
Funding
This work is funded by (1) International Development Research Centre (IDRC), Canada through grant number 109586-001 and (2) Lewis Power, Singapore. The APC was funded by IDRC as well.
Institutional Review Board Statement
Not applicable.
Informed Consent Statement
Informed consent was obtained from all subjects involved in the study for all stages including dataset creation and system evaluation.
Data Availability Statement
The data collecetd in this study could be requested from J.E. via email (ekanayakej@eng.pdn.ac.lk). The requests will be handled in a case by case basis.
Conflicts of Interest
The authors declare no conflict of interest. The funders had no role in the design of the study; in the collection, analyses, or interpretation of data; in the writing of the manuscript, or in the decision to publish the results.
Abbreviations
Notations and description.
| Notation | Definition |
| Input video feed | |
| , | People detection and tracking |
| Distance estimation | |
| , | Group identification and tracking |
| Identifying and localizing physical interaction (handshakes) | |
| , | Mask detection and tracking |
| Output of model | |
| State information | |
| , | Bounding box encompassing person at time and bounding box encompassing person at time which is being tracked with their unique index |
| , | Bounding box encompassing handshake interaction at time and bounding box encompassing handshake interaction at time which is being tracked with their unique index. |
| , | Bounding box encompassing the face of person at time and bounding box encompassing face of person at time which is being tracked with their unique index |
| The 2D coordinates of the center of the bounding box | |
| The height and aspect ratio of the bounding box | |
| The coordinates of the reference points in the video frame and two-dimensional floor plane, respectively | |
| Transformation matrix for the perspective transform from CCTV perspective to floor plane | |
| Standing location of person at time in the CCTV perspective | |
| Standing location of person at time in the floor plane | |
| Distance between a pair of people and at time | |
| Person in the frame | |
| Graph at time | |
| Vertices of graph at time given by , each vertex corresponding to person with the vertex parameters embedded | |
| Edges of graph at time given by , where is the edge between person(vertex) and | |
| Threat level of frame at time | |
| Primary parameters—set of parameters that have a direct attribute to COVID-19 transmission | |
| Secondary parameters—set of parameters that are relevant to COVID-19 transmission when two individuals are in close proximity | |
| Tuneable parameter dictating influence of parameter on overall threat level. |
References
- Zhao et al. (2020) Zhao, D.; Yao, F.; Wang, L.; Zheng, L.; Gao, Y.; Ye, J.; Guo, F.; Zhao, H.; Gao, R. A comparative study on the clinical features of coronavirus 2019 (COVID-19) pneumonia with other pneumonias. Clin. Infect. Dis. 2020, 71, 756–761.
- Long et al. (2020) Long, B.; Brady, W.J.; Koyfman, A.; Gottlieb, M. Cardiovascular complications in COVID-19. Am. J. Emerg. Med. 2020, 38, 1504–1507.
- Ellul et al. (2020) Ellul, M.A.; Benjamin, L.; Singh, B.; Lant, S.; Michael, B.D.; Easton, A.; Kneen, R.; Defres, S.; Sejvar, J.; Solomon, T. Neurological associations of COVID-19. Lancet Neurol. 2020, 19, 767–783.
- Lopez Bernal et al. (2021) Lopez Bernal, J.; Andrews, N.; Gower, C.; Gallagher, E.; Simmons, R.; Thelwall, S.; Stowe, J.; Tessier, E.; Groves, N.; Dabrera, G.; et al. Effectiveness of Covid-19 Vaccines against the B.1.617.2 (Delta) Variant. N. Engl. J. Med. 2021, 385, 585–594. https://doi.org/10.1056/NEJMoa2108891.
- McCallum et al. (2021) McCallum, M.; Bassi, J.; De Marco, A.; Chen, A.; Walls, A.C.; Di Iulio, J.; Tortorici, M.A.; Navarro, M.J.; Silacci-Fregni, C.; Saliba, C.; et al. SARS-CoV-2 immune evasion by variant B. 1.427/B. 1.429. Science 2021, 373, 648–654. https://doi.org/10.1126/science.abi7994.
- Olliaro et al. (2021) Olliaro, P.; Torreele, E.; Vaillant, M. COVID-19 vaccine efficacy and effectiveness—The elephant (not) in the room. Lancet Microbe 2021, 2, 279–2809.
- Pormohammad et al. (2021) Pormohammad, A.; Zarei, M.; Ghorbani, S.; Mohammadi, M.; Razizadeh, M.H.; Turner, D.L.; Turner, R.J. Efficacy and Safety of COVID-19 Vaccines: A Systematic Review and Meta-Analysis of Randomized Clinical Trials. Vaccines 2021, 9, 467.
- Abdullahi et al. (2020) Abdullahi, L.; Onyango, J.J.; Mukiira, C.; Wamicwe, J.; Githiomi, R.; Kariuki, D.; Mugambi, C.; Wanjohi, P.; Githuka, G.; Nzioka, C.; et al. Community interventions in Low—And Middle-Income Countries to inform COVID-19 control implementation decisions in Kenya: A rapid systematic review. PLoS ONE 2020, 15, e0242403. https://doi.org/10.1371/journal.pone.0242403.
- Mukerjee et al. (2021) Mukerjee, S.; Chow, C.M.; Li, M. Mitigation strategies and compliance in the COVID-19 fight; how much compliance is enough? PLoS ONE 2021, 16, e0239352. https://doi.org/10.1371/journal.pone.0239352.
- Kashem et al. (2021) Kashem, S.B.; Baker, D.M.; González, S.R.; Lee, C.A. Exploring the nexus between social vulnerability, built environment, and the prevalence of COVID-19: A case study of Chicago. Sustain. Cities Soc. 2021, 75, 103261.
- Ugail et al. (2021) Ugail, H.; Aggarwal, R.; Iglesias, A.; Howard, N.; Campuzano, A.; Suárez, P.; Maqsood, M.; Aadil, F.; Mehmood, I.; Gleghorn, S.; et al. Social distancing enhanced automated optimal design of physical spaces in the wake of the COVID-19 pandemic. Sustain. Cities Soc. 2021, 68, 102791.
- Ren et al. (2021) Ren, C.; Xi, C.; Wang, J.; Feng, Z.; Nasiri, F.; Cao, S.J.; Haghighat, F. Mitigating COVID-19 infection disease transmission in indoor environment using physical barriers. Sustain. Cities Soc. 2021, 74, 103175.
- Srivastava et al. (2021) Srivastava, S.; Zhao, X.; Manay, A.; Chen, Q. Effective ventilation and air disinfection system for reducing Coronavirus Disease 2019 (COVID-19) infection risk in office buildings. Sustain. Cities Soc. 2021, 75, 103408.
- Grekousis and Liu (2021) Grekousis, G.; Liu, Y. Digital contact tracing, community uptake, and proximity awareness technology to fight COVID-19: A systematic review. Sustain. Cities Soc. 2021, 71, 102995.
- Bian et al. (2020) Bian, S.; Zhou, B.; Bello, H.; Lukowicz, P. A wearable magnetic field based proximity sensing system for monitoring COVID-19 social distancing. In Proceedings of the 2020 International Symposium on Wearable Computers, Virtual Event, 12–17 September 2020; pp. 22–26.
- Fazio et al. (2020) Fazio, M.; Buzachis, A.; Galletta, A.; Celesti, A.; Villari, M. A proximity-based indoor navigation system tackling the COVID-19 social distancing measures. In Proceedings of the IEEE Symposium on Computers and Communications, Rennes, France, 7–10 July 2020. https://doi.org/10.1109/ISCC50000.2020.9219634.
- Shafiee et al. (2017) Shafiee, M.J.; Chywl, B.; Li, F.; Wong, A. Fast YOLO: A fast you only look once system for real-time embedded object detection in video. arXiv 2017, arXiv:1709.05943.
- Wojke et al. (2017) Wojke, N.; Bewley, A.; Paulus, D. Simple online and realtime tracking with a deep association metric. In Proceedings of the 2017 IEEE International Conference on Image Processing (ICIP), Beijing, China, 17–20 September 2017; pp. 3645–3649. https://doi.org/10.1109/ICIP.2017.8296962.
- Chen et al. (2019) Chen, R.C. Automatic License Plate Recognition via sliding-window darknet-YOLO deep learning. Image Vis. Comput. 2019, 87, 47–56.
- Ye et al. (2020) Ye, X.Y.; Hong, D.S.; Chen, H.H.; Hsiao, P.Y.; Fu, L.C. A two-stage real-time YOLOv2-based road marking detector with lightweight spatial transformation-invariant classification. Image Vis. Comput. 2020, 102, 103978.
- Chiang et al. (2021) Chiang, S.H.; Wang, T.; Chen, Y.F. Efficient pedestrian detection in top-view fisheye images using compositions of perspective view patches. Image Vis. Comput. 2021, 105, 104069. https://doi.org/10.1016/j.imavis.2020.104069.
- Wu et al. (2020) Wu, D.; Lv, S.; Jiang, M.; Song, H. Using channel pruning-based YOLO v4 deep learning algorithm for the real-time and accurate detection of apple flowers in natural environments. Comput. Electron. Agric. 2020, 178, 105742.
- Ansari and Singh (2021) Ansari, M.A.; Singh, D.K. Monitoring social distancing through human detection for preventing/reducing COVID spread. Int. J. Inf. Technol. 2021, 13, 1255–1264.
- Ahmed et al. (2021a) Ahmed, I.; Ahmad, M.; Jeon, G. Social distance monitoring framework using deep learning architecture to control infection transmission of COVID-19 pandemic. Sustain. Cities Soc. 2021, 69, 102777.
- Ahmed et al. (2021b) Ahmed, I.; Ahmad, M.; Rodrigues, J.J.; Jeon, G.; Din, S. A deep learning-based social distance monitoring framework for COVID-19. Sustain. Cities Soc. 2021, 65, 102571.
- Qin and Xu (2021) Qin, J.; Xu, N. Reaserch and implementation of social distancing monitoring technology based on SSD. Procedia Comput. Sci. 2021, 183, 768–775.
- Rahim et al. (2021) Rahim, A.; Maqbool, A.; Rana, T. Monitoring social distancing under various low light conditions with deep learning and a single motionless time of flight camera. PLoS ONE 2021, 16, e0247440.
- Su et al. (2021) Su, J.; He, X.; Qing, L.; Niu, T.; Cheng, Y.; Peng, Y. A novel social distancing analysis in urban public space: A new online spatio-temporal trajectory approach. Sustain. Cities Soc. 2021, 68, 102765.
- Rezaei and Azarmi (2020) Rezaei, M.; Azarmi, M. Deepsocial: Social distancing monitoring and infection risk assessment in covid-19 pandemic. Appl. Sci. 2020, 10, 1–29. https://doi.org/10.3390/app10217514.
- Yang et al. (2021) Yang, D.; Yurtsever, E.; Renganathan, V.; Redmill, K.A.; Özgüner, Ü. A vision-based social distancing and critical density detection system for COVID-19. Sensors 2021, 21, 4608.
- Punn et al. (2020) Punn, N.S.; Sonbhadra, S.K.; Agarwal, S. Monitoring COVID-19 social distancing with person detection and tracking via fine-tuned YOLO v3 and Deepsort techniques. arXiv 2020, arXiv:2005.01385.
- Eikenberry et al. (2020) Eikenberry, S.E.; Mancuso, M.; Iboi, E.; Phan, T.; Eikenberry, K.; Kuang, Y.; Kostelich, E.; Gumel, A.B. To mask or not to mask: Modeling the potential for face mask use by the general public to curtail the COVID-19 pandemic. Infect. Dis. Model. 2020, 5, 293–308.
- Kampf (2020) Kampf, G. Potential role of inanimate surfaces for the spread of coronaviruses and their inactivation with disinfectant agents. Infect. Prev. Pract. 2020, 2, 100044.
- Warnes et al. (2015) Warnes, S.L.; Little, Z.R.; Keevil, C.W. Human coronavirus 229E remains infectious on common touch surface materials. MBio 2015, 6, e01697-15.
- Roy et al. (2020) Roy, B.; Nandy, S.; Ghosh, D.; Dutta, D.; Biswas, P.; Das, T. Moxa: A deep learning based unmanned approach for real-time monitoring of people wearing medical masks. Trans. Indian Natl. Acad. Eng. 2020, 5, 509–518.
- Mohan et al. (2021) Mohan, P.; Paul, A.J.; Chirania, A. A tiny CNN architecture for medical face mask detection for resource-constrained endpoints. In Innovations in Electrical and Electronic Engineering; Springer: Berlin/Heidelberg, Germany, 2021; pp. 657–670.
- Loey et al. (2021) Loey, M.; Manogaran, G.; Taha, M.H.N.; Khalifa, N.E.M. Fighting against COVID-19: A novel deep learning model based on YOLO-v2 with ResNet-50 for medical face mask detection. Sustain. Cities Soc. 2021, 65, 102600.
- Wu et al. (2022) Wu, P.; Li, H.; Zeng, N.; Li, F. FMD-Yolo: An efficient face mask detection method for COVID-19 prevention and control in public. Image Vis. Comput. 2022, 117, 104341. https://doi.org/10.1016/j.imavis.2021.104341.
- Hassan et al. (2021) Hassan, A.; Sritharan, S.; Jayatilaka, G.; Godaliyadda, R.I.; Ekanayake, P.B.; Herath, V.; Ekanayake, J.B. Hands Off: A Handshake Interaction Detection and Localization Model for COVID-19 Threat Control. arXiv 2021, arXiv:2110.09571.
- Shinde et al. (2018) Shinde, S.; Kothari, A.; Gupta, V. YOLO based human action recognition and localization. Procedia Comput. Sci. 2018, 133, 831–838.
- Sefidgar et al. (2015) Sefidgar, Y.S.; Vahdat, A.; Se, S.; Mori, G. Discriminative key-component models for interaction detection and recognition. Comput. Vis. Image Underst. 2015, 135, 16–30.
- Van Gemeren et al. (2018) Van Gemeren, C.; Poppe, R.; Veltkamp, R.C. Hands-on: Deformable pose and motion models for spatiotemporal localization of fine-grained dyadic interactions. EURASIP J. Image Video Process. 2018, 2018, 16.
- Jones et al. (2020) Jones, N.R.; Qureshi, Z.U.; Temple, R.J.; Larwood, J.P.; Greenhalgh, T.; Bourouiba, L. Two metres or one: What is the evidence for physical distancing in covid-19? BMJ 2020, 370. https://doi.org/10.1136/bmj.m3223.
- Kwon et al. (2021) Kwon, S.; Joshi, A.D.; Lo, C.H.; Drew, D.A.; Nguyen, L.H.; Guo, C.G.; Ma, W.; Mehta, R.S.; Shebl, F.M.; Warner, E.T.; et al. Association of social distancing and face mask use with risk of COVID-19. Nat. Commun. 2021, 12, 3737.
- Durkin et al. (2021) Durkin, J.; Jackson, D.; Usher, K. Touch in times of COVID-19: Touch hunger hurts. J. Clin. Nurs. 2021, 30, e4–e5.
- Qian and Jiang (2020) Qian, M.; Jiang, J. COVID-19 and social distancing. J. Public Health 2020, 30, 259–261.
- Verani et al. (2020) Verani, A.; Clodfelter, C.; Menon, A.N.; Chevinsky, J.; Victory, K.; Hakim, A. Social distancing policies in 22 African countries during the COVID-19 pandemic: A desk review. Pan Afr. Med J. 2020, 37, 46.
- Bochkovskiy et al. (2020) Bochkovskiy, A.; Wang, C.Y.; Liao, H.Y.M. YOLOv4: Optimal Speed and Accuracy of Object Detection. arXiv 2020, arXiv:2004.10934.
- Canny (1986) Canny, J. A computational approach to edge detection. IEEE Trans. Pattern Anal. Mach. Intell. 1986, PAMI-8, 679–698.
- Lin et al. (2014) Lin, T.Y.; Maire, M.; Belongie, S.; Hays, J.; Perona, P.; Ramanan, D.; Dollár, P.; Zitnick, C.L. Microsoft coco: Common objects in context. In Proceedings of the European Conference on Computer Vision; Springer: Berlin/Heidelberg, Germany, 2014; pp. 740–755.
- Dendorfer et al. (2020) Dendorfer, P.; Rezatofighi, H.; Milan, A.; Shi, J.; Cremers, D.; Reid, I.; Roth, S.; Schindler, K.; Leal-Taixé, L. Mot20: A benchmark for multi object tracking in crowded scenes. arXiv 2020, arXiv:2003.09003.
- Jiang et al. (2010) Jiang, Y.; Gao, F.; Xu, G. Computer vision-based multiple-lane detection on straight road and in a curve. In Proceedings of the 2010 International Conference on Image Analysis and Signal Processing, Zhejiang, China, 9–11 April 2010; pp. 114–117.
- Von Luxburg (2007) Von Luxburg, U. A tutorial on spectral clustering. Stat. Comput. 2007, 17, 395–416.
- Milan et al. (2016) Milan, A.; Leal-Taixé, L.; Reid, I.; Roth, S.; Schindler, K. MOT16: A benchmark for multi-object tracking. arXiv 2016, arXiv:1603.00831.
- Leal-Taixé et al. (2015) Leal-Taixé, L.; Milan, A.; Reid, I.; Roth, S.; Schindler, K. Motchallenge 2015: Towards a benchmark for multi-target tracking. arXiv 2015, arXiv:1504.01942.
- Ryoo and Aggarwal (2010) Ryoo, M.S.; Aggarwal, J.K. UT-Interaction Dataset, ICPR contest on Semantic Description of Human Activities (SDHA). 2010. Available online: http://cvrc.ece.utexas.edu/SDHA2010/Human_Interaction.html (accessed on).
- Ryoo and Aggarwal (2009) Ryoo, M.S.; Aggarwal, J.K. Spatio-Temporal Relationship Match: Video Structure Comparison for Recognition of Complex Human Activities. In Proceedings of the IEEE International Conference on Computer Vision (ICCV), Kyoto, Japan, 29 September–2 October 2009.
- Everingham et al. (2010) Everingham, M.; Van Gool, L.; Williams, C.K.; Winn, J.; Zisserman, A. The pascal visual object classes (voc) challenge. Int. J. Comput. Vis. 2010, 88, 303–338.
- Kuznetsova et al. (2018) Kuznetsova, A.; Rom, H.; Alldrin, N.; Uijlings, J.; Krasin, I.; Pont-Tuset, J.; Kamali, S.; Popov, S.; Malloci, M.; Kolesnikov, A.; et al. The open images dataset v4: Unified image classification, object detection, and visual relationship detection at scale. arXiv 2018, arXiv:1811.00982.
- Robertson (2008) Robertson, S. A new interpretation of average precision. In Proceedings of the 31st Annual International ACM SIGIR Conference on Research and Development in Information Retrieval, Singapore, 20–24 July 2008; pp. 689–690.
- Padilla et al. (2020) Padilla, R.; Netto, S.L.; da Silva, E.A.B. A Survey on Performance Metrics for Object-Detection Algorithms. In Proceedings of the 2020 International Conference on Systems, Signals and Image Processing (IWSSIP), Niteroi, Brazil, 1–3 July 2020; pp. 237–242.