ScaleVLAD: Improving Multimodal Sentiment Analysis via
Multi-Scale Fusion of Locally Descriptors
Abstract
Fusion technique is a key research topic in multimodal sentiment analysis. The recent attention-based fusion demonstrates advances over simple operation-based fusion. However, these fusion works adopt single-scale, i.e., token-level or utterance-level, unimodal representation. Such single-scale fusion is suboptimal because that different modality should be aligned with different granularities. This paper proposes a fusion model named ScaleVLAD to gather multi-Scale representation from text, video, and audio with shared Vectors of Locally Aggregated Descriptors to improve unaligned multimodal sentiment analysis. These shared vectors can be regarded as shared topics to align different modalities. In addition, we propose a self-supervised shifted clustering loss to keep the fused feature differentiation among samples. The backbones are three Transformer encoders corresponding to three modalities, and the aggregated features generated from the fusion module are feed to a Transformer plus a full connection to finish task predictions. Experiments on three popular sentiment analysis benchmarks, IEMOCAP, MOSI, and MOSEI, demonstrate significant gains over baselines.
1 Introduction
Multimodal Sentiment Analysis (MSA) has been a hot research direction with the increasing number of user-generated videos available on online platforms such as YouTube and Facebook in recent years Poria et al. 2020; Tsai et al. 2019; Zadeh et al. 2017.
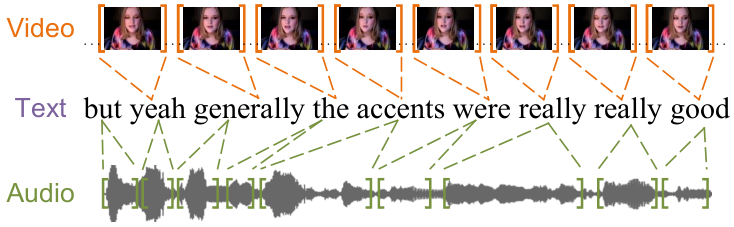
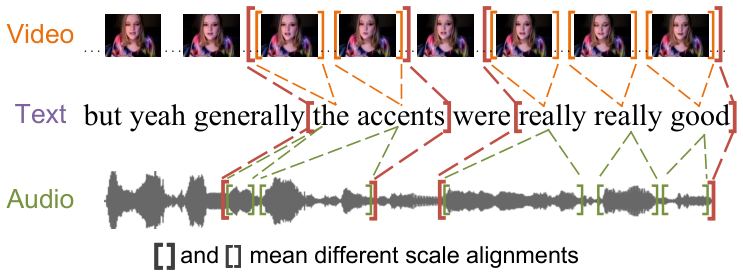
Its main objective is to identify sentiment and emotion with multimodal signals such as textual, visual, and acoustic information. Compared with unimodal sentiment analysis, multimodal fusion can provide more comprehensive information and capture more emotional characteristics, which leads to robust and salient improvements Yang, Xu, and Gao 2020; Yu et al. 2021. For example, to judge the sentiment of this movie is sick is a non-trivial task due to the existing language ambiguity only from this sentence, and if given the acoustic and visual modalities, e.g., a loud voice and a smile, this sentence will certainly be predicted as positive Zadeh et al. 2017; Wang, Wan, and Wan 2020.
There are two main components in multimodal sentiment analysis: unimodal representation and information fusion. For the unimodal representation, there are some off-the-shelf methods. These methods are elaborate and specialized for each modality or can be improved with pretraining on extra pure datasets, e.g., MFCC for audio and BERT encoding for text Devlin et al. 2019. Thus, multimodal information fusion is the key to affect performance Poria et al. 2020; Zhang et al. 2020. Most of the works focus on investigating effective multimodal fusion. These fusion methods can be categorized into including but not limited to simple operation-based Poria et al. 2016, attention-based Zadeh et al. 2018c; Gu et al. 2018; Akhtar et al. 2019; Han et al. 2021; Rahman et al. 2020, tensor-based Zadeh et al. 2017, translation-based Pham et al. 2019; Wang, Wan, and Wan 2020; Mai, Hu, and Xing 2020, GANs-based Peng and Qi 2019, graph-based Yang et al. 2021, and routing-based methods Tsai et al. 2020. The fusion target is to learn a modality-invariant embedding space, then use the modality-invariant feature or integrate the modality-invariant with modality-specific features to finish the final prediction.
However, most of the fusion methods either adopt the token-level or the utterance-level unimodal representation. Such a single-scale fusion is suboptimal because different modalities need to align with different granularities. For example, the ‘really really good’ shown in Figure 1. The single-scale alignment of the three tokens can not capture the intense emotion. Instead, they should be regarded as an entirety shown in Figure 1(b). Besides, the visual and acoustic features do not have apparent semantic boundaries due to variable sampling rates, leading to inherent data non-alignment for each modality Tsai et al. 2019. Although the attention-based methods can make each token in one modality cover long-range contexts in other modalities, they are still single-scale alignment and can not capture many tokens-to-many tokens relationship.
To this end, we propose a multi-scale fusion method called ScaleVLAD to gather multi-Scale representation from text, video, and audio with shared Vectors of Locally Aggregated Descriptors to address the unaligned multimodal sentiment analysis. Instead of detecting the boundary of different semantic scales in each modality, ScaleVLAD utilizes learnable shared latent semantic vectors to select and aggregate the modality features automatically. These latent semantic vectors, regarded as different semantic topics, are shared across different modalities and scales. Thus they can reduce the semantic gap between modalities and align various scale features naturally. In our implementation, we use three Transformer-based modules Vaswani et al. 2017 to extract unimodal representation from text, video, and audio, respectively. Then, the unimodal feature sequences are fed to the ScaleVLAD module with different scales of shifted windows. The aggregated features from the ScaleVLAD module are used to predict the final output via a Transformer and a full connection layer. Figure 2 shows the main structure of the proposed ScaleVLAD. Besides, to keep the differentiation of the fused feature among samples and leverage label information effectively, we propose a self-supervised shifted clustering loss to train the model jointly. This loss will pull clusters of samples belonging to the same category (or close score) together in embedding space. The contribution of this paper can be summarized as follows:
1) We propose a multi-scale fusion method ScaleVLAD to address the unaligned multimodal sentiment analysis. It is a flexible approach to fuse unimodal representation with a multi-scale perspective.
2) We propose a self-supervised shifted clustering loss to keep the fused feature differentiation among samples and leverage label information effectively.
3) We report new records on three benchmark datasets, including IEMOCAP Busso et al. 2008, CMU-MOSI Zadeh et al. 2016, and CMU-MOSEI Zadeh et al. 2018b. Extensive experiments validate the effectiveness of ScaleVLAD.
2 Related Works
2.1 Multimodal Sentiment Analysis
In recent years, multimodal sentiment analysis has become a popular research topic as the increasing of user-generated multimedia data on online communities, blogs, and multimedia platforms. It mainly focuses on integrating multiple heterogeneous resources, such as textual, visual, and acoustic signals to comprehend varied human emotions Morency, Mihalcea, and Doshi 2011; Poria et al. 2020. Previous researchers mainly focus on unimodal representation learning and multimodal fusion. For the unimodal representation, Hazarika, Zimmermann, and Poria 2020 attempted to factorize modality features in joint spaces and presented modality-invariant and modality-specific representations across different modalities. Yu et al. 2021 designed a unimodal label generation strategy based on the self-supervised approach to acquire information-rich unimodal representations by learning one multimodal task and three unimodal subtasks. Wang et al. 2019 constructed a recurrent attended variation embedding network to model the fine-grained structure of nonverbal sub-word sequences and dynamically shift word representations based on nonverbal cues.
For the multimodal fusion, the previous methods can be divide into simple operation-based Poria et al. 2016, attention-based Zadeh et al. 2018c; Gu et al. 2018; Akhtar et al. 2019; Han et al. 2021; Rahman et al. 2020, tensor-based Zadeh et al. 2017; Verma et al. 2019; Verma et al. 2020, translation-based Pham et al. 2019; Wang, Wan, and Wan 2020; Mai, Hu, and Xing 2020, GANs-based Peng and Qi 2019, graph-based Yang et al. 2021; Mai et al. 2020, and routing-based methods Tsai et al. 2020, etc. Some works assumed the given multimodal sequences are aligned with each word’s boundary Pham et al. 2019; Gu et al. 2018; Dumpala et al. 2019; Rahman et al. 2020. However, some modalities, e.g., video and audio, exist inherent data non-alignment due to variable sampling rates. Thus, modeling unaligned multimodal sequences is more flexible and practical. Tsai et al. 2019; Yang, Xu, and Gao 2020; Siriwardhana et al. 2020 used multiple cross-modal Transformers to model unaligned multimodal language sequences. Yang et al. 2021 proposed a parameter-efficient and interpretable graph-based neural model by integrating an efficient trimodal-temporal graph fusion operation and dynamic pruning technique.

This paper aims at unaligned multimodal sentiment analysis. Unlike previous studies adopting the token-level or the utterance-level unimodal representation, we propose a multi-scale fusion method to align different granularity information from multiple modalities.
2.2 VLAD, Vector of Locally Aggregated Descriptors
The Vector of Locally Aggregated Descriptors (VLAD) Jégou et al. 2010; Arandjelovic and Zisserman 2013 has achieved great impacts in aggregating discriminative features for various scenarios, including video retrieval and video classification. NetVLAD Arandjelovic et al. 2016 extending from the VLAD is an end-to-end differentiable layer that could be readily plugged into many existing neural models. This paper borrows the idea of VLAD and NetVLAD to align different modalities, e.g., text, video, and audio, instead of using to be as a discriminative feature learner. Wang, Zhu, and Yang 2021 has a similar motivation that leverages NetVLAD to reduce the gap of locally learned features from texts and videos. However, their objective is for text-video local similarity matching, and we have a different target. Besides, we introduce multi-scale features for enhanced fusion performance. Hausler et al. 2021 also presents a multi-scale fusion by deriving patch-level features from NetVLAD residuals. However, it is designed for place recognition and only on visual modality. We focus on unaligned multimodal sentiment analysis and involves text, video, and audio modalities.
3 Framework
Given a set of multimodal signals including text , video clips , and audios , the target is to predict their sentiment. Specifically, these signals can be regarded as a set of triplets , where , and . The , , and contain a sequence of tokens, respectively, such that , , and , where is word token, is visual feature, and denotes acoustic feature. We regard the visual features and acoustic features as tokens for a consistent description with the word tokens. Multimodal sentiment analysis aims to learn a function to get the sentiment score or emotion category. The function learning can be regarded as either a regression or a classification task.
Figure 2 demonstrates our framework. We focus on the multi-scale fusion module and a training loss, S3C loss, in this paper. Besides, three unimodal encoders, a text encoder, a video encoder, and an audio encoder, are also introduced in detail in this section.
3.1 Modality Representation Learning
The unimodality representation is the footstone of this model and will affect the performance of the subsequential fusion module. We use Transformer Vaswani et al. 2017 with different layers to encode original text , raw video feature sequence , and raw audio feature sequence , where and are the dimensions of the raw feature. The raw video feature and raw audio feature are extracted with pretrained toolkits following previous works Zadeh et al. 2017; Yu et al. 2021. For the text encoder, we use the pretrained 12-layers BERT Devlin et al. 2019 and 12-layers T5 Raffel et al. 2020 to extract text representation since the tremendous success of the pre-trained language model on many downstream NLP tasks, where is the dimension of the text representation.
| (1) |
where means the Transformer-based text encoder, e.g., BERT and T5 in our implementation.
Similarly, the video feature sequence and audio feature sequence can be calculated with and respectively as follows,
| (2) | |||
| (3) |
where and are Transformer-based video encoder and Transformer-based audio encoder, respectively, both of them are randomly initialized. and are the dimension of the video feature and audio feature, respectively.
3.2 ScaleVLAD Module
After generating the unimodality representation, the framework comes to the fusion module. We propose a multi-scale fusion method to cover different granularities of unimodality representation in this paper. Different full connection layers are used for the generated , , and to map the hidden size to a common size before the following modules if their current hidden sizes are not equal to this value. When considering the fusion of the three unimodality features, especially with different granularities, a core problem is aligning different semantic units. However, the semantic unit of each unimodality has no clear alignment boundary and can not be fused directly. A feasible approach is to assume some shared semantic vectors among these unimodality features and align them to these shared anchors. Such shared vectors can be regarded as shared topics and can also be shared across different unimodality scales.
Motivated by this spirit and Inspired by the VLAD and NetVLAD, we propose a ScaleVLAD module to fuse different unimodality representations. The different scale information of unimodality is generated by mean pooling with different kernel size (the stride size is the same as the kernel size) in our implementation. Specifically, for -scale unimodality representation , the scaled features can be denoted as , where is generated via mean pooling with kernel size . The is equal to when . Assuming there are shared semantic vectors with dimension. The similarity between the -scale feature and the shared vectors can be calculated by dot-product operation following Arandjelovic et al. 2016,
| (4) |
where and are learnable biases, the shared semantic vectors are jointly learned with the whole model. Then the aggregated feature on each vector can be generated as follows,
| (5) | ||||
| (6) |
where has the same size as , and using two groups of similar vectors increases the adaptation capability as described in Arandjelovic et al. 2016. The output can be regarded as the aligned feature for unimodality with -scale. Thus, the aggregated feature corresponding to can be generated as follows,
| (7) | ||||
| (8) |
where stack is a stack operation and , and () are learnable weights and biases, GELU and LN are GELU activate function Hendrycks and Gimpel 2016 and Layer Normalization operation Ba, Kiros, and Hinton 2016, respectively.
The fusion and prediction are conducted on the multi-scale aggregated features . We stack all the representation with different scales together to get representation matrix, , where means the number of scales, is the mean pooling result on . After obtaining , a randomly initialized Transformer encoder is utilized to interact the learned multi-scale representation:
| (9) |
Finally, the score or probability can be calculated as,
| (10) | ||||
| (11) |
where is the max pooling result of , and are learnable weights and biases, is the number of categories for classification task or 1 for regression task.
3.3 S3C Loss, Self-supervised Shifted Clustering Loss
Beyond proposing the ScaleVLAD module to capture and align different granularities of unimodality representation, we proposed an extra self-supervised shifted clustering loss (S3C Loss) to keep the differentiation of the fused feature among samples and to leverage label information effectively.
For the fusion feature of each sample from Eq. (10), we first perform -means to obtain clusters11 1 We use the Faiss (https://github.com/facebookresearch/faiss) to finish clustering in our implementation.. We refer to the -th cluster center as and refer to all cluster centers as a matrix . The clustering operation is calculated on all representations of training samples at each epoch beginning. For the same sample in the running epoch, we assign its cluster center index as a classified label. The S3C Loss can be obtained as follows,
| (12) | ||||
| (13) |
where means the one-hot vector with length and its -th value is 1, is the number of training samples.
This loss is self-supervised but the clustering centers are not stable at the beginning of the training stage. So we set a start epoch to train with instead of optimizing it from training beginning. Such a setting makes the features used for clustering semantically relate to the group-truth labels. To make the cluster centers stable, we adopt a shifted update with a momentum parameter as and use to replace at each iteration. The is set as a constant of 0.99 in our experiments. The clustering loss makes the fusion features differentiate in the embedding space.
To improve the weak robustness caused by the unknown ground-truth cluster number of the fusion space, we design multiple clustering, e.g., with clusters and clusters. Thus, the will be replaced by , where means with clusters.
3.4 Training Objectives
The overall objective of the model is to minimize:
| (14) |
where is the S3C Loss, and is the task loss. The task loss has different formulations for the classification task and regression task. For the classification task, we use cross-entropy error with in Eq. (11) as , where means the one-hot vector of . For the regression task, we use mean MSE as the training objective as . is the category for classification or the score for regression, and is the number of training samples.
4 Experiments
We conduct experiments to evaluate the effectiveness of the proposed framework. The datasets, experimental settings, and results are introduced in this section.
4.1 Datasets
We evaluate our framework on three benchmark datasets, IEMOCAP Busso et al. 2008, CMU-MOSI Zadeh et al. 2016, and CMU-MOSEI Zadeh et al. 2018b. These datasets provide unaligned language, visual, and acoustic signals for multimodal sentiment analysis.
IEMOCAP IEMOCAP Busso et al. 2008 consists of 10,000 videos for human emotion analysis. We follow Wang et al. 2019 and select four emotions (happy, sad, angry, and neutral) for emotion recognition. The task of this dataset is a multilabel task (e.g., a person can be sad and angry simultaneously). The metric used on this dataset is the binary classification accuracy (Acc) and the F1 score of the predictions.
CMU-MOSI Multimodal Opinion Sentiment and Emotion Intensity Zadeh et al. 2016 is sentence-level sentiment analysis and emotion recognition in online videos. CMU-MOSI contains 2,199 opinion video clips, each annotated with real-valued sentiment intensity annotations in the range [-3, +3]. We evaluate the model performances using various metrics following prior works: binary accuracy (BA), F1 score, mean absolute error (MAE) of the score, and the correlation of the prediction with humans (Corr).
CMU-MOSEI The CMU-MOSEI dataset Zadeh et al. 2018b improves over MOSI with a higher number of utterances, greater variety in samples, speakers, and topics. The dataset contains 23,453 annotated video segments (utterances), from 5,000 videos, 1,000 distinct speakers and 250 different topics. The metrics are the same as the CMU-MOSI.
| Pretrained | IEMOCAP | CMU-MOSI | CMU-MOSEI | |||
|---|---|---|---|---|---|---|
| BA | F1 | BA | F1 | |||
| BERT-Base | 82.9 | 82.6 | 85.0/86.9 | 84.9/86.9 | 82.9/86.1 | 83.3/86.1 |
| T5-Base | 82.6 | 82.4 | 87.2/89.3 | 87.3/89.3 | 84.5/86.4 | 84.7/86.3 |
| Scale | IEMOCAP | CMU-MOSI | CMU-MOSEI | |||
|---|---|---|---|---|---|---|
| BA | F1 | BA | F1 | |||
| 1 | 82.2 | 82.1 | 86.4/88.8 | 86.2/88.8 | 83.3/85.9 | 83.3/85.9 |
| 1,2 | 82.5 | 82.2 | 86.3/88.9 | 86.3/88.8 | 83.2/86.2 | 83.6/86.2 |
| 1,3 | 81.9 | 81.8 | 86.4/88.9 | 86.4/88.9 | 83.5/86.3 | 83.6/86.2 |
| 1,2,3 | 82.0 | 81.9 | 86.7/89.0 | 86.6/89.0 | 84.3/86.4 | 84.0/86.2 |
| 1,2,10 | 82.6 | 82.4 | 86.7/89.0 | 86.8/89.1 | 84.0/86.2 | 84.2/86.3 |
| 1,2,3,10 | 82.1 | 81.9 | 87.2/89.3 | 87.3/89.3 | 84.5/86.4 | 84.7/86.3 |
| Cluster | IEMOCAP | CMU-MOSI | CMU-MOSEI | |||
|---|---|---|---|---|---|---|
| BA | F1 | BA | F1 | |||
| 10 | 82.1 | 82.1 | 86.3/88.9 | 86.2/88.8 | 83.8/86.4 | 84.1/86.3 |
| 15 | 82.3 | 82.1 | 86.4/88.7 | 86.4/88.7 | 83.6/86.5 | 83.9/86.4 |
| 20 | 82.5 | 82.2 | 86.3/88.6 | 86.2/88.6 | 84.1/86.5 | 84.4/86.5 |
| 10,15 | 82.6 | 82.4 | 87.2/89.3 | 87.3/89.3 | 84.5/86.3 | 84.7/86.2 |
| 15,20 | 82.3 | 82.1 | 85.4/87.9 | 85.3/87.9 | 84.5/86.4 | 84.7/86.3 |
| 10,15,20 | 82.0 | 82.0 | 85.8/88.2 | 85.8/88.2 | 83.3/86.5 | 83.8/86.5 |
Following previous works Tsai et al. 2019; Rahman et al. 2020 and the CMU-MultimodalSDK22 2 https://github.com/A2Zadeh/CMU-MultimodalSDK, the video feature is extracted via Facet33 3 iMotions. Facial expression analysis, 2017. and the acoustic feature is extracted using COVAREP Degottex et al. 2014. The video feature mainly contains 35 facial action units, e.g., facial muscle movement. The acoustic feature mainly includes Mel-frequency cepstral coefficients (MFCCs), pitch tracking and voiced/unvoiced segmenting features, glottal source parameters, peak slope parameters, and maxima dispersion quotients. The video feature dimension is 35 for IEMOCAP and CMU-MOSEI, and 47 for CMU-MOSI. The acoustic feature dimension is 74 for all three benchmarks. We refer to this version of the feature as Facet&COVAREP.
For the IEMOCAP, we also compare the video feature extracted by OpenFace44 4 https://github.com/TadasBaltrusaitis/OpenFace and the acoustic feature extracted by librosa55 5 https://github.com/librosa/librosa to investigate the influence of the unimodality representation. Compared with CMU-MOSI and CMU-MOSEI, each frame of IEMOCAP has two people in the scenario simultaneously, making the judgment difficult. We partition two people according to the layout of the frame and extract the feature separately. The video feature dimension is 709 and the acoustic feature dimension is 33. We refer to this version of the feature as OpenFace&Librosa.
| Modality | CMU-MOSI | |
|---|---|---|
| BA | F1 | |
| T | 86.4/88.6 | 86.4/88.6 |
| V | 53.1/54.1 | 52.9/54.0 |
| A | 54.7/55.0 | 54.1/54.4 |
| T,V | 86.6/88.9 | 86.5/88.9 |
| T,A | 87.0/89.3 | 87.0/89.3 |
| V,A | 54.9/55.4 | 54.9/55.6 |
| T,V,A | 87.2/89.3 | 87.3/89.3 |
| Features | IEMOCAP | |
|---|---|---|
| Facet&COVAREP | 82.6 | 82.4 |
| OpenFace&Librosa | 85.1 | 85.0 |
| Methods | Happy | Sad | Angry | Neutral | Average | |||||
|---|---|---|---|---|---|---|---|---|---|---|
| Acc | F1 | Acc | F1 | Acc | F1 | Acc | F1 | |||
| CTC + EF-LSTM Tsai et al. 2019 | 76.2 | 75.7 | 70.2 | 70.5 | 72.7 | 67.1 | 58.1 | 57.4 | 69.3 | 67.7 |
| LF-LSTM Tsai et al. 2019 | 72.5 | 71.8 | 72.9 | 70.4 | 68.6 | 67.9 | 59.6 | 56.2 | 68.4 | 66.6 |
| CTC + RAVEN Wang et al. 2019 | 77.0 | 76.8 | 67.6 | 65.6 | 65.0 | 64.1 | 62.0 | 59.5 | 67.9 | 66.5 |
| CTC + MCTN Pham et al. 2019 | 80.5 | 77.5 | 72.0 | 71.7 | 64.9 | 65.6 | 49.4 | 49.3 | 66.7 | 66.0 |
| MulT Tsai et al. 2019 | 84.8 | 81.9 | 77.7 | 74.1 | 73.9 | 70.2 | 62.5 | 59.7 | 74.7 | 71.5 |
| PMR Lv et al. 2021 | 86.4 | 83.3 | 78.5 | 75.3 | 75.0 | 71.3 | 63.7 | 60.9 | 75.9 | 72.7 |
| MTAG Yang et al. 2021 | - | 86.0 | - | 79.9 | - | 76.7 | - | 64.1 | - | 76.7 |
| ScaleVLAD | 86.7 | 85.9 | 84.8 | 84.6 | 86.8 | 86.9 | 72.1 | 72.1 | 82.6 | 82.4 |
| - w/o multi-scale | 86.6 | 85.7 | 84.1 | 84.2 | 86.7 | 86.9 | 71.5 | 71.3 | 82.2 | 82.0 |
| - w/o S3C loss | 85.1 | 84.9 | 84.3 | 84.4 | 88.5 | 88.3 | 69.4 | 68.5 | 81.8 | 81.5 |
4.2 Experimental Details
We initial the text encoder with T5 Base Encoder Raffel et al. 2020 in this paper due to its advantages after training with an extensive corpus. We also conduct an ablation study to compare with BERT Base uncased version Devlin et al. 2019. The rest of the parameters, e.g., Video Transformer, Audio Transformer, and Fusion module, are initialized randomly. The fusion dimension is set to 128. We train the model with the Adam optimizer Kingma and Ba 2015 with a linear schedule. The warmup rate is set to 0.1 based on the total epoch 50. The learning rate is set from {1e-3, 1e-4, 5e-5, 1e-5}. The Video Transformer and Audio Transformer are set from {4, 6} layers with {128, 768} hidden size. The fusion Transformer in Eq. (9) is set with layer 2. The multi-scale parameter and the number of shared semantic vectors in Eq. (4) is set from {1, 2, 3, 10} and {8, 10}, respectively. The cluster is set from {10, 15, 20}. Note these candidate choices are not exact and also can not set with a grid search strategy, so we set them through empirical testing on validation set. The start epoch for loss is set to 5, the same as the warmup epochs. All hyper-parameters are set according to the performance from the validation set. The batch size is 64 across three datasets. All experiments are carried out on 4 NVIDIA Tesla V100 GPUs.
| Methods | BA | F1 | MAE | Corr |
|---|---|---|---|---|
| MV-LSTM Rajagopalan et al. 2016 | 73.9/- | 74.0/- | 1.019 | 0.601 |
| TFN Zadeh et al. 2017 | 73.9/- | 73.4/- | 1.040 | 0.633 |
| MARN Zadeh et al. 2018c | 77.1/- | 77.0/- | 0.968 | 0.625 |
| MFN Zadeh et al. 2018a | 77.4/- | 77.3/- | 0.965 | 0.632 |
| RMFN Liang et al. 2018 | 78.4/- | 78.0/- | 0.922 | 0.681 |
| RAVEN Wang et al. 2019 | 78.0/- | -/- | 0.915 | 0.691 |
| MulT Tsai et al. 2019 | -/81.1 | -/81.0 | 0.889 | 0.686 |
| ICCN Sun et al. 2020 | -/83.1 | -/83.0 | 0.862 | 0.714 |
| PMR Lv et al. 2021 | -/82.4 | -/82.1 | - | - |
| FMT Zadeh et al. 2019 | 81.5/83.5 | 81.4/83.5 | 0.837 | 0.744 |
| UniVL Luo et al. 2020 | 83.2/84.6 | 83.3/84.6 | 0.781 | 0.767 |
| MISA (Hazarika et al. 2020) | 81.8/83.4 | 81.7/83.6 | 0.783 | 0.761 |
| MAG-BERT Rahman et al. 2020 | 84.2/86.1 | 84.1/86.0 | 0.712 | 0.796 |
| MAG-XLNet Rahman et al. 2020 | 85.7/87.9 | 85.6/87.9 | 0.675 | 0.821 |
| Self-MM Yu et al. 2021 | 84.0/86.0 | 84.4/86.0 | 0.713 | 0.798 |
| MTAG Yang et al. 2021 | -/82.3 | -/82.1 | 0.866 | 0.722 |
| ScaleVLAD | 87.2/89.3 | 87.3/89.3 | 0.684 | 0.819 |
| - w/o multi-scale | 86.3/88.6 | 86.2/88.6 | 0.713 | 0.807 |
| - w/o S3C loss | 86.0/88.0 | 85.9/88.0 | 0.727 | 0.810 |
| Human | 85.7/- | 87.5/- | 0.710 | 0.820 |
4.3 Ablation Studies
We conduct comprehensive ablation studies on text encoder, key hyper-parameters settings, and features in this section.
Text Encoder. In Table 1, we compare the BERT-Base with the T5-Base. The T5-Base wins on CMU-MOSI and CMU-MOSEI. Besides, it has comparable results on IEMOCAP. Thus, we use T5-Base as our text encoder in our work. We suppose that a larger pretrained model, e.g., T5-Large, can achieve better performance but needs more computational resources.
Multi-scale Fusion. In Table 2, we ablate the scale setting of the ScaleVLAD module. The table lists a part of combinations, and we find {1,2,10} and {1,2,3,10} can achieve better results than others. It proves that fusing different granularities of representation can achieve better performance.
Cluster NO. in S3C Loss. In Table 3, we ablate the cluster setting of S3C loss. The table lists a part of combinations, and we find {10,15} and {15,20} can achieve better results than others. It indicates an appropriate choice of the cluster will keep the feature clustering and thus improve the results.
Multi-modality Fusion. The results in Table 4 prove that multimodal fusion can provide more comprehensive information and capture more emotional characteristics than unimodality.
Nonverbal Feature. In Table 5, different nonverbal features are conducted on IEMOCAP. It shows that more sophisticated features can obtain better results. Further, we suppose that end-to-end training from raw signals instead of the features extracted by off-the-shelf tools can improve more, like video retrieval from Luo et al. 2021.
| Methods | BA | F1 | MAE | Corr |
|---|---|---|---|---|
| MV-LSTM Rajagopalan et al. 2016 | 76.4/- | 76.4/- | - | - |
| MFN Zadeh et al. 2018a | 76.0/- | 76.0/- | - | - |
| RAVEN Wang et al. 2019 | 79.1/- | 79.5/- | 0.614 | 0.662 |
| PMR Lv et al. 2021 | -/83.1 | -/82.8 | - | - |
| MAG-BERT Rahman et al. 2020 | -/84.7 | -/84.5 | - | - |
| MAG-XLNet Rahman et al. 2020 | -/85.6 | -/85.7 | - | - |
| TFN Zadeh et al. 2017 | -/82.5 | -/82.1 | 0.593 | 0.700 |
| MulT Tsai et al. 2019 | -/81.6 | -/81.6 | 0.591 | 0.694 |
| ICCN Sun et al. 2020 | -/84.2 | -/84.2 | 0.565 | 0.713 |
| MISA (Hazarika et al. 2020) | 83.6/85.5 | 83.8/85.3 | 0.555 | 0.756 |
| Self-MM Yu et al. 2021 | 82.8/85.2 | 82.5/85.3 | 0.530 | 0.765 |
| ScaleVLAD | 84.5/86.4 | 84.7/86.3 | 0.527 | 0.781 |
| - w/o multi-scale | 83.1/85.8 | 83.3/85.7 | 0.541 | 0.779 |
| - w/o S3C loss | 82.7/86.1 | 83.1/86.1 | 0.548 | 0.773 |
4.4 Comparison to State-of-the-art
We compare ScaleVLAD with state-of-the-art methods on IEMOCAP, CMU-MOSI, and CMU-MOSEI, and the results are shown in Table 6, Table 7, and Table 8, respectively. In summary, 1) the proposed ScaleVLAD outperforms all baselines in all datasets; 2) The ablation on multi-scale fusion and S3C loss proves their effectiveness in all metrics and datasets. Our BERT-based results shown in Table 1 can also have advantages over the BERT feature-based models, e.g., UniVL Luo et al. 2020, MAG-BERT Rahman et al. 2020, and Self-MM Yu et al. 2021 in Table 7. The T5 based feature can improve the performance of IEMOCAP by a significant margin shown in Table 6, which proves the strong capability of the pretrained model after training with an extensive corpus in a self-supervised manner.
4.5 Qualitative Analysis
Figure 3 displays the visualization of fusion features calculated by Eq. (11) on training with S3C loss or not. For a clear observation, we regard the continuous labels as six groups, each having width 1, e.g., . Figure 3(b) illustrates a tight clustering and clearer boundary, e.g., the samples in blue color, when using S3C loss. It proves the effectiveness of the S3C loss on representation learning. Figure 4 shows the similarity calculated by Eq. (4). The alignment patterns of text, video, and audio with different scales are different and are dynamically learned by the model. In this case, the ‘really really loved’ with the yellow box can be regarded entirely to align with the latent shared semantic vectors. Besides, the video and audio with red boxes, which have bigger scales, i.e., 3 and 10, show consistently shared vectors (NO. 2 and 6) with the text. Through the shared vectors, the model can align and fuse the video and audio representation despite their fuzzy semantic boundaries. We suppose the improvement of the ScaleVLAD is benefits from such a multi-scale alignment.

5 Conclusion
We proposed a multi-scale fusion method ScaleVLAD and a self-supervised shifted clustering loss to address unaligned multimodal sentiment analysis in this paper. The proposed method considers different granularities of representation through aligning different modalities to trainable latent semantic vectors. Thus, it can remit the fuzzy semantic boundary of unimodality. The proposed self-supervised shifted clustering loss keeps the differentiation of the fusion features via maintaining a momentum updated cluster centers. The extensive experiments on three publicly available datasets demonstrate the effectiveness of the proposed model.
References
- Akhtar et al. (2019) Akhtar, M. S.; Chauhan, D. S.; Ghosal, D.; Poria, S.; Ekbal, A.; and Bhattacharyya, P. 2019. Multi-task Learning for Multi-modal Emotion Recognition and Sentiment Analysis. In NAACL-HLT, 370–379.
- Arandjelovic et al. (2016) Arandjelovic, R.; Gronát, P.; Torii, A.; Pajdla, T.; and Sivic, J. 2016. NetVLAD: CNN Architecture for Weakly Supervised Place Recognition. In CVPR, 5297–5307.
- Arandjelovic and Zisserman (2013) Arandjelovic, R.; and Zisserman, A. 2013. All About VLAD. In IEEE Conference on Computer Vision and Pattern Recognition, 1578–1585.
- Ba, Kiros, and Hinton (2016) Ba, J. L.; Kiros, J. R.; and Hinton, G. E. 2016. Layer normalization. arXiv preprint arXiv:1607.06450.
- Busso et al. (2008) Busso, C.; Bulut, M.; Lee, C.-c.; Kazemzadeh, A.; Mower, E.; Kim, S.; Chang, J. N.; Lee, S.; and Narayanan, S. S. 2008. IEMOCAP: interactive emotional dyadic motion capture database. Language Resources and Evaluation.
- Degottex et al. (2014) Degottex, G.; Kane, J.; Drugman, T.; Raitio, T.; and Scherer, S. 2014. COVAREP—A collaborative voice analysis repository for speech technologies. In ICASSP, 960–964.
- Devlin et al. (2019) Devlin, J.; Chang, M.; Lee, K.; and Toutanova, K. 2019. BERT: Pre-training of Deep Bidirectional Transformers for Language Understanding. In NAACL-HLT, 4171–4186.
- Dumpala et al. (2019) Dumpala, S. H.; Sheikh, I.; Chakraborty, R.; and Kopparapu, S. K. 2019. Audio-visual fusion for sentiment classification using cross-modal autoencoder. In NIPS, 1–4.
- Graves et al. (2006) Graves, A.; Fernández, S.; Gomez, F. J.; and Schmidhuber, J. 2006. Connectionist temporal classification: labelling unsegmented sequence data with recurrent neural networks. In ICML, volume 148, 369–376.
- Gu et al. (2018) Gu, Y.; Yang, K.; Fu, S.; Chen, S.; Li, X.; and Marsic, I. 2018. Multimodal Affective Analysis Using Hierarchical Attention Strategy with Word-Level Alignment. In ACL, 2225–2235.
- Han et al. (2021) Han, W.; Chen, H.; Gelbukh, A.; Zadeh, A.; Morency, L.-p.; and Poria, S. 2021. Bi-Bimodal Modality Fusion for Correlation-Controlled Multimodal Sentiment Analysis. ICMI.
- Hausler et al. (2021) Hausler, S.; Garg, S.; Xu, M.; Milford, M.; and Fischer, T. 2021. Patch-NetVLAD: Multi-Scale Fusion of Locally-Global Descriptors for Place Recognition. In CVPR, 14141–14152.
- Hazarika, Zimmermann, and Poria (2020) Hazarika, D.; Zimmermann, R.; and Poria, S. 2020. MISA: Modality-Invariant and -Specific Representations for Multimodal Sentiment Analysis. In ACM MM, 1122–1131.
- Hendrycks and Gimpel (2016) Hendrycks, D.; and Gimpel, K. 2016. Gaussian error linear units (gelus). arXiv preprint arXiv:1606.08415.
- Jégou et al. (2010) Jégou, H.; Douze, M.; Schmid, C.; and Pérez, P. 2010. Aggregating local descriptors into a compact image representation. In CVPR, 3304–3311.
- Kingma and Ba (2015) Kingma, D. P.; and Ba, J. 2015. Adam: A Method for Stochastic Optimization. ICLR.
- Liang et al. (2018) Liang, P. P.; Liu, Z.; Zadeh, A.; and Morency, L. 2018. Multimodal Language Analysis with Recurrent Multistage Fusion. In EMNLP, 150–161.
- Luo et al. (2020) Luo, H.; Ji, L.; Shi, B.; Huang, H.; Duan, N.; Li, T.; Li, J.; Bharti, T.; and Zhou, M. 2020. UniVL: A Unified Video and Language Pre-Training Model for Multimodal Understanding and Generation. arXiv preprint arXiv:2002.06353.
- Luo et al. (2021) Luo, H.; Ji, L.; Zhong, M.; Chen, Y.; Lei, W.; Duan, N.; and Li, T. 2021. CLIP4Clip: An Empirical Study of CLIP for End to End Video Clip Retrieval. arXiv preprint arXiv:2104.08860.
- Lv et al. (2021) Lv, F.; Chen, X.; Huang, Y.; Duan, L.; and Lin, G. 2021. Progressive Modality Reinforcement for Human Multimodal Emotion Recognition From Unaligned Multimodal Sequences. In Proceedings of the IEEE/CVF Conference on Computer Vision and Pattern Recognition (CVPR), 2554–2562.
- Mai, Hu, and Xing (2020) Mai, S.; Hu, H.; and Xing, S. 2020. Modality to modality translation: An adversarial representation learning and graph fusion network for multimodal fusion. In AAAI, volume 34, 164–172.
- Mai et al. (2020) Mai, S.; Xing, S.; He, J.; Zeng, Y.; and Hu, H. 2020. Analyzing unaligned multimodal sequence via graph convolution and graph pooling fusion. arXiv preprint arXiv:2011.13572.
- Morency, Mihalcea, and Doshi (2011) Morency, L.; Mihalcea, R.; and Doshi, P. 2011. Towards multimodal sentiment analysis: harvesting opinions from the web. In ICMI, 169–176.
- Peng and Qi (2019) Peng, Y.; and Qi, J. 2019. CM-GANs: Cross-modal generative adversarial networks for common representation learning. TOMM, 15(1): 1–24.
- Pham et al. (2019) Pham, H.; Liang, P. P.; Manzini, T.; Morency, L.; and Póczos, B. 2019. Found in Translation: Learning Robust Joint Representations by Cyclic Translations between Modalities. In AAAI, 6892–6899.
- Poria et al. (2016) Poria, S.; Chaturvedi, I.; Cambria, E.; and Hussain, A. 2016. Convolutional MKL Based Multimodal Emotion Recognition and Sentiment Analysis. In ICDM, 439–448.
- Poria et al. (2020) Poria, S.; Hazarika, D.; Majumder, N.; and Mihalcea, R. 2020. Beneath the tip of the iceberg: Current challenges and new directions in sentiment analysis research. IEEE Transactions on Affective Computing.
- Raffel et al. (2020) Raffel, C.; Shazeer, N.; Roberts, A.; Lee, K.; Narang, S.; Matena, M.; Zhou, Y.; Li, W.; and Liu, P. J. 2020. Exploring the Limits of Transfer Learning with a Unified Text-to-Text Transformer. Journal of Machine Learning Research, 21(140): 1–67.
- Rahman et al. (2020) Rahman, W.; Hasan, M. K.; Lee, S.; Zadeh, A. B.; Mao, C.; Morency, L.; and Hoque, M. E. 2020. Integrating Multimodal Information in Large Pretrained Transformers. In ACL, 2359–2369.
- Rajagopalan et al. (2016) Rajagopalan, S. S.; Morency, L.; Baltrusaitis, T.; and Goecke, R. 2016. Extending Long Short-Term Memory for Multi-View Structured Learning. In ECCV, 338–353.
- Siriwardhana et al. (2020) Siriwardhana, S.; Reis, A.; Weerasekera, R.; and Nanayakkara, S. 2020. Jointly Fine-Tuning ”BERT-Like” Self Supervised Models to Improve Multimodal Speech Emotion Recognition. In Interspeech, 3755–3759.
- Sun et al. (2020) Sun, Z.; Sarma, P.; Sethares, W.; and Liang, Y. 2020. Learning relationships between text, audio, and video via deep canonical correlation for multimodal language analysis. In AAAI, volume 34, 8992–8999.
- Tsai et al. (2019) Tsai, Y. H.; Bai, S.; Liang, P. P.; Kolter, J. Z.; Morency, L.; and Salakhutdinov, R. 2019. Multimodal Transformer for Unaligned Multimodal Language Sequences. In ACL, 6558–6569.
- Tsai et al. (2020) Tsai, Y. H.; Ma, M.; Yang, M.; Salakhutdinov, R.; and Morency, L. 2020. Multimodal Routing: Improving Local and Global Interpretability of Multimodal Language Analysis. In EMNLP, 1823–1833.
- van der Maaten and Hinton (2008) van der Maaten, L.; and Hinton, G. 2008. Visualizing Data using t-SNE. Journal of Machine Learning Research, 9(86): 2579–2605.
- Vaswani et al. (2017) Vaswani, A.; Shazeer, N.; Parmar, N.; Uszkoreit, J.; Jones, L.; Gomez, A. N.; Kaiser, Ł.; and Polosukhin, I. 2017. Attention is all you need. In NeurIPS, 5998–6008.
- Verma et al. (2019) Verma, S.; Wang, C.; Zhu, L.; and Liu, W. 2019. DeepCU: Integrating both Common and Unique Latent Information for Multimodal Sentiment Analysis. In IJCAI, 3627–3634.
- Verma et al. (2020) Verma, S.; Wang, J.; Ge, Z.; Shen, R.; Jin, F.; Wang, Y.; Chen, F.; and Liu, W. 2020. Deep-HOSeq: Deep Higher Order Sequence Fusion for Multimodal Sentiment Analysis. In ICDM, 561–570.
- Wang, Zhu, and Yang (2021) Wang, X.; Zhu, L.; and Yang, Y. 2021. T2VLAD: Global-Local Sequence Alignment for Text-Video Retrieval. In CVPR, 5079–5088.
- Wang et al. (2019) Wang, Y.; Shen, Y.; Liu, Z.; Liang, P. P.; Zadeh, A.; and Morency, L. 2019. Words Can Shift: Dynamically Adjusting Word Representations Using Nonverbal Behaviors. In AAAI, 7216–7223.
- Wang, Wan, and Wan (2020) Wang, Z.; Wan, Z.; and Wan, X. 2020. TransModality: An End2End Fusion Method with Transformer for Multimodal Sentiment Analysis. In WWW, 2514–2520.
- Yang et al. (2021) Yang, J.; Wang, Y.; Yi, R.; Zhu, Y.; Rehman, A.; Zadeh, A.; Poria, S.; and Morency, L. 2021. MTAG: Modal-Temporal Attention Graph for Unaligned Human Multimodal Language Sequences. In NAACL-HLT, 1009–1021.
- Yang, Xu, and Gao (2020) Yang, K.; Xu, H.; and Gao, K. 2020. CM-BERT: Cross-Modal BERT for Text-Audio Sentiment Analysis. In Proceedings of the 28th ACM International Conference on Multimedia, 521–528.
- Yu et al. (2021) Yu, W.; Xu, H.; Yuan, Z.; and Wu, J. 2021. Learning Modality-Specific Representations with Self-Supervised Multi-Task Learning for Multimodal Sentiment Analysis. In AAAI, 10790–10797.
- Zadeh et al. (2017) Zadeh, A.; Chen, M.; Poria, S.; Cambria, E.; and Morency, L. 2017. Tensor Fusion Network for Multimodal Sentiment Analysis. In EMNLP, 1103–1114.
- Zadeh et al. (2018a) Zadeh, A.; Liang, P. P.; Mazumder, N.; Poria, S.; Cambria, E.; and Morency, L.-P. 2018a. Memory Fusion Network for Multi-view Sequential Learning. AAAI.
- Zadeh et al. (2018b) Zadeh, A.; Liang, P. P.; Poria, S.; Cambria, E.; and Morency, L. 2018b. Multimodal Language Analysis in the Wild: CMU-MOSEI Dataset and Interpretable Dynamic Fusion Graph. In ACL, 2236–2246.
- Zadeh et al. (2018c) Zadeh, A.; Liang, P. P.; Poria, S.; Vij, P.; Cambria, E.; and Morency, L.-P. 2018c. Multi-attention recurrent network for human communication comprehension. In AAAI.
- Zadeh et al. (2019) Zadeh, A.; Mao, C.; Shi, K.; Zhang, Y.; Liang, P. P.; Poria, S.; and Morency, L. 2019. Factorized Multimodal Transformer for Multimodal Sequential Learning. arXiv preprint arXiv:1911.09826.
- Zadeh et al. (2016) Zadeh, A.; Zellers, R.; Pincus, E.; and Morency, L.-P. 2016. Multimodal sentiment intensity analysis in videos: Facial gestures and verbal messages. IEEE Intelligent Systems, 31(6): 82–88.
- Zhang et al. (2020) Zhang, C.; Yang, Z.; He, X.; and Deng, L. 2020. Multimodal Intelligence: Representation Learning, Information Fusion, and Applications. IEEE J. Sel. Top. Signal Process., 14(3): 478–493.