Thermal crosstalk of X-ray transition-edge sensor micro-calorimeters under frequency domain multiplexing readoutPreprint: AIP/123-QED
Abstract
We have measured and characterized the thermal crosstalk in two different arrays of transition-edge sensor (TES) X-ray micro-calorimeters with frequency-domain multiplexing (FDM) readout. The TES arrays are fabricated at SRON and are a 88 and a 3232 "kilo-pixel" uniform array. The amount of crosstalk is evaluated as the ratio between the averaged crosstalk signal and the X-ray pulse amplitudes. The crosstalk ratios (CR) for our detectors are compliant with the requirements for future X-ray space missions, such as Athena X-IFU (CR for first-neighbour pixels): we measured a nearest-neighbour thermal crosstalk ratio at a level of , with a highest crosstalk ratio of for the kilo-pixel array (worst case, center of array) and for the 88 array, with a margin of improvement achievable by optimizing the Cu metallization and the width of the Si supporting structures (muntins) in the backside of the TES array chip. Based on the measured crosstalk ratios, we have estimated the impact on the spectral resolution by means of noise equivalent power (NEP) considerations and a Monte Carlo simulation, finding an average degradation in quadrature of less than 40 meV, compliant with the < 0.2 eV requirement for Athena X-IFU.
This paper has been accepted for publication in IEEE Transactions on Applied Superconductivity .
I Introduction
Transition-edge sensors tes (TESs) are very sensitive devices used as bolometers or single-photon micro-calorimeters in a variety of present and future astrophysical missions, such as LiteBIRD litebird, HUBS hubs, Athena X-IFU athena. Given the stringent limitations of space-borne missions in terms of available cooling power at sub-K temperatures, the readout of TESs is usually performed under a multiplexing scheme. Several multiplexing methods exist, whose means are to modulate the detector signals with a set of orthogonal carriers within a limited bandwidth and perform their transmission via a common line.
At SRON, we are developing large, close-packed arrays of TES bolometers for sub-mm and far-IR observatories and micro-calorimeters for X-ray astronomy. To perform their readout, we have been developing a frequency-domain multiplexing (FDM) technology with base-band feedback bbfb (BBFB).
In our FDM readout for X-ray micro-calorimeters, the voltage bias for the TESs is provided by a comb of sinusoidal carriers generated by a custom warm electronics board (DEMUX). A tuned, high-Q LC bandpass filter is placed in series with each detector, limiting the information bandwidth and allowing only one frequency from the carrier comb to provide the AC bias. An X-ray releasing energy in a TES causes its temperature and resistance to increase and its current to drop, then electro-thermal feedback (ETF) brings the system back to its original point, resulting in an amplitude-modulation of the signal. The TESs’ output currents are summed at the input port of a superconducting quantum interference device (SQUID). An analogue low-noise amplifier (LNA) provides a further amplification at room temperature before the analog-to-digital conversion in the DEMUX board, where demodulation is performed to recover the X-ray signal. In the BBFB scheme, the demodulated signals are re-modulated and fed back to the SQUID via the feedback line, after compensating for the delay due to transmission time, to null the SQUID output. This effectively increases the available dynamic range and allows for a large multiplexing factor (i.e. number of pixels per readout chain). In our case, the FDM readout is performed in the bandwidth from 1 MHz to 5 MHz with a pixel separation of 100 kHz. For more details on the scheme and the most recent demonstration of our FDM readout for X-ray TES micro-calorimeters, see the study from Akamatsu et al.hiroki2021.
Given the proximity of the pixels both physically and in frequency space, the spectral resolution of the detectors is susceptible to crosstalk. We observe two types of crosstalk: thermal crosstalk and electrical crosstalk. When dealing with crosstalk between two pixels, we call the "Perpetrator" the pixel where an actual X-ray event is detected and the "Victim" the pixel where a spurious signal due to crosstalk is observed.
Thermal crosstalk (TCT) occurs because a part of the energy deposited by an X-ray in the Perpetrator pixel is not compensated via the ETF mechanism, by the reduction in Joule heating dissipated by the TES. As such, the level of thermal crosstalk depends on the effective strength of ETF, quantified by the loop gain :
| (1) |
where and are the shunt resistance and TES resistance, is the thermal conductance exponent (for the detectors used in our experiments, ), and are the bath temperature and TES temperature and d(lnR)/d(lnT) and d(lnR)/d(lnI) are the TES temperature and current sensitivity, respectively. If an amount of energy is deposited by an X-ray in the Perpetrator, a fraction is not compensated by a reduction of Joule heating of the TES and dissipates into the thermal bath, becoming source of thermal crosstalk. TCT can then be minimized by proper heat-sinking the array. We usually bias our devices along the transition at of the normal resistance, where typically and , resulting in (the value for other quantities necessary for calculation are given in Section II).
Electrical crosstalk (ECT) occurs when the electrical signal in the readout chain produced by the detection of an X-ray in the Perpetrator pixel causes a spurious signal to be observed in the Victim pixel. ECT does not originate from the detector array, but merely from the readout circuit. There are several factors that can produce ECT in a FDM system, such as carrier leakage, common inductance in the AC bias line and/or at the SQUID input line, or mutual inductance between neighbour inductors in the LC filter chip.
In this paper we present an experimental characterization of thermal crosstalk for two different TES arrays fabricated at SRON, using two of our FDM setups, namely the XFDM setup and the kilo-pixel setup (described in next section). ECT is not the main focus of the paper and is not treated.
II Experimental setup
To give a better overview on the two setups, the detector parameters and readout components described below are also summarized in Table 1.
II.1 TES arrays
The detectors used in the experiments reported in this paper have been developed at SRON. The arrays used in the two setups have both different devices and different layout. The XFDM setup hosts a uniform array, 32 TESs of which are connected to the readout circuit. The kilo-pixel setup hosts a uniform kilo-pixel array, 38 TESs of which are connected to readout circuit.
Each TES consists of a Ti/Au bilayer deposited on a 500 nm thick SiN membrane. The bilayer dimensions are m2 and m2 for the array hosted in the XFDM and kilo-pixel setup, respectively. The bilayer is coupled to a m2, 2.3 m thick Au absorber (heat capacity pJ/K at 90 mK) via two central pillars, with four additional corner stems providing mechanical support, as shown in Figure 1, right plot. The m2 devices have critical temperature mK, normal resistance m and thermal conductance pW/K at . The m2 devices have mK, m and pW/K at .
Thermalization of the TES chip is provided by Au wire-bondings between the Cu sample holder and the gold layer on top of the array. To further improve the thermal contact, a 1 m Cu layer with 20 nm Au capping is added to the Si supporting structures (muntins) on the backside of the chip. The width of the muntins for this batch of arrays is 60 m. Due to the position and orientation of the sample holder inside the evaporation chamber, the muntins are not uniformly metallized, as shown in Figure 1, left plot.

II.2 FDM setups
In both the XFDM and kilo-pixel setups, the TESs are coupled to custom LC filters marcel and superconducting transformers for impedance matching, resulting in an effective inductance of 3.7 H and 2.8 H for the XFDM and kilo-pixel setup, respectively. The voltage bias is obtained through a 750 m SMD (surface mount device) resistor and a capacitive divider with a 1:26 ratio, for an effective shunt resistance m. The TES summed signals are pre-amplified at cryogenic stage via two SQUIDs (VTT model J3 as front-end and VTT model F5 as amplifier). Such "cold" components are hosted on custom oxygen-free high-conductivity (OFHC) copper and enclosed in a niobium shield. Superconducting Helmolz coils are employed to cancel out residual stray magnetic field after the cooldown. The detectors are hit with 5.9 keV X-rays produced from an 55Fe source hosted on the Nb magnetic shield. Aluminium foils are employed in front of the X-ray source to adjust the count rate to count per second per pixel. A copper collimator is placed just above the TES array to avoid non-biased pixels being hit, as these lack the ETF and thus would cause thermal fluctuations in the array.
The setups are both housed in the same cryo-cooler, a Leiden Cryogenics dilution unit with a cooling power of 400 W at 120 mK. The setups are hanged via Kevlar wires to the mixing chamber to damp mechanical oscillationsgotkevlar. OFHC copper braids connecting the setups to the mixing chamber ensure the thermal anchoring. The setups’ temperatures are controlled and monitored via a Ge thermistor anchored to the copper holder. For the measurements reported in this paper, the base temperature for the XFDM setup is 55 mK and for the kilo-pixel setup is 53 mK.
| XFDM | kilo-pixel | |
|---|---|---|
| TES design | 50x10 m2 | 80x20 m2 |
| TES array | 88, 32 connected | 3232, 38 connected |
| 125 m | 100 m | |
| 85 mK | 85 mK | |
| @ | 50 pW/K | 80 pW/K |
| @ 90 mK | 0.85 pJ/K | 0.85 pJ/K |
| 3.7 H | 2.8 H | |
| 1 m | 1 m | |
| 55 mK | 53 mK |
III Experimental approach
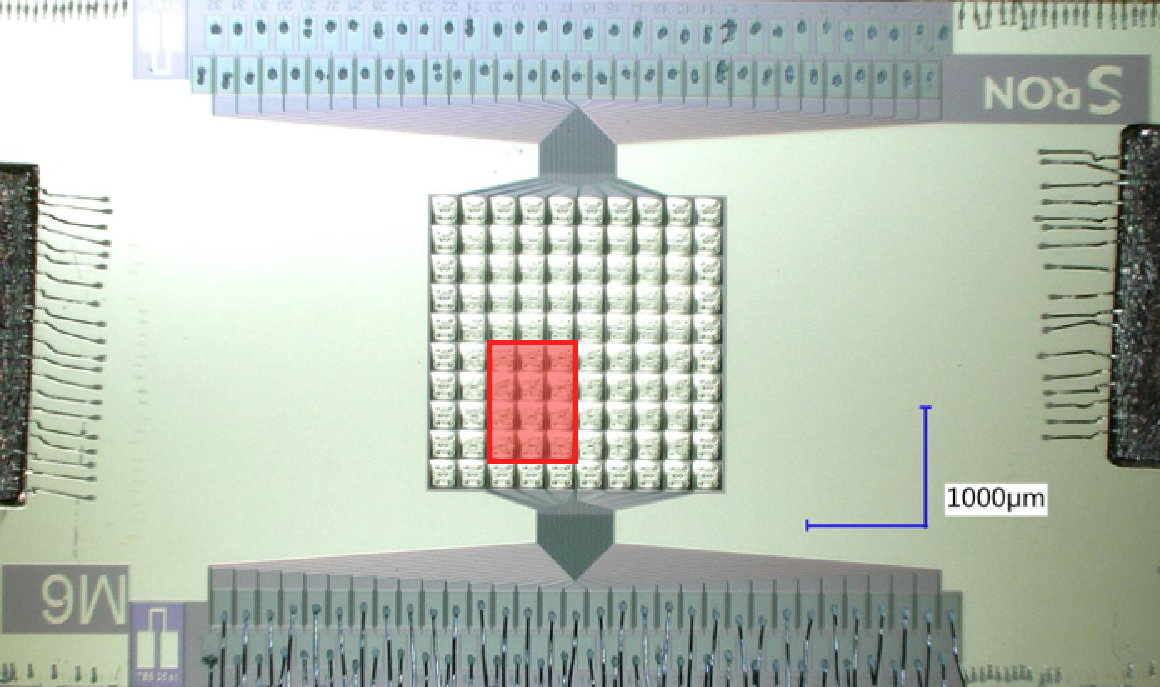
To evaluate the amount of crosstalk we simultaneously activate neighbour pixels, and bias them at 20% of their superconducting transition, where the best spectral performances are observed. In Figure 2 we show the smaller array and the larger kilo-pixel array and the map of pixels activated during the experiments.

When one pixel is triggered by an X-ray event, data for all the active pixels is stored. The total events number is chosen to sufficiently reduce the noise floor (scaled to the amplitude of an X-ray pulse) to a level of . This number is chosen based on preliminary measurementsxtalk_et which showed the scaled amplitude of the TCT signal to be at a level of or higher. In this way a total of events is acquired. We can’t however control the precise number of events acquired per each individual pixel.
Since we are activating multiple pixels, intermodulation distortions from non-linearities in the readout chain are expected to produce spurious line noises within the TES sensitive bandwidth. To avoid this, we use a Frequency Shift Algorithm fsapaul; fsadavide to shift in frequency space the intermodulation lines and place them sufficiently far away from the sensitive bandwidth of the TES.


To estimate the crosstalk ratio between the Victim pixel and the neighbouring Perpetrator pixels, we first construct the averaged X-ray pulse and TCT pulse for the Victim pixel. The average X-ray pulse is calculated by taking the average of the collected X-ray pulses, excluding those events which contain more than one pulse within the recorded event length. To analyse the data, we first subtract the baseline and take the absolute value of the amplitude to change the polarity of the pulse to positive. Then, for each Victim-Perpetrator pair, the average TCT pulse is calculated by averaging the signals for the Victim pixel acquired when the data acquisition was triggered by an X-ray in the Perpetrator pixel. The crosstalk ratio CR is then evaluated as
| (2) |
where is the amplitude of the TCT pulse averaged on 10 points (s in time scale) around the maximum and is the peak value of the X-ray pulse.
Both the TCT and X-ray pulse in this calculation refer to the Victim pixel. Ideally, the TCT pulse amplitude should be referred to the source X-ray pulse, which would require biasing the detectors from a perfectly uniform array on the same bias point (hence same and ) and having the same gain of readout electronics. In our AC case, the bias of each TES is performed independently, which allows to tune the bias voltage individually to obtain the best performance for each pixel but, also due to the presence of weak link effect lucianowl and the total gain of the readout electronics not being constant across the FDM bandwidth, makes it not straightforward to exactly bias to the same bias point. Therefore, calculating the crosstalk ratio using the X-ray pulse from the source pixel as reference would lead to a mis-estimation.
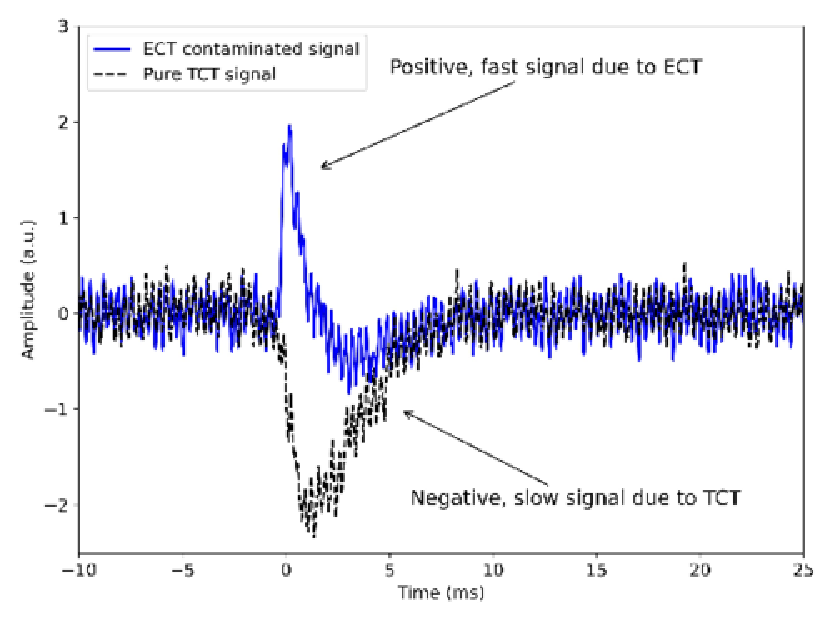
During the analysis we observed data contaminated by ECT (an example is shown in Figure 4), whose signatures are (i) the opposite polarity of the signal and (ii) the faster rise time and fall time, since it is caused by the parasitic inductive coupling within the readout circuit and not by a thermo-electrical effect. In our FDM systems, the main cause of ECT is the common inductance in the AC bias and SQUID feedback line, so that the amount of ECT is proportional to , where is the bias frequency of the Victim pixel and is the bias frequency difference between the Victim and the Perpetrator. ECT can be improved by reducing the length of the common paths in the AC bias and SQUID feedback line, consisting of lithographed strip-lines and Al bonding wires. For the results that follow, Victim-Perpetrator pairs contaminated from ECT are discarded from the analysis, so that the events analysed refer to pure thermal crosstalk.
IV Results and discussion
IV.1 Crosstalk ratios
In Figure 3, left plot, we show an example of processed data for thermal crosstalk. From the noise floor level, we define a 3 detection threshold, where is calculated as the root mean square of the noise floor level. We deem TCT detection and proceed with the CR calculation if two conditions are met: I) the averaged crosstalk pulse shape has the proper polarity (ECT rejection) and II) the TCT pulse amplitude is above the 3 detection threshold.
For Victim-Perpetrator pairs with relative distance of 2 pixels or more however, the observed TCT signals are low enough to make the 3 criterion too stringent: for those pairs, condition II) is replaced with condition III) the integral of the TCT pulse is at least 30% larger than the integral of the noise floor, where the integrals are considered in the time interval where the detected pulse signal is above the noise floor (typically few milliseconds). The threshold of 3 of condition II) and the use of condition III) are a compromise to effectively prevent false detection and at the same time avoiding to reject data points at pixel distances of 2 or higher, where the measured CR are small. The cost is that, for pixel distances of 2 or more, the error bar (= detection threshold ) on the CR value is significant.
Due to the higher ECT in the kilo-pixel setup (due to longer wire-bonds in the AC bias and SQUID input lines), a larger number of Perpetrator-Victim pairs is excluded from the analysis than in the XFDM case. We separately fit the rising and falling flank of the TCT pulses with a single exponential function to extract the rise and fall times, as shown in Figure 3, right plot. The information about the X-ray pulse time scale is used for the Monte Carlo simulation in Section B.2.
We then produce TCT maps for each pixel of the array. Figure 5 shows an example of such a map, as measured in the XFDM setup (left plot) and kilo-pixel setup (middle and right plots). We construct a map for each Victim in the array: in this way we correlate the measured CR with the relative distance between the Victim and the Perpetrator pixel, as shown in Figure 6.
We observe a directional dependency in CR for nearest-neighbour pixels, which we interpret as the effect of the non-uniform copper metallization of the silicon muntins, which in turn depends on the position and orientation of the array on the fabrication mask. This effect is more clear for the XFDM setup: a nearest-neighbour Perpetrator pixel lying in the Victim pixel in the direction of the Cu-plated muntin produces a TCT which is significantly lower than for Perpetrator and Victim lying in the direction on muntin without deposited copper.
Taking as reference the requirements for Athena X-IFUminiussi, we observe that the amount of crosstalk for our array is at acceptable levels, with highest crosstalk ratios of in the XFDM setup, and for the kilo-pixel setup at edge of array and in the center of the array. These values are expected to be improved in future batches of arrays, envisaging a larger width of the silicon muntins (from m to m) and a uniform Cu metallization.


IV.2 Impact on spectral performance
Having measured the level of TCT for our TES arrays, we want to estimate its impact on the spectral performance of the detectors. To do so, we adopt two approaches: (1) estimation from NEP (noise equivalent power) and (2) Monte Carlo simulation.
IV.2.1 Estimation from NEP
TCT can be considered as a disturbance in the thermal stability of the TES. In this sense, as done in the study by Iyomoto et al.iyomoto2, we can estimate the impact on energy resolution via the integrated NEP, defined as
| (3) |
where 2.335 is the conversion factor from RMS to FWHM, is the frequency and NEP is the NEP spectrum, defined as the ratio of the average noise power spectral density to the normalized detector responsivity, which we calculate from the average 6 keV X-ray pulse spectrum normalized to power units.
We calculate the integrated NEP from the fundamental noise power spectrum, defined from the noise events acquired when no X-ray events are detected in any active TES, and then compare it to the integrated NEP obtained by adding in quadrature to the fundamental noise the power spectrum of the average TCT pulse. Given the low signal-to-noise ratio of the TCT, to avoid over-estimations we first subtract the contribution of the fundamental noise from the average TCT pulse power spectrum. In Figure 7, left plot, we show an example of fundamental NEP spectrum and the contribution of thermal crosstalk to the NEP spectrum. The impact on spectral performance is then estimated as
| (4) |
For nearest neighbour pixels lying along the direction with no-metallization muntins, such value is of the order of 10 meV, and is significantly lower for pixels lying along the direction of Cu-plated muntins.

This method considers the increased phonon noise in the Victim pixel caused by thermal disturbances from one Perpetrator pixel, however it is not representative for an actual FDM multi-pixel configuration, with multiple Perpetrators surrounding the Victim and an increased effective count rate. Therefore, we consider the impact on performance measured in this way as an underestimation. To make a more realistic assessment, we use a Monte Carlo simulation.
IV.2.2 Monte Carlo simulation
In this approach, we simulate an X-ray spectrum composed by the Mn-K and Mn-K lines as typically measured from the 55Fe source in our experimental setups. To do so, we take random samples from a probability distribution constructed using the natural line data and branching ratios present in the study by Holzer et al.holzer, convolved with a gaussian function to tune the resolution of the K lines to a value of 2 eV. The spectral performance is estimated by fitting the Mn-K model to the simulated data using the Cash-statisticscstat in the maximum-likelihood method. We simulate the energy spectrum with a number of events large enough to reduce the statistical error of the fit to 1 meV (one order of magnitude lower than the impact estimated by NEP approach), as shown in Figure 8, left plot.


We then contaminate the simulated spectrum with TCT events. For the contamination to happen, an X-ray should release energy in the Perpetrator within a time window equal to the entire relaxation time of the Victim X-ray pulse, which we can consider to be of the order of 10 ms, as shown in Figure 3, right plot. Considering a typical count rate for each pixel of 1 Hz, the probability of having an X-ray event in one pixel follows a Poisson distribution with mean . The probability of two concurrent, independent events in the Perpetrator and Victim pixel is then given by the product of the two individual probabilities. Considering that each Victim has neighbour Perpetrator pixels, the contamination probability is calculated as:
| (5) |
Considering ms, Hz and (assuming the TCT of higher-than- neighbours to be negligible), we get . To perform a random TCT contamination, for each event of the simulated spectrum we generate a random number within 0 and 1 with a uniform probability distribution. Then, if the condition is verified, we sum the TCT contribution to the energy of the X-ray event. To calculate we consider the weighted average of the energy for Mn-K X-rays eV and a CR of , so that the average energy for TCT pulse eV. This is a conservative estimation, since the average CR for first neighbours is and it is expected to be even better with an improved, uniform Cu metallization.
In this way we construct a "contaminated" spectrum, which we fit to extract the energy resolution of the Mn-K lines. The degradation (in quadrature) coming from TCT is then calculated according to Eq. 4.
To assess the expected impact of TCT on spectral resolution, we repeat this process for a large number of observations (i.e. random contamination of the simulated spectrum and calculation of the degradation in quadrature). In Figure 8, right plot, we show the results of the simulation for one thousand observations. By fitting the data with a gaussian distribution, we find an average impact of 0.038 eV 0.001 eV, larger than the value from NEP estimation, as expected. This value is significantly lower than the system requirements for Athena X-IFU, whose energy resolution budget for TCT is 0.2 eV, considering an instrumental energy resolution of 2.5 eV in the energy range of 0.2-7 keV for count rates per pixel of the order of 1 Hzxifu_cps.
V Summary
We presented a characterization of thermal crosstalk for two TES arrays performed in two setups for frequency-domain multiplexing readout of TES X-ray micro-calorimeters. Both the readout system and the TES arrays under study were produced at SRON. The measured level of thermal crosstalk is consistent between the two setups and is within the requirements for Athena X-IFU, with the highest crosstalk ratios for nearest neighbour pixels of for the 88 array, and for the central region and at the edge of the kilo-pixel array. The crosstalk ratios appear to be well below if the direction along the Cu muntin is considered.
By comparing the integrated NEP with and without the contribution due to the thermal crosstalk, we estimated the impact on energy resolution and the energy of the thermal crosstalk pulse for each Perpetrator-Victim combination. Using this information, we run a Monte Carlo simulation to estimate the degradation in quadrature in representative conditions for multi-pixel readout. In this way, we estimate an average impact of approximately 40 meV for a count rate per pixel of 1 Hz, compatible with the energy resolution budget allocated for thermal crosstalk in Athena X-IFU.
These results indicate that the thermal crosstalk level for our TES arrays as measured in our FDM-based system is suitable for future space-borne X-ray missions. Despite the impact of thermal crosstalk being already acceptable, we envisage the possibility to further reduce it by improving the metallization process of the silicon muntin and increasing the muntin width from 60 m to 85 m in future batches of arrays, and have a better thermalization for the TES array by using thicker or ribbon Au wire bondings.
Acknowledgements
SRON is financially supported by the Nederlandse Organisatie voor Wetenschappelijk Onderzoek.
This work is part of the research programme Athena with project number 184.034.002, which is (partially) financed by the Dutch Research Council (NWO).
The SRON TES arrays used for the measurements reported in this paper is developed in the framework of the ESA/CTP grant ITT AO/1-7947/14/NL/BW.
Data availability
The corresponding author makes available the data presented in this paper upon reasonable request.
References
- (1) K. D. Irwin and G. C. Hilton, "Transition-Edge Sensors", Cryogenic Particle Detection, Springer, Topics Appl. Phys. 99, 63-149 (2005).
- (2) H. Sugai, P. A. R. Ade, Y. Akiba, D. Alonso, K. Arnold, J. Aumont, J. Austermann, C. Baccigalupi, A. J. Banday, R. Banerji et al., "Updated Design of the CMB Polarization Experiment Satellite LiteBIRD", Journal of Low Temperature Physics 199, 1107–1117 (2020).
- (3) W. Cui, L.-B. Chen, B. Gao, F.-L. Guo, H. Jin, G.-L. Wang, L. Wang, J.-J. Wang, W. Wang, Z.-S. Wang et al., "HUBS: Hot Universe Baryon Surveyor", Journal of Low Temperature Physics 199, 502–509 (2020).
- (4) D. Barret, T. L. Trong, J.-W. den Herder, L. Piro, X. Barcons, J. Huovelin, R. Kelley, J. M. Mas-Hesse, K. Mitsuda, S. Paltani, et al., "The Athena X-ray Integral Field Unit (X-IFU)", Proc. SPIE 9905, Space Telescopes and Instrumentation 2016: Ultraviolet to Gamma Ray, 99052F (2016).
- (5) Roland den Hartog, D. Boersma, M. Bruijn, B. Dirks, L. Gottardi, H. Hoevers, R. Hou, M. Kiviranta, P. de Korte, J. van der Kuur, et al., "Baseband feedback for frequency domain multiplexed readout of TES X-ray detectors", API Conference Proceedings 1185, 261 (2009).
- (6) H. Akamatsu, D. Vaccaro, L. Gottardi, J. van der Kuur, M. Kiviranta, C.P. de Vries, M.P. Bruijn, R.H. den Hartog, K. Nagayoshi, A.J. van Linden et al., "Demonstration of 37-pixel frequency domain multiplexing readout of cryogenic X-ray microcalorimeters", in preparation (2021).
- (7) K. Nagayoshi, M. L. Ridder, M. P. Bruijn, L. Gottardi, E. Taralli, P. Khosropanah, H. Akamatsu, S. Visser J.-R. Gao, "Development of a Ti/Au TES Microcalorimeter Array as a Backup Sensor for the Athena/X-IFU Instrument", Journal of Low Temperature Physics 199, 943–948 (2020).
- (8) M. de Wit, L. Gottardi, E. Taralli, K. Nagayoshi, M. L. Ridder, H. Akamatsu, M. P. Bruijn, M. D’Andrea, J. van der Kuur, K. Ravensberg, D. Vaccaro et al., "High aspect ratio transition edge sensors for x-ray spectrometry", Journal of Applied Physics 128, 224501 (2020).
- (9) M. P. Bruijn, L. Gottardi, R. H. den Hartog, J. van der Kuur, A. J. van der Linden B. D. Jackson, "Tailoring the high-Q LC filter arrays for readout of kilo-pixel TES arrays in the SPICA-Safari instrument", Journal of Low Temperature Physics, 176 421–425 (2014).
- (10) L. Gottardi, H. van Weers, J. Dercksen, H. Akamatsu, M. P. Bruijn, J. R. Gao, B. Jackson, P. Khosropanah, J. van der Kuur, K. Ravensberg and M. L. Ridder, "A six-degree-of-freedom micro-vibration acoustic isolator for low-temperature radiation detectors based on superconducting transition-edge sensors", Review of Scientific Instruments 90, 055107 (2019).
- (11) E. Taralli, M. D’Andrea, L. Gottardi, K. Nagayoshi, M. Ridder, M. de Wit, S. Visser, D. Vaccaro, H. Akamatsu, K. Ravensberg et al., "Ti/Au TES 32 32 Pixel Array: Uniformity, Thermal Crosstalk and Performance at Different X-Ray Energies", IEEE Transactions on Applied Superconductivity, vol. 31, no. 5, pp. 1-5 (2021).
- (12) P. van der Hulst, J. van der Kuur, A. C. T. Nieuwenhuizen, D. Vaccaro, H. Akamatsu, P. van Winden B.-J. van Leeuwen and J.-W. den Herder , "Frequency Shift Algorithm: Design of a Baseband Phase Locked Loop for Frequency-Domain Multiplexing Readout of X-ray Transition-Edge Sensor Microcalorimeters", submitted for publication in Review of Scientific Instruments.
- (13) D. Vaccaro, H. Akamatsu, J. van der Kuur, P. van der Hulst, A. Nieuwenhuizen, P. van Winden, L. Gottardi, R. den Hartog, M. P. Bruijn, M. D’Andrea et al., "Frequency Shift Algorithm: Application to a Frequency-Domain Multiplexing Readout of X-ray Transition-Edge Sensor Microcalorimeters", Review of Scientific Instruments 92 (2021).
- (14) N. Iyomoto, S. R. Bandler, R. P. Brekosky, A.-D. Brown, J. A. Chervenak, E. Figueroa-Feliciano, F. M. Finkbeiner, R. L. Kelley, C. A. Kilbourne, F. S. Porter et al., "Heat Sinking and Crosstalk for Large, Close-Packed Arrays of Microcalorimeters", Journal of Low Temperature Physics 151, 506-512 (2008).
- (15) A. R. Miniussi, J. S. Adams, S. R. Bandler, S. Beaumont, M. P. Chang, J. A. Chervenak, F. M. Finkbeiner, J. Y. Ha, R. Hummatov, R. L. Kelley et al., "Thermal Crosstalk Measurements and Simulations for an X-ray Microcalorimeter Array", Journal of Low Temperature Physics 199, 663-671 (2020).
- (16) L. Gottardi, H. Akamatsu, M. Bruijn, J.-R. Gao, R. den Hartog, R. Hijmering, H. Hoevers, P. Khosropanah, A. Kozorezov, J. van der Kuur et al., "Weak-Link Phenomena in AC-Biased Transition Edge Sensors", Journal of Low Temperature Physics volume 176, 279–284 (2014).
- (17) N. Iyomoto, S. R. Bandler, R. P. Brekosky, A.-D. Brown, J. A. Chervenak, E. Figueroa-Feliciano, F. M. Finkbeiner, R. L. Kelley, C. A. Kilbourne, F. S. Porter et al., "Heat Sinking, Crosstalk, and Temperature Uniformity for Large Close-Packed Microcalorimeter Arrays", IEEE Transactions on Applied Superconductivity, vol. 19, no. 3, pp. 557-560 (2009).
- (18) G. Hölzer, M. Fritsch, M. Deutsch, J. Härtwig, E. Förster, " and emission lines of the transition metals", Physical Review A 56, 4554 (1997).
- (19) J.S. Kaastra, "On the use of -stat in testing models for X-ray spectra", Astronomy & Astrophysics 605, A51 (2017).
- (20) P. Peille, T. Dauser, C. Kirsch, R. den Hartog, E. Cucchetti, J. Wilms, D. Barret, J.-W. den Herder and L. Piro, "The Performance of the Athena X-ray Integral Field Unit at Very High Count Rates", Journal of Low Temperature Physics volume 193, pages 940–948 (2018).