ALMA Sub-arcsec-resolution 183 GHz H2O and Dense Molecular Line Observations of Nearby Ultraluminous Infrared GalaxiesJournal: AASFacilities: ALMA
Abstract
We present the results of ALMA 2 mm, 1′′-resolution observations of ten (ultra)luminous infrared galaxies ([U]LIRGs; infrared luminosity 1011.7L⊙) at 0.15, targeting dense (104 cm-3) molecular (HCN, HCO+, and HNC J=2–1) and 183 GHz H2O 31,3–22,0 emission lines. Higher HCN to HCO+ J=2–1 flux ratios are observed in some, but not all, AGN-important ULIRGs than in starburst-classified sources. We detect 183 GHz H2O emission in almost all AGN-important ULIRGs, and elevated H2O emission is found in two sources with elevated HCN J=2–1 emission, relative to HCO+ J=2–1. Except one ULIRG (the Superantennae), the H2O emission largely comes from the entire nuclear regions (1 kpc), rather than AGN-origin megamaser at the very center (1 kpc). Nuclear (1 kpc) dense molecular gas mass derived from HCO+ J=2–1 luminosity is a few 108M⊙, and its depletion time is estimated to be 106 yr in all sources. Vibrationally excited J=2–1 emission lines of HCN and HNC are detected in a few (U)LIRGs, but those of HCO+ are not. It is suggested that in mid-infrared-radiation-exposed innermost regions around energy sources, HCO+ and HNC are substantially less abundant than HCN. In our ALMA 2 mm data of ten (U)LIRGs, two continuum sources are serendipitously detected within 10′′, which are likely to be an infrared luminous dusty galaxy at 1 and a blazar.
I Introduction
Ultraluminous infrared galaxies (ULIRGs) with infrared (8–1000 m) luminosity LIR 1012L⊙ and luminous infrared galaxies (LIRGs) with LIR 1011-12L⊙ are characterized by strong dust thermal emission that is heated by energy sources (Sanders & Mirabel 1996). The infrared luminosity is typically much greater than UV-optical luminosity, suggesting that the energy sources, either starbursts and/or active galactic nuclei (AGNs), are mostly hidden behind dust. (U)LIRGs are almost exclusively observed as gas-rich galaxy mergers in the local universe at 0.3 (Sanders et al. 1988; Clements et al. 1996; Murphy et al. 1996; Duc et al. 1997, e.g.,). Numerical simulations of gas-rich galaxy mergers predict that supermassive black holes (SMBHs) grow rapidly in mass through accretion and become luminous AGNs at nuclear regions (Hopkins et al. 2006). However, high concentrations of dust and gas in merging (U)LIRGs’ nuclei (Downes & Eckart 2007; Scoville et al. 2015; Sakamoto et al. 2017; Imanishi et al. 2019, e.g.,) preclude clear distinction of hidden energy sources, particularly if compact AGNs are deeply buried (=obscured in virtually all directions) because the AGN signatures become elusive in extensively used optical spectroscopic classification (Maiolino et al. 2003; Imanishi et al. 2006). Observing at wavelengths of small dust extinction effects is indispensable to properly understand the energetic roles of buried AGNs in merging (U)LIRGs.
Radiative energy in a starburst originates from nuclear fusion inside stars, while in an AGN, a mass-accreting SMBH produces huge radiative energy from a compact (1 pc) accretion disk. In an AGN, (1) 2 keV X-rays and (2) mid-infrared 3–35 m emission are much stronger than a starburst when normalized to intrinsic UV or bolometric luminosity (Shang et al. 2011, e.g.,), because in the vicinity of a mass-accreting SMBH, (1) UV photons from the accretion disk are upscattered to X-rays by inverse Compton process and (2) the amount of mid-infrared emitting hot (100 K) dust is much greater because of considerably higher UV radiation density than in star-forming regions. Because hard X-rays (10 keV) and infrared 3–35 m have strong penetrating power into dust and gas, spectroscopy in these wavelengths can be used as an effective tool to identify luminous buried AGN signatures, by distinguishing from starbursts, in gas/dust-rich (U)LIRGs’ nuclei. Such spectroscopy of nearby ( 0.3) (U)LIRGs has been conducted systematically and signatures of luminous buried AGNs have been revealed in many sources with no obvious optical AGN signatures, at 10 keV hard X-rays (Teng et al. 2015; Oda et al. 2017; Ricci et al. 2017; Yamada et al. 2021, e.g.,) and at infrared 3–35 m (Genzel et al. 1998; Imanishi et al. 2006; Armus et al. 2007; Imanishi et al. 2007a; Imanishi et al. 2008; Nardini et al. 2008; Nardini et al. 2009; Veilleux et al. 2009; Nardini et al. 2010; Imanishi et al. 2010b, e.g.,). The presence of theoretically hypothesized deeply buried AGNs (actively mass-accreting SMBHs) in many merging (U)LIRGs has been observationally uncovered. However, there remain many nearby (U)LIRGs that have no significant AGN signatures even in the hard X-rays and infrared. It is important to distinguish whether (1) they contain no energetically important AGNs, or (2) they do, but are elusive even in hard X-rays and infrared owing to extremely large extinction (Downes & Eckart 2007; Matsushita et al. 2009; Scoville et al. 2017; Pereira-Santaella et al. 2021, e.g.,). Observations at wavelengths of even lower extinction can provide useful information.
(Sub)millimeter at 0.8–3.5 mm is one such wavelengths, with 1/20 extinction effects than hard X-rays at 10 keV and infrared 20 m (Hildebrand 1983). Because energy generation mechanisms are different for a starburst (nuclear fusion inside stars) and an AGN (mass-accreting SMBH), their effects on the surrounding mass-dominating dense (104 cm-3) molecular gas at (U)LIRGs’ nuclei (Gao & Solomon 2004) can be different, possibly producing different rotational J-transition line flux ratios among dense molecular gas tracers at (sub)millimeter. (Sub)millimeter dense molecular line flux ratios (J=1–0, J=3–2, and J=4–3 of HCN and HCO+) characteristic to known optically identified luminous AGNs (Kohno 2005; Krips et al. 2008; Izumi et al. 2015; Imanishi et al. 2016c, e.g.,), are also observed in a number of (U)LIRGs that show no discernible AGN signatures in the optical, infrared, and X-rays (Imanishi et al. 2007b; Imanishi et al. 2009; Privon et al. 2015; Izumi et al. 2016; Imanishi et al. 2016c; Imanishi et al. 2018b; Imanishi et al. 2019, e.g.,). Considering that independent (sub)millimeter AGN signatures are observed in some of these (U)LIRGs, they can be considered as candidates of optically/infrared/X-ray-elusive, but (sub)millimeter-detectable extremely deeply buried luminous AGNs (Imanishi et al. 2018b; Imanishi et al. 2019).
ALMA is an ideal observing facility to apply this (sub)millimeter dense molecular line energy diagnostic method to nearby (U)LIRGs, owing to very high sensitivity and high spatial resolution which enables to (1) pinpoint nuclear (1 kpc) regions where the putative luminous buried AGNs are expected to be present and (2) investigate AGN effects, by minimizing the contaminations from surrounding spatially extended (a few kpc) starburst emission. However, owing to the current ALMA frequency coverage of 84 GHz (band 3–10), HCN and HCO+ J=1–0 lines cannot be observed for (U)LIRGs at 0.06 where many interesting nearby (U)LIRGs are found (Kim & Sanders 1998). Thus, we observed at J=3–2 and J=4–3 lines of HCN, HCO+, and HNC (Imanishi & Nakanishi 2014; Izumi et al. 2016; Imanishi et al. 2016c; Imanishi et al. 2018b; Imanishi et al. 2019). A trend of elevated HCN emission, relative to HCO+, is observed in (U)LIRGs with luminous AGN signatures, compared to those without (Imanishi & Nakanishi 2014; Izumi et al. 2016; Imanishi et al. 2016c; Imanishi et al. 2018b; Imanishi et al. 2019). An enhanced HCN abundance in AGN-affected dense molecular gas (Aladro et al. 2015; Saito et al. 2018; Takano et al. 2019; Nakajima et al. 2018; Kameno et al. 2020; Imanishi et al. 2020, e.g.,) is one possibility. However, higher rotational excitation of HCN by warm and dense molecular gas in the vicinity of a luminous AGN than in a starburst is another scenario (Imanishi et al. 2018b), because the critical density of HCN is higher by a factor of 5 than that of HCO+ (Shirley 2015). Addition of different J-transition line data can help distinguish the physical origin of the elevated HCN emission in luminous AGNs.
Since ALMA Cycle 5, band 5 (163–211 GHz or 1.8 mm) observations have become available for openuse programs. HCN, HCO+, and HNC J=2–1 transition lines can be observed in band 5 for nearby (U)LIRGs. Because the excitation energy level is lower at J=2 than at J=3 or J=4, we can (1) discuss dense molecular line flux ratios at J=2–1 less affected by uncertainty of excitation conditions than at J=3–2 and J=4–3, and (2) J=2–1 lines of HCN, HCO+, and HNC may be more reliable dense molecular gas mass tracers, by reasonably assuming that J=2–1 lines are thermalized and optically thick (i.e., same luminosity as J=1–0 in units of [K km s-1 pc2]) in (U)LIRGs’ nuclei, where warm and dense molecular gas is highly concentrated (Downes & Eckart 2007; Scoville et al. 2015; Sakamoto et al. 2017; Imanishi et al. 2019, e.g.,). Further, addition of J=2–1 lines of HCN, HCO+, and HNC, to J=3–2 and J=4–3 lines, can be used to better constrain physical properties of dense molecular gas at (U)LIRGs’ nuclei.
In addition, the para-H2O 31,3–22,0 line at rest frequency 183 GHz with an upper energy level of 205 K. (hereafter “183 GHz H2O”) is present in close proximity to the HNC J=2–1 line ( 181 GHz), so they are simultaneously observable using ALMA. In warm and dense molecular gas illuminated by a luminous AGN, it is theoretically predicted that the 183 GHz H2O emission line can be very bright through maser amplification (Deguchi 1977; Neufeld & Melnick 1991; Yates et al. 1997; Maloney et al. 2002, e.g.,) and/or elevated thermal (non-maser) emission owing to enhanced H2O abundance caused by AGN’s X-ray illumination (Neufeld et al. 1994; Meijerink et al. 2012). Although sensitive observations of the 183 GHz H2O lines are difficult for very nearby sources at 0 owing to the poor atmospheric transmission of Earth at 183 GHz, we can observe this line without severe Earth’s atmospheric H2O absorption for (U)LIRGs at 0.02, rendering this H2O line as another potentially good AGN indicator.
In this paper, we present the results of ALMA band 5 (163–211 GHz) and 4 (125–163 GHz) dense molecular (HCN, HCO+, and HNC J=2–1) and 183 GHz H2O line observations of ten (U)LIRGs (Table 1), for which the J=3–2 and J=4–3 line data of HCN, HCO+, and HNC are available (Imanishi & Nakanishi 2013a; Imanishi & Nakanishi 2013b; Imanishi & Nakanishi 2014; Imanishi et al. 2016b; Imanishi et al. 2016c; Imanishi et al. 2017; Imanishi et al. 2018b). Results of a ULIRG, the Superantennae (IRAS 192547245) at 0.0617, where strong signatures of AGN-megamaser-origin luminous 183 GHz H2O emission were found, have previously been published by Imanishi et al. 2021. In this manuscript, we report our band 4–5 (2 mm) observational results of ten (U)LIRGs and discuss general properties of their nuclear dense molecular gas. Compilation of the J=2–1, J=3–2, and J=4–3 line data of HCN, HCO+, and HNC, and detailed discussion of the physical properties of dense molecular gas at (U)LIRGs’ nuclei, with the aid of non-LTE modeling (van der Tak et al. 2007), will be presented in a separate paper (M. Imanishi in preparation). We adopt the cosmological parameters, H0 71 km s-1 Mpc-1, = 0.27, and = 0.73, throughout this paper. Unless otherwise mentioned, “H2O emission” indicates “183 GHz H2O 31,3–22,0 line emission”, while “molecular line flux ratio” indicates “rotational J-transition line flux ratio at the vibrational ground level (v=0)”.
II Targets
Detailed properties of the observed ten (U)LIRGs in Table 1 are described by Imanishi et al. 2016b; Imanishi et al. 2016c; Imanishi et al. 2018b. In short, we selected nearby (U)LIRGs that (1) had different levels of AGN’s energetic contributions to the bolometric luminosity, based on optical/infrared/(sub)millimeter spectroscopic energy diagnostic methods and (2) were expected to show bright molecular emission lines, to investigate their flux ratios with small statistical uncertainty. We regard NGC 1614 and IRAS 135090442 as starburst-dominated, because there are no luminous buried AGN signatures in the infrared as well as (sub)millimeter. IRAS 060357102, IRAS 085723915, IRAS 121271412, IRAS 152503609, the Superantennae, and IRAS 205514250 are diagnosed to contain luminous obscured AGNs based on 3–35 m infrared spectroscopy (Armus et al. 2007; Imanishi et al. 2007a; Imanishi et al. 2008; Veilleux et al. 2009; Nardini et al. 2009; Nardini et al. 2010, e.g.,). IRAS 121120305 and IRAS 224911808 display no obvious luminous AGN signatures in the optical and infrared, but possible signatures of (sub)millimeter-detected extremely deeply buried luminous AGNs were found in IRAS 121120305 NE (north eastern primary nucleus) and IRAS 224911808 (Imanishi et al. 2018b). IRAS 121120305 SW (south western secondary nucleus) is considered starburst-dominated (Imanishi et al. 2018b). Although our sample is not statistically unbiased, nor complete, it can provide useful information on the possible variation of molecular line flux ratios, depending on different AGN’s energetic contributions.
| Object | Redshift | dL | Scale | f12 | f25 | f60 | f100 | log LIR | Optical | IR/(sub)mm |
|---|---|---|---|---|---|---|---|---|---|---|
| [Mpc] | [kpc/′′] | [Jy] | [Jy] | [Jy] | [Jy] | [L⊙] | Class | Class | ||
| (1) | (2) | (3) | (4) | (5) | (6) | (7) | (8) | (9) | (10) | (11) |
| NGC 1614 (IRAS 043150840) | 0.0160 | 68 | 0.32 | 1.38 | 7.50 | 32.12 | 34.32 | 11.7 | HIIa,b (Cpc) | SB |
| IRAS 060357102 | 0.0795 | 356 | 1.5 | 0.12 | 0.57 | 5.13 | 5.65 | 12.2 | LId | AGN |
| IRAS 085723915 | 0.0580 | 256 | 1.1 | 0.32 | 1.70 | 7.43 | 4.59 | 12.1 | LIe(Sy2c) | AGN |
| IRAS 121120305 | 0.0730 | 326 | 1.4 | 0.12 | 0.51 | 8.50 | 9.98 | 12.3 | LIe (Sy2c) | AGN + SB |
| IRAS 121271412 | 0.1332 | 620 | 2.3 | 0.13 | 0.24 | 1.54 | 1.13 | 12.2 | LIe (HIIc) | AGN |
| IRAS 135090442 | 0.1364 | 636 | 2.4 | 0.10 | 0.23 | 1.56 | 2.53 | 12.3 | HIIe (Cpc) | SB |
| IRAS 152503609 | 0.0552 | 243 | 1.1 | 0.16 | 1.31 | 7.10 | 5.93 | 12.0 | LIa (Cpc) | AGN |
| Superantennae (IRAS 192547245) | 0.0617 | 273 | 1.2 | 0.22 | 1.24 | 5.48 | 5.79 | 12.1 | Sy2b,d,f,g | AGN |
| IRAS 205514250 | 0.0430 | 188 | 0.84 | 0.28 | 1.91 | 12.78 | 9.95 | 12.0 | LI or HIId (Cpc) | AGN |
| IRAS 224911808 | 0.0776 | 347 | 1.5 | 0.05 | 0.55 | 5.44 | 4.45 | 12.2 | HIIc,e | AGN |
Note. — Col.(1): Object name. Col.(2): Redshift adopted from ALMA dense molecular line data (Imanishi et al. 2016c), which are slightly different from the optically derived ones (Kim & Sanders 1998) in some cases. Col.(3): Luminosity distance (in Mpc). Col.(4): Physical scale (in kpc arcsec-1). Col.(5)–(8): f12, f25, f60, and f100 are IRAS fluxes at 12 m, 25 m, 60 m, and 100 m, respectively, taken from Kim & Sanders 1998 or Sanders et al. 2003 or the IRAS Faint Source Catalog (FSC). Col.(9): Decimal logarithm of infrared (81000 m) luminosity in units of solar luminosity (L⊙), calculated with D(Mpc)2 (13.48 + 5.16 + ) (ergs s-1) (Sanders & Mirabel 1996). Col.(10): Optical spectroscopic classification. “Sy2”, “LI”, “HII”, and “Cp” mean Seyfert 2, LINER, HII-region, and starburstAGN composite, respectively. a: Veilleux et al. 1995. b: Kewley et al. 2001. c: Yuan et al. 2010. d: Duc et al. 1997. e: Veilleux et al. 1999. f: Mirabel et al. 1991. g: Colina et al. 1991. Col.(10): Infrared and (sub)millimeter energy diagnostic result. “AGN” and “SB” mean AGN-important (AGN signatures significantly detected) and starburst-dominated (no AGN signature), respectively. IRAS 121120305 consists of two galaxy nuclei, AGN-important primary nucleus and starburst-dominated secondary nucleus (2).
III Observations and Data Analysis
We conducted band 5 (163–211 GHz) and 4 (125–163 GHz) observations of nine ULIRGs and one LIRG NGC 1614 (Table 1) in our ALMA Cycle 5 programs 2017.1.00022.S and 2017.1.00023.S (PI = M. Imanishi). Data of dense molecular gas tracers, HCN J=2–1 ( = 177.261 GHz) and HCO+ J=2–1 ( = 178.375 GHz) lines, were obtained in one observation (called as “J21a”). Data of HNC J=2–1 ( = 181.325 GHz) and 31,3–22,0 line of para-H2O at = 183.310 GHz (183 GHz H2O) were obtained separately (“J21b”). Table 2 summarizes our observation details.
| Object | Line | Date | Antenna | Baseline | Integration | Calibrator | ||
|---|---|---|---|---|---|---|---|---|
| [UT] | Number | [m] | [min] | Bandpass | Flux | Phase | ||
| (1) | (2) | (3) | (4) | (5) | (6) | (7) | (8) | (9) |
| NGC 1614 | HCN/HCO+ J=2–1 (J21a) | 2018 September 12 | 41 | 15–1231 | 13 | J04230120 | J04230120 | J04220643 |
| HNC J=2–1/183 GHz H2O (J21b) | 2018 September 12 | 41 | 15–1231 | 20 | J04230120 | J04230120 | J04220643 | |
| IRAS 060357102 | HCN/HCO+ J=2–1 (J21a) | 2018 August 26 | 42 | 15–782 | 6 | J05194546 | J05194546 | J06017036 |
| HNC J=2–1/183 GHz H2O (J21b) | 2018 September 21 | 43 | 15–1398 | 15 | J06357516 | J06357516 | J06017036 | |
| IRAS 085723915 | HCN/HCO+ J=2–1 (J21a) | 2018 April 1 | 41 | 15–704 | 19 | J08542006 | J08542006 | J09163854 |
| 2018 September 19 | 41 | 15–1398 | 19 | J08542006 | J08542006 | J09163854 | ||
| HNC J=2–1/183 GHz H2O (J21b) | 2018 September 19 | 41 | 15–1398 | 27 | J08542006 | J08542006 | J09163854 | |
| IRAS 121120305 | HCN/HCO+ J=2–1 (J21a) | 2018 April 1 | 41 | 15–704 | 11 | J12290203 | J12290203 | J12200203 |
| HNC J=2–1/183 GHz H2O (J21b) | 2018 September 6 | 43 | 15–784 | 6 | J12290203 | J12290203 | J12200203 | |
| IRAS 121271412 | HCN/HCO+ J=2–1 (J21a) | 2017 December 15 | 45 | 15–2517 | 20 | J11271857 | J11271857 | J12151731 |
| HNC J=2–1/183 GHz H2O (J21b) | 2017 December 14 | 49 | 15–3321 | 33 | J11271857 | J12151731 | J11271857 | |
| IRAS 135090442 | HCN/HCO+ J=2–1 (J21a) | 2017 December 14 | 46 | 15–3083 | 16 | J12560547 | J12560547 | J13590159 |
| HNC J=2–1/183 GHz H2O (J21b) | 2017 December 13 | 44 | 15–3083 | 22 | J12560547 | J12560547 | J13590159 | |
| 2017 December 24 | 43 | 15–2517 | 22 | J12560547 | J12560547 | J13590159 | ||
| IRAS 152503609 | HCN/HCO+ J=2–1 (J21a) | 2018 August 31 | 43 | 15–784 | 14 | J15500527 | J15500527 | J16133412 |
| HNC J=2–1/183 GHz H2O (J21b) | 2018 August 28 | 44 | 15–782 | 13 | J15500527 | J15500527 | J16133412 | |
| 2018 September 20 | 43 | 15–1398 | 13 | J15500527 | J15500527 | J16133412 | ||
| Superantennae | HCN/HCO+ J=2–1 (J21a) | 2018 September 18 | 43 | 15–1398 | 6 | J16175848 | J16175848 | J18377108 |
| HNC J=2–1/183 GHz H2O (J21b) | 2018 September 18 | 43 | 15–1398 | 27 | J16175848 | J16175848 | J18377108 | |
| IRAS 205514250 | HCN/HCO+ J=2–1 (J21a) | 2018 August 24 | 45 | 15–500 | 48 | J20564714 | J20564714 | J21094110 |
| 2018 August 24 | 45 | 15–500 | 48 | J20564714 | J20564714 | J21094110 | ||
| HNC J=2–1/183 GHz H2O (J21b) | 2018 August 31 | 45 | 15–784 | 37 | J20564714 | J20564714 | J21094110 | |
| 2018 August 31 | 45 | 15–784 | 37 | J20564714 | J20564714 | J21094110 | ||
| 2018 September 20 | 46 | 15–1398 | 37 | J20564714 | J20564714 | J21094110 | ||
| IRAS 224911808 | HCN/HCO+ J=2–1 (J21a) | 2018 September 20 | 46 | 15–1398 | 7 | J22582758 | J22582758 | J22361433 |
| HNC J=2–1/183 GHz H2O (J21b) | 2018 September 20 | 46 | 15–1398 | 8 | J22582758 | J22582758 | J22361433 | |
Note. — Col.(1): Object name. Col.(2): Observed molecular line. Col.(3): Observation date in UT. Col.(4): Number of antennas used for observations. Col.(5): Baseline length in meters. Minimum and maximum baseline lengths are shown. Col.(6): Net on source integration time in minutes. Cols.(7), (8), and (9): Bandpass, flux, and phase calibrator for the target source, respectively.
We employed the widest 1.875 GHz mode with 1920 channels for each spectral window. For the J21a observations, we included HCN J=2–1 and HCO+ J=2–1 lines in two spectral windows in one sideband (LSB or USB). The vibrationally excited v2=1, l=1f (v2=1f) HCN (hereafter HCN-VIB) J=2–1 line at = 178.136 GHz and vibrationally excited v2=1f HCO+ (HCO+-VIB) J=2–1 line at = 179.129 GHz were also included in this sideband. Further, two spectral windows were set in another sideband to observe continuum and serendipitously detected lines. For the J21b observations, we covered the HNC J=2–1 and 183 GHz H2O lines and vibrationally excited v2=1f HNC (HNC-VIB) J=2–1 line at = 182.584 GHz in two spectral windows on one sideband, and used two additional spectral windows in another sideband. In band 5, the atmospheric transmission of Earth is very low at the observed frequency = 182–184.5 GHz by H2O absorption centered at 183.3 GHz. Although the targeted molecular lines of our sources were confirmed to be not strongly affected by the Earth’s atmospheric absorption, the other sideband in some sources fell into the frequency of low Earth’s atmospheric transmission. These data were completely flagged by ALMA pipeline processes and not used for our analysis.
We started our analysis from pipeline-processed data by ALMA, using CASA (McMullin et al. 2007) 11 1 https://casa.nrao.edu. We determined the continuum level using channels that did not contain discernible emission lines, and subtracted it using the CASA task “uvcontsub”. We then applied the CASA task “clean” (Briggs weighting; robust 0.5 and gain 0.1) to create maps of the continuum-subtracted molecular line data, by binning 20 channels for all ULIRGs (velocity resolution 35 km s-1). For the LIRG NGC 1614, we applied 10 channels binning (20 km s-1), because molecular emission lines were much narrower than those of other ULIRGs. In addition, we created cleaned continuum maps by integrating the line-free-channels’ data.
The pixel scales were set as 0025–01 pixel-1, which were less than one-fifth of the synthesized beam size of each data. We adopted 10% absolute flux calibration uncertainty for our band 4--5 data, based on the ALMA Cycle 5 Proposer’s Guide 22 2 https://almascience.eso.org/documents-and-tools/cycle5/alma-proposers-guide
IV Results
Continuum emission at 2 mm is detected in all sources and is displayed in Figure 1 as contours. Table 3 summarizes detailed continuum emission properties. The achieved beam size is 1′′ (i.e., sub-arcsecond) for all the obtained data. According to the ALMA Cycle 5 Technical Handbook (equation 7.6) 33 3 https://almascience.eso.org/documents-and-tools/cycle5/alma-technical-handbook, the maximum recoverable scale (MRS) is 10′′ at 2 mm for the minimum baseline of 15 m (Table 2), which corresponds to 8 kpc for all the ULIRGs and 3 kpc for the LIRG NGC 1614. Thus, our targeting dense molecular line emission in compact nuclei (a few kpc) should be fully recovered.
![[Uncaptioned image]](2111.09338v1/f1a.png)
![[Uncaptioned image]](2111.09338v1/f1b.png)
![[Uncaptioned image]](2111.09338v1/f1c.png)
![[Uncaptioned image]](2111.09338v1/f1d.png)
![[Uncaptioned image]](2111.09338v1/f1e.png)
![[Uncaptioned image]](2111.09338v1/f1f.png)
![[Uncaptioned image]](2111.09338v1/f1g.png)
![[Uncaptioned image]](2111.09338v1/f1h.png)
![[Uncaptioned image]](2111.09338v1/f1i.png)
![[Uncaptioned image]](2111.09338v1/f1j.png)
![[Uncaptioned image]](2111.09338v1/f1k.png)
![[Uncaptioned image]](2111.09338v1/f1l.png)
![[Uncaptioned image]](2111.09338v1/f1m.png)
![[Uncaptioned image]](2111.09338v1/f1n.png)
![[Uncaptioned image]](2111.09338v1/f1o.png)
![[Uncaptioned image]](2111.09338v1/f1p.png)
![[Uncaptioned image]](2111.09338v1/f1q.png)
![[Uncaptioned image]](2111.09338v1/f1r.png)
![[Uncaptioned image]](2111.09338v1/f1s.png)
![[Uncaptioned image]](2111.09338v1/f1t.png)
![[Uncaptioned image]](2111.09338v1/f1u.png)


| Object | Frequency | Flux | Peak Coordinate | rms | Synthesized beam |
|---|---|---|---|---|---|
| [GHz] | [mJy/beam] | (RA,DEC)ICRS | [mJy/beam] | [′′ ′′] (∘) | |
| (1) | (2) | (3) | (4) | (5) | (6) |
| NGC 1614 W | J21a (173.2–176.9, 185.4–189.1) | 0.88 (10) | (04h33m59.98s, 08∘34′45.1′′) | 0.088 | 0.550.37 (83∘) |
| J21b (177.4–181.2, 189.6–193.3) | 0.76 (8.1) | (04h33m59.99s, 08∘34′45.3′′) | 0.093 | 0.580.33 (79∘) | |
| NGC 1614 N | J21a (173.2–176.9, 185.4–189.1) | 0.96 (11) | (04h34m00.01s, 08∘34′44.6′′) | 0.088 | 0.550.37 (83∘) |
| J21b (177.4–181.2, 189.6–193.3) | 0.86 (9.3) | (04h34m00.01s, 08∘34′44.6′′) | 0.093 | 0.580.33 (79∘) | |
| NGC 1614 S | J21a (173.2–176.9, 185.4–189.1) | 0.80 (9.1) | (04h34m00.03s, 08∘34′45.7′′) | 0.088 | 0.550.37 (83∘) |
| J21b (177.4–181.2, 189.6–193.3) | 0.73 (7.8) | (04h34m00.03s, 08∘34′45.7′′) | 0.093 | 0.580.33 (79∘) | |
| NGC 1614 E | J21a (173.2–176.9, 185.4–189.1) | 0.75 (8.5) | (04h34m00.07s, 08∘34′45.2′′) | 0.088 | 0.550.37 (83∘) |
| J21b (177.4–181.2, 189.6–193.3) | 0.73 (7.9) | (04h34m00.07s, 08∘34′45.2′′) | 0.093 | 0.580.33 (79∘) | |
| IRAS 060357102 | J21a (163.1–166.7, 175.0–178.7) | 1.0 (9.8) | (06h02m53.94s, 71∘03′10.2′′) | 0.10 | 1.10.80 (50∘) |
| J21b (166.9–170.7, 178.9–182.6) | 0.83 (13) | (06h02m53.94s, 71∘03′10.2′′) | 0.064 | 0.480.34 (6∘) | |
| IRAS 085723915 | J21a (166.2–169.9) | 1.4 (18) | (09h00m25.37s, 39∘03′54.1′′) | 0.080 | 0.710.35 (1∘) |
| J21b (170.3–174.1) | 1.6 (22) | (09h00m25.37s, 39∘03′54.1′′) | 0.073 | 0.680.33 (14∘) | |
| IRAS 121120305 NE | J21a (163.9–167.5, 175.7–179.4) | 3.4 (33) | (12h13m46.06s, 02∘48′41.5′′) | 0.10 | 0.870.68 (29∘) |
| J21b (167.9–171.5) | 3.6 (18) | (12h13m46.06s, 02∘48′41.4′′) | 0.20 | 0.830.57 (61∘) | |
| IRAS 121120305 SW | J21a (163.9–167.5, 175.7–179.4) | 0.39 (3.9) | (12h13m45.95s, 02∘48′39.1′′) | 0.10 | 0.870.68 (29∘) |
| J21b (167.9–171.7) | 0.39 (1.9) | (12h13m45.93s, 02∘48′39.0′′) | 0.20 | 0.830.57 (61∘) | |
| IRAS 121271412 AABand 4 observation because the targeted molecular lines are redshifted into Band 4 (125–163 GHz). | J21a (142.9–146.4, 155.1–158.7) AABand 4 observation because the targeted molecular lines are redshifted into Band 4 (125–163 GHz). | 0.84 (34) | (12h15m19.13s, 14∘29′41.8′′) | 0.024 | 0.290.19 (81∘) |
| J21b (159.0–162.7) AABand 4 observation because the targeted molecular lines are redshifted into Band 4 (125–163 GHz). | 0.85 (42) | (12h15m19.13s, 14∘29′41.8′′) | 0.020 | 0.240.16 (59∘) | |
| IRAS 135090442 AABand 4 observation because the targeted molecular lines are redshifted into Band 4 (125–163 GHz). | J21a (142.5–146.0, 154.7–158.2) AABand 4 observation because the targeted molecular lines are redshifted into Band 4 (125–163 GHz). | 0.27 (10) | (13h53m31.57s, 04∘28′04.8′′) | 0.027 | 0.270.19 (68∘) |
| J21b (158.5–162.2) AABand 4 observation because the targeted molecular lines are redshifted into Band 4 (125–163 GHz). | 0.21 (7.2) | (13h53m31.57s, 04∘28′04.8′′) | 0.029 | 0.290.18 (63∘) | |
| IRAS 152503609 | J21a (166.7–170.3) | 5.1 (22) | (15h26m59.42s, 35∘58′37.4′′) | 0.23 | 1.10.68 (22∘) |
| J21b (170.8–174.6) | 5.6 (47) | (15h26m59.42s, 35∘38′37.4′′) | 0.12 | 0.700.39 (10∘) | |
| Superantennae | J21a (165.6–169.3) | 3.1 (15) | (19h31m21.45s, 72∘39′21.5′′) | 0.21 | 0.540.36 (26∘) |
| J21b (169.7–173.5) | 3.4 (30) | (19h31m21.43s, 72∘39′21.5′′) | 0.11 | 0.490.34 (10∘) | |
| IRAS 205514250 | J21a (168.6–172.3) | 2.5 (43) | (20h58m26.80s, 42∘39′00.3′′) | 0.058 | 1.10.82 (89∘) |
| J21b (172.8–176.5, 185.0–188.7) | 2.3 (63) | (20h58m26.80s, 42∘39′00.3′′) | 0.036 | 0.610.41 (84∘) | |
| IRAS 224911808 | J21a (163.2–166.8, 175.0–178.6) | 2.0 (23) | (22h51m49.35s, 17∘52′24.1′′) | 0.088 | 0.500.33 (76∘) |
| J21b (167.2–171.0) | 2.2 (20) | (22h51m49.35s, 17∘52′24.1′′) | 0.11 | 0.410.34 (89∘) |
Note. — Col.(1): Object name. Col.(2): Frequency range in GHz used for continuum extraction. Frequencies of obvious emission lines were removed. When only one frequency range is shown, it means that data in another sideband were noisy owing to poor Earth’s atmospheric transmission, and were not used. Col.(3): Flux density (in mJy beam-1) at the emission peak. Value at the highest flux pixel (0025–01 pixel-1) is extracted. The detection significance relative to the root mean square (rms) noise is shown in parentheses. Col.(4): Coordinate of the continuum emission peak in ICRS. Col.(5): The rms noise level (1) (in mJy beam-1), derived from the standard deviation of sky signals in each continuum map. Col.(6): Synthesized beam (in arcsec arcsec) and position angle (in degrees). The position angle is 0∘ along the north–south direction and increases in the counterclockwise direction.
In the LIRG NGC 1614, there are four bright continuum emission peaks, denoted as NGC 1614 W, N, S, and E (Figure 1). In IRAS 121120305, continuum emission is significantly (3) detected not only in the north-eastern (NE) primary nucleus, but also in the south-western (SW) secondary nucleus (Figure 1). Continuum emission properties of these multiple positions are tabulated in Table 3. For other ULIRGs, continuum emission is clearly detected only in the primary nucleus. In the fields of IRAS 135090442 and the Superantennae, a bright continuum emitting source is serendipitously detected at 8′′ north and 8′′ south side of the primary ULIRG’s nucleus, respectively. These continuum sources are unlikely to be physically related to each ULIRG, and thus their observed properties are described in Appendix A. In short, the former and latter sources are likely to be an infrared luminous dusty galaxy at 1 and a blazar, respectively.
Integrated intensity (moment 0) maps of the HCN J=2–1, HCO+ J=2–1, HNC J=2–1 and 183 GHz H2O lines are created by integrating signals in channels with significant line detection, and the peak emission flux as well as detection significance is tabulated in Table 4. Figure 1 displays the moment 0 maps of these emission lines with significant (3) detection. The peak positions of these detected molecular emission lines spatially agree with the simultaneously obtained continuum data.
| Peak [Jy beam-1 km s-1] | ||||
|---|---|---|---|---|
| Object | HCN J=2–1 | HCO+ J=2–1 | HNC J=2–1 | 183 GHz H2O |
| (1) | (2) | (3) | (4) | (5) |
| NGC 1614 W | 0.40 (6.6) AAFor NGC 1614, integrated channels are determined to cover all of the nuclear (1 kpc) emission components. Molecular emission at individual continuum peaks is narrower than the whole nuclear emission and has different peak velocity (Table 6 and Figure 2). Thus, the detection significance is apparently low, owing to increased noise originating from the integration of a large number of channels, even if narrow emission line signatures are clearly discernible in original beam spectra (Figure 2). | 0.79 (8.3) AAFor NGC 1614, integrated channels are determined to cover all of the nuclear (1 kpc) emission components. Molecular emission at individual continuum peaks is narrower than the whole nuclear emission and has different peak velocity (Table 6 and Figure 2). Thus, the detection significance is apparently low, owing to increased noise originating from the integration of a large number of channels, even if narrow emission line signatures are clearly discernible in original beam spectra (Figure 2). | 0.29 (3) AAFor NGC 1614, integrated channels are determined to cover all of the nuclear (1 kpc) emission components. Molecular emission at individual continuum peaks is narrower than the whole nuclear emission and has different peak velocity (Table 6 and Figure 2). Thus, the detection significance is apparently low, owing to increased noise originating from the integration of a large number of channels, even if narrow emission line signatures are clearly discernible in original beam spectra (Figure 2). | 0.31 (3) AAFor NGC 1614, integrated channels are determined to cover all of the nuclear (1 kpc) emission components. Molecular emission at individual continuum peaks is narrower than the whole nuclear emission and has different peak velocity (Table 6 and Figure 2). Thus, the detection significance is apparently low, owing to increased noise originating from the integration of a large number of channels, even if narrow emission line signatures are clearly discernible in original beam spectra (Figure 2). |
| NGC 1614 N | 0.49 (8.1) AAFor NGC 1614, integrated channels are determined to cover all of the nuclear (1 kpc) emission components. Molecular emission at individual continuum peaks is narrower than the whole nuclear emission and has different peak velocity (Table 6 and Figure 2). Thus, the detection significance is apparently low, owing to increased noise originating from the integration of a large number of channels, even if narrow emission line signatures are clearly discernible in original beam spectra (Figure 2). | 0.84 (8.8) AAFor NGC 1614, integrated channels are determined to cover all of the nuclear (1 kpc) emission components. Molecular emission at individual continuum peaks is narrower than the whole nuclear emission and has different peak velocity (Table 6 and Figure 2). Thus, the detection significance is apparently low, owing to increased noise originating from the integration of a large number of channels, even if narrow emission line signatures are clearly discernible in original beam spectra (Figure 2). | 0.29 (3) AAFor NGC 1614, integrated channels are determined to cover all of the nuclear (1 kpc) emission components. Molecular emission at individual continuum peaks is narrower than the whole nuclear emission and has different peak velocity (Table 6 and Figure 2). Thus, the detection significance is apparently low, owing to increased noise originating from the integration of a large number of channels, even if narrow emission line signatures are clearly discernible in original beam spectra (Figure 2). | 0.31 (3) AAFor NGC 1614, integrated channels are determined to cover all of the nuclear (1 kpc) emission components. Molecular emission at individual continuum peaks is narrower than the whole nuclear emission and has different peak velocity (Table 6 and Figure 2). Thus, the detection significance is apparently low, owing to increased noise originating from the integration of a large number of channels, even if narrow emission line signatures are clearly discernible in original beam spectra (Figure 2). |
| NGC 1614 S | 0.34 (5.5) AAFor NGC 1614, integrated channels are determined to cover all of the nuclear (1 kpc) emission components. Molecular emission at individual continuum peaks is narrower than the whole nuclear emission and has different peak velocity (Table 6 and Figure 2). Thus, the detection significance is apparently low, owing to increased noise originating from the integration of a large number of channels, even if narrow emission line signatures are clearly discernible in original beam spectra (Figure 2). | 0.56 (5.9) AAFor NGC 1614, integrated channels are determined to cover all of the nuclear (1 kpc) emission components. Molecular emission at individual continuum peaks is narrower than the whole nuclear emission and has different peak velocity (Table 6 and Figure 2). Thus, the detection significance is apparently low, owing to increased noise originating from the integration of a large number of channels, even if narrow emission line signatures are clearly discernible in original beam spectra (Figure 2). | 0.32 (3.0) AAFor NGC 1614, integrated channels are determined to cover all of the nuclear (1 kpc) emission components. Molecular emission at individual continuum peaks is narrower than the whole nuclear emission and has different peak velocity (Table 6 and Figure 2). Thus, the detection significance is apparently low, owing to increased noise originating from the integration of a large number of channels, even if narrow emission line signatures are clearly discernible in original beam spectra (Figure 2). | 0.31 (3) AAFor NGC 1614, integrated channels are determined to cover all of the nuclear (1 kpc) emission components. Molecular emission at individual continuum peaks is narrower than the whole nuclear emission and has different peak velocity (Table 6 and Figure 2). Thus, the detection significance is apparently low, owing to increased noise originating from the integration of a large number of channels, even if narrow emission line signatures are clearly discernible in original beam spectra (Figure 2). |
| NGC 1614 E | 0.29 (4.8) AAFor NGC 1614, integrated channels are determined to cover all of the nuclear (1 kpc) emission components. Molecular emission at individual continuum peaks is narrower than the whole nuclear emission and has different peak velocity (Table 6 and Figure 2). Thus, the detection significance is apparently low, owing to increased noise originating from the integration of a large number of channels, even if narrow emission line signatures are clearly discernible in original beam spectra (Figure 2). | 0.54 (5.7) AAFor NGC 1614, integrated channels are determined to cover all of the nuclear (1 kpc) emission components. Molecular emission at individual continuum peaks is narrower than the whole nuclear emission and has different peak velocity (Table 6 and Figure 2). Thus, the detection significance is apparently low, owing to increased noise originating from the integration of a large number of channels, even if narrow emission line signatures are clearly discernible in original beam spectra (Figure 2). | 0.29 (3) AAFor NGC 1614, integrated channels are determined to cover all of the nuclear (1 kpc) emission components. Molecular emission at individual continuum peaks is narrower than the whole nuclear emission and has different peak velocity (Table 6 and Figure 2). Thus, the detection significance is apparently low, owing to increased noise originating from the integration of a large number of channels, even if narrow emission line signatures are clearly discernible in original beam spectra (Figure 2). | 0.31 (3) AAFor NGC 1614, integrated channels are determined to cover all of the nuclear (1 kpc) emission components. Molecular emission at individual continuum peaks is narrower than the whole nuclear emission and has different peak velocity (Table 6 and Figure 2). Thus, the detection significance is apparently low, owing to increased noise originating from the integration of a large number of channels, even if narrow emission line signatures are clearly discernible in original beam spectra (Figure 2). |
| IRAS 060357102 | 2.5 (19) | 3.1 (20) | 1.0 (14) | 0.45 (9.4) |
| IRAS 085723915 | 1.1 (13) | 1.4 (15) | 0.37 (8.3) | 0.57 (11) |
| IRAS 121120305 NE | 4.7 (26) | 2.6 (19) | 3.4 (15) | 1.9 (14) |
| IRAS 121120305 SW | 0.43 (4.2) BBIntegrated channels are optimized for the SW nucleus, because the molecular emission from the SW nucleus is faint and has a significantly different velocity profile from the brighter NE nucleus. | 0.88 (7.9) BBIntegrated channels are optimized for the SW nucleus, because the molecular emission from the SW nucleus is faint and has a significantly different velocity profile from the brighter NE nucleus. | 0.34 (3) BBIntegrated channels are optimized for the SW nucleus, because the molecular emission from the SW nucleus is faint and has a significantly different velocity profile from the brighter NE nucleus. | 0.45 (3) BBIntegrated channels are optimized for the SW nucleus, because the molecular emission from the SW nucleus is faint and has a significantly different velocity profile from the brighter NE nucleus. |
| IRAS 121271412 | 0.48 (8.2) | 0.33 (6.8) | 0.32 (7.6) | 0.22 (4.6) |
| IRAS 135090442 | 0.28 (5.7) | 0.28 (5.3) | 0.16 (5.5) | 0.15 (3.8) |
| IRAS 152503609 | 3.0 (20) | 1.3 (13) | 3.0 (19) | 2.7 (20) |
| Superantennae | 2.9 (12) | 1.6 (11) | 1.1 (10) | 4.3 (21) |
| IRAS 205514250 | 4.4 (53) | 6.0 (59) | 1.8 (30) | 1.3 (27) |
| IRAS 224911808 | 3.9 (24) | 2.5 (20) | 2.4 (23) | 1.3 (17) |
Note. — Col.(1): Object name. Cols.(2)–(4): Flux (in Jy beam-1 km s-1) at the emission peak in the integrated intensity (moment 0) map with original synthesized beam. Detection significance relative to the rms noise (1) in the moment 0 map is shown in parentheses. These moment 0 maps of the original beam are primarily used for (a) verification of significant detection at the peak position of the molecular line and (b) confirming its spatial coincidence with continuum peak within peak determination uncertainty (= beam-size/signal-to-noise [S/N] ratio). Col.(2): HCN J=2–1 (=177.261 GHz). Col.(3): HCO+ J=2–1 (=178.375 GHz). Col.(4): HNC J=2–1 (=181.325 GHz). Col.(5): Para-H2O 31,3–22,0 (=183.310 GHz). In each object, the synthesized beam size of the HCN J=2–1 and HCO+ J=2–1 (HNC J=2–1 and H2O) is virtually identical to that of continuum J21a (J21b) shown in Table 3, column 6.
For the nearby LIRG NGC 1614 ( 0.0160), the continuum and molecular line emission are spatially extended, and are substantially larger than the synthesized beam size (Figure 1). We create spectra from original beam data cubes (hereafter “original beam”) at four bright continuum emission peaks, which are shown in Figure 2. In Figure 3, we display original beam spectra at the primary continuum peak in each ULIRG, except for the double nuclei ULIRG IRAS 121120305 for which the spectra at both nuclei are shown separately.
Figure 4 shows the intensity-weighted mean velocity (moment 1) maps of the HCN J=2–1, HCO+ J=2–1, HNC J=2–1, and 183 GHz H2O emission lines whenever they are detected with significantly high S/N ratios to obtain meaningful velocity information (Table 4). Intensity-weighted velocity dispersion (moment 2) maps are also shown in Figure 5.
![[Uncaptioned image]](2111.09338v1/f2a.png)
![[Uncaptioned image]](2111.09338v1/f2b.png)
![[Uncaptioned image]](2111.09338v1/f2c.png)
![[Uncaptioned image]](2111.09338v1/f2d.png)
![[Uncaptioned image]](2111.09338v1/f2e.png)
![[Uncaptioned image]](2111.09338v1/f2f.png)
![[Uncaptioned image]](2111.09338v1/f2g.png)
![[Uncaptioned image]](2111.09338v1/f2h.png)


![[Uncaptioned image]](2111.09338v1/f3a.png)
![[Uncaptioned image]](2111.09338v1/f3b.png)
![[Uncaptioned image]](2111.09338v1/f3c.png)
![[Uncaptioned image]](2111.09338v1/f3d.png)
![[Uncaptioned image]](2111.09338v1/f3e.png)
![[Uncaptioned image]](2111.09338v1/f3f.png)
![[Uncaptioned image]](2111.09338v1/f3g.png)
![[Uncaptioned image]](2111.09338v1/f3h.png)
![[Uncaptioned image]](2111.09338v1/f3i.png)
![[Uncaptioned image]](2111.09338v1/f3j.png)
![[Uncaptioned image]](2111.09338v1/f3k.png)
![[Uncaptioned image]](2111.09338v1/f3l.png)
![[Uncaptioned image]](2111.09338v1/f3m.png)
![[Uncaptioned image]](2111.09338v1/f3n.png)
![[Uncaptioned image]](2111.09338v1/f3o.png)
![[Uncaptioned image]](2111.09338v1/f3p.png)


![[Uncaptioned image]](2111.09338v1/f4a.png)
![[Uncaptioned image]](2111.09338v1/f4b.png)
![[Uncaptioned image]](2111.09338v1/f4c.png)
![[Uncaptioned image]](2111.09338v1/f4d.png)
![[Uncaptioned image]](2111.09338v1/f4e.png)
![[Uncaptioned image]](2111.09338v1/f4f.png)
![[Uncaptioned image]](2111.09338v1/f4g.png)
![[Uncaptioned image]](2111.09338v1/f4h.png)
![[Uncaptioned image]](2111.09338v1/f4i.png)
![[Uncaptioned image]](2111.09338v1/f4j.png)
![[Uncaptioned image]](2111.09338v1/f4k.png)
![[Uncaptioned image]](2111.09338v1/f4l.png)
![[Uncaptioned image]](2111.09338v1/f4m.png)
![[Uncaptioned image]](2111.09338v1/f4n.png)
![[Uncaptioned image]](2111.09338v1/f4o.png)
![[Uncaptioned image]](2111.09338v1/f4p.png)
![[Uncaptioned image]](2111.09338v1/f4q.png)
![[Uncaptioned image]](2111.09338v1/f4r.png)
![[Uncaptioned image]](2111.09338v1/f4s.png)
![[Uncaptioned image]](2111.09338v1/f4t.png)
![[Uncaptioned image]](2111.09338v1/f4u.png)


![[Uncaptioned image]](2111.09338v1/f5a.png)
![[Uncaptioned image]](2111.09338v1/f5b.png)
![[Uncaptioned image]](2111.09338v1/f5c.png)
![[Uncaptioned image]](2111.09338v1/f5d.png)
![[Uncaptioned image]](2111.09338v1/f5e.png)
![[Uncaptioned image]](2111.09338v1/f5f.png)
![[Uncaptioned image]](2111.09338v1/f5g.png)
![[Uncaptioned image]](2111.09338v1/f5h.png)
![[Uncaptioned image]](2111.09338v1/f5i.png)
![[Uncaptioned image]](2111.09338v1/f5j.png)
![[Uncaptioned image]](2111.09338v1/f5k.png)
![[Uncaptioned image]](2111.09338v1/f5l.png)
![[Uncaptioned image]](2111.09338v1/f5m.png)
![[Uncaptioned image]](2111.09338v1/f5n.png)
![[Uncaptioned image]](2111.09338v1/f5o.png)
![[Uncaptioned image]](2111.09338v1/f5p.png)
![[Uncaptioned image]](2111.09338v1/f5q.png)
![[Uncaptioned image]](2111.09338v1/f5r.png)
![[Uncaptioned image]](2111.09338v1/f5s.png)
![[Uncaptioned image]](2111.09338v1/f5t.png)
![[Uncaptioned image]](2111.09338v1/f5u.png)


Since probed physical scale in the original beam spectra is largely different among different (U)LIRGs (Table 3), we compare molecular emission line fluxes with the same physical scale for further discussion. We choose 1 kpc, because we can investigate dense molecular emission line properties at energetically dominant ULIRGs’ nuclei (Soifer et al. 2000; Diaz-Santos et al. 2010; Imanishi et al. 2011; Pereira-Santaella et al. 2021, e.g.,), with minimum contaminations from spatially extended (a few kpc) star-formation in the host galaxies. We modify the beam to 1 kpc for all molecular lines in ULIRGs if their beam sizes are smaller than 1 kpc, using the CASA task “imsmooth”, and then extract 1 kpc beam-sized spectra, which are overplotted as red dotted lines in Figure 3. This is the case for all ULIRGs except IRAS 060357102, IRAS 121120305, and IRAS 152503609, for which we set the beam size to 1.6 kpc, 1.2 kpc, and 1.2 kpc, respectively, because the beam size of some lines is larger than 1 kpc. Hereafter, we denote these spectra with 1–1.6 kpc beam sizes as “1kpc-beam” spectra. For the LIRG NGC 1614, we modify the beam size of all molecular lines to 200 pc and extracted 200pc-beam spectra at four bright continuum peak positions, which are shown as red dotted lines in Figure 2a–h. We also create 1kpc-beam spectra for NGC 1614 (Figure 2i–j) for comparison with other ULIRGs.
As expected for the presence of spatially resolved components, emission line peak fluxes usually increase with increasing beam sizes for all (U)LIRGs. Flux density at the continuum peak position in 1kpc-beam data is tabulated in Table 5. The continuum flux density significantly increases from the original beam data (Table 3) in many sources.
| Peak [mJy/beam] | ||
|---|---|---|
| Object | J21a | J21b |
| (1) | (2) | (3) |
| NGC 1614 (1 kpc, 31) | 10 (7.5) | 11 (5.1) |
| IRAS 060357102 (1.6 kpc, 11) | 1.1 (10) | 1.2 (10) |
| IRAS 085723915 (1 kpc, 090) | 1.8 (17) | 1.9 (17) |
| IRAS 121120305 NE (1.2 kpc, 087) | 3.4 (31) | 3.7 (17) |
| IRAS 121120305 SW (1.2 kpc, 087) | 0.39 (3.6) | 0.41 (1.9) |
| IRAS 121271412 (1 kpc, 043) | 1.0 (27) | 1.1 (32) |
| IRAS 135090442 (1 kpc, 042) | 0.47 (12) | 0.40 (10) |
| IRAS 152503609 (1.2 kpc, 11) | 5.4 (21) | 6.6 (29) |
| Superantennae (1 kpc, 085) | 3.9 (14) | 4.3 (23) |
| IRAS 205514250 (1 kpc, 12) | 2.6 (45) | 2.8 (33) |
| IRAS 224911808 (1 kpc, 069) | 2.1 (20) | 2.6 (16) |
Note. — Col.(1): Object name. Beam size in kpc and arcsec is shown in parentheses. Col.(2) and (3): Flux density (in mJy beam-1) at the continuum peak position in 1kpc-beam data of J21a (taken with HCN J=2–1 and HCO+ J=2–1) and J21b (obtained with HNC J=2–1 and 183 GHz H2O), respectively. Detection significance relative to the noise level is shown in parentheses. The continuum peak position spatially agrees with that listed in Table 3 (column 4).
Gaussian fits are applied to estimate the molecular emission line flux from nuclear 1 kpc regions in individual (U)LIRGs (and 200 pc regions for NGC 1614). We apply a single Gaussian fit as long as the observed emission line profile is approximated by a single peaked profile with small deviation. However, some molecular emission lines in certain ULIRGs display double-peaked profiles with central dips and clearly deviate from a single Gaussian profile (e.g., HCO+ J=2–1 line of IRAS 121120305 NE in Figure 3e). For these, we apply two Gaussian fits (two emission components). If the two Gaussian fits better trace the observed emission line profile than the single Gaussian fit, we adopt the former flux, which is slightly (a few % to 10%) smaller than the latter. Adopted Gaussian fits of individual emission lines with possible detection signatures in the 1kpc-beam spectra for all (U)LIRGs (and 200pc-beam spectra for NGC 1614) are displayed in Appendix B. Table 6 summarizes the Gaussian-fit velocity-integrated fluxes, which will be used to discuss molecular line flux ratios, unless otherwise stated for certain faint emission lines for which the peak values or 3 upper limits in 1kpc-beam moment 0 maps are used.
| Object | Line | Gaussian fit | |||
|---|---|---|---|---|---|
| Velocity | Peak flux density | FWHM | Integrated flux | ||
| [km s-1] | [mJy] | [km s-1] | [Jy km s-1] | ||
| (1) | (2) | (3) | (4) | (5) | (6) |
| NGC 1614 | HCN J=2–1 | 47654 | 271 | 24310 | 6.80.4 |
| (1 kpc, 31) | HCO+ J=2–1 | 47694 | 471 | 2528 | 121 |
| HNC J=2–1 | 47668 | 161 | 22217 | 3.70.4 | |
| NGC 1614 W | HCN J=2–1 | 47633 | 6.10.3 | 1127 | 0.720.06 |
| (200 pc, 062) | HCO+ J=2–1 | 47612 | 111 | 1145 | 1.30.1 |
| HNC J=2–1 | 47445 | 5.30.8 | 7713 | 0.420.10 | |
| NGC 1614 N | HCN J=2–1 | 48332 | 7.30.4 | 936 | 0.720.05 |
| (200 pc, 062) | HCO+ J=2–1 | 48332 | 111 | 1095 | 1.20.1 |
| HNC J=2–1 | 48424 | 5.80.8 | 579 | 0.340.07 | |
| NGC 1614 S | HCN J=2–1 | 46435 | 5.10.4 | 10913 | 0.580.08 |
| (200 pc, 062) | HCO+ J=2–1 | 46392 | 8.60.4 | 978 | 0.880.08 |
| HNC J=2–1 | 46386 | 3.80.4 | 10418 | 0.410.08 | |
| NGC 1614 E | HCN J=2–1 | 47085 | 3.80.3 | 12415 | 0.490.07 |
| (200 pc, 062) | HCO+ J=2–1 | 47002 | 7.20.3 | 1206 | 0.900.06 |
| HNC J=2–1 | 474413 | 2.70.6 | 11235 | 0.320.12 | |
| IRAS 060357102 | HCN J=2–1 | 238575 | 7.80.2 | 37111 | 2.90.1 |
| (1.6 kpc, 11) | HCO+ J=2–1 | 238675 | 8.90.2 | 40413 | 3.60.1 |
| HNC J=2–1 | 2383211 | 4.60.3 | 35625 | 1.60.1 | |
| 183 GHz H2O | 2389829 | 2.00.2 | 42477 | 0.830.18 | |
| IRAS 085723915 | HCN J=2–1 | 1748511 | 3.60.2 | 38327 | 1.40.1 |
| (1 kpc, 090) | HCO+ J=2–1 | 1738827, 1756331 | 4.9, 4.7 (fix) AAFixed to the best fit value. | 16223, 18515 | 1.70.2 |
| HNC J=2–1 | 1748116 | 1.90.2 | 31533 | 0.610.09 | |
| 183 GHz H2O | 1735118, 1755815 | 2.20.3, 2.60.3 | 13344, 17436 | 0.750.15 | |
| IRAS 121120305 NE | HCN J=2–1 | 2168420, 2194213 | 9.20.6, 101 | 28935, 24322 | 5.10.5 |
| (1.2 kpc, 087) | HCO+ J=2–1 | 216597, 219577 | 6.80.4, 7.60.4 | 19817, 23322 | 3.10.2 |
| HNC J=2–1 | 218045 | 121 | 34913 | 4.00.2 | |
| 183 GHz H2O | 218075 | 7.80.3 | 26814 | 2.10.1 | |
| IRAS 121120305 SW | HCN J=2–1 | 2198718 | 1.70.2 | 26744 | 0.450.10 |
| (1.2 kpc, 087) | HCO+ J=2–1 | 2197515 | 2.90.3 | 33842 | 0.970.15 |
| HNC J=2–1 | 2191715, 2207716 | 1.80.5, 1.90.5 | 10441, 7348 | 0.320.13 | |
| IRAS 121271412 | HCN J=2–1 | 3996625 | 1.50.2 | 48363 | 0.700.12 |
| (1 kpc, 043) | HCO+ J=2–1 | 3986738, 4014616 | 1.40.2, 1.40.5 | 360111, 93 (fix) | 0.600.17 |
| HNC J=2–1 | 3987155, 4014133 | 1.20.2, 1.50.4 | 37689, 13275 | 0.610.17 | |
| 183 GHz H2O | 4003674 | 0.750.55 | 500193 | 0.350.29 | |
| IRAS 135090442 | HCN J=2–1 | 4093515 | 2.20.2 | 28640 | 0.590.11 |
| (1 kpc, 042) | HCO+ J=2–1 | 4091420 | 2.00.2 | 30752 | 0.570.12 |
| HNC J=2–1 | 4095716 | 1.50.2 | 22140 | 0.320.07 | |
| 183 GHz H2O | 41047134 | 0.450.12 | 799482 | 0.330.22 | |
| IRAS 152503609 | HCN J=2–1 | 165824 | 121 | 27410 | 3.40.2 |
| (1.2 kpc, 11) | HCO+ J=2–1 | 165647 | 7.10.5 | 21617 | 1.60.2 |
| HNC J=2–1 | 165917 | 131 | 29518 | 3.70.3 | |
| 183 GHz H2O | 165815 | 111 | 31312 | 3.40.2 | |
| Superantennae | HCN J=2–1 | 1853919 | 5.50.3 | 87854 | 4.90.4 |
| (1 kpc, 085) | HCO+ J=2–1 | 1850521 | 4.30.3 | 66552 | 2.90.3 |
| HNC J=2–1 | 1850422 | 2.90.2 | 66157 | 1.90.2 | |
| 183 GHz H2O | 1821515, 1875420 | 5.80.3, 5.50.2 | 39133, 51744 | 5.10.3 | |
| IRAS 205514250 | HCN J=2–1 | 128901 | 231 | 2022 | 4.80.1 |
| (1 kpc, 12) | HCO+ J=2–1 | 128871 | 341 | 2143 | 7.40.1 |
| HNC J=2–1 | 128922 | 121 | 1825 | 2.30.1 | |
| 183 GHz H2O | 128872 | 7.90.2 | 1755 | 1.40.1 | |
| IRAS 224911808 | HCN J=2–1 | 233175 | 121 | 43411 | 5.10.2 |
| (1 kpc, 069) | HCO+ J=2–1 | 232857 | 7.20.2 | 46616 | 3.30.2 |
| HNC J=2–1 | 233159 | 9.30.5 | 34920 | 3.20.2 | |
| 183 GHz H2O | 233239 | 4.70.3 | 35423 | 1.60.1 | |
Note. — Col.(1): Object name. Beam size in kpc and arcsec is shown in parentheses. Col.(2): Line. Cols.(3)–(6): Gaussian fit of emission line in a 1kpc-beam spectrum at the continuum peak position. For NGC 1614, that in a 200pc-beam spectrum is also shown. Col.(3): Optical local standard of rest (LSR) velocity (vopt) of emission line peak (in km s-1). Col.(4): Peak flux density (in mJy). Col.(5): Observed full width at half maximum (FWHM) (in km s-1). Col.(6): Gaussian-fit velocity-integrated flux (in Jy km s-1). The Gaussian fit for the 183 GHz H2O line is not attempted for NGC 1614 and IRAS 121120305 SW, because there is no emission signature in each spectrum (Figures 2 and 3).
We also attempt to estimate the fluxes of dense molecular (HCN, HCO+, and HNC J=2–1) and 183 GHz H2O emission lines, based on Gaussian fits in 2kpc-beam spectra (Appendix B). We find that the flux increase from 1 kpc to 2kpc-beam data, is as high as 80% in the starburst-dominated ULIRG IRAS 135090442, but significantly smaller in the remaining ULIRGs (Appendix B). Namely, we recover the bulk of ULIRGs’ nuclear dense molecular and 183 GHz H2O line emission in the 1kpc-beam data. A further increase of the beam size does not significantly increase dense molecular emission line signals, but increases noise a lot, making the detection of faint emission lines difficult. Thus, we adopt quantities derived from 1kpc-beam data for our discussion of (U)LIRGs’ nuclei.
There are serendipitously detected emission lines. The HC3N J=20–19 line at = 181.945 GHz was covered in the J21b spectra of all ten (U)LIRGs and was clearly detected in four ULIRGs (IRAS 121120305 NE, IRAS 152503609, IRAS 205514250, and IRAS 224911808 in Figure 3f, 3n, 3r, and 3t, respectively).
Signatures of the HCN-VIB and HNC-VIB J=2–1 emission lines are recognizable in the spectra of a few (U)LIRGs in Figures 2 and 3. We apply Gaussian fits in the 1kpc-beam spectra (and 200pc-beam spectra for NGC 1614) as well as create moment 0 maps with original beam. We claim significant (3) detection as an isolated emission peak, of the HCN-VIB J=2–1 line in two ULIRGs (IRAS 152503609 and IRAS 205514250 in Figure 3m and 3u, respectively) and of the HNC-VIB J=2–1 line in three (U)LIRGs (NGC 1614 S, IRAS 152503609, and IRAS 224911808 in Figure 2f, 3n, and 3t, respectively). Table 7 summarizes the observed properties of these detected HC3N J=20–19 and VIB emission lines. The HCO+-VIB J=2–1 emission line is not detected in any spectra (Figures 2 and 3).
| Object | Line | Moment 0 peak | Gaussian fit (1 kpc beam) AA200 pc beam for NGC 1614 S, and 1.2 kpc beam for IRAS 121120305 and IRAS 152503609. For the remaining sources, 1 kpc beam size is adopted, including IRAS 060357102 (see also Figure 6b). | |||
|---|---|---|---|---|---|---|
| (original beam) | Velocity | Peak | FWHM | Flux | ||
| [Jy beam-1 km s-1] | [km s-1] | [mJy] | [km s-1] | [Jy km s-1] | ||
| (1) | (2) | (3) | (4) | (5) | (6) | (7) |
| NGC 1614 S (200 pc) AA200 pc beam for NGC 1614 S, and 1.2 kpc beam for IRAS 121120305 and IRAS 152503609. For the remaining sources, 1 kpc beam size is adopted, including IRAS 060357102 (see also Figure 6b). | HNC-VIB J=2–1 | 0.14 (3.6) | 460923 | 1.70.5 | 123 (fix) BBFixed to the best fit value. | 0.220.06 |
| IRAS 121120305 NE (1.2 kpc) AA200 pc beam for NGC 1614 S, and 1.2 kpc beam for IRAS 121120305 and IRAS 152503609. For the remaining sources, 1 kpc beam size is adopted, including IRAS 060357102 (see also Figure 6b). | HC3N J=20–19 | 0.28 (5.9) | 2180622 | 1.60.3 | 27871 | 0.440.14 |
| HCN-VIB J=2–1 | 0.24 (4.9) CCSignals of the emission tail at the lower frequency side of the HCO+ J=2–1 line (a horizontal solid bar in Figures 3e and 3s) are integrated. These values are only approximate for the HCN-VIB J=2–1 emission line flux, because we choose the integrated frequency range to minimize the contaminations from the nearby bright HCO+ J=2–1 emission line, and thus not all velocity components are likely to be covered, particularly for IRAS 224911808. | — | — | — | — | |
| IRAS 152503609 (1.2 kpc) AA200 pc beam for NGC 1614 S, and 1.2 kpc beam for IRAS 121120305 and IRAS 152503609. For the remaining sources, 1 kpc beam size is adopted, including IRAS 060357102 (see also Figure 6b). | HC3N J=20–19 | 0.62 (12) | 1661510 | 3.20.2 | 27225 | 0.890.11 |
| HCN-VIB J=2–1 | 0.21 (3.8) DDOnly signals marked with the horizontal solid bar in Figure 3m are integrated. Other possible emission components at = 168.6–168.75 GHz at even lower frequencies are not included, because they may originate from other components (e.g., redshifted HCO+ J=2–1 emission in the P Cygni profile of outflow (Imanishi et al. 2018b)). | 1654219 | 1.70.7 | 127 (fix) BBFixed to the best fit value. | 0.220.09 | |
| HNC-VIB J=2–1 | 0.18 (5.3) | 1654226 | 1.30.6 | 12062 | 0.160.11 | |
| IRAS 205514250 EEThere may be some emission signature at the expected frequency of the HNC-VIB J=2–1 line in Figure 3r, but its velocity profile is largely different from other detected bright emission lines. We do not argue that the HNC-VIB J=2–1 emission line is clearly detected in our data, because certain unidentified faint emission line may also contribute to the observed emission signature. | HC3N J=20–19 | 0.22 (5.6) | 128919 | 1.50.2 | 16523 | 0.250.04 |
| HCN-VIB J=2–1 | 0.10 (6.6) | 1285134 | 0.640.12 | 20262 | 0.130.05 | |
| SO 5(4)–4(3) | 0.40 (18) | 128924 | 2.50.1 | 17411 | 0.440.04 | |
| HOC+ J=2–1 | 0.072 (5.3) | 1288726 | 0.410.11 | 20367 | 0.0850.036 | |
| IRAS 224911808 | HC3N J=20–19 | 0.75 (12) | 2330214 | 3.00.2 | 35538 | 1.10.1 |
| HCN-VIB J=2–1 | 0.16 (3.7) CCSignals of the emission tail at the lower frequency side of the HCO+ J=2–1 line (a horizontal solid bar in Figures 3e and 3s) are integrated. These values are only approximate for the HCN-VIB J=2–1 emission line flux, because we choose the integrated frequency range to minimize the contaminations from the nearby bright HCO+ J=2–1 emission line, and thus not all velocity components are likely to be covered, particularly for IRAS 224911808. | — | — | — | — | |
| HNC-VIB J=2–1 | 0.13 (4.8) | 2323939 | 0.960.52 | 164 (fix) BBFixed to the best fit value. | 0.160.08 | |
| NGC 1614 | CS J=4–3 | 1.9 (5.1) | 477420 | 6.51.0 | 24938 | 1.70.4 |
| IRAS 060357102 | CS J=4–3 | 0.72 (6.9) | 2385026 | 2.40.3 | 41772 | 1.00.2 |
| IRAS 121120305 NE (1.2 kpc) AA200 pc beam for NGC 1614 S, and 1.2 kpc beam for IRAS 121120305 and IRAS 152503609. For the remaining sources, 1 kpc beam size is adopted, including IRAS 060357102 (see also Figure 6b). | HC3N J=21–20 | 0.55 (3.8) | 2166860 | 1.70.5 | 299 (fix) BBFixed to the best fit value. | 0.500.16 |
| IRAS 205514250 | CS J=4–3 | 1.5 (24) | 128942 | 121 | 1755 | 2.10.1 |
| IRAS 224911808 | HC3N J=21–20 | 0.52 (7.1) | 2329729 | 2.00.4 | 31860 | 0.630.18 |
Note. — Col.(1): Object name. Col.(2): Line. Data listed above the horizontal solid line are molecular lines detected in Figures 2 and 3 within the spectral windows that cover the primarily targeted molecular lines, and those below the line are molecular lines detected in other spectral windows in Figure 6. Only lines with significant detection (3), either with the Gaussian fit with all parameters set as free and/or moment 0 map, are listed. Col.(3): Peak flux (in Jy beam-1 km s-1) in the moment 0 map of original beam. Detection significance relative to the rms noise (1) in the moment 0 map is shown in parentheses. The peak position spatially agrees with simultaneously obtained continuum peak position within peak determination uncertainty. For the CS J=4–3 and HC3N J=21–20 lines below the horizontal solid line, data of IRAS 121120305 NE and IRAS 224911808 were obtained during J21a observations, while the remaining data were obtained during J21b observations. Synthesized beam sizes are comparable to those of individual J21a or J21b data listed in Table 3 (column 6). Cols.(4)–(7): Gaussian fit of emission line in 1kpc-beam spectrum at the continuum peak position. For NGC 1614 S, the beam size is 200 pc. Col.(4): Optical LSR velocity (vopt) of emission line peak (in km s-1). Col.(5): Peak flux density (in mJy). Col.(6): Observed FWHM (in km s-1). Col.(7): Gaussian-fit velocity-integrated flux (in Jy km s-1).
In the spectrum of IRAS 20551–4250 (Figures 3q and 3u), at the high frequency side of the HCO+ J=2–1 line, an emission line signature exists, which we identify as SO 5(4)–4(3) ( = 178.605 GHz). Moreover, the HOC+ J=2–1 emission line ( = 178.972 GHz) is detected (Figure 3u). We create moment 0 maps (with original beam) of both the lines and confirmed clear signals at the continuum peak position of IRAS 205514250. Gaussian fitting results in the 1kpc-beam spectrum as well as peak flux values in the moment 0 maps of these lines are presented in Table 7. Our Gaussian fits of other possible emission-like features provide no significant detection (3).
In spectral windows other than J21a and J21b, the CS J=4–3 ( = 195.954 GHz) and HC3N J=21–20 ( = 191.040 GHz) lines are included in certain fraction of (U)LIRGs and are detected in a few (U)LIRGs. Figure 6 displays these spectra. The observed properties of these detected emission lines are also summarized in Table 7. Both CS J=4–3 and HC3N J 10 lines have high critical densities of 105 cm-3 (Shirley 2015), and thus can be regarded as additional dense molecular gas tracers.


V Discussion
V.1 HCN to HCO+ J=2–1 Flux Ratios
From Table 6, we find that the observed HCN J=2–1 flux is significantly higher than the HCO+ J=2–1 flux in several ULIRGs classified as AGN important (2; IRAS 121120305 NE, IRAS 152503609, the Superantennae, and IRAS 224911808), while no such trend is seen in the three starbust-classified galaxy nuclei, NGC 1614, IRAS 121120305 SW, and IRAS 135090442 (2), where the observed HCO+ flux is higher than or at least comparable to the observed HCN J=2–1 flux. Elevated HCN emission, relative to HCO+ emission, has been observed in a high fraction of, if not all, luminous AGNs at J=1–0 (Kohno 2005; Imanishi et al. 2007b; Krips et al. 2008; Imanishi et al. 2009; Privon et al. 2015, e.g.,), J=3–2 (Imanishi et al. 2016a; Imanishi et al. 2016c; Imanishi et al. 2018a; Imanishi et al. 2019, e.g.,), and J=4–3 (Garcia-Burillo et al. 2014; Imanishi & Nakanishi 2014; Viti et al. 2014; Izumi et al. 2015; Izumi et al. 2016; Imanishi et al. 2018b, e.g.,). A similar trend is seen also at J=2–1. However, not all AGN-important ULIRGs clearly show elevated HCN J=2–1 emission, relative to HCO+ J=2–1 (e.g., IRAS 060357102, IRAS 085723915, IRAS 121271412, and IRAS 205514250 in Table 6), as previously seen at other J-transition lines (Imanishi et al. 2019; Privon et al. 2020, e.g.,). Further detailed discussion about how the observed HCN to HCO+ flux ratios change among J=2–1, J=3–2, and J=4–3, will be presented by Imanishi et al. (2021; in preparation), to better understand the properties of nuclear dense molecular gas in nearby (U)LIRGs with and without luminous AGN signatures.
V.2 183 GHz H2O Emission
V.2.1 Flux Comparison
In the moment 0 maps in Figure 1, the 183 GHz H2O emission line is not clearly detected (4) in the three starbust-classified galaxy nuclei (NGC 1614, IRAS 121120305 SW, and IRAS 135090442), whereas it is detected with higher significance (4.5) in the AGN-important ULIRGs’ nuclei (Table 4, column 5). Gaussian fits of the 1kpc-beam spectra also provide significant (3) H2O detection in all AGN-important ULIRGs except IRAS 121271412, but do not (3) for the three starburst nuclei (Table 6, column 6). As briefly described in 1, theoretically, the 183 GHz H2O emission line can be extremely luminous in warm and dense molecular gas in the immediate vicinity of a luminous AGN, if maser amplification caused by population inversion occurs (Deguchi 1977; Neufeld & Melnick 1991; Yates et al. 1997; Maloney et al. 2002, e.g.,). The strong 183 GHz H2O megamaser (10L⊙) emission was detected in a few very nearby (20 Mpc) AGNs (Humphreys et al. 2005; Humphreys et al. 2016). In the AGN-hosting ULIRG, the Superantennae at 0.0617 (270 Mpc), the detected bright 183 GHz H2O emission line was argued to primarily originate from the megamaser phenomena in AGN-illuminated gas at the very center of galaxy nucleus (1 kpc), based on substantially elevated flux (luminosity) relative to, and spatially more compact distribution than, other dense molecular gas tracers (HCN, HCO+, and HNC J=2–1 emission lines) (Imanishi et al. 2021). Furthermore, in such gas near an AGN, it is predicted that the H2O abundance can be enhanced by X-ray radiation (Neufeld et al. 1994; Meijerink et al. 2012, e.g.,) and/or H2O evaporation from dust grain mantles into gas phase (Gonzalez-Alfonso et al. 2010, e.g.,). In fact, high H2O abundance in AGNs has been observationally supported (Gonzalez-Alfonso et al. 2010; Gonzalez-Alfonso et al. 2012; Liu et al. 2017, e.g.,). Hence, even if the maser amplification does not work as effectively as in the Superantennae, the 183 GHz H2O emission in AGN-important ULIRGs can be elevated because of the enhanced H2O abundance.
We investigate the 183 GHz H2O emission line flux, in comparison with other dense molecular gas tracers, to determine whether the elevated 183 GHz H2O emission, previously found in the Superantennae, is also observed in other (U)LIRGs. Figures 7a and 7b compare, respectively, the 183 GHz H2O to HCO+ J=2–1 and the 183 GHz H2O to HNC J=2–1 flux ratio (abscissa), with HCN to HCO+ J=2–1 flux ratio (ordinate). In Figure 7a, two sources with distinctly high 183 GHz H2O to HCO+ J=2–1 flux ratios show high HCN to HCO+ J=2–1 flux ratios with 1.6. In Figure 7c, the 183 GHz H2O to HCN J=2–1 flux ratio is compared with the HNC to HCN J=2–1 flux ratio. The Superantennae is distinguishable as the 183 GHz H2O emission is elevated relative to all the HCO+, HNC, and HCN J=2–1 emission lines. IRAS 152503609 also shows elevated 183 GHz H2O emission, with respect to the HCO+ and HCN J=2–1 lines, but not relative to the HNC J=2–1. The signatures of the elevated 183 GHz H2O emission are much weaker in the remaining (U)LIRGs.


V.2.2 Compactness
We search for the presence of spatially unresolved (1 kpc), compact H2O emission and measure how its fraction, relative to the total nuclear (1 kpc) emission, is higher than the other three dense molecular lines, using several indicators. In Figure 3, it is clear that the peak flux increase from the original beam to the 1 kpc beam, is much smaller for the 183 GHz H2O line than the HNC J=2–1 line in the spectra of (e.g.,) IRAS 205514250 and IRAS 224911808 (Figures 3r and 3t), suggesting that the fraction of spatially unresolved components is higher for the 183 GHz H2O in some ULIRGs.
We (1) quantitatively compare the flux increase of the H2O and HNC J=2–1 emission lines from original beam to 1kpc-beam, based on Gaussian fit in the spectra. We find that the flux increase of the H2O is significantly smaller than that of HNC J=2–1 in two ULIRGs (the Superantennae and IRAS 205514250) (Appendix B, columns 3 and 4 of Table 11). The presence of spatially unresolved compact H2O emission can explain the observed trend in these ULIRGs. However, as HNC abundance can be low in AGN-illuminated warm molecular gas at the center of a galaxy nucleus (Imanishi et al. 2020), it may be possible that the observed higher HNC J=2–1 flux increase is simply due to the suppression of HNC J=2–1 emission at the innermost region, rather than the presence of compact H2O emission. To overcome this ambiguity, we combine the H2O data with the HCN and HCO+ J=2–1 line data as well (different synthesized beams from H2O) and (2) check whether the flux increase from 1kpc-beam to 2kpc-beam is substantially smaller for the H2O emission line than that of the HCN and HCO+ J=2–1 emission lines. This trend is found in three ULIRGs (IRAS 121120305 NE, the Superantennae, and IRAS 205514250) (Appendix B, columns 4 and 5 of Table 11).
We also (3) compare the measured emission size of the H2O with those of other dense molecular gas tracers, by applying the CASA task “imfit” to the original beam moment 0 maps (Figure 1). These results are summarized in Table 8. Because the beam sizes are not the same between J21a and J21b data, we first compare the deconvolved intrinsic size of H2O and HNC J=2–1. The Superantennae and IRAS 205514250 show substantially smaller size for the H2O than the HNC J=2–1. For these two ULIRGs, the intrinsic size of H2O is also much smaller than those of HCN and HCO+ J=2–1.
| J21a | J21b | |||||
|---|---|---|---|---|---|---|
| Object | HCN J=2–1 | HCO+ J=2–1 | J21a continuum | HNC J=2–1 | 183 GHz H2O | J21b continuum |
| [mas] | [mas] | [mas] | [mas] | [mas] | [mas] | [mas] |
| (1) | (2) | (3) | (4) | (5) | (6) | (7) |
| IRAS 060357102 | 587107, 540140 | 70372, 52350 | 705186, 613236 | 35277, 248184 | 420174, 19490 | 31275, 29686 |
| IRAS 085723915 | 397114, 213180 | 478106, 36062 | 31865, 287124 | — | — | 23886, 208155 |
| IRAS 121120305 NE | 55257, 337101 | 68780, 462135 | 28372, 186156 | 479105, 428122 | — | 38094, 22890 |
| IRAS 121271412 | 29088, 4669 | 33396, 17253 | 15122, 9668 | 357116, 185104 | 759349, 239150 | 16240, 9792 |
| IRAS 135090442 | 491139, 392119 | 659164, 356104 | 48175, 36757 | 695184, 376118 | 655276, 327155 | 58097, 47382 |
| IRAS 152503609 | 338114, 330145 | 597183, 432341 | 44585, 37580 | 46785, 23472 | 35785, 22052 | 38871, 22630 |
| Superantennae | 838123, 44665 | 1040141, 46661 | 34871, 28461 | 563132, 483137 | 17161, 13446 | 28039, 24530 |
| IRAS 205514250 | 47959, 37358 | 55280, 41795 | 36756, 34674 | 38228, 26416 | 20345, 13540 | 30432, 23620 |
| IRAS 224911808 | 27736, 23128 | 43380, 33764 | 21749, 13141 | 28534, 22329 | 25178, 15792 | 36341, 16037 |
Note. — Col.(1): Object name. Cols.(2)–(7): Deconvolved size in milli-acrsecond (mas) in the original beam moment 0 map (Figure 1) derived from the CASA task “imfit”. Value in the major and minor axis is shown as first and second, respectively. Because it is very difficult to constrain the deconvolved intrinsic size to be considerably (a factor of 2–3) smaller than the beam size (Table 3, column 6), in the case of extremely compact emission, the derived value can still be larger than the actual value. The mark “—” is added when the size is not sufficiently constrained owing to limited S/N ratios. The position angle (PA) is not shown because its uncertainty is large, except in the case of the Superantennae whose PA is 150∘ (east of north) with 10∘ uncertainty for HCN, HCO+, and HNC J=2–1 (roughly aligned to the blueshifted and redshifted direction in Figure 4), and 7080∘ (large uncertainty) for the 183 GHz H2O line. Col.(2): HCN J=2–1. Col.(3): HCO+ J=2–1. Col.(4): J21a continuum. Col.(5): HNC J=2–1. Col.(6): 183 GHz H2O. Col.(7): J21b continuum.
We (4) create H2O to HCO+ J=2–1 flux ratio maps, after matching beam size, and find that four ULIRGs (IRAS 121120305 NE, the Superantennae, IRAS 205514250, and IRAS 224911808) show a higher ratio at the continuum peak (putative AGN position) than in spatially extended regions. These maps are shown in Figure 8. However, compared to the Superantennae, the central-concentrations of the elevated H2O emission regions are weaker in the remaining three ULIRGs.


V.2.3 Dynamics
We also try to use dynamical information to constrain the presence of compact H2O emission. We (5) compare the properties of the H2O emission with those of the other dense molecular tracers in the moment 1 maps because spatially unresolved (1 kpc) H2O emission may be dynamically decoupled from nuclear (1 kpc) dense molecular gas, as observed in the Superantennae (Imanishi et al. 2021). Besides the Superantennae, in IRAS 085723915, IRAS 121120305 NE, and IRAS 224911808, blueshifted and redshifted motions identified in the HCN, HCO+, and HNC J=2–1 lines along similar directions, are not clearly seen in the H2O line (Figure 4). However, since H2O emission is fainter than the other dense molecular lines and outer regions are not sufficiently probed in the moment 1 maps (Figure 4), further discussion of the possible dynamical difference is difficult. In the moment 2 maps (Figure 5), dynamically distinct features of the H2O, compared to the other three dense molecular gas tracers, are not clearly observed, except the Superantennae (Imanishi et al. 2021).
V.2.4 Summary of the 183 GHz H2O Emission
In summary, based on any of the above methods (1)–(5), besides the Superantennae, it is suggested that spatially more compact H2O emission than the nuclear (1 kpc) HCN, HCO+, and HNC J=2–1 emission, may be present in three ULIRGs (IRAS 121120305 NE, IRAS 205514250, and IRAS 224911808). Interestingly, despite the very high 183 GHz H2O to HCO+ J=2–1 and 183 GHz H2O to HCN J=2–1 flux ratios (Figure 7), IRAS 152503609 has no obvious signature of compact H2O emission in the above methods. The compact H2O emission in the three ULIRGs can be of AGN-magamaser origin and/or thermal (non-maser) emission from the H2O-abundant AGN vicinity. Even if AGN megamaser emission is present, its contribution to the observed nuclear (1 kpc) H2O flux is much smaller than that of the Superantennae, because of much weaker signatures of the compact H2O emission. Except the Superantennae, the bulk of the observed 183 GHz H2O luminosity comes from entire nuclear regions (1 kpc), most likely thermal emission or possibly ensemble of stellar maser emission (Konig et al. 2017).
Among ten observed (U)LIRGs, eight ULIRGs are diagnosed to contain luminous obscured AGNs (2). The detection rate of very luminous AGN-origin megamaser 183 GHz H2O emission is low (1/8 = 12.5%). The detection rates of 22 GHz H2O 61,6–52,3 megamaser emission in previously conducted extensive surveys are also low (10%) for active galaxies (Braatz et al. 1997; Hagiwara et al. 2002; Greenhill et al. 2003; Braatz et al. 2004; Henkel et al. 2005, e.g.,), but can increase (10–50%) if only highly obscured AGNs are observed (Kondratko et al. 2006; Yamauchi et al. 2017; Castangia et al. 2019; Kuo et al. 2020; Panessa et al. 2020, e.g.,). Observations of a larger number of nearby (U)LIRGs that are diagnosed to host luminous obscured AGNs, are needed to better constrain how the detection rates of very luminous 183 GHz H2O megamaser emission differ from those of 22 GHz H2O magamaser emission.
V.3 Emission Line Luminosity and Nuclear Dense Molecular Gas Mass
We use the following formulas to convert molecular emission line flux to luminosity (Solomon & Vanden Bout 2005),
| (1) |
and
| (2) |
where SV is Gaussian-fit velocity-integrated emission line flux and DL is luminosity distance. The derived luminosity of the HCN, HCO+, HNC J=2–1, and 183 GHz H2O emission lines from the (U)LIRGs’ nuclear regions, based on the 1kpc-beam flux data (Table 6), is summarized in Table 9 (columns 2–5).
| Object | HCN J=2–1 | HCO+ J=2–1 | HNC J=2–1 | 183 GHz H2O | M |
|---|---|---|---|---|---|
| 104 L⊙ (107 K km s-1 pc2) | 108 [M⊙] | ||||
| (1) | (2) | (3) | (4) | (5) | (6) |
| NGC 1614 | 0.580.03 (3.30.2) | 1.10.1 (5.80.2) | 0.320.03 (1.70.2) | 0.084 (0.43) | 1–3 |
| IRAS 060357102 | 6.20.2 (351) | 7.80.3 (432) | 3.60.3 (192) | 1.90.4 (9.42.1) | 8–22 |
| IRAS 085723915 | 1.60.1 (9.00.8) | 2.00.2 (111) | 0.710.11 (3.70.6) | 0.880.18 (4.50.9) | 2–6 |
| IRAS 121120305 NE | 9.52.0 (5311) | 5.70.4 (312) | 7.50.4 (392) | 3.90.3 (201) | 6–16 |
| IRAS 121120305 SW | 0.830.17 (4.71.0) | 1.80.3 (9.91.5) | 0.88 (4.6) | 1.5 (7.3) | 2–5 |
| IRAS 121271412 | 4.40.7 (244) | 3.81.1 (216) | 3.91.1 (206) | 2.20.7 (113) | 4–11 |
| IRAS 135090442 | 3.90.7 (224) | 3.80.8 (214) | 2.10.5 (113) | 1.80.6 (8.92.8) | 4–11 |
| IRAS 152503609 | 3.50.2 (206) | 1.60.2 (8.90.9) | 4.00.3 (212) | 3.60.2 (181) | 2–4 |
| Superantennae | 6.30.5 (353) | 3.70.1 (212) | 2.60.3 (131) | 6.90.5 (352) | 4–11 |
| IRAS 205514250 | 3.00.1 (171) | 4.60.1 (251) | 1.40.1 (7.50.3) | 0.910.03 (4.60.2) | 5–13 |
| IRAS 224911808 | 101 (592) | 6.90.3 (382) | 6.80.5 (363) | 3.50.3 (181) | 8–19 |
Note. — Col.(1): Object name. Cols.(2)–(5): Molecular emission line luminosity in units of (104 L⊙), derived from 1kpc-beam data. That in units of (107 K km s-1 pc2) is shown in parentheses. Col.(2): HCN J=2–1. Col.(3): HCO+ J=2–1. Col.(4): HNC J=2–1. Col.(5): 183 GHz H2O. Col.(6): Dense molecular gas mass derived from the HCO+ J=2–1 luminosity, assuming that the HCO+ emission is thermalized and optically thick at J=2–1 and J=1–0, and using the conversion factor of 2–5 (M⊙ [K km s-1 pc2]-1) from HCO+ J=1–0 luminosity to dense H2 mass (Leroy et al. 2017).
Figure 9 shows the comparison of nuclear (1 kpc) dense molecular line luminosity with infrared (8–1000 m) luminosity from the entire (U)LIRG regions measured with IRAS’s large (30′′) apertures. In Figures 9a and 9b, the infrared luminosity positively correlates with the nuclear HCN J=2–1 and HCO+ J=2–1 emission line luminosity. The previously derived relations at J=4–3 (Zhang et al. 2014; Tan et al. 2018) are overplotted for reference. These relations were derived by observing galaxies with a wide (six orders of magnitude) infrared luminosity range (Zhang et al. 2014; Tan et al. 2018) and were largely determined by nearby ULIRGs which dominate the high luminosity part. Although the HCN and HCO+ J=4–3 line data of nearby ULIRGs (Zhang et al. 2014; Tan et al. 2018) were taken with large apertures of single dish telescopes, we regard that the bulk of the observed J=4–3 luminosities come from nuclear regions, because (1) nearby ULIRGs are usually energetically dominated by compact (1 kpc) nuclear regions, with small contributions from spatially extended (a few kpc) star-forming regions in the host galaxies (Soifer et al. 2000; Diaz-Santos et al. 2010; Imanishi et al. 2011; Pereira-Santaella et al. 2021, e.g.,), and (2) when ALMA high-spatial-resolution data are available, the HCN and HCO+ J=4–3 emission of nearby (U)LIRGs are confirmed to be spatially compact (Imanishi et al. 2018b). Our J=2–1 data roughly follow the updated J=4–3 relation by Tan et al. 2018. If the HCN and HCO+ are almost thermally excited at up to J=4 and optically thick, the ratio of molecular line luminosity (in units of K km s-1 pc2) to infrared luminosity (in units of L⊙) is expected to be comparable for J=4–3 and J=2–1. Our data suggest that this is the case for warm and dense molecular gas in nearby (U)LIRGs’ nuclei. Figures 9c and 9d show the comparison of infrared luminosity with HNC J=2–1 and 183 GHz H2O luminosity, respectively.


We derive nuclear dense molecular gas mass from HCO+ J=2–1 luminosity, because (1) the slope of infrared and HCO+ J=2–1 luminosity relation is the closest to unity among the four lines (Figure 9), and (2) HCO+ can be a less biased dense molecular gas mass tracer than HCN and HNC, particularly in the vicinity of a luminous AGN (Imanishi et al. 2020). Table 9 (column 6) summarizes the derived dense molecular gas mass in the observed (U)LIRGs’ nuclei, where we adopt the conversion factor of 2–5 (M⊙ [K km s-1 pc2]-1) from optically thick HCO+ J=1–0 line luminosity to dense H2 mass (Leroy et al. 2017), and the above validated assumption that HCO+ emission is thermalized and optically thick at J=2–1 and J=1–0. All the (U)LIRGs are estimated to contain nuclear (1 kpc) dense molecular gas with mass of Mdense a few 108M⊙.
We can estimate a lower limit of the depletion time (tdep) of the nuclear dense molecular gas by star-formation, by assuming (1) lower side of the derived mass in Table 9 (column 6) and (2) the nuclear star formation rate (SFR) of SFR (M⊙ yr-1) = 4.5 10-44 LIR (ergs s-1) (Kennicutt 1998), where infrared (8–1000 m) and far-infrared (40–500 m) luminosities are considered comparable for (U)LIRGs. This is a stringent lower limit because AGN activity can contribute significantly to the observed infrared luminosity with IRAS. The estimated lower limit of the depletion time (tdep Mdense/SFR) is 1–3 106 yr, which is shorter than that derived in dense molecular clouds in our Galaxy and nearby star-forming galaxies, 107-8 yr (Lada et al. 2010; Zhang et al. 2014; Liu et al. 2016; Tan et al. 2018; Jiang et al. 2020, e.g.,), but it is longer than the free-fall time of dense (104 cm-3) molecular gas, tff 5 105 yr (G is the gravitational constant and is the mass volume density). Thus, even considering only for (U)LIRGs’ nuclei where dense molecular gas highly concentrates through galaxy mergers, it is suggested that the bulk (50%) of dense molecular gas is not forming stars with a free-fall time scale (Krumholz & Tan 2007), possibly because of various feedback processes from AGN and starburst activities (Hopkins et al. 2011; Hopkins et al. 2013; Chevance et al. 2020, e.g.,).
V.4 Vibrationally Excited Emission Lines
The rotational J=3–2 and J=4–3 emission lines at the vibrationally excited v2=1f levels of HCN and HNC (HCN-VIB and HNC-VIB, respectively) were detected in active galaxies, mostly those diagnosed as containing luminous obscured AGNs (Sakamoto et al. 2010; Imanishi & Nakanishi 2013b; Aalto et al. 2015a; Aalto et al. 2015b; Costagliola et al. 2015; Martin et al. 2016; Imanishi et al. 2016b; Imanishi et al. 2016c; Imanishi et al. 2018b; Falstad et al. 2019; Falstad et al. 2021; Sakamoto et al. 2021, e.g.,). It is widely believed that infrared radiative pumping is responsible for vibrationally exciting HCN and HNC, by absorbing mid-infrared 14 m and 21.5 m photons, respectively, because the excitation energy level (650 K) is too high to collisionally excite (Aalto et al. 1995; Aalto et al. 2007b; Sakamoto et al. 2010, e.g.,). Because a luminous AGN usually emits a strong 3–15 m continuum originating from hot (100 K) dust in the AGN vicinity, the HCN-VIB line can be emitted efficiently and its luminosity, relative to vibrational ground emission line and/or total infrared (8–1000 m) luminosity, can be higher in AGNs than in starbursts. Because HNC can be vibrationally excited by longer wavelength infrared photons (21.5 m), the HNC-VIB emission lines can be moderately strong in starbursts as well, where the dust temperature is usually lower than in the AGN’s vicinity (Ando et al. 2017; Martin et al. 2021, e.g.,). HCN-VIB emission lines with intrinsically low absolute luminosity can also be detected in very nearby starbursts if sensitivity is sufficient (Krieger et al. 2020; Martin et al. 2021).
As explained in 4 and summarized in Table 7, the HCN-VIB J=2–1 emission line is significantly detected (3) as an isolated peak in IRAS 152503609 and IRAS 205514250. In addition to these two ULIRGs, both IRAS 121120305 NE and IRAS 224911808 display excess emission at the lower frequency side of the HCO+ J=2–1 line, close to the expected frequency of the HCN-VIB J=2–1 line (Figures 3e and 3s). For both IRAS 121120305 NE and IRAS 224911808, a similar excess was found at the lower frequency part of the HCO+ J=3–2 and J=4–3 lines, which was interpreted as HCN-VIB J=3–2 and J=4–3 emission line contributions, respectively (Imanishi et al. 2016c; Imanishi et al. 2018b). Thus, the excess components of IRAS 121120305 NE and IRAS 224911808 in Figure 3e and 3s, respectively, may originate from the HCN-VIB J=2–1 emission line. We create moment 0 maps of the excess components (with original beam) and confirm detection with 3.5 (Table 7). The HNC-VIB J=2–1 emission line is also significantly detected (3) in an original beam moment 0 map for NGC 1614 S, IRAS 152503609, and IRAS 224911808 (Table 7).
As the number of 21.5 m photons is typically much larger than that of 14 m (rest-frame) in (U)LIRGs (Armus et al. 2007; Imanishi et al. 2007a; Veilleux et al. 2009; Imanishi 2009; Imanishi et al. 2010a; Hernan-Caballero & Hatziminaoglou 2011, e.g.,), HNC can be vibrationally excited with a higher infrared radiative pumping rate than HCN. The emission line luminosity of HNC-VIB is expected to be nearly an order of magnitude higher than that of HCN-VIB, if the number of molecules illuminated by the mid-infrared radiation in the close proximity to energy sources (AGN and/or young stars) is comparable (Imanishi et al. 2016b). However, the HNC-VIB emission lines are not as bright as expected even in the case of detection in Figure 3 for J=2–1, as well as for J=3–2 and J=4–3 (Imanishi et al. 2018b). A plausible scenario is that HNC abundance is low at the innermost (1 kpc) obscuring material exposed to strong mid-infrared radiation, even if the emission line luminosity from, and abundance in, the entire nuclear region (1 kpc) is roughly comparable between HCN and HNC. In fact, it is well known from observations of Galactic sources that HNC abundance is very low in high radiation density environments around luminous energy sources (Schilke et al. 1992; Hirota et al. 1998; Graninger et al. 2014; Bublitz et al. 2019, e.g.,). In the recent ALMA observations of the very nearby (14 Mpc) galaxy NGC 1068, it has been clearly demonstrated that HNC abundance is much lower than HCN in the vicinity of a luminous AGN (Imanishi et al. 2020). A plausible explanation for the observed weaker-than-expected HNC-VIB emission is that an HNC abundance is depressed substantially in the mid-infrared-radiation-illuminated, innermost high-temperature molecular gas around the luminous energy sources in (U)LIRGs.
HCO+ can also be vibrationally excited by absorbing mid-infrared 12 m photons, and the vibrational excitation rate was estimated to be roughly comparable to HCN in typical infrared spectra of (U)LIRGs (Imanishi et al. 2016b). However, the HCO+-VIB line detection was never reported in emission in any (U)LIRGs, and only very recently, Kameno et al. 2020 have reported the first detection of the HCO+-VIB J=4–3 line in absorption against strong background continuum emission in the very nearby (17 Mpc) radio-loud AGN NGC 1052, with its absorption peak and equivalent width 2.5 times smaller than those of the HCN-VIB J=4–3 line. Considering that the HCO+ J=2–1 flux at the vibrational ground level (v=0) is comparable within a factor of 2 to, or sometimes higher than, the HCN J=2–1 flux in nearby (U)LIRGs’ nuclei (Figure 7a,b), if the same fraction of HCO+ and HCN are exposed to mid-infrared radiation, the HCO+-VIB J=2–1 emission line should have been detected at least in certain (U)LIRGs with clearly detected HCN-VIB emission. The considerably weaker HCO+-VIB emission than HCN-VIB in (U)LIRGs is also very difficult to explain unless the HCO+ abundance is substantially lower than HCN at the innermost mid-infrared-radiation-illuminated region around the luminous AGNs at the very center of galaxy nuclei (Maloney et al. 1996; Papadopoulos 2007; Harada et al. 2010, e.g.,).
V.5 Other Fainter Dense Molecular Gas Tracers
V.5.1 HC3N
The HC3N J=20–19 line was covered in the spectra of all the ten observed (U)LIRGs, and was clearly detected in four ULIRGs (IRAS 121120305 NE, IRAS 152503609, IRAS 205514250, and IRAS 224911808), as explained in 4 and summarized in Table 7. HC3N J=21–20 data were also obtained in some sources and were detected in two ULIRGs (IRAS 121120305 NE and IRAS 224911808) in Figure 6 and Table 7.
Various rotational J-transition emission lines of HC3N were detected in active galaxies (Aalto et al. 2002; Wang et al. 2004; Aalto et al. 2007a; Aladro et al. 2011; Lindberg et al. 2011; Meier et al. 2011; Aladro et al. 2015; Costagliola et al. 2015; Jiang et al. 2017; Rico-Villas et al. 2021, e.g.,). HC3N lines are considered dense (104 cm-3) molecular gas tracers with fainter flux than HCN, HCO+, and HNC (Wang et al. 2004; Aladro et al. 2011; Meier et al. 2011, e.g.,). Figure 10a plots HC3N J=20–19 and J=21–20 to HCN, HCO+, and HNC J=2–1 flux ratios, which are 0.6 (i.e., HC3N lines are fainter) for all the HC3N-detected sources.


HC3N can be easily destroyed by UV radiation, and thus can be emitted strongly in UV-shielded regions at certain distance from the central energy sources (Lindberg et al. 2011; Meier et al. 2011). Luminous HC3N emission lines, relative to other dense molecular tracers, were detected in galaxies with high column density of obscuring material around energy sources (Aalto et al. 2007a; Lindberg et al. 2011). Lindberg et al. 2011 defined HC3N-luminous galaxies as those with HC3N J=10–9 to HCN J=1–0 flux ratio of 0.15, which constitutes less than one-third of the observed galaxies. We compare the HC3N J=20–19 and HCN J=2–1 fluxes (Tables 6 and 7), and find that IRAS 152503609 and IRAS 224911808 show HC3N J=20–19 to HCN J=2–1 flux ratios of 0.15, whereas IRAS 121120305 NE and IRAS 205514250 do not (Table 10, column 2). The upper excitation energy level is Eu 92 K for HC3N J=20–19 and Eu 13 K for HCN J=2–1. If both lines are thermalized and optically thick, the HC3N J=20–19 to HCN J=2–1 flux ratios are expected to be comparable to the HC3N J=10–9 to HCN J=1–0 flux ratios, because the rest frequency () of HC3N J=20–19 and HCN J=2–1 is approximately twice that of HC3N J=10–9 and HCN J=1–0, respectively, and the emission flux (in Jy km s-1) increases with 2. However, given the much higher excitation energy of HC3N J=20–19 (Eu 92 K) than HC3N J=10–9 (Eu 24 K), HCN J=2–1 (Eu 13 K), and HCN J=1–0 (Eu 4 K), if HC3N is only sub-thermally excited at J=20, HC3N J=20–19 to HCN J=2–1 flux ratio can be smaller than that of HC3N J=10–9 to HCN J=1–0 flux ratio. Thus, IRAS 152503609 and IRAS 224911808 are safely classified as HC3N-luminous galaxies (Lindberg et al. 2011), and even IRAS 121120305 NE and IRAS 205514250 could be in this classification. Because ULIRGs’ nuclear energy sources are usually highly obscured and UV-shielded regions are expected to develop, the HC3N emission can be bright in ULIRGs.
| Object | ||||||
|---|---|---|---|---|---|---|
| (1) | (2) | (3) | (4) | (5) | (6) | (7) |
| IRAS 121120305 NE | 0.0850.033 | 0.140.05 | 0.110.04 | 0.0950.036 | 0.160.05 | 0.120.04 |
| IRAS 152503609 | 0.260.03 | 0.570.09 | 0.240.03 | — | — | — |
| IRAS 205514250 | 0.0520.009 | 0.0340.006 | 0.110.02 | — | — | — |
| IRAS 224911808 | 0.210.02 | 0.320.04 | 0.330.04 | 0.120.04 | 0.190.06 | 0.200.06 |
| Arp 220 (13 kpc) | 0.110.03 | 0.230.05 | 0.160.04 | — | — | — |
Note. — Col.(1): Object name. Cols.(2)–(7): Ratio of Gaussian-fit velocity-integrated emission line flux in (Jy km s-1) derived from 1kpc-beam spectra. Arp 220 data measured with 13 kpc beam (Galametz et al. 2016) are also added. Col.(2): HC3N J=20–19 to HCN J=2–1 flux ratio. Col.(3): HC3N J=20–19 to HCO+ J=2–1 flux ratio. Col.(4): HC3N J=20–19 to HNC J=2–1 flux ratio. Col.(5): HC3N J=21–20 to HCN J=2–1 flux ratio. Col.(6): HC3N J=21–20 to HCO+ J=2–1 flux ratio. Col.(7): HC3N J=21–20 to HNC J=2–1 flux ratio.
Not only HC3N, but also HNC emission can be strong in UV-shielded regions (5.4). In regions which are UV shielded, but are strongly exposed to infrared 20–45 m radiation, HC3N can be vibrationally excited by infrared radiative pumping, and thus rotational J-level excitation at vibrational ground level (v=0) can be largely affected through back decay (Costagliola & Aalto 2010; Rico-Villas et al. 2021). Because this is also the case for HNC (5.4), certain flux correlation between HC3N and HNC may be expected. In Figure 10a and Table 10, while the HC3N J=20–19 to HNC J=2–1 flux ratio is 0.11–0.33 (a factor of 3), the distribution of the HC3N J=20–19 to HCN J=2–1 and HC3N J=20–19 to HCO+ J=2–1 flux ratio is much wider (a factor of 5 and 15, respectively.) Lindberg et al. 2011 argued that HNC to HCN flux ratio and HC3N to HCN flux ratio are correlated. Figure 10b compares the flux ratios for four ULIRGs with significant HC3N J=20–19 line detection and Arp 220 (Table 10). For this limited ULIRG sample, HC3N-luminous galaxies tend to be HNC-luminous, when normalized by HCN. Both Figures 10a and 10b support the above expected flux correlation between HC3N and HNC emission.
V.5.2 CS
The CS J=4–3 line was covered in certain sources, and it was clearly detected in NGC 1614, IRAS 060357102, and IRAS 205514250 (Figure 6). The derived fluxes based on the Gaussian fits of 1kpc-beam spectra are shown in Table 7. CS lines are considered as moderately bright, dense (104 cm-3) molecular gas tracers (Shirley 2015), but usually fainter than HCN, HCO+, and HNC (Helfer & Blitz 1993; Paglione et al. 1995; Wang et al. 2004; Aladro et al. 2015; Meier et al. 2015; Krieger et al. 2020; Martin et al. 2021; Sakamoto et al. 2021, e.g.,). The CS J=4–3 to HCN, HCO+, and HNC J=2–1 flux ratios are plotted in Figure 10c. The ratios are 0.1–1 (i.e., CS lines are fainter), and slightly higher in two AGN-hosting ULIRGs (IRAS 060357102 and IRAS 205514250) than in the starburst-classified LIRG NGC 1614. In the literature, Izumi et al. 2016 argued that AGNs tend to show lower CS J=7–6 to HCN J=4–3 flux ratios than starbursts, while no systematic difference of the CS to HCN, HCO+, and HNC flux ratios was reported between AGNs and starbursts (Aladro et al. 2015). Possible AGN effects to CS emission are not clear with currently available data.
VI Summary
We conducted ALMA band 4–5 (2 mm) observations of nine ultraluminous infrared galaxies (ULIRGs; LIR 1012L⊙) at 0.04–0.14, and one starburst-dominated luminous infrared galaxy, NGC 1614 (LIRG; LIR 1011.7L⊙) at 0.016, with the aim of investigating the properties of dense molecular gas tracers (HCN, HCO+, and HNC J=2–1) and 183 GHz H2O 31,3–22,0 lines. The following main results were obtained.
- 1.
Continuum at 2 mm, HCN J=2–1, HCO+ J=2–1, and HNC J=2–1 emission lines were clearly detected in all sources in our sub-arcsec-resolution (1′′) data. The 183 GHz H2O emission lines were also clearly detected in almost all ULIRGs that were classified as AGN important, but not in the three starburst-classified (U)LIRGs’ nuclei (NGC 1614, IRAS 121120305 SW, and IRAS 135090442).
- 2.
We found significantly higher HCN to HCO J=2–1 flux ratios in a high fraction of, but not all, AGN-important ULIRGs than in starburst-classified sources.
- 3.
We compared the molecular emission line flux ratios and found that two ULIRGs with elevated 183 GHz H2O emission, relative to HCO+ J=2–1, tend to show elevated HCN J=2–1 emission. However, for the remaining (U)LIRGs, the observed 183 GHz H2O to HCO+ J=2–1 flux ratios are not strongly correlated with the observed HCN J=2–1 to HCO+ J=2–1 flux ratios.
- 4.
Besides the Superantennae that was reported to display strong signatures of compact, extremely luminous 183 GHz H2O megamaser emission in AGN-illuminated molecular gas at the very center (1 kpc) of the galaxy nucleus (Imanishi et al. 2021), data of four other ULIRGs (IRAS 121120305 NE, IRAS 152503609, IRAS 205514250, and IRAS 224911808) suggested an elevated flux or the presence of a spatially unresolved compact component of the 183 GHz H2O emission. However, the bulk of the observed H2O emission in the four ULIRGs originates from the entire nuclear regions (1 kpc), with limited contributions from possible AGN-origin megamaser phenomena.
- 5.
The infrared (8–1000 m) luminosity positively correlates with nuclear (1 kpc) HCN J=2–1 and HCO+ J=2–1 luminosity. The correlation roughly follows the previously established luminosity ratios between infrared and J=4–3 lines of HCN and HCO+. Using HCO+ J=2–1 luminosity as the least biased tracer of dense molecular gas mass (Mdense) at nuclear (1 kpc) regions, we derived the mass to be Mdense a few 108M⊙ for all (U)LIRGs. In addition, we estimated that the depletion time of the nuclear dense molecular gas by star-formation is 1 106 yr, significantly longer than the free-fall time of dense molecular gas even considering the (U)LIRGs’ nuclear regions only.
- 6.
Signatures of vibrationally excited v2=1f HCN and HNC emission lines (HCN-VIB and HNC-VIB) were detected in four and three (U)LIRGs, respectively. However, those of HCO+-VIB were not found in any (U)LIRGs. The detection rate and estimated flux of HCO+-VIB and HNC-VIB were much smaller than those expected from (1) the comparable observed fluxes of HCN, HCO+, and HNC at the vibrational ground level (v=0), and (2) calculated rate of vibrational excitation by infrared radiative pumping, if the same proportion of these molecules are exposed to mid-infrared photons. We suggested that at the innermost strongly-mid-infrared-exposed obscuring material around the luminous AGNs, the abundance of HCO+ and HNC is considerably smaller than that of HCN.
- 7.
Another fainter dense molecular gas tracer, HC3N J=20–19 line, was detected in four ULIRGs with bright HCN, HCO+, and HNC J=2–1 emission lines. CS J=4–3 and HC3N J=21–20 lines were included in the spectra of certain fraction of (U)LIRGs and their emission signatures were identified in three and two (U)LIRGs, respectively. We found that HC3N J=20–19 luminous sources tend to be HNC J=2–1 luminous, when normalized by HCN J=2–1 emission. This conforms to our expectations because both HC3N and HNC emission lines are thought to largely originate from UV-shielded regions at certain distance from central energy sources.
- 8.
Two continuum emission sources were serendipitously detected from our ALMA band 4–5 (2 mm) observations of ten (U)LIRGs. One is at 8′′ north of IRAS 135090442 and after combining with previously obtained ALMA data at 0.9–1.3 mm, we interpreted it as an infrared luminous dusty galaxy at 1, based on the increasing flux with decreasing wavelength from 2 mm to 0.9 mm and detection of one emission line signature. The other is at 8′′ south of the Superantennae and regarded as a blazar, based on a flat continuum spectrum at 0.8–2 mm and no emission line signatures. Detecting two serendipitous 1–2 mm continuum sources with flux of 0.8 mJy in two out of ten observed (U)LIRG fields appears to be many, compared to the surface density of such sources (0.03 expected for each ALMA field at 1–2 mm within 10′′ from the center).
We have now J=4–3, 3–2, and 2–1 data of HCN, HCO+, and HNC for the observed ten (U)LIRGs. The combination of these line data and non-LTE modeling will better constrain the properties of dense molecular gas and further elucidate the nature of these (U)LIRGs’ nuclei (M. Imanishi 2021; in preparation).
Appendix A Serendipitously Detected Continuum Sources
A serendipitously detected continuum emitting source was identified in the fields of view of IRAS 135090442 and the Superantennae data. Figure 11 displays the continuum image of the source at 8′′ north of IRAS 135090442 (20 kpc at the distance of this ULIRG) (Left) and at 8′′ south of the Superantennae (10 kpc at the distance of this ULIRG) (Right), whose peak ICRS coordinate is (13h53m31.7s, 04∘28′13′′) and (19h31m21.1s, 72∘39′29′′), respectively.


For the northern source of IRAS 135090442, continuum detection (25) was reported in ALMA band 6 (211–275 GHz) and 7 (275–373 GHz) data (Imanishi et al. 2016c; Imanishi et al. 2018b), but no emission line signature was found in the obtained spectra. We extracted the spectra at the continuum peak position in our newly obtained band 4 data. An emission line signature with a peak flux of 1 mJy was detected at 156.34 GHz in the 154.7–158.2 GHz original beam spectrum in J21a data (Figure 12a). This emission line is located close to the edge of the two overlapped spectral windows and was detected similarly in the spectra of both spectral windows (Figure 12b), suggesting that this emission line is real. If we assume that this emission line signature originates from a bright CO J=2–1 ( = 230.538 GHz) line, then the redshift of this source becomes 0.47. In this case, CO J=3–2 ( = 345.796 GHz) and CO J=4–3 ( = 461.041 GHz) lines are redshifted to the observed frequency of 235.2 and 313.6 GHz, respectively, both of which were covered in the previously taken ALMA band 6 and 7 spectra (Imanishi et al. 2016c; Imanishi et al. 2018b). However, no clear emission lines were observed at these frequencies. Previous observations have shown that the majority of 1–2 mm continuum sources with flux of a few mJy are at 0.5 (Brisbin et al. 2017). The non-detection of optical and near-infrared counterparts at the position of this northern continuum source (Kim et al. 2002; Imanishi et al. 2018b) also makes it unlikely that this source is only at 0.47.


We thus consider other possibilities in which the emission line signature at 156.34 GHz originates from CO J=3–2 ( = 345.796 GHz) at 1.21, or CO J=4–3 ( = 461.041 GHz) at 1.94, or CO J=5–4 ( = 576.268 GHz) at 2.69, or CO J=6–5 ( = 691.473 GHz) at 3.42. In either case, one or two higher-J CO lines fall into the spectral coverages of the previously obtained ALMA band 6 and 7 data (Imanishi et al. 2016c; Imanishi et al. 2018b), but no clear emission line signatures were observed at the expected frequencies. This is not surprising if higher-J CO emission lines are faint due to sub-thermal excitation (Carilli & Walter 2013). We consider that identification of the emission line signature as an even higher-J CO line from a source at higher redshift is less likely because the bulk of 1–2 mm continuum sources with flux of a few mJy are at 4 (Brisbin et al. 2017, e.g.,).
This source appears spatially extended (Figure 11). In fact, the continuum flux increases by a factor of 2.5 from the original beam (03 02) to 09 beam in both J21a and J21b data, suggesting that the continuum emission is spatially extended with 03 or a few kpc at 1–4. The CASA task “imfit” also confirms a factor of 1.5 larger deconvolved image size in both major and minor axis than the beam size. We measure the total continuum flux using the CASA task “imfit” and display the flux at 0.9–2 mm (150–330 GHz) in Figure 13a. The continuum flux increases with decreasing wavelength, which is expected for the Rayleigh–Jeans part of dust thermal radiation. An infrared luminous dusty galaxy at 1–4 can satisfy this. Detection of other emission lines, particularly lower-J CO lines which are less affected by sub-thermal excitation (Carilli & Walter 2013), is necessary to securely identify the redshift.


For the southern source of the Superantennae, continuum emission was detected with 4–8 in our previously obtained ALMA band 6 data at 250 GHz (1.2 mm), but was not discussed (Imanishi et al. 2016c; Imanishi et al. 2018b), because band 7 continuum detection at 330 GHz (0.9 mm) was only marginal (3.5 in 07 05 beam data). Now that band 5 continuum emission at 170 GHz is detected (9; Figure 11), we can investigate the nature of this source in more detail. No emission line signature was observed in any of the ALMA band 5, 6, and 7 spectra. No spatial extension was detected using the CASA task “imfit”. The 0.8–2 mm continuum flux of this source is shown in Figure 13b. It is relatively flat or slightly decreasing with decreasing wavelength. This can be produced by an AGN core, whose emission is beamed toward our line of sight (i.e, blazar). X-ray detection as a hard source by Chandra observations (Wang et al. 2016) and the non-detection of any emission line in ALMA spectra can naturally be explained by this blazar scenario.
In summary, we serendipitously detected two continuum sources with flux of 0.8 mJy at 1–2 mm from our ALMA band 4, 5, and 6 observations of ten (U)LIRGs. The surface density of such continuum sources is 103 deg-2 (Hatsukade et al. 2018; Gonzalez-Lopez et al. 2020, e.g.,) or 0.03 per each ALMA observing field at 1–2 mm within 10′′ radius from the center. Our detection rate of two such sources in ten ALMA observing fields is very high.
Appendix B Gaussian Fits of Emission Lines
Figures 14 and 15 show Gaussian fits of individual emission lines listed in Table 6 and serendipitously detected faint emission lines in Table 7 (column 4–7), respectively. Table 11 tabulates Gaussian-fit velocity-integrated fluxes of dense molecular (HCN, HCO+, and HNC J=2–1) and 183 GHz H2O emission lines, measured with original, 1 kpc, and 2 kpc beam, for the nine observed ULIRGs.
![[Uncaptioned image]](2111.09338v1/f14a.png)
![[Uncaptioned image]](2111.09338v1/f14b.png)
![[Uncaptioned image]](2111.09338v1/f14c.png)
![[Uncaptioned image]](2111.09338v1/f14d.png)
![[Uncaptioned image]](2111.09338v1/f14e.png)
![[Uncaptioned image]](2111.09338v1/f14f.png)
![[Uncaptioned image]](2111.09338v1/f14g.png)
![[Uncaptioned image]](2111.09338v1/f14h.png)
![[Uncaptioned image]](2111.09338v1/f14i.png)
![[Uncaptioned image]](2111.09338v1/f14j.png)
![[Uncaptioned image]](2111.09338v1/f14k.png)
![[Uncaptioned image]](2111.09338v1/f14l.png)
![[Uncaptioned image]](2111.09338v1/f14m.png)
![[Uncaptioned image]](2111.09338v1/f14n.png)
![[Uncaptioned image]](2111.09338v1/f14o.png)
![[Uncaptioned image]](2111.09338v1/f14p.png)
![[Uncaptioned image]](2111.09338v1/f14q.png)
![[Uncaptioned image]](2111.09338v1/f14r.png)
![[Uncaptioned image]](2111.09338v1/f14s.png)
![[Uncaptioned image]](2111.09338v1/f14t.png)
![[Uncaptioned image]](2111.09338v1/f14u.png)
![[Uncaptioned image]](2111.09338v1/f14v.png)
![[Uncaptioned image]](2111.09338v1/f14w.png)
![[Uncaptioned image]](2111.09338v1/f14x.png)
![[Uncaptioned image]](2111.09338v1/f14y.png)
![[Uncaptioned image]](2111.09338v1/f14z.png)
![[Uncaptioned image]](2111.09338v1/f14aa.png)


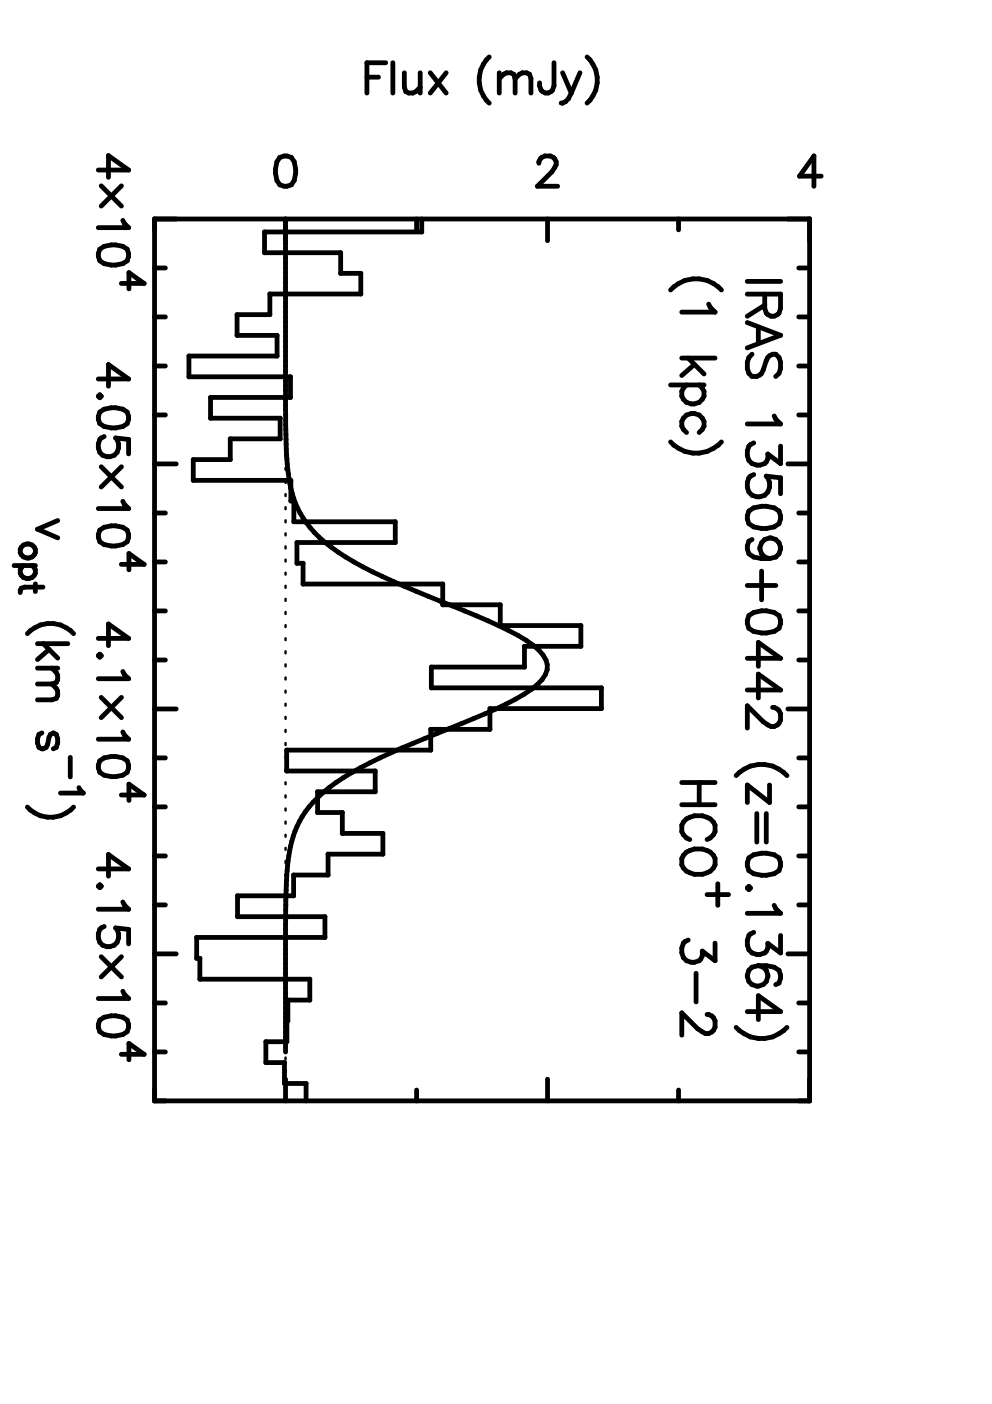


| Integrated Flux [Jy km s-1] | ||||
|---|---|---|---|---|
| Object | Line | Original Beam | 1 kpc | 2 kpc |
| (1) | (2) | (3) | (4) | (5) |
| IRAS 060357102 | HCN J=2–1 | 2.70.1 (5%) | 2.90.1 (1.6 kpc) | 3.00.1 (5.4%) |
| HCO+ J=2–1 | 3.40.1 (4%) | 3.60.1 (1.6 kpc) | 3.80.2 (6.3%) | |
| HNC J=2–1 | 1.10.1 (32%) | 1.60.1 (1.6 kpc) | 1.70.2 (4%) | |
| 183 GHz H2O | 0.540.09 (35%) | 0.830.18 (1.6 kpc) | 0.920.24 (10%) | |
| IRAS 085723915 | HCN J=2–1 | 1.20.1 (18%) | 1.40.1 | 1.70.2 (23%) |
| HCO+ J=2–1 | 1.40.1 (15%) | 1.70.2 | 1.90.3 (12%) | |
| HNC J=2–1 | 0.410.07 (33%) | 0.610.09 | 0.750.13 (24%) | |
| 183 GHz H2O | 0.620.08 (17%) | 0.750.15 | 0.820.30 (10%) | |
| IRAS 121120305 NE | HCN J=2–1 | 5.20.2 (0%) | 5.10.5 (1.2 kpc) | 6.10.3 (19%) |
| HCO+ J=2–1 | 2.80.2 (9%) | 3.10.2 (1.2 kpc) | 3.70.3 (20%) | |
| HNC J=2–1 | 3.70.2 (8%) | 4.00.2 (1.2 kpc) | 4.80.3 (19%) | |
| 183 GHz H2O | 2.00.1 (4%) | 2.10.1 (1.2 kpc) | 2.10.2 (4%) | |
| IRAS 121120305 SW | HCN J=2–1 | 0.410.10 (10%) | 0.450.10 (1.2 kpc) | 0.500.13 (9%) |
| HCO+ J=2–1 | 0.810.11 (16%) | 0.970.15 (1.2 kpc) | 0.970.17 (0%) | |
| HNC J=2–1 | 0.280.12 (14%) | 0.320.13 (1.2 kpc) | — AADetection is not significant for meaningful estimate. | |
| IRAS 121271412 | HCN J=2–1 | 0.480.09 (31%) | 0.700.12 | 0.940.21 (34%) |
| HCO+ J=2–1 | 0.370.11 (39%) | 0.600.17 | 0.900.27 (49%) | |
| HNC J=2–1 | 0.360.08 (40%) | 0.610.17 | 0.930.35 (54%) | |
| 183 GHz H2O | 0.220.10 (39%) | 0.350.29 | — AADetection is not significant for meaningful estimate. | |
| IRAS 135090442 | HCN J=2–1 | 0.320.07 (46%) | 0.590.11 | 1.00.2 (77%) |
| HCO+ J=2–1 | 0.290.10 (50%) | 0.570.12 | 1.00.2 (77%) | |
| HNC J=2–1 | 0.170.05 (47%) | 0.320.07 | 0.570.14 (78%) | |
| 183 GHz H2O | — AADetection is not significant for meaningful estimate. | 0.330.22 | — AADetection is not significant for meaningful estimate. | |
| IRAS 152503609 | HCN J=2–1 | 3.30.2 (4%) | 3.40.2 (1.2 kpc) | 3.60.2 (7%) |
| HCO+ J=2–1 | 1.40.1 (12%) | 1.60.2 (1.2 kpc) | 1.80.2 (18%) | |
| HNC J=2–1 | 2.90.1 (21%) | 3.70.3 (1.2 kpc) | 4.50.4 (19%) | |
| 183 GHz H2O | 2.90.1 (16%) | 3.40.2 (1.2 kpc) | 3.90.3 (15%) | |
| Superantennae | HCN J=2–1 | 3.10.2 (36%) | 4.90.4 | 7.70.7 (58%) |
| HCO+ J=2–1 | 2.00.2 (%) | 2.90.3 | 4.70.6 (63%) | |
| HNC J=2–1 | 1.20.2 (40%) | 1.90.2 | 2.70.4 (42%) | |
| 183 GHz H2O | 4.60.3 (10%) | 5.10.3 | 5.50.7 (8%) | |
| IRAS 205514250 | HCN J=2–1 | 4.60.1 (5%) | 4.80.1 | 5.40.1 (11%) |
| HCO+ J=2–1 | 6.90.1 (6%) | 7.40.1 | 8.50.2 (16%) | |
| HNC J=2–1 | 1.80.1 (21%) | 2.30.1 | 2.50.1 (10%) | |
| 183 GHz H2O | 1.30.1 (7%) | 1.40.1 | 1.50.1 (3%) | |
| IRAS 224911808 | HCN J=2–1 | 4.30.1 (14%) | 5.10.2 | 5.80.3 (14%) |
| HCO+ J=2–1 | 3.10.4 (8%) | 3.30.2 | 4.30.3 (29%) | |
| HNC J=2–1 | 2.70.1 (17%) | 3.20.2 | 3.90.4 (20%) | |
| 183 GHz H2O | 1.50.1 (9%) | 1.60.1 | 2.00.3 (22%) | |
Note. — Col.(1): Object name. Col.(2): Line. Cols.(3)–(5): Gaussian-fit velocity-integrated flux (in Jy km s-1). For each line of each object, we adopt the same Gaussian (one or two components). Col.(3): Original beam size (Table 3, column 6). Col.(4): 1 kpc beam. 1 kpc beam for all ULIRGs, except IRAS 060357102, IRAS 121120305, and IRAS 152503609, for which 1.6 kpc, 1.2 kpc, and 1.2 kpc beam is used, respectively. Col.(5): 2 kpc beam. In Col.(3) and (5), flux increase, relative to the 1 kpc beam measurement, is shown in parentheses. Negative value means flux decrease.
Appendix C Moment 0 Maps of the 183 GHz H2O Emission Line for IRAS 121271412 and IRAS 135090442.
Figure 16 displays moment 0 maps of the 183 GHz H2O emission line, with 1kpc circular beam, for IRAS 121271412 and IRAS 135090442. Detection significance of this H2O line in these two sources is 3 in the Gaussian fit in the 1kpc-beam spectra (Table 6), but 3 in the moment 0 maps. The peak values in the moment 0 maps are used in Figure 7.


References
- Aalto et al. (1995) Aalto, S., Booth, R. S., Black, J. H., & Johansson, L. E. B. 1995, A&A, 300, 369
- Aalto et al. (2015b) Aalto, S., Costagliola, S., Martin F., et al. 2015b, A&A, 584, A42
- Aalto et al. (2015a) Aalto, S., Garcia-Burillo, S., Muller, S., et al. 2015a, A&A, 574, A85
- Aalto et al. (2007a) Aalto, S., Monje, R., & Martin, S., 2007a, A&A, 475, 479
- Aalto et al. (2002) Aalto, S., Polatidis, A. G., Huttemeister, S., & Curran, S. J. 2002, A&A, 381, 783
- Aalto et al. (2007b) Aalto, S., Spaans, M., Wiedner, M. C., et al. 2007b, A&A, 464, 193
- Aladro et al. (2011) Aladro, R., Martin-Pintado, J., Martin, S., et al. 2011, A&A, 525, A89
- Aladro et al. (2015) Aladro, R., Martin, S., Riquelme, D., et al. 2015, A&A, 579, A101
- Ando et al. (2017) Ando, R., Nakanishi, K., Kohno, K., et al. 2017, ApJ, 849, 81
- Armus et al. (2007) Armus, L., Charmandaris, V., Bernard-Salas, J., et al. 2007, ApJ, 656, 148
- Braatz et al. (2004) Braatz, J. A., Henkel, C., Greenhill, L. J., Moran, J. M., & Wilson, A. S., 2004, ApJ, 617, L29
- Braatz et al. (1997) Braatz, J. A., Wilson, A. S., & Henkel, C., 1997, ApJS, 110, 321
- Brisbin et al. (2017) Brisbin, D., Miettinen, O., Aravena, M., et al. 2017, A&A, 608, A15
- Bublitz et al. (2019) Bublitz, J., Kastner, J. H., Santander-Garcia, M., et al. 2019, A&A, 625, A101
- Carilli & Walter (2013) Carilli, C. L., & Walter, F. 2013, ARA&A, 51, 105
- Castangia et al. (2019) Castangia, P., Surcis, G., Tarchi, A., et al. 2019, A&A, 629 A25
- Chevance et al. (2020) Chevance, M., Kruijssen, J. M. D., Vazquez-Semadeni, E., 2020, Space Science Reviews, 216, 50
- Clements et al. (1996) Clements, D. L., Sutherland, W. J., McMahon, R. G., & Saunders, W. 1996, MNRAS, 279, 477
- Colina et al. (1991) Colina, L., Lipari, S., & Macchetto, F. 1991, ApJ, 379, 113
- Costagliola & Aalto (2010) Costagliola, F., & Aalto, S. 2010, A&A, 515, A71
- Costagliola et al. (2015) Costagliola, F., Sakamoto, K., Muller, S., et al. 2015, A&A, 582, A91
- Deguchi (1977) Deguchi, S. 1977, PASJ, 29, 669
- Diaz-Santos et al. (2010) Diaz-Santos, T., Charmandaris, V., Armus, L., et al. 2010, ApJ, 723, 993
- Downes & Eckart (2007) Downes, D., & Eckart, A. 2007, A&A, 468, 57
- Duc et al. (1997) Duc, P. -A., Mirabel, I. F., & Maza, J. 1997, A&AS, 124, 533
- Falstad et al. (2019) Falstad, N., Hallqvist, F., Aalto, S., et al. 2019, A&A, 623, A29
- Falstad et al. (2021) Falstad, N., Aalto, S., Konig, S., et al. 2021, A&A, 649, A105
- Galametz et al. (2016) Galametz, M., Zhang, Z. -Y., Immer, K., et al. 2016, MNRAS, 462, L36
- Gao & Solomon (2004) Gao, Y., & Solomon, P. M. 2004, ApJS, 152, 63
- Garcia-Burillo et al. (2014) Garcia-Burillo, S., Combes, F., Usero, A., et al. 2014, A&A, 567, 125
- Genzel et al. (1998) Genzel, R., Lutz, D., Sturm, E., et al. 1998, ApJ, 498, 579
- Gonzalez-Alfonso et al. (2012) Gonzalez-Alfonso, E., Fischer, J., Gracia-Carpio, J., et al. 2012, A&A, 541, A4
- Gonzalez-Alfonso et al. (2010) Gonzalez-Alfonso, E., Fischer, J., Isaak, K., et al. 2010, A&A, 518, L43
- Gonzalez-Lopez et al. (2020) Gonzalez-Lopez, J., Novak, M., Decarli, R., et al. 2020, ApJ, 897, 91
- Graninger et al. (2014) Graninger, D. M., Herbst, E., berg, K. I., & Vasyunin, A. I. 2014, ApJ, 787, 74
- Greenhill et al. (2003) Greenhill, L. J., Kondratko, P. T., Lovell, J. E. J., et al. 2003, ApJ, 582, L11
- Hagiwara et al. (2002) Hagiwara, Y., Diamond, P. J., & Miyoshi, M. 2002, A&A, 383, 65
- Harada et al. (2010) Harada, N., Herbst, E., & Wakelam, V. 2010, ApJ, 721, 1570
- Hatsukade et al. (2018) Hatsukade, B., Kohno, K., Yamaguchi, Y., et al. 2018, PASJ, 70, 105
- Helfer & Blitz (1993) Helfer, T. T., & Blitz, L. 1993, ApJ, 419, 86
- Henkel et al. (2005) Henkel, C., Peck, A. B., Tarchi, A., et al. 2005, A&A, 436, 75
- Hernan-Caballero & Hatziminaoglou (2011) Hernan-Caballero, A., & Hatziminaoglou, E. 2011, MNRAS, 414, 500
- Hildebrand (1983) Hildebrand, R. H. 1983, QJRAS, 24, 267
- Hirota et al. (1998) Hirota, T., Yamamoto, S., Mikami, H., & Ohishi, M. 1998, ApJ, 503, 717
- Hopkins et al. (2013) Hopkins, P. F., Cox, T. J., Hernquist, L., et al. 2013, MNRAS, 430, 1901
- Hopkins et al. (2006) Hopkins, P. F., Hernquist, L., Cox, T. J., et al. 2006, ApJS, 163, 1
- Hopkins et al. (2011) Hopkins, P. F., Quataert, E., & Murray, N. 2011, MNRAS, 417, 950
- Humphreys et al. (2005) Humphreys, E. M. L. Greenhill, L. J., Reid, M. J., et al. 2005, ApJ, 634, L133
- Humphreys et al. (2016) Humphreys, E. M. L., Vlemmings, W. H. T., Impellizzeri, C. M. V., et al. 2016, A&A, 592, L13
- Imanishi (2009) Imanishi, M. 2009, ApJ, 694, 751
- Imanishi et al. (2006) Imanishi, M., Dudley, C. C., & Maloney, P. R. 2006, ApJ, 637, 114
- Imanishi et al. (2007a) Imanishi, M., Dudley, C. C., Maiolino, R., et al. 2007a, ApJS, 171, 72
- Imanishi et al. (2021) Imanishi, M., Hagiwara, Y., Horiuchi, S., Izumi, T., & Nakanishi, K. 2021, MNRAS, 502, L79
- Imanishi et al. (2011) Imanishi, M., Imase, K., Oi, N., & Ichikawa, K. 2011, AJ, 141, 156
- Imanishi et al. (2010a) Imanishi, M., Maiolino, R., & Nakagawa, T. 2010a, ApJ, 709, 801
- Imanishi et al. (2008) Imanishi, M., Nakagawa, T., Ohyama, Y., et al. 2008, PASJ, 60, S489
- Imanishi et al. (2010b) Imanishi, M., Nakagawa, T., Shirahata, M., Ohyama, Y., & Onaka, T. 2010b, ApJ, 721, 1233
- Imanishi & Nakanishi (2013a) Imanishi, M., & Nakanishi, K. 2013a, AJ, 146, 47
- Imanishi & Nakanishi (2013b) Imanishi, M., & Nakanishi, K. 2013b, AJ, 146, 91
- Imanishi & Nakanishi (2014) Imanishi, M., & Nakanishi, K. 2014, AJ, 148, 9
- Imanishi et al. (2016a) Imanishi, M., Nakanishi, K., & Izumi, T. 2016a, ApJL, 822, L10
- Imanishi et al. (2016b) Imanishi, M., Nakanishi, K., & Izumi, T. 2016b, ApJ, 825, 44
- Imanishi et al. (2016c) Imanishi, M., Nakanishi, K., & Izumi, T. 2016c, AJ, 152, 218
- Imanishi et al. (2017) Imanishi, M., Nakanishi, K., & Izumi, T. 2017, ApJ, 849, 29
- Imanishi et al. (2018b) Imanishi, M., Nakanishi, K., & Izumi, T. 2018b, ApJ, 856, 143
- Imanishi et al. (2019) Imanishi, M., Nakanishi, K., & Izumi, T. 2019, ApJS, 241, 19
- Imanishi et al. (2018a) Imanishi, M., Nakanishi, K., Izumi, T. , & Wada, K. 2018a, ApJL, 853, L25
- Imanishi et al. (2007b) Imanishi, M., Nakanishi, K., Tamura, Y., Oi, N., & Kohno, K. 2007b, AJ, 134, 2366
- Imanishi et al. (2009) Imanishi, M., Nakanishi, K., Tamura, Y., & Peng, C. -H. 2009, AJ, 137, 3581
- Imanishi et al. (2020) Imanishi, M., Nguyen, D. D., Wada, K., et al. 2020, ApJ, 902, 99
- Izumi et al. (2015) Izumi, T., Kohno, K., Aalto, S., et al. 2015, ApJ, 811, 39
- Izumi et al. (2016) Izumi, T., Kohno, K., Aalto, S., et al. 2016, ApJ, 818, 42
- Jiang et al. (2017) Jiang, X-J., Wang, J-Z., Gao, Y., & Gu, Q-S. 2017, A&A, 600, A15
- Jiang et al. (2020) Jiang, X-J., Greve, T. R., Gao, Y., et al. 2020, MNRAS, 494, 1276
- Kameno et al. (2020) Kameno, S., Sawada-Satoh, S., Impellizzeri, C. M. V., et al. 2020, ApJ, 895, 73
- Kennicutt (1998) Kenicutt, R. C., Jr. 1998, ARA&A, 36. 189
- Kewley et al. (2001) Kewley, L. J., Heisler, C. A., Dopita, M. A., & Lumsden, S. 2001, ApJS, 132, 37
- Kim & Sanders (1998) Kim, D. -C., & Sanders, D. B. 1998, ApJS, 119, 41
- Kim et al. (2002) Kim, D. -C., Veilleux, S., & Sanders, D. B., 2002, ApJS, 143, 277
- Kohno (2005) Kohno, K. 2005, in AIP Conf. Ser. 783, The Evolution of Starbursts, ed. S. Hüttemeister, E. Manthey, D. Bomans, & K. Weis (New York: AIP), 203 (astro-ph/0508420)
- Kondratko et al. (2006) Kondratko, P. T., Greenhill, L. J., Moran, J. M., et al. 2006, ApJ, 638, 100
- Konig et al. (2017) Konig, S., Martin, S., Muller, S., et al. 2017, A&A, 602, 42
- Krieger et al. (2020) Krieger, N., Bolatto, A. D., Leroy, A. K., et al. 2020, ApJ, 897, 176
- Krips et al. (2008) Krips, M., Neri, R., Garcia-Burillo, S., et al. 2008, ApJ, 677, 262
- Krumholz & Tan (2007) Krumholz, M. R., & Tan, J. C. 2007, ApJ, 654, 304
- Kuo et al. (2020) Kuo, C. Y., Hsiang, J. Y., Chung, H. H., et al. 2020, ApJ, 892, 18
- Lada et al. (2010) Lada, C. J., Lombardi, M., & Alves, J. F. 2010, ApJ, 724, 687
- Leroy et al. (2017) Leroy, A. K., Usero, A., Schruba, A., et al. 2017, ApJ, 835, 217
- Lindberg et al. (2011) Lindberg, J. E., Aalto, S., Costagliola, F., et al. 2011, A&A, 527, A150
- Liu et al. (2016) Liu, T., Kim, K-T., Yoo, H., et al. 2016, ApJ, 829, 59
- Liu et al. (2017) Liu, L., Weis, A., Perez-Beaupuits, J. P., et al. 2017, ApJ, 846, 5
- Maiolino et al. (2003) Maiolino, R., Comastri, A., Gilli, R., et al. 2003, MNRAS, 344, L59
- Maloney et al. (1996) Maloney, P. R., Hollenbach, D. J., & Tielens, A. G. G. M. 1996, ApJ, 466, 561
- Maloney et al. (2002) Maloney, P. R. 2002, PASA, 19, 401
- Martin et al. (2016) Martin, S., Aalto, S., Sakamoto, K., et al. 2016, A&A, 590, A25
- Martin et al. (2021) Martin, S., Mangum, J. G., Harada, N., et al. 2021, A&A, in press (arXiv:2109.08638)
- Matsushita et al. (2009) Matsushita, S., Iono, D., Petitpas, G. R., et al. 2009, ApJ, 693, 56
- McMullin et al. (2007) McMullin, J. P., Waters, B., Schiebel, D., Young, W., & Golap, K. 2007, ASPC, 376, 127
- Meier et al. (2011) Meier, D. S., Turner, J. L., & Schinnerer, E. 2011, AJ, 142, 32
- Meier et al. (2015) Meier, D. S., Walter, F., Bolatto, A. D., et al. 2015, ApJ, 801, 63
- Meijerink et al. (2012) Meijerink, R., Cazaux, S., & Spaans, M. 2012, A&A, 537, A102
- Mirabel et al. (1991) Mirabel, I. F., Lutz, D., & Maza, J. 1991, A&A, 243, 367
- Murphy et al. (1996) Murphy, T. W. J., Armus, L., Matthews, K., et al. 1996, AJ, 111, 1025
- Nakajima et al. (2018) Nakajima, T., Takano, S., Kohno, K., Harada, N., & Herbst, E. 2018, PASJ, 70, 7
- Nardini et al. (2008) Nardini, E., Risaliti, G., Salvati, M., et al. 2008, MNRAS, 385, L130
- Nardini et al. (2009) Nardini, E., Risaliti, G., Salvati, M., et al. 2009, MNRAS, 399, 1373
- Nardini et al. (2010) Nardini, E., Risaliti, G., Watabe, Y., Salvati, M., & Sani, E. 2010, MNRAS, 405, 2505
- Neufeld et al. (1994) Neufeld, D. A., Maloney, P. R., & Conger, S. 1994, ApJL, 436, L127
- Neufeld & Melnick (1991) Neufeld, D. A., & Melnick, G. J. 1991, ApJ, 368, 215
- Oda et al. (2017) Oda, S., Tanimoto, A., Ueda, Y., et al. 2017, ApJ, 835, 179
- Paglione et al. (1995) Paglione, T. A. D., Jackson, J. M., Ishizuki, S., & Rieu, N-Q. 1995, AJ, 109, 1716
- Panessa et al. (2020) Panessa, F., Castangia, P., Malizia, A., et al. 2020, A&A, 641, A162
- Papadopoulos (2007) Papadopoulos, P. P. 2007, ApJ, 656, 792
- Pereira-Santaella et al. (2021) Pereira-Santaella, M., Colina, L., Garcia-Burillo, S., et al. 2021, A&A, 651, A42
- Privon et al. (2015) Privon, G. C., Herrero-Illana, R., Evans, A. S., et al. 2015, ApJ, 814, 39
- Privon et al. (2020) Privon, G. C., Ricci, C., Aalto, S., et al. 2020, ApJ, 893, 149
- Ricci et al. (2017) Ricci, C., Bauer, F. E., Treister, E., et al. 2017, MNRAS, 468, 1273
- Rico-Villas et al. (2021) Rico-Villas, F., Martin-Pintado, J., Gonzalez-Alfonso, E., et al. 2021, MNRAS, 502, 3021
- Saito et al. (2018) Saito, T., Iono, D., Espada, D., et al. 2018, ApJ, 863, 129
- Sakamoto et al. (2017) Sakamoto, K., Aalto, S., Barcos-Munoz, L., et al. 2017, ApJ, 849, 14
- Sakamoto et al. (2010) Sakamoto, K., Aalto, S., Evans, A. S., Wiedner, M., & Wilner, D. 2010, ApJ, 725, L228
- Sakamoto et al. (2021) Sakamoto, K., Martin, S., Wilner, D. J., et al. 2021, ApJ, in press (arXiv:2109.08437)
- Sanders et al. (2003) Sanders, D. B., Mazzarella, J. M., Kim, D. -C., Surace, J. A., & Soifer, B. T. 2003, ApJ, 126, 1607
- Sanders & Mirabel (1996) Sanders, D. B., & Mirabel, I. F. 1996, ARA&A, 34, 749
- Sanders et al. (1988) Sanders, D. B., Soifer, B. T., Elias, J. H., et al. 1988, ApJ, 325, 74
- Schilke et al. (1992) Schilke, P., Walmsley, C. M., Pineau des Forets, G., et al. 1992, A&A, 256, 595
- Scoville et al. (2017) Scoville, N., Murchikova, L., Walter, F., et al. 2017, ApJ, 836, 66
- Scoville et al. (2015) Scoville, N., Sheth, K., Walter, F., et al. 2015, ApJ, 800, 70
- Shang et al. (2011) Shang, Z., Brotherton, M. S., Wills, B. J., et al, 2011, ApJ, 196, 2
- Shirley (2015) Shirley, Y. L. 2015, PASP, 127, 299
- Soifer et al. (2000) Soifer, B. T., Neugebauer, G., Matthews, K., et al. 2000, AJ, 119, 509
- Solomon & Vanden Bout (2005) Solomon, P. M., & Vanden Bout, P. A. 2005, ARA&A, 43, 677
- Takano et al. (2019) Takano, S., Nakajima, T., & Kohno, K. 2019, PASJ, 71, S20
- Tan et al. (2018) Tan, Q-H., Gao, Y., Zhang, Z-Y., et al. 2018, ApJ, 860, 165
- Teng et al. (2015) Teng, S. H., Rigby, J. R., Stern, D,. et al. 2015, ApJ, 814, 56
- van der Tak et al. (2007) van der Tak, F. F. S., Black, J. H., Schoier, F. L., Jansen, D. J., & van Dishoeck, E. F. 2007, A&A, 468, 627
- Veilleux et al. (1999) Veilleux, S., Kim, D. -C., & Sanders, D. B. 1999, ApJ, 522, 113
- Veilleux et al. (1995) Veilleux, S., Kim, D. -C., Sanders, D. B., Mazzarella, J. M., & Soifer, B. T. 1995, ApJS, 98, 171
- Veilleux et al. (2009) Veilleux, S., Rupke, D. S. N., Kim, D.-C., et al. 2009, ApJS, 182, 628
- Viti et al. (2014) Viti, S., Garcia-Burillo, S., Fuente, A., et al. 2014, A&A, 570, A28
- Wang et al. (2004) Wang, M., Henkel, C., Chin, Y. -N., et al. 2004, A&A, 422, 883
- Wang et al. (2016) Wang, S., Liu, J., Qiu, Y., et al. 2016, ApJS, 224, 40
- Yamada et al. (2021) Yamada, S., Ueda, Y., Tanimoto, A., et al. 2021, ApJ, in press (arXiv:2107.10855)
- Yamauchi et al. (2017) Yamauchi, A., Miyamoto, Y., Nakai, N., et al. 2017, PASJ, 69, L6
- Yates et al. (1997) Yates, J. A., Field, D., & Gray, M. D. 1997, MNRAS, 285, 303
- Yuan et al. (2010) Yuan, T. -T., Kewley, L. J., Sanders, D. B. 2010, ApJ, 709, 884
- Zhang et al. (2014) Zhang, Z-Y., Gao, Y., Henkel, C., et al. 2014, ApJL, 784, L31