LeMMINGs IV: The X-ray properties of a statistically-complete sample of the nuclei in active and inactive galaxies from the Palomar sample2021LeMMINGs IV: The X-ray properties of a statistically-complete sample of the nuclei in active and inactive galaxies from the Palomar sample–7.1
Abstract
All 280 of the statistically-complete Palomar sample of nearby (120 Mpc) galaxies 20∘ have been observed at 1.5 GHz as part of the LeMMINGs -MERLIN legacy survey. Here, we present Chandra X-ray observations of the nuclei of 213 of these galaxies, including a statistically-complete sub-set of 113 galaxies in the declination range 40∘ 65∘. We observed galaxies of all optical spectral types, including ‘active’ galaxies (e.g., LINERs and Seyferts) and ‘inactive’ galaxies like H ii galaxies and absorption line galaxies (ALG). The X-ray flux limit of our survey is 1.6510-14 erg s-1 cm-2 (0.310 keV). We detect X-ray emission coincident within 2-arcsec of the nucleus in 150/213 galaxies, including 13/14 Seyferts, 68/77 LINERs, 13/22 ALGs and 56/100 H ii galaxies, but cannot completely rule out contamination from non-AGN processes in sources with nuclear luminosities 1039 erg s-1. We construct an X-ray Luminosity function (XLF) and find that the local galaxy XLF, when including all AGN types, can be represented as a single power-law of slope . The Eddington ratio of the Seyferts is usually 24 decades higher than that of the LINERs, ALGs and H ii galaxies, which are mostly detected with Eddington ratios 10-3. Using [O iii] line measurements and BH masses from the literature, we show that LINERs, H ii galaxies and ALGs follow similar correlations to low luminosities, suggesting that some ‘inactive’ galaxies may harbour AGN.
Keywords:
X-rays: galaxies – galaxies: active1 Introduction
In the nuclear regions of nearby galaxies, optical emission line ratio diagrams (called BPT diagrams) are commonly used to discriminate star formation (SF) from accretion onto super-massive black holes (SMBHs), known as active galactic nuclei (Baldwin et al. 1981; Kewley et al. 2006; Buttiglione et al. 2010, AGN, e.g.,). At the lowest luminosities, optical emission lines can be too weak to provide a reliable interpretation of the nuclear activity. This issue is most prevalent in low-luminosity AGN (LLAGN), defined by H luminosity, L 1040 erg s-1 (Ho et al. 1997a) or by their X-ray luminosities L 1042 erg s-1 (Ptak 2001). These definitions commonly encompass nearby AGN such as Seyferts (Seyfert 1941) and Low-Ionisation Nuclear Emission Line regions (Heckman 1980, LINERs, first defined in), which are likely powered by a central AGN engine. Other galaxies, such as the nuclei in star forming galaxies known as H ii galaxies and absorption line galaxies (ALGs) do not have strong enough emission lines to be unequivocally powered by an AGN, but may include a weak or dormant SMBH, in which case they may harbour a LLAGN.
The study of LLAGN is important for several reasons. They represent the most numerous type of AGN in the Universe (Ptak 2001; Nagao et al. 2002; Filho et al. 2006) and their low luminosities are thought to be caused by a combination of low accretion rates (Kauffmann & Heckman 2009) and low radiative efficiency of inefficient accretion processes (Ho 1999b; Maoz 2007; Panessa et al. 2007; Ho 2008). LLAGN are often associated with SMBHs of lower masses () and represent the most common accretion state in SMBHs (Ho 2008). Therefore, LLAGN provide the best opportunity to understand the bulk of the population of AGN, which is important for cosmological models of SMBH evolution, the physics and efficiency of accretion at the lowest luminosities, the triggering mechanisms of accretion and the local SMBH luminosity functions.
In order to detect the presence of a LLAGN in a nearby galaxy when optical emission lines are weak or not present, multi-wavelength data must be used instead. AGN are often detected at cm wavelengths because dust in the interstellar medium is transparent, allowing for unobscured views of the nuclei of nearby galaxies. However the radio luminosity from LLAGN is often very low (10-4 of the bolometric output; Condon 1992) and can be contaminated by SF. Thus to distinguish AGN we require both high sensitivity and high angular resolution. We have therefore observed all 280 galaxies above declination, +20∘ from the Palomar bright spectroscopic sample of nearby galaxies (Filippenko & Sargent 1985; Ho et al. 1995; Ho et al. 1997a; Ho et al. 1997b; Ho et al. 1997c; Ho et al. 1997d; Ho et al. 2003; Ho et al. 2009, hereafter referred to as the ‘Palomar sample’) with the -MERLIN radio interferometer array as part of the Legacy e-MERLIN Multi-band Imaging of Nearby Galaxies Survey (LeMMINGs; Beswick et al. 2014; Baldi et al. 2018; Baldi et al. 2021a; Baldi et al. 2021b) programme. The Palomar sample is generally accepted to be the most statistically complete sample of nearby galaxies. LeMMINGs provides sub-mJy sensitivity with resolution of 0.15 at 1.5 GHz (Baldi et al. 2018; Baldi et al. 2021a; Baldi et al. 2021b) and 0.05 at 5 GHz (analysis still is still on-going and will be presented in future papers).
Radio observations on their own cannot always distinguish the AGN and additional observations in other wavebands are required. The X-ray waveband is particularly valuable: compact X-ray emission with a steep powerlaw spectrum (photon index, =1.32.1, where ) is commonly interpreted as a ‘smoking gun’ for an AGN (Nandra & Pounds 1994; Piconcelli et al. 2005; Ishibashi & Courvoisier 2010). However, X-ray emission in the centres of galaxies can be contaminated by X-ray binaries (XRBs) and Ultra-luminous X-ray sources (ULXs) below X-ray luminosities of 1039 erg s-1. Previous ROSAT X-ray observations have insufficient angular resolution to remove the contribution of these sources (Roberts & Warwick 2000), necessitating the sub-arcsecond resolution X-ray imaging only possible with the Chandra X-ray observatory (Weisskopf et al. 2000, hereafter Chandra,). The combination of sub-arcsecond angular resolution and high sensitivity provided by Chandra allows for the detection of faint nuclei down to X-ray luminosities of 1039-42 erg s-1 (Fabbiano 2006).
X-ray studies of nearby LLAGN have focussed on the known ‘active’ galaxies like Seyferts and LINERs (Ho 1999a; Ho et al. 2001; Panessa et al. 2006; González-Martín et al. 2006; Akylas & Georgantopoulos 2009; Hernández-García et al. 2014; González-Martín et al. 2015), often returning detection fractions of X-ray nuclei per cent. However, these studies have often missed the H ii and ALG galaxies which may also harbour an AGN. Other studies have prioritised larger samples in which these ‘inactive’ sources may be selected, but the inhomogeneous nature of these samples makes statistical comparisons between different types of source difficult: Zhang et al. 2009 used Chandra, XMM-Newton and ROSAT to study 187 objects within a distance of 15 Mpc but employ their own multi-wavelength criteria; Liu 2011 analysed 383 objects from the entire Chandra archive which is biased to the well-known AGN and interesting off-nuclear sources such as ULXs; She et al. 2017 made a volume limited (d50 Mpc) Chandra sample, finding a detection fraction of 44 per cent for all galaxies, including the ‘inactive’ sources, but the sample was limited by the number of observations in the Chandra archive. In an effort to overcome these issues and compile a statistically-complete sample of LLAGN, we have constructed a catalogue of nuclear X-ray emission in nearby galaxies selected from the Palomar survey covered by LeMMINGs data, compiling all available data in the Chandra archive. We obtained 48 new observations of nearby galaxies to complete the sample in a declination range. Our catalogue has sub-arcsecond imaging in the X-ray band and is unbiased towards ‘inactive’ galaxies due to the parent sample selection.
This paper is structured as follows: in Section 2, we describe the observations and data reduction, in Section 3 we show the Chandra X-ray data results and present the sources detected. In Section 4, we discuss the results and implications of X-ray emission in the nearby Universe. Finally, in Section 5 we summarise our results and present our conclusions.
| Galaxy | Right | Dec. | Gal. Lat. | Dist | Obs. | Exposure | Sample | Det. | Mass | O[III] | AGN | Hubble |
|---|---|---|---|---|---|---|---|---|---|---|---|---|
| Name | Asc. | || | (Mpc) | ID. | (secs) | Status | Sig. | log(M⊙) | log(Lum.) | Class | Type | |
| (1) | (2) | (3) | (4) | (5) | (6) | (7) | (8) | (9) | (10) | (11) | (12) | (13) |
| NGC7817 | 0.995 | 20.752 | 40.76 | 31.5 | - | - | - | Not obs. | 39.29 | HII | Spi. | |
| IC10 | 5.096 | 59.293 | 3.34 | 1.3 | 8458 | 43571 | - | Undet | 37.13 | HII | Irr. | |
| NGC147 | 8.299 | 48.507 | 14.25 | 0.7 | - | - | - | Not obs. | - | ALG | Ell. | |
| NGC185 | 9.739 | 48.337 | 14.48 | 0.7 | - | - | - | Not obs. | 34.63 | LINER | Ell. | |
| NGC205 | 10.092 | 41.683 | 21.14 | 0.7 | 4691 | 9870 | C | Undet | - | ALG | Ell. | |
| NGC221 | 10.674 | 40.866 | 21.98 | 0.7 | 5690 | 113027 | C | Undet | - | ALG | Ell. | |
| NGC224 | 10.685 | 41.269 | 21.57 | 0.7 | 14196 | 42848 | C | 146.78 | - | ALG | Spi. | |
| NGC266 | 12.449 | 32.278 | 30.59 | 62.4 | 16013 | 84950 | - | 204.06 | 39.43 | LINER | Spi. | |
| NGC278 | 13.018 | 47.550 | 15.32 | 11.8 | 2055 | 38259 | - | 11.87 | 37.47 | HII | Spi. | |
| NGC315 | 14.454 | 30.352 | 32.50 | 65.8 | 4156 | 55016 | - | 33.96 | 39.44 | LINER | Ell. |
2 Sample Selection and Chandra Observations
To build a statistically-complete sample of nearby LLAGN, we started with the Palomar sample (Filippenko & Sargent 1985; Ho et al. 1995; Ho et al. 1997a; Ho et al. 1997b; Ho et al. 1997c; Ho et al. 1997d; Ho et al. 2003; Ho et al. 2009). The Palomar sample is statistically-complete to a brightness limit of . We selected sources with , to ensure that the synthesized beams in the radio observations were not highly elliptical, which is important for detecting small scale (sub-arcsecond, sub-kpc) jets. These 280 galaxies represent the LeMMINGs radio survey of nearby galaxies (Beswick et al. 2014; Baldi et al. 2018; Baldi et al. 2021a; Baldi et al. 2021b). The goal of LeMMINGs is to probe accretion and star formation in nearby galaxies in the radio waveband at 1.5 and 5 GHz with resolutions of up to 150 mas and 50 mas respectively, in concert with ancillary multi-wavelength data. Thus far, all 280 of the LeMMINGs objects have been observed by -MERLIN at 1.5 GHz (Baldi et al. 2018; Baldi et al. 2021a; Baldi et al. 2021b, see). Observations at 5 GHz have been completed and the data are being analysed (Williams et al., in prep.). To diagnose the central engine, all of the objects in the LeMMINGs survey were re-classified using their optical spectra from the Palomar sample into the Seyfert, LINER, ALG or H ii galaxy classifications according to updated diagnostic diagrams (Kewley et al. 2006; Buttiglione et al. 2010). The re-classification scheme can be found in Baldi et al. 2018; Baldi et al. 2021a, but for convenience, we list these classifications in Table 8.
Of the 280 Palomar galaxies above , 125/280 had been observed by Chandra observing programmes as of June 2015 and the data were publicly available11 1 Data were obtained from the HEASarc website: https://heasarc.gsfc.nasa.gov/db-perl/W3Browse/w3browse.pl. An additional 48 objects were observed as part of Chandra observing cycle 17 (programme ID 19708646 and 18620515, PI: McHardy), to provide complete Chandra coverage of all Palomar galaxies, selected in the declination range 4065∘ and Galactic latitude 20∘. By selecting in this range, we ensured that the sample was not biased towards known ‘active’ galaxies (e.g., LINERs and Seyferts) and avoided significant extinction from the Milky Way. We observed any previously unobserved sources for 10 ks, sufficient for detecting a source at an X-ray luminosity of 1039 erg s-1 at the median distance of the LeMMINGs sample (20 Mpc), with a Hydrogen absorbing column () of up to 1023 cm-2. The additional 48 objects included some objects with existing short Chandra observations, to increase the combined exposure on each of these galaxies to 10 ks. Unfortunately, one object, NGC 2685, was missed from the original observing list, but other than this object, the LeMMINGs and Palomar surveys are now complete for the declination range 4065∘ and galactic latitude cut.
Additional observations of the Palomar objects in our sample have been observed as part of other Chandra programmes, and these have also been included in our final sample. Therefore, we analyse all publicly available Chandra X-ray data up to June 2018, and now Chandra X-ray data exist for 213/280 objects (76 per cent) in the LeMMINGs sample. For sources with multiple observations, we choose those with the longest exposure in order to improve the chance of source detection or for improved signal-to-noise for spectral modelling. In addition, we do not use any grating observations, choosing only ACIS-S and ACIS-I observations. A future manuscript (LeMMINGs VI, Pahari et al. in prep) will analyse all publicly available ACIS datasets for the purposes of finding all X-ray sources in the LeMMINGs fields and perform variability analyses. The 213 galaxies observed by Chandra constitute the ‘X-ray LeMMINGs sample’, which we hereafter refer to as the ‘entire’ sample. We plot this sample as a function of distance in the top panel of Figure 1. Furthermore, the 113 objects in the 4065∘ declination range are referred to as the ‘Complete’ sample (bottom panel of Figure 1). We performed a KolmogorovSmirnov (KS) test on the distance distributions between the two samples and could not conclude that the two samples were statistically different. Future Chandra proposals will be submitted with the goal of observing all 280 galaxies with at least 10 ks exposure times, to complete the entire sample.
| Galaxy | Detection | log Flux | log Flux | log Flux | log Lum. | log Lum. | log Lum. |
|---|---|---|---|---|---|---|---|
| Name | Signif. | 0.310 keV | 0.32 keV | 210 keV | 0.310 keV | 0.32 keV | 210 keV |
| erg s-1 cm-2 | erg s-1 cm-2 | erg s-1 cm-2 | erg s-1 | erg s-1 | erg s-1 | ||
| (1) | (2) | (3) | (4) | (5) | (6) | (7) | (8) |
| IC10 | < | 13.92 | - | - | 36.38 | - | - |
| NGC205 | < | 14.00 | - | - | 35.77 | - | - |
| NGC221 | < | 14.24 | - | - | 35.53 | - | - |
| NGC224 | 146.78 | ||||||
| NGC266 | 204.06 | ||||||
| NGC278 | 11.87 | ||||||
| NGC315 | 33.96 | ||||||
| NGC404 | 89.63 | ||||||
| NGC410 | 26.74 | ||||||
| NGC507 | 58.35 |
A large number of the observed LeMMINGs objects in the Chandra archive are known ‘active’ galaxies based on their optical diagnostic emission-line ‘BPT’ classifications (Baldwin et al. 1981; Kewley et al. 2006; Buttiglione et al. 2010). However, with the addition of the new observations in the ‘Complete’ sample, we are able to ameliorate the imbalance of observations by AGN type. Most of the objects in the newly obtained data have never been observed with Chandra before and over half are H ii galaxies (29/48), which greatly helps the statistical completeness of the entire sample. Now, 100/141 HII galaxies (71 per cent), 22/28 ALGs (79 per cent), 14/18 Seyferts (78 per cent) and 77/93 LINERs (83 per cent), have been observed with Chandra for our sample, which is now more consistent with the parent sample split. Out of the 213 objects observed with Chandra by June 2018, the numbers are now more equitable: 100 H iis, 22 ALGs, 14 Seyferts and 77 LINERs, comparing to the original ratio of 70 H ii:22 ALG:14 Seyfert:59 LINER. When comparing to the overall fraction of AGN in the LEMMINGs radio sample (48 per cent H ii galaxies, 33 per cent LINERs, 12 per cent ALGs, 7 per cent Seyferts), the entire X-ray sample corresponds to 47 per cent H ii galaxies, 36 per cent LINERs, 10 per cent ALGs and 7 per cent Seyferts, which are very similar. Therefore, the entire X-ray sample currently represents one of the most complete and unbiased surveys of high-resolution X-ray emission from nearby galaxies.
3 Chandra Data Reduction
We performed standard reduction procedures using the Chandra Interactive Analysis of Observations (CIAO 4.11)22 2 http://cxc.harvard.edu/ciao/ software to reduce the ACIS data using the updated calibration database (CALDB 4.8.2) in CIAO. For the purpose of core detection significance, we used the wavdetect tool in CIAO, which is based on a wavelet transform algorithm and used frequently for point source detection with Chandra observations (Freeman et al. 2002; Liu 2011, e.g.). This tool is able to resolve sources which are closely separated on the scale of the point spread function (PSF) and able to distinguish diffuse emission due to its advanced treatment of the background. The average background level was equivalent to 1.6510-14 erg cm-2 s-1. We extracted flux images and ran the wavdetect task on each on-axis chip with scales of 1, 2, 4, 8 and 16 arcsec in the 0.310 keV band. We also performed manual examination of each source reported by wavdetect for possible false detections.
For the sources detected by wavdetect, with the observed flux higher than 5 the background level, circular regions of radius 2 arcsec around the Hubble Space Telescope optical centre of the galaxy were used to extract the flux and spectra of the objects. Hubble data exist for 173/280 LeMMINGs objects and will be presented in an upcoming work (LeMMINGs V; Dullo et al., in prep). If Hubble data were not available, then the galaxy centroid positions were obtained from the literature or from the NASA/IPAC Extragalactic Database33 3 https://ned.ipac.caltech.edu/. The background region was selected as an annular region with radii between 2 and 5 arcsec for most of the observations. However, for objects where an additional X-ray source was present within 4 arcsec of the core, we selected a 5 arcsec circular region close to the core but free of X-ray sources for the background. We checked and found that such a change in the background selection does not affect the background count rate significantly. Where pile-up is suspected in the spectra, we use an annulus to remove the highly affected inner region and only use the outer region that was unaffected by pile-up. We then use this data to fit a spectrum and report those values here. We checked the fits with a pile-up model in the spectra and do not find significant differences in the reported fluxes between the two methods. Source and background spectra were extracted using the source and background regions using the specextract tool in CIAO. Auxiliary Response Files (ARFs) and Redistribution Matrix Files (RMFs) were computed using observation specific aspect solution, mask and bad pixel files; dead area corrections were applied and ARFs were corrected to account for X-rays falling outside the finite size and the shape of the aperture.
For faint sources with an observed flux between 35 times the background flux level, a circular region of 10 arcsec was chosen to extract the source spectrum while an annulus region with radii of 10 and 20 arcsec, centered on the source was chosen to extract the background spectrum. Such a choice is made to ensure that both regions contain enough counts to extract observation specific ARFs for the source as well as the background. We checked to see if the difference in annulus size made a significant change in the extracted flux values, but it did not. However, we were careful to choose such regions so that they contain no additional X-ray sources with count rates more than 5 per cent of the typical background level. NGC 4826 and NGC 5907 were two such examples where bright X-ray sources are present within 10 radius of the core position and they were avoided by choosing a suitable size of the extraction region.
For sources where there was no X-ray counterpart detected in the central region, the srcflux tool was used to provide a model-independent estimate of the net count rates and fluxes including uncertainties in 0.310 keV energy band. Due to very low X-ray count rates, 20 arcsec circular source and background regions free of off-nuclear emission were chosen for this estimation. The PSF fractions in the source and background regions are estimated from the model PSF using arfcorr tool in the 0.310 keV band.
We extracted and fitted the X-ray spectra of all the nuclear sources using version 12.11.1 of the XSPEC software (Arnaud 1996). For bright sources, the extracted background-subtracted spectra are binned so that the signal-to-noise in each spectral bin is 3 or higher. For faint sources, the spectral binning is performed so that each bin contains at least 10 counts. For a few sources which have a detection significance of 4 or less, a binning of 5 counts per spectral bin was used. For spectral fitting of faint sources in XSPEC, the Gehrels weighting method (Gehrels 1986) was used which is suitable for Poisson data. For spectral modelling of faint sources, we used W-statistics, which is C-statistics with the background spectrum provided in XSPEC, while the Anderson Darling statistic (Anderson & Darling 1954; Stephens 1974) was used as the test statistic. While fitting, if some parameters could not be constrained within the acceptable range, they were fixed to the typical values, e.g., the width of the narrow Gaussian Fe emission line was fixed to 0.01 keV in some cases, and if the power-law photon index was not constrained with the range of 0.5 and 6, it was fixed to 1.8 while fitting.
Due to the low count rates in many of the observations, we fit simple models to the data. The base model used was phabs ztbabs zpowerlaw. The Galactic absorption (phabs) was obtained from Kalberla et al. 200544 4 An online tool exists at: https://heasarc.gsfc.nasa.gov/cgi$-$bin/Tools/w3nh/w3nh.pl and was fixed. The host galaxy absorption (ztbabs) was allowed to vary, as was the photon index (zpowerlaw). For most sources (102/150 detections, 68 per cent), the low count rates prevented more complex models than the simple absorbed power-law described above, and the parameters for these models are presented in Table. 10. However, in many bright sources, we required additional components to fit the more complicated spectra. These additional models included: zgauss for the Iron K alpha fluorescence line at 6.4 keV (present in 8 objects); an additional absorber model, either zpcfabs or zxipcf (required in the models of 30 objects); apec, a collisionally ionised plasma model (a necessary additional model in 25 objects, note that NGC 4151 required a second apec model; gabs a Gaussian absorption model (2 objects)). NGC 5194 is a well-studied bright Compton-thick AGN (Brightman et al. 2017, see e.g.,). Correspondingly, the high-quality Chandra spectrum is flat 3 keV, and displays a very strong and narrow neutral Fe K line: common features of reflection-dominated Compton-thick AGN. To account for these reflection features in the Chandra band, we fit a more complex model. In addition to an intrinsic powerlaw approximated with cutoffpl, we use pexrav to reproduce the reflection spectrum by freezing the relrefl parameter to 1 (since spectra 10 keV are needed to constrain this parameter well). We then included a fraction of the intrinsic powerlaw scattered through a lower column than the absorber (Matt et al. 2000, the ‘warm mirror’; see e.g.,). Finally, we included a zgauss component to reproduce the neutral Fe K line and apec to parameterise the ionised gas component visible 3 keV. Fluxes for all sources were then extracted from the best fit spectra in the 0.310.0, 0.32.0 and 2.010.0 keV bands.

.


| Det. | cstat/ | phabs | ztbabs | zpowerlw | apec | ||||
|---|---|---|---|---|---|---|---|---|---|
| Name | Sig. | mod. | Phot.I. | norm. | norm. | ||||
| (1) | (2) | (3) | (4) | (5) | (6) | (7) | (8) | (9) | (10) |
| IC10 | - | - | 50.6 | - | - | - | - | - | |
| NGC205 | - | - | 5.83 | - | - | - | - | - | |
| NGC221 | - | - | 18.3 | - | - | - | - | - | |
| NGC224 | 146.78 | 0.87 | 16.9 | 0.04 | 2.82 | 9.9610-5 | - | - | |
| NGC266 | 204.06 | 0.69 | 5.68 | 0.23 | 1.91 | 3.0510-5 | - | - | |
| NGC278 | 11.87 | 10.13/9c | 12.9 | 0.15 | 2.25 | 2.3010-6 | - | - | |
| NGC315 | 33.96 | 1.06 | 5.90 | 0.08 | 1.49 | 1.8410-4 | 0.54 | 2.6210-4 | |
| NGC404 | 89.63 | 15.57/20c | 5.71 | 0.44 | 1.88 | 4.8910-6 | 0.24 | 5.1710-5 | |
| NGC410 | 26.74 | 0.79 | 5.11 | 0.06 | 2.18 | 1.9510-5 | 0.78 | 2.0710-4 | |
| NGC507 | 58.35 | 1.02 | 5.25 | 0.07 | 2.77 | 3.7110-6 | 0.91 | 5.8910-5 | |
The photon indices, , typically range from 1.0 to 3.5. Figure 3 shows a histogram of the distribution of photon indices in both the Complete and entire samples presented in this work. Note that we only plot sources where a photon index was constrained (see below) and not an upper limit. In both samples, the peak of this histogram is in the bin of sources between =1.752.00. In some faint sources with fluxes between 3-5 detection limits in their images the photon index is highly unconstrained. We therefore fixed the photon index to =1.8 for these faint sources and re-fitted the spectra in order to estimate the host galaxy absorption. These additional fits are provided in the Appendix in table 4. We describe the results of all our X-ray spectral fitting in Section 4.6.
| Name | ztbabs NH | log Lum. 0.310 keV |
|---|---|---|
| (1) | (2) | (3) |
| NGC2276 | 0.10 | 39.49 |
| NGC2500 | 0.27 | 38.43 |
| NGC2541 | 1.41 | 38.24 |
| NGC2832 | 0.07 | 41.79 |
| NGC2976 | 0.20 | 36.49 |
| NGC3610 | 0.07 | 39.96 |
| NGC3992 | 1.42 | 38.45 |
| NGC4096 | 0.14 | 38.28 |
| NGC4605 | 0.10 | 36.85 |
| NGC5308 | 0.97 | 39.45 |
| NGC5371 | 0.02 | 40.08 |
| NGC5473 | 1.31 | 39.63 |
| NGC6643 | 0.21 | 39.13 |
4 Results
Here, we describe the results of the X-ray spectral fitting, fluxes and luminosities, and compare them to the ancillary information, e.g., BH mass, as well as complementary optical data and the LeMMINGs radio data. We compute an X-ray Luminosity Function (XLF) and compare the X-ray luminosity to the accretion rates in the X-ray LeMMINGs sample.

4.1 Properties of the X-ray sources
Out of the 213 galaxies that have been observed with Chandra for our sample, 150 show X-ray emission above a detection threshold of 3 and are co-incident with the optical core of the galaxy. As the optical positions of these sources are correct to 0.3 arcsec, the FWHM of the Chandra point spread function is 0.5-arcsec and we extracted spectra from a 2-arcsec aperture, they are referred to as ‘detected’ sources. The other 63 sources are considered ‘undetected’ yielding a detection fraction of 150/213 (70 per cent). We plot these detection fractions as a function of the distance of the sources in the top panel of Figure 1. For the ‘Complete’ sample, we arrive at similar detection fractions: 82 detected, 30 non detected, corresponding to a detection fraction 73 per cent and plot them in the bottom panel of Figure 1. For the detected sources, the 0.310.0 keV X-ray fluxes range from 5.310-16 to 5.010-11 erg cm-2 s-1, while the luminosities span from 1.81036 to 1.61043 erg s-1. These flux and luminosity ranges are similar to previous studies of nearby galaxies made with X-ray observatories (Roberts & Warwick 2000; Liu 2011).
We note that sources with nuclear luminosities 1039 erg s-1 could be ULXs/XRBs near the optical nucleus and not necessarily X-ray emission related to the central supermassive black hole (Fabbiano 2006; Swartz et al. 2011; Kaaret et al. 2017). Of the detected sources in the entire sample, 38 fall below this limit, of which 24 are H ii galaxies, 12 are LINERs and 2 are ALGs. In the Complete sample, the number of objects with 1039 erg s-1 are: 12 H ii galaxies, 5 LINERs and 1 ALG. However, one of the benefits of our sample is the overlapping high-resolution radio data from LeMMINGs, which can help disentangle non-AGN sources from real AGN. As accreting SMBHs are more radio-loud than XRBs, the radio data can help distinguish non-AGN activity from true AGN. A future publication (Pahari et al. in prep), will include radio luminosity from LeMMINGs (Baldi et al. 2018; Baldi et al. 2021a) as a discriminant for all detected sources in our Chandra data, including the nuclear sources. In addition, transient objects in the archive (such as the tidal disruption event, TDE, in NGC 3690) will have large changes in flux over year to decadal time scales. Large changes in X-ray flux over short time periods is unlikely to affect the majority of the sample and the X-ray emission should remain constant over long periods of time. For example, for Seyferts and LINERs, X-ray variability over the course of several years is observed (Hernández-García et al. 2014; Hernández-García et al. 2016). We removed any sources that are known to be transient nuclear events or non-AGN activity at the optical centre of the galaxy. Therefore, three objects - the TDE in NGC 3690 (Mattila et al. 2018), known nuclear ULXs in IC 342 (Liu 2011) and in NGC 3034 (M82) (Muxlow et al. 2010) - are removed from the discussions of the detected sources for the rest of this work.
In the top row of Figure 4, we plot the flux and luminosity values obtained for the entire sample as a function of distance, with the new observations for 48 galaxies plotted in orange for comparison. In the bottom row of Figure 4, we do the same for the ‘Complete’ sample. We witness no apparent distance dependence of the sources, with a wide range of fluxes and luminosities observed at all distances. However, there is an exposure length difference as a function of distance, as objects at distances greater than 40 Mpc have a mean exposure of 35 ks, whereas less distant objects have a 30 ks exposure on average. Exposure times will play a role in the likelihood of detection. It is not possible to quantify the effect this has on the detection likelihood in the sample, however we note that most of the objects in the ‘Complete’ sample reside closer than 40 Mpc, so this exposure length disparity has less of an effect on the ‘Complete’ sample.
| optical class | |||||
|---|---|---|---|---|---|
| X-ray | LINER | ALG | Seyfert | Hii | Tot |
| detected | 68 | 13 | 13 | 56* | 150 |
| undetected | 9 | 9 | 1 | 44 | 63 |
| unobserved | 16 | 6 | 4 | 41 | 67 |
| Tot | 93 | 28 | 18 | 141 | 280 |
| optical class | |||||
|---|---|---|---|---|---|
| X-ray | LINER | ALG | Seyfert | Hii | Tot |
| detected | 34 | 8 | 5 | 35* | 82 |
| undetected | 4 | 3 | 0 | 23 | 30 |
| unobserved | 1 | 0 | 0 | 0 | 1 |
| Tot | 39 | 11 | 5 | 58 | 113 |
For the entire X-ray LeMMINGs sample, the median exposure time of detected sources is 20 ks, whereas the median exposure for undetected sources is 10 ks. However, for the ‘Complete’ sample, the detected sources have a median exposure of 13 ks, and the non-detected sources 10 ks. This again shows that the ‘Complete’ sample does not suffer much from this potential bias as the entire sample does.
4.2 X-ray luminosity versus optical properties
Table 5 and Table 6 show the number of detected and undetected sources divided by optical class, for the entire and ‘Complete’ samples, respectively. Seyferts are the most detected optical AGN type (Entire: 13/14, 93 per cent, Complete:5/5, 100 per cent), followed by LINERs (Entire: 68/77, 88 per cent, Complete: 34/38, 89 per cent), then ALGs (Entire: 13/22, 59 per cent, Complete: 8/11, 73 per cent) and with H ii galaxies being the least detected (Entire: 56/100, 56 per cent, Complete: 35/58, 60 per cent).


In general, Seyferts have been observed with longer exposures, with a mean exposure of 53 ks, compared to 29 ks for LINERs, 32 ks for H ii galaxies and 25 ks for ALGs. A similar exposure length disparity is observed in the ‘Complete’ sample. As a consequence, Seyferts have been observed for longer than other galaxies and are therefore more likely to be detected. However, the distribution of X-ray luminosity is similar between Seyferts and LINERs (see Figure 5), but the H ii galaxies and ALGs have different luminosity distibrutions. It is possible that the difference in exposure length could have an affect on the completeness of our sample or the results, but cannot quantify this disparity further.

4.2.1 X-ray luminosity distributions vs optical spectroscopic class
The distribution of X-ray luminosity as a function of AGN optical class is presented in the upper panel of Figure 5. The detected LINERs are the most commonly observed AGN type with a median X-ray luminosity in the 0.310.0 keV band of 5.11039 erg s-1. The Seyferts occupy a similar region in this plot to the LINERs and have a median luminosity of 4.81040 erg s-1. The H ii galaxies have slightly lower X-ray luminosities, with a broad range between 1036 and 1041 erg s-1, with a median luminosity of 2.01039 erg s-1. The ALGs have a median luminosity of 3.51039 erg s-1 but show a similar distribution to H ii galaxies at lower luminosities. As for the upper limits (dashed lines in Figure 5), H ii galaxies, which have the lowest detection fraction, follow a broader distribution at a luminosities 12 decades below the detected sources.
4.2.2 X-ray luminosity distributions vs galaxy morphological class
The lower panel of Figure 5 shows the distribution of X-ray luminosity as a function of galaxy morphological type. We note that this figure shows no overall dependence of X-ray luminosity as a function of the galaxy morphological type, suggesting that nuclear X-ray emission can be found in all Hubble types. The median luminosity values for the sample are as follows: 5.11039 erg s-1 for ellipticals, 9.61039 erg s-1 for lenticulars, 3.31039 erg s-1 for irregulars and 2.51039 erg s-1 for spirals. Approximately two-thirds of the elliptical galaxies are detected (15/22, 68 per cent). They mostly cluster around 1040 erg s-1 with a few more luminous exceptions. The spiral galaxies, which are the most common type in the LeMMINGs sample, have a similar detection rate (93/135, 69 per cent) and follow a broad distribution of X-ray luminosities. The lenticular galaxies show a distribution between 1039 erg s-1 and 1041 erg s-1 and are the most detected Hubble type (37/44, 84 per cent). The irregulars have the lowest detection fraction (7/12, 58 per cent) and are a mixed bag of X-ray luminosities, likely due to the inhomogeneous nature of these galaxies, but they do include a couple of very low luminosity (1038 erg s-1) detected sources.


4.2.3 Combinations of optical spectroscopic class and galaxy morphological class
We investigated the connection between the different Hubble morphological types and the optical spectroscopic classes. For the detected LINERs, we find that 35/68 are spirals or irregulars, whereas 33/68 are lenticulars or ellipticals, suggesting LINERs can be found in all morphological types of galaxy. Detected Seyferts, by comparison, are detected only in spiral galaxies (9/15) or lenticulars (4/15). The detected H ii galaxies are almost exclusively associated with spiral galaxies, 48/56, with 6/56 being irregular galaxies and 2/56 associated with lenticulars. Finally, the ALGs are associated with all galaxy morphological types: 7 lenticulars, 4 ellipticals, 1 spiral and 1 irregular.
Comparing the morphological types to the optical classifications shows that all of the detected ellipticals (15) have LINER (11/15) or ALG (4/11) nuclei. The detected lenticulars are mostly associated with LINERs (22/35) and ALGs (7/35), but also in a 4 Seyferts and 2 H ii galaxies. Spiral galaxies are found to mostly to have H ii nuclei (48/91) or LINERs (33/91), with 9 Seyferts and 1 ALG. Of the nine detected irregular galaxies, 6 are associated with H ii nuclei, 2 with LINERs and 1 with an ALG.
| Correlation | ||||
|---|---|---|---|---|
| (1) | (2) | (3) | (4) | (5) |
| log(X-ray):log(M⊙) | ||||
| Entire, all | 33.83 | 0.78 | 1.16 | 0.64 |
| Entire, 107M⊙ | 33.40 | 0.83 | 0.99 | 0.41 |
| ‘Complete’, all | 35.02 | 0.62 | 1.10 | 0.53 |
| ‘Complete’, 107M⊙ | 36.91 | 0.37 | 0.83 | 0.20 |
| Entire, Seyferts | 34.98 | 0.81 | 2.68 | 0.42 |
| Entire, LINERs | 33.33 | 0.84 | 0.69 | 0.67 |
| Entire, ALGs | 26.00 | 1.66 | 0.94 | 0.83 |
| Entire, H ii gal. | 33.43 | 0.85 | 1.02 | 0.61 |
| log(X-ray):log([O iii]) | ||||
| Entire, all | 7.07 | 1.22 | 0.56 | 0.83 |
| ‘Complete’, all | 5.58 | 1.19 | 0.46 | 0.79 |
| Entire, Seyferts | 13.72 | 1.37 | 0.43 | 0.93 |
| Entire, LINERs | 2.55 | 1.11 | 0.27 | 0.88 |
| Entire, H ii gal. | 17.37 | 1.49 | 0.84 | 0.67 |
4.3 X-ray luminosity function
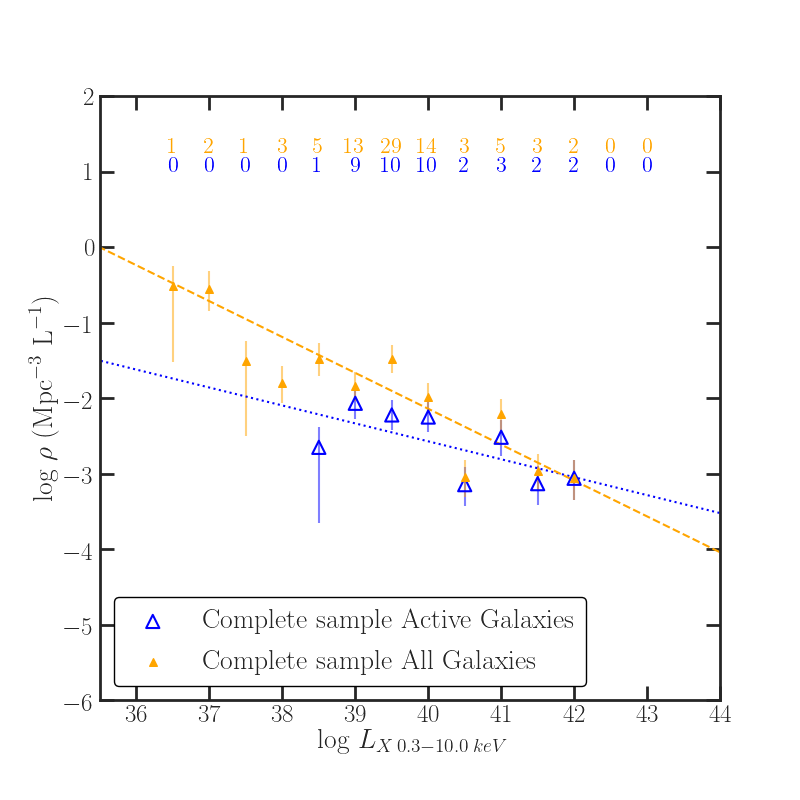
We now compute the X-ray luminosity function (XLF), using the method (Schmidt 1968). The XLF, (log LX), i.e. the space density of objects per unit logarithmic interval of luminosity is given by:
| (1) |
where is the fraction of the sky surveyed, is the number of objects in a given luminosity bin , and is the maximum volume in which the object would be observed to, given the limiting magnitudes/fluxes in both the optical parent Palomar sample and the X-ray sample. The smaller of the two volumes is used, to ensure that the object would be detected in both samples. We place detected sources in bins of equal X-ray power and use Poisson statistics to estimate uncertainties in each luminosity bin. As the LeMMINGs survey is for declinations 20∘, the fraction of the sky is limited to 1.316 sr, but for the ‘Complete’ sample we are limited further to 0.68 sr. The optical Palomar survey is limited to 12.5 mag. We use a flux limit of the X-ray sample, i.e., 1.6510-14 erg cm-2 s-1.
Figure 6 shows the XLF of the entire X-ray LeMMINGs sample in filled red circles and we fit a power law of slope = (red dashed line). We also fit the ‘active’ galaxies, (open black circles), finding a power law of gradient , shown by the black dotted line. These two fits differ by 1.2. The changes in the overall appearance of the luminosity function is more apparent in the ‘active’ sources, where the X-ray slope appears to flatten slightly below 1039 erg s-1, which may indicate some contamination from non-AGN sources, but this is based off a smaller number of objects and the two fits agree with one another, within the uncertainties.
We also plot in Figure 7 the XLF for the ‘Complete’ sample in the declination range 40 to 65∘, in orange for all galaxies, and blue for the ‘active’ galaxies. We recalculate the XLF for both the entire and ‘active’ galaxy samples and find power law fits of and , respectively. These two fit values disagree at the 1.5 level. However, comparing the fit for all galaxies between the entire sample and the Complete sample, yields a difference of 0.5, suggesting that the declination-limited Complete sample is not too dissimilar from the entire sample. Furthermore, the fits of the ‘active’ galaxies differ by 1.7 between the entire sample and the ‘Complete’ sample.
Previous studies of the XLF have focussed on sources with X-ray luminosities in excess of 1041 erg s-1 or higher, in order to remove potential contamination from XRBs and ULXs, due to lower resolution X-ray telescopes: MAXI (Ueda et al. 2011), Swift BAT (Tueller et al. 2008; Ajello et al. 2012), INTEGRAL: (Sazonov et al. 2008) and XMM-Newton (Fotopoulou et al. 2016). However, our data resolve the nuclear region to 0.5 arcsec with Chandra, so it is less likely that we are contaminated by XRBs and ULXs, allowing us to reach X-ray luminosities of 1036 erg s-1. Previous XLFs (see Ajello et al. 2012; Ueda et al. 2014; Ballantyne 2014) are described by a broken power-law, which is flatter below 1043 erg s-1. The power-law slope below 1043 erg s-1 is found to be between and , though our data show a shallower power-law. However, She et al. 2017 show that for local AGN using Chandra data, the power-law is more consistent with a slope of for all types of AGN, with the ‘active’ sources like Seyferts and LINERs showing the flattest power-laws ( and , respectively), while H ii galaxies and ALGs show steeper power-laws ( and , respectively). The general trend of flatter power-laws for ‘active’ galaxies is also apparent in our sample, with the addition of the ALGs and H ii galaxies showing a steepening of the overall power-law slope. Hence, our fits are qualitatively consistent with She et al. 2017.
4.4 X-ray properties vs black hole mass
We now investigate the X-ray luminosity as a function of BH mass (see Figure 8 and Figure 9 for the entire and ‘Complete’ samples respectively). The black hole masses used in this study are listed in Table 8. When possible, we use dynamical black hole measurements found in the literature (e.g., van den Bosch 2016, which accounts for fifty BH mass measurements in the full 280 objects of the LeMMINGs sample). When not available, the black hole masses are calculated using the relationship between black hole mass and stellar velocity dispersion, known as the relation. The stellar velocity dispersions () are listed in Ho et al. 1997a, while we use the relation obtained in Tremaine et al. 2002. However, the estimation of black hole masses in irregular galaxies and star-forming galaxies like H ii galaxies are more uncertain than those in bulge-dominated galaxies, i.e. ellipticals, and those where AGN are known, such as Seyferts and LINERs. The stellar velocity dispersions used to calculate the black hole masses give a standard deviation in fractional error of 0.25 for irregular and star-forming galaxies, whereas it is 0.17 for ellipticals and AGN. These errors are representative of the scatter found in the relation (Tremaine et al. 2002). Furthermore, the M relation used can affect the accuracy of the black hole mass estimate at lower masses and it is uncertain whether a single relation holds across the entire range of galaxy masses (Dullo et al. 2020, submitted). However, we compared the M relations of Tremaine et al. 2002, Kormendy & Ho 2013 and Graham & Scott 2013 and found that for black hole masses above 107 M⊙ the scatter was 0.5 dex, but below 106 M⊙ the scatter increased to 1 dex (Baldi et al. 2018, see). Shankar et al. 2016; Shankar et al. 2019 also discuss potential biases in the normalisations of both the and relations. However, these amount to at most a factor of 23 in the mean normalization of the relation, and they would not alter the already very broad dispersion in the correlation substantially.
In general, the detection rate of X-ray sources increases with BH mass. The detection fraction for the entire sample objects with BH masses 108M⊙ is 88 per cent (36/41), but below 106M⊙, the detection fraction falls to 50 per cent (26/52). Of the five undetected objects with 108M⊙, four of them are ALGs. A similar distribution exists for the ‘Complete’ sample: 12/13 (92 per cent) detection fraction for 108M⊙ and 16/29 (55 per cent) for 106M⊙.

While the black hole masses range over 5 orders of magnitude (see Figure 8), there are clear distinctions in the different types of AGN nucleus. The detected Seyfert galaxies tend to have the highest X-ray luminosities for each mass bin, when compared to other AGN types. They generally cluster 12 decades above the other AGN types in X-ray luminosity (see also Figure 9 and Figure 10). There is a large distribution in the LINER X-ray luminosity of order 23 decades. The detected ALGs tend to lie in the same mass bins as the LINERs, but at slightly lower X-ray luminosities (1039 erg s-1). The low mass H ii galaxies are not often detected, but they appear to follow the same overall trend as the rest of the detected X-ray population, but with a larger distribution towards the lowest BH masses.
We test the correlation between X-ray luminosity and BH mass, using LINMIX55 5 A Python module can be obtained from https://linmix.readthedocs.io/en/latest/index.html: a Bayesian framework that folds in uncertainties in both axes as well as upper limits in the y axis (Kelly 2007). LINMIX can provide the gradient, y-intercept, the scatter and the correlation coefficient () for a given fit. We note that two of the sources (NGC 1003 and NGC 4242) have upper limits on both black hole mass and X-ray luminosity. The LINMIX package is unable to handle upper limits in both axes simultaneously so we remove these two sources from the fits. In Figure 8 and Figure 9, we display 400 draws from the fitting process to give a visual guide to the scatter in the correlations. As an additional analysis, we computed the correlation for sources with black hole masses greater than 107 M⊙, in order to find show any global difference in the slope at lower masses, in analogy to a break found in the radio LeMMINGs sample (Baldi et al. 2018; Baldi et al. 2021b).
We find a correlation for the ‘Complete’ sample sources (solid black line in Figure 9) to be of the form M⊙ , with an intrinsic scatter of 1.05 dex (correlation coefficient, = 0.53). The uncertainty values are the 16th and 84th percentile level of the fit parameters and we show these in full in Table 7. The black dashed line shows the correlation for ‘Complete’ sample sources above 107M⊙, which is M⊙ 0.37±0.28 and an intrinsic scatter of 0.91 dex ( = 0.20). The correlation coefficients indicate a positive correlation, but the 107M⊙ correlation is very weak. For the entire sample, we find slightly different fits, of M⊙ 0.78±0.07 (scatter = 1.08 dex, = 0.64) for the entire sample and for those above a black hole mass of 107M⊙, we find a correlation of the form M⊙ (scatter = 1.00 dex, = 0.41). We note that the entire sample includes more galaxies at higher X-ray luminosities which may provide a reason for the steeper gradients and stronger correlation coefficients, but, given the uncertainties in the fits, the entire and Complete sample values agree with one another within 1. Therefore, we do not find a break X-ray-M⊙ relation as in the LeMMINGs radio-MBH relation (Baldi et al. 2018; Baldi et al. 2021b).
We also investigated the correlations in each type of AGN, using the entire sample due to the low numbers of objects in the ‘Complete’ sample for all AGN types. We further note that the entire sample does not appear to differ significantly from the statistically-complete sub-sample. For Seyferts, we find a correlation of M⊙ (scatter = 1.64 dex and = 0.42). In the literature, correlations between X-ray luminosity and BH mass have led to mixed results (Koratkar & Gaskell 1991; Kaspi et al. 2000; Pellegrini 2005; Panessa et al. 2006, e.g.,). Given the low number of Seyferts in our sample, the large scatter in correlation and the poor correlation coefficient presented here, it is not possible to find any strong correlation between the X-ray luminosity and BH mass for Seyferts.
We performed the same analysis for the LINERs, ALGs and H ii galaxies and found them to all be correlated between the X-ray luminosity and BH mass. The LINER correlation is M with a scatter of 0.83 dex. The H ii galaxies follow a correlation of M with an intrinsic scatter of 1.01 dex. For the ALGs, the correlation is M with a scatter of 0.91 dex. Given the low detection fraction and the low number of objects, we do not claim a significant correlation for ALGs. For the LINERs and H ii galaxies, they have remarkably similar fit parameters and intermediate correlation coefficients, suggesting that H ii galaxies may be similar to LINERs, although we note there is up to 1 dex of scatter in both relations. This finding may represent a continuation of the LINERs down to lower X-ray luminosities, but the uncertainties on sources at lower black hole masses (106M is larger, so these correlations are driven by the higher mass objects. Indeed, removing sources below 106MBH results in the same fits, but fitting only sources 106MBH leads to unconstrained or very poorly constrained fits in all cases.


4.5 Eddington Ratio
In addition to the fits presented above, we compared the 210 keV X-ray luminosity and BH mass plot to the Eddington ratio,
| (2) |
for the detected sources in the sample in Figure 10. In order to compare these quantities, we assume that the bolometric luminosity = 30X-ray luminosity in the 2.010.0 keV band following (Panessa et al. 2006). This assumption is very simplistic, as the bolometric luminosity relies on the shape of the spectral energy distribution for the AGN, which could differ amongst LLAGN types. Furthermore, the value of 30 is valid for more powerful AGN, but observationally, this value ranges from 3 to 16 (Ho 1999b), approximately consistent with the theoretical calculations of optically-thick and geometrically thin accretion disks (Netzer 2019). Hence, as discussed in Panessa et al. 2006, for a lower scaling value of to , for example 10, the lines on Figure 10 would drop by a factor of 3. However, even with these approximations, the 1, 2 and 3 shaded distributions66 6 The contour plots are made with corner (Foreman-Mackey 2016). in Figure 10 show that the Seyferts are associated with the higher a mixture of Eddington ratios, from values 10-3, but with a number below this dividing line region with Eddington ratios of 10-3. Furthermore, the contour plots show the similarity of the LINERs and ALGs, suggesting that the ALG population are similar to low X-ray luminosity LINERs. We performed a two-dimensional, two-sample KS test on these regions for ALGs and LINERs, and found a p-value of 0.06. This p-value suggests evidence for the null hypothesis, indicating that these two samples are not statistically different from one another. For all other combinations, the p-values returned were and so we can reject the null hypothesis, i.e., the distributions are not drawn from the same sample. For the H ii galaxies, they are found in a similar X-ray luminosity region to the LINERs (and ALGs), but at lower masses.
As a final analysis, Figure 11 shows histograms of the ratio between the X-ray luminosity and black hole mass, which can be used as a tracer of the accretion rate, split once more by AGN and Hubble types. For the different AGN-types, including the ‘inactive’ galaxies, H ii galaxies have the largest ratios of X-ray luminosity to black hole mass, assuming the emission is from AGN-activity. The next largest ratio are found in Seyferts, suggesting that they are higher accretion rate objects. LINERs and ALGs have lower ratios of X-ray luminosity to black hole mass, consistent with the lower accretion rates in Figure 10. However, it should be noted that H ii galaxies generally fall in the lower mass bins in Figure 11 and have larger error bars. To test whether the black hole masses may be driving this correlation, we removed all sources with mass errors in log space 0.1, so as to only include those with robust mass measurements. This cut leaves seventy sources and also has the effect of removing sources with black hole masses 106MBH. In-so-doing, the H ii galaxies appear to have more similar accretion rates to those of Seyferts and LINERs, with all H ii galaxies with ratios of X-ray luminosity to black hole mass larger than six being removed. In terms of the Hubble types, spirals and irregular galaxies show higher X-ray to black hole mass ratios, which may be correlated with the prevalence of H ii galaxies having larger ratios. Ellipticals and lenticulars are more prevalent in the lower X-ray luminosity to black hole mass bins, suggesting lower accretion rates.
4.6 Spectral Properties of the X-ray sources
We now look to the best fit Chandra spectra described in Section 3. The spectra and best fit flux values are reported in the Appendix for each galaxy in Table 10. Here, we analyse the spectra in more detail, comparing them to the AGN type and galaxy morphological types.

4.6.1 Absorption
In Section 3 we fitted all spectra with an absorbed power-law and additional simple models where an absorbed power-law was insufficient. For objects detected with a significance of 5 , we summed all the neutral absorbers and report a total absorption from these additional models. For sources detected between 35 the detection significance in their image, we fixed the photon index to 1.8 to find the total absorbing column. From this analysis, we are able to report the total absorbing column, which we show in Figure 12, binned by AGN type. In this figure, we also show the Galactic line-of-sight contribution for the undetected sources in the upper histogram. For a large number of the detected sources (80/150, 53 per cent), only upper limits to the host galaxy absorbing columns were found. Excluding sources with upper limits on their host galaxy absorption, we have 70 remaining galaxies, from which we could ascertain a value of . Of these sources, 49 (70 per cent) have total absorbing columns of 1022 cm-2. These sources therefore are not heavily obscured as they have an Hydrogen column densities less than the average Galactic value, in contrast with studies of other AGN (Burlon et al. 2011; Ricci et al. 2015; Boorman et al. 2018). A source with an absorbing column 1.51024 cm-2 is called "Compton-thick", which denotes that it is significantly obscured (Comastri 2004; Boorman et al. 2018). In our sample, we find no sources which can be considered Compton-thick, although four sources (NGC 1161, NGC 3729, NGC 4111 and NGC 7640) have an absorbing column of 1.01023 cm-2. We therefore confirm that the nuclei of our sample are typically unobscured, with a large fraction (129/150, 86 per cent) have host galaxy absorbing columns of less than that of the Galaxy, e.g., 1022 cm-2.
Obtaining a reliable estimate of the obscuring column density from X-ray spectra requires a reliable estimate of photoelectric absorption as well as reprocessing (collectively Compton scattering and fluorescence) of the intrinsic AGN emission. For heavily obscured and Compton-thick AGN, this reprocessing can dominate the observed spectral emission, manifesting as a flat spectrum at 10 keV, a strong neutral Fe K fluorescence line at rest energy 6.4 keV and a broad Compton hump peaking at 30 keV (e.g., Lightman & White 1988; Reynolds et al. 1999; Matt et al. 2000; Murphy & Yaqoob 2009). However, the Fe K fluorescence line is not always found to be strong in Compton-thick AGN (e.g., Gandhi et al. 2017; Boorman et al. 2018) and our spectral coverage provided by Chandra does not cover the Compton hump 8 keV. It is thus difficult to constrain high columns with our phenomenological modelling presented here. In fact, a number of our sources have been classified as Compton-thick by previous works using spectra above 10 keV: NGC 2273 (Brightman et al. 2017); NGC 3079 (Brightman et al. 2017; Marchesi et al. 2018); NGC 3982 (Kammoun et al. 2020); NGC 4102 (Ricci et al. 2015; Marchesi et al. 2018) and NGC 5194 (Brightman et al. 2017).
Interestingly, NGC 3079 and NGC 4102 are found to display non-Seyfert BPT line ratios in our sample (LINER and ALG, respectively), yet are intrinsically-luminous heavily obscured Seyferts. In addition, some of the LINERs in our sample (NGC 2639, NGC 4589, NGC 5005, NGC 5866 and NGC 7331) may also be Compton Thick as shown from a sample of X-ray spectra of LINERs (González-Martín et al. 2015). This hints to a population of obscured Seyferts amongst the optically-classified ALGs, HIIs and LINERs, that hard X-ray spectra could elucidate. However, due to a significant lack of NuSTAR coverage in our sample (41/280 15 per cent), a statistically-complete spectral analysis combining Chandra and NuSTAR is currently not possible. Future observations with NuSTAR will enable broadband spectral fits with Chandra using physically-motivated obscurer models which are capable of constraining high columns, even into the Compton-thick regime (e.g., Masini et al. 2019; Kammoun et al. 2019; LaMassa et al. 2019). Such observations will shed light on the true proportion of Seyferts in our sample, as well as the Compton-thick fraction in the local Universe.
4.6.2 Photon index


Figure 13 shows the photon index from the spectral fits (see Section 3) of the entire sample, broken down into AGN types and Hubble types. In both cases we separate all the data (solid line histograms) from those that had luminosities 1039 erg s-1 (filled histograms). While most of these classifications have a peak number of sources within the photon index range 1.752.00 or in adjacent bins, there is no clear distinction in the distributions between any AGN type or Hubble type. LINER and Seyfert galaxies, spirals and lenticulars show a peak in the 1.752.0 bin. The distributions for the photon indices in all classification types span the range of fit values found in Section 3 (see Figure 3). Furthermore, removing sources with luminosities 1039 erg s-1 does not reduce the breadth of these histograms. We therefore find no evidence that spectral index is significantly affected by optical spectral or morphological type. This finding hints at the variety of different X-ray emitting nuclei in the local Universe and that if interpreted as AGN, that these nuclei can be found across a wide range of galaxy types and AGN classifications.
4.6.3 Eddington Ratio

The accretion rate can be approximated using the ratio between the X-ray luminosity and the Eddington luminosity, as described in the previous Section. We now plot the photon index as a function of this ratio in Figure 14, similar to that performed by Connolly et al. 2016 for a sample of 24 Palomar galaxies (their Figure 8). We only plot sources with luminosities 1039 erg s-1 and have a reliable photon index fit value i.e., no upper limits. This cut limits our sample to 63 sources. To compare directly to Connolly et al. 2016, we use the harder 210 keV band fluxes for this figure. We also include the fits for higher Eddington rate radio-quiet AGN (Shemmer et al. 2006) and for LLAGN (Constantin et al. 2009), as shown in Connolly et al. 2016. Our data generally probe the lower (10-3 /) regime, although a handful of objects (notably NGC 4051, NGC 4395 and NGC 5548), are above this threshold. The overall trend follows that of Constantin et al. 2009 for the lower accretion rate objects (10-3 LX/LEdd). We do not have enough objects which have accretion rates 10-3 / to compare with the results of Shemmer et al. 2006, but we do note that most of the objects that fall near this line are Seyferts and broadly follow the correlation. However, given the large errors and scatter in the range of photon indices for this sample, it is difficult to draw significant conclusions on these data. Longer exposure observations are required to further constrain the photon indices in these objects to further probe these relations.
4.7 X-ray compared to [O iii] line luminosity


When X-ray observations are not available, the forbidden [O iii] line luminosity, which is easier to measure from ground based instruments, is used as a proxy for the X-ray luminosity (Panessa et al. 2006; Hardcastle et al. 2009; González-Martín et al. 2009; Saikia et al. 2015; Saikia et al. 2018a, e.g.,). The above relationships have generally been obtained at relatively high luminosities. Given the usefulness of this relationship it is important to take advantage of our present Chandra data to derive the relationship with to lower X-ray luminosities. Future observations can provide [O iii] luminosities of similarly improved spatial resolution as the Palomar line data used here from Ho et al. 1997a is not of particularly high spatial resolution and may be contaminated by some level of SF.
The top panel of Figure 15 shows the [O iii] line luminosity obtained from the Palomar survey of all the detected and undetected X-ray sources plotted against the X-ray luminosity in the 0.310 keV band. This correlation for the ‘Complete’ sample is shown in bottom panel of Figure 15. Once more, we use the LINMIX package to include upper limits in the X-ray luminosity and show all of our correlation results in Table 7. The correlation is of the form LL with a scatter of 0.75 dex for the entire sample ( = 0.83) and LL with a scatter of 0.83 dex for the ‘Complete’ sample ( = 0.79).
The scatter in the correlation is larger at lower X-ray and [O iii] line luminosities. The LINERs and Seyferts have the highest [O iii] and X-ray luminosities of the sample, whereas the H ii galaxies are at the lowest X-ray and [O iii] luminosities. However, there is a lot of mixing between all the classes, so no clear region for each optical AGN class emerges. Fitting each of the three optical AGN types separately for the entire sample, we arrive at fits of LL with a scatter of 0.66 dex for Seyferts ( = 0.93), LL with a scatter of 0.52 dex for LINERs ( = 0.88) and LL with a scatter of 0.92 dex for H ii galaxies ( = 0.67). These fits are all consistent with one another, within the uncertainties and show a strong positive correlation. Furthermore, the low scatter in the LINERs and Seyferts shows a tight correlation between the [O iii] line luminosity and X-ray luminosity in these objects, whereas the larger scatter in the H ii galaxies add scatter to the overall relation, especially at the lowest luminosities.
Previous work has shown that the X-ray-[O iii] correlations tend to show a 1:1 ratio, similar to that found here for the Seyferts (Panessa et al. 2006; Hardcastle et al. 2009). The X-ray LeMMINGs data corroborates these findings, indicating that the X-ray and [O iii] ionising radiation are coupled down to very low luminosities, albeit with some additional scatter. A similar correlation is found for LINERs (González-Martín et al. 2009, e.g.,) and it is interesting that the H ii galaxies follow a similar correlation to the Seyferts and LINERs. However, we note that the X-ray emission from the LINERs may be coming from the jet rather than accretion flow (Balmaverde & Capetti 2006, e.g., see ).
5 Discussion
We have presented X-ray observations of 213/280 objects in the Palomar survey above = 20∘, that as of June 2018 have been observed with Chandra. Altogether, 150/213 (70 per cent) objects were detected, which is higher than previous studies of a subset of the Palomar sample using poorer resolution/quality data from ROSAT (Roberts & Warwick 2000, 54 per cent,) and Chandra (Ho & Ulvestad 2001, 62 per cent,). For matching resolution X-ray observations with Chandra presented by She et al. 2017, we find similar detection fractions for all types of AGN. We find that almost all Seyferts, ALGs and LINERs have a nuclear X-ray core, co-incident with the optical nucleus of the galaxy. In addition, around half of the H ii galaxies in the sample are detected in the X-rays at the optical nucleus. As to the nature of these X-ray sources, the LINERs and Seyferts appear to be associated with luminosities 1039 erg s-1 in most cases, but the H ii galaxies and ALGs represent a less-luminous population of nuclear X-ray emission that may be due to LLAGN, or potentially other X-ray sources in the galaxy such as ULXs or XRBs. To ascertain the nature of the nuclear emission, we used the other multi-wavelength data available, which we discuss below in the case of each of the AGN types.
5.1 Seyferts
There are 14 Seyferts in the entire X-ray LeMMINGs sample, of which 13 are detected (93 per cent), but this detection fraction is 100 per cent in the Complete sample (5/5 objects). The only Seyfert that is not detected is NGC 3486, which has only a 2 ks observation and is a type II Seyfert which may be obscured by large absorption along the line of sight. The Seyferts have the highest X-ray luminosities (1039 erg s-1), occupying regions of higher X-ray luminosity per black hole mass bin and [O iii] emission line luminosity. We do not report a correlation between the X-ray luminosity and the black hole mass for Seyferts. The lack of correlation is likely caused by the large scatter in any relation due to the wide range of Eddington values in this class (see Figure 10), with some Seyferts showing Eddington ratios as low as 10-6. The low number of Seyferts in this sample prevents us from making firmer conclusions on this correlation. The higher Eddington ratio (10-2) Seyferts obtained from the X-ray data indicate that in general, Seyferts accrete efficiently, likely in the form of an optically-thick, geometrically thin accretion disk (Shakura & Sunyaev 1973). They are likely scaled down versions of the more powerful AGN in quasars, accreting at lower Eddington ratios (Panessa et al. 2006). However, for the Seyferts that have lower Eddington ratios (10-3 Merloni et al. 2003), they could possibly be powered by some form of radiatively inefficient accretion flow (see Section 5.2).
5.2 LINERs
Of the 77 LINERs in the entire X-ray sample, 69 of them are detected (90 per cent), which is similar to the detection rate in the ‘Complete’ sample (35/38, 92 per cent). They are mostly detected with luminosities 1039 erg s-1 and are associated with the highest BH masses. They follow a similar X-ray/[O iii] gradient to the Seyferts. LINERs are often described by some form of radiatively inefficient accretion flow (Narayan et al. 1997; Narayan et al. 1998, RIAF e.g.,). Our X-ray observations support this interpretation as the inferred Eddington ratios in Figure 10 indicate that most LINERs have 10-4 and much weaker X-ray luminosities than those of Seyferts. X-ray emission from shocks or post-AGB stars would not be able to explain such high nuclear X-ray luminosities (Allen et al. 2008; Sarzi et al. 2010; Capetti & Baldi 2011; Singh et al. 2013). We also note that some of the X-ray emission in the LINERs may come from the jet rather than the accretion flow (Balmaverde & Capetti 2006; Balmaverde et al. 2008, see). We therefore suggest that most of the LINERs in our sample may be powered by a form of RIAF, but further follow-up observations are required of this sample to unequivocally determine the accretion mechanism in LINERs.
5.3 Absorption Line Galaxies
Absorption Line galaxies (ALGs) have often been missed in previous X-ray surveys, as they are not considered ‘active’, like the Seyferts and LINERs. However, they have a reasonable detection fraction 13/22 (59 per cent) in the entire sample and 8/11 (73 per cent) in the ‘Complete’ sample. They are associated with X-ray luminosities similar to the LINERs, around 1039 erg s-1. ALGs tend to be better detected in the higher mass bins but appear in similar regions to LINERs in terms of Eddington ratio (Figure 10), it is possible that they may have a common central engine (Baldi & Capetti 2010; Baldi et al. 2018; Baldi et al. 2021b). Nonetheless, the ALGs are mostly associated with elliptical galaxies and the lack of a detection of the [O iii] line limits the interpretation of the central engine. Furthermore, the low implied X-ray luminosities in some of the ALGs (see upper limits in Figure 5), indicates that they may not be identical to LINERs. An alternative explanation for the central engines of ALGs is the nuclear recurrence scenario due to an intermittent accretion phenomenon (Reynolds 1997; Czerny et al. 2009). Further dedicated studies at higher sensitivities of ALGs should be undertaken to ascertain the true cause of their X-ray and multi-wavelength emission.
5.4 H ii galaxies
Of the 100 H ii galaxies observed by Chandra in our sample, 57 were detected in the X-ray (57 per cent). In the ‘Complete’ sample, the H ii galaxies have a similar detection fraction: 35/58 (60 per cent). Of the detected objects, 32/57 (56 per cent) are of X-ray luminosities 1039 erg s-1, similar to that of LINERs and Seyferts. The H ii galaxies span a range of accretion rates and BH masses, but follow similar correlations to the Seyferts and LINERs, specifically the X-ray/ and X-ray/[O iii] relations, and especially at the higher black hole masses. Therefore the H ii galaxies with a detected X-ray core, and X-ray luminosity 1039 erg s-1 and a BH mass 107M⊙, are likely powered by an AGN. But, there could still be some contribution from SF processes to both the [O iii] and X-ray luminosities. It is not clear whether the majority of these objects are powered by ineffcient flows, similar to LINERs, or a more efficient accretion mode, similar to Seyferts. However, (Baldi et al. 2018; Baldi et al. 2021a) found some ‘jetted’ H ii galaxies which could be more consistent with LINER-like activity. For the 25 H ii galaxies that do not fulfil these requirements, e.g., detected H ii galaxies at lower masses and X-ray luminosities, their central engines are more uncertain, and further investigation is required to classify them as genuine LLAGN or imposters in the form of XRBs and ULXs (see next Section). Furthermore, it should be noted that the central object of 43 per cent of the H ii galaxies are undetected, so deeper X-ray observations are needed in order to fully understand the central engines in these objects.
5.5 Is there any contamination from XRBs and ULXs?
Given the 0.5 arcsec on-axis resolution of Chandra, we considered X-ray sources which lie within 2 arcsec of the optically defined nucleus as likely being powered by a central SMBH. However, some of these sources may not be an AGN, but may be a ULX/XRB, as is observed in NGC 3034 (Muxlow et al. 2010). In addition, nuclear star formation from O/B star associations can be as luminous as 1035 erg s-1 (Oskinova 2005) and could cause further contamination. We computed XLFs for the sample, and showed that it is unlikely we are heavily biased to non-AGN sources contaminating the nucleus, as our XLFs are shallower than those expected of ULXs and XRBs (see She et al. 2017, and references there-in). However, the XLFs are steeper when the ‘inactive’ galaxies are included in both the entire and ‘Complete’ samples, so some small contamination may be possible in those galaxies. If a discriminating X-ray luminosity of 1039 erg s-1 is used as a criterion to remove non-AGN sources, then 13/13 detected Seyferts, 56/68 LINERs, 11/13 ALGs and 32/56 H ii galaxies would be considered AGNs for the entire sample. By Hubble types, 14/15 ellipticals, 59/91 spirals, 33/35 lenticulars and 6/9 irregulars would be considered AGNs. This definition shows that of all types, H ii galaxies, spirals and irregulars are the most likely to be contaminated with ULX/XRBs. Unsurprisingly, this link has been observed previously between star formation and prevalence of ULXs in a galaxy (King 2004; Gilfanov et al. 2004; Swartz et al. 2009). But, it is also possible for a 1039 erg s-1 LLAGN to co-exist with ULX/XRBs in a galactic nucleus. Therefore, additional information is needed to categorically remove spurious non-AGN sources from the sample. However, SMBHs are more radio loud than stellar mass sized black holes and in a future publication (Pahari et al. in prep), we will include radio luminosity in our decision as to whether nuclear sources are SMBHs or a contaminating source.
6 Conclusions
We have presented archival and new Chandra X-ray observatory data for 213/280 (76 per cent) objects in the declination limited ( ) Palomar sample, and 112/113 of the Palomar galaxies in the sub-sample between 40∘ , which we refer to as the ’Complete’ sample. Although most galaxies have a considerably longer exposure time, we achieve a minimum observation time of 10 ks on all observed targets. Using these data, we achieve a background flux level of 1.6510-14 erg cm-2 s-1. The entire X-ray LeMMINGs sample has detected X-ray emission co-incident with the optical centre of 150/213 (70 per cent) of the observed galaxies across all optical AGN types and galaxy morphologies. The 150 X-ray detected galactic nuclei were fit with simple spectral models in XSPEC and their fluxes computed in the 0.32.0, 2.010.0 and 0.310.0 keV bands. The detection rate of our Chandra data of nuclear X-ray emission compares favourably to previous X-ray studies of the Palomar sample: 70 per cent detections compared to 54 per cent in Roberts & Warwick 2000 and 62 per cent in Ho & Ulvestad 2001. Comparing to a previous work based on Chandra data by She et al. 2017, we find broadly similar results: X-ray emission associated with the AGN is observed 80 per cent of the time in Seyferts, LINERs and ALGs, but also in H ii galaxies in 50 per cent of objects.
We determined an X-ray luminosity function (XLF) from the data in our sample and fit a simple power-law of -0.540.06 for the entire sample and -0.450.05 for the ‘Complete’ sample, for all galaxies. Our data probes lower X-ray luminosities than most previous studies (Ajello et al. 2012, e.g.), extending the X-ray luminosity function down to 1036 erg s-1, two orders of magnitude lower than the previous Chandra observations (She et al. 2017). We further split the entire and ‘Complete’ samples into ‘active’ sources such as LINERs and Seyferts and all sources, in order to show the differences in XLFs when ‘inactive’ galaxies such as HII and absorption line galaxies are included. We found an XLF power-law of and using all galaxies, for the entire and ‘Complete’ samples samples, respectively. In both the entire and ‘Complete’ samples samples, the inclusion of the ‘inactive’ galaxies increased the gradient of the XLF, which may suggest contamination from non-AGN objects, though we note that the power-law fit values are consistent with those found for all galaxies. Furthermore, our single power-law fits are consistent with previous Chandra studies of local galaxies She et al. 2017.
In terms of the empirical correlations between the X-ray luminosity and other diagnostics of SMBH activity, e.g., BH mass and [O iii] line luminosity, correlations were obtained for different optical AGN classes. We fitted the data including upper limits to the X-ray luminosity and black hole masses obtained from the relation or dynamical mass measurements, finding an overall relationship for the entire sample to be with a scatter of 1.08 dex, and for the ‘Complete’ sample of , with an scatter of 1.05 dex. No strong correlation was observed for Seyferts between the X-ray luminosity and BH mass, which may be due to the low number of Seyferts in this sample. The H ii galaxies, ALGs and LINERs follow similar correlations in the X-rayBH mass plane. We also note that the detection fraction is much higher amongst higher mass objects (88 per cent for 108M⊙) than in lower mass objects (50 per cent for 106M⊙). By comparing the black hole masses to the Eddington luminosity, and assuming a bolometric correction factor of 30LX, we showed that the LINERs and ALGs all have very low Eddington ratios ( 10-3). The Seyfert galaxies tend to have higher Eddington ratios but there are some notable exceptions at lower accretion rates. H ii galaxies can have a mixture of accretion rates, which may be due to their prevalence with lower mass nuclei, skewing their numbers to higher accretion rates artificially.
We also fitted the spectra of all the detected sources, using simple absorbed power-law models in most cases. We found that the best fit spectra indicated a preference for a photon index in the range 1.752.0, consistent with previous studies of brighter AGN. We therefore fixed the photon index to 1.8 for the faintest sources and re-fitted the spectra to ascertain the host galaxy absorption across the sample. We found that for 53 per cent of sources only upper limits to the host galaxy absorption were possible, and for those where reliable fits to the photon index were found, 70 per cent have absorbing column densities of less than the value through our Galaxy. As a final analysis with the spectra, we plotted the photon index as a function of the accretion rate. We found that the vast majority of sources in our sample with X-ray luminosities above 1039 erg s-1 followed the relationship for LLAGN proposed by Constantin et al. 2009, but we note that further observations are required for refinement of this analysis and to better probe the radio-quiet AGN relationship defined by Shemmer et al. 2006. This behaviour shows harder when brighter X-ray spectra for the low-luminosity AGNs we present here, with some notable exceptions of powerful AGNs, such as NGC 4051, NGC 4385 and NGC 5548.
A correlation is observed for all sources between the X-ray and [O iii] line luminosities, down to 1036 erg s-1, lower than that probed in previous studies (Panessa et al. 2006; Hardcastle et al. 2009). When including upper limits, we find L for the entire sample and LL for the ‘Complete’ sample, but with significant scatter about the best fit lines. This correlation compares favourably with the correlations 1:1 ratio between the X-rays and [O iii] line found in previous studies. However, we note that different AGN types follow slightly different tracks in the X-ray:[O iii] plane, with the LINERs showing the smallest scatter of all classes, suggesting a strong coupling between the two variables.
In conclusion, our sample provides the most statistically-complete and unbiased surveys of accretion in the nearby Universe performed to date, for both ‘active’ and ‘inactive’ galaxies. Further work is ongoing to characterise the off-nuclear X-ray sources, including their timing, spectral and multi-wavelength properties (Pahari et al. in prep) and future work will include establishing the fundamental plane of black hole activity with this data (Saikia et al. 2018b) with the wider LeMMINGs sample (Baldi et al. 2018) at sub-arcsecond resolution and the forthcoming 5 GHz equivalent LeMMINGs -MERLIN study (Williams et al. in prep.).
Data Availability
All of the Chandra X-ray data presented here can be downloaded from the public heasarc archives, noted in the manuscript in Section 2. The values from the fitting procedures, fluxes, luminosities and spectra can be obtained from the online supplementary material.
Acknowledgements
We would like to acknowledge the support of the LeMMINGs project, upon which this study is based. We acknowledge funding from the Mayflower Scholarship from the University of Southampton afforded to David Williams to complete this work. This work was also supported by the Oxford Centre for Astrophysical Surveys, which is funded through generous support from the Hintze Family Charitable Foundation. MP acknowledges Royal Society-SERB Newton International Fellowship support funded jointly by the Royal Society, UK and the Science and Engineering Board of India (SERB) through Newton-Bhabha Fund. IMcH thanks the Royal Society for the award of a Royal Society Leverhulme Trust Senior Research Fellowship. RDB and IMcH also acknowledge the support of STFC under grant [ST/M001326/1]. SM gratefully acknowledges the support from the Chandra grant GO7-18080X issued by the Chandra X-ray Center, which is operated by the Smithsonian Astrophysical Observatory for and on behalf of the National Aeronautics Space Administration under contract NAS8-03060. A.B is grateful to the Royal Society and SERB (Science and Engineering Research Board, India). A.B. is supported by an INSPIRE Faculty grant (DST/INSPIRE/04/2018/001265) by the Department of Science and Technology, Govt. of India. P. G. B. acknowledges financial support from the STFC and the Czech Science Foundation project No. 19- 05599Y. S. A. gratefully acknowledges support from an ERC Adva. nced Grant 789410 J.H.K. acknowledges financial support from the European Union’s Horizon 2020 research and innovation programme under Marie Skłodowska-Curie grant agreement No 721463 to the SUNDIAL ITN network, from the State Research Agency (AEI-MCINN) of the Spanish Ministry of Science and Innovation under the grant "The structure and evolution of galaxies and their central regions" with reference PID2019-105602GB-I00/10.13039/501100011033, and from IAC project P/300724, financed by the Ministry of Science and Innovation, through the State Budget and by the Canary Islands Department of Economy, Knowledge and Employment, through the Regional Budget of the Autonomous Community. B.T.D acknowledges support from a Spanish postdoctoral fellowship ‘Ayudas 1265 para la atracción del talento investigador. Modalidad 2: jóvenes investigadores.’ funded by Comunidad de Madrid under grant number 2016-T2/TIC-2039 and support from grant ‘Ayudas para la realización de proyectos de I+D para jóvenes doctores 2019.’ funded by Comunidad de Madrid and Universidad Complutense de Madrid under grant number PR65/19-22417. AA and MAPT acknowledge support from the Spanish MCIU through grant PGC2018-098915-B-C21. JM acknowledges support from the grant RTI2018-096228-B-C31 (MICIU/FEDER, EU). AA, MAPT and JM acknowledge financial support from the State Agency for Research of the Spanish MCIU through the “Center of Excellence Severo Ochoa” award to the Instituto de Astrofísica de Andalucía (SEV-2017-0709). CGM acknowledges support from Mrs Hiroko and Mr Jim Sherwin. FS acknowledges partial support from a Leverhulme Trust Research Fellowship. We also acknowledge Jodrell Bank Centre for Astrophysics, which is funded by the STFC. -MERLIN and formerly, MERLIN, is a National Facility operated by the University of Manchester at Jodrell Bank Observatory on behalf of STFC. The scientific results reported in this article are based to a significant degree on observations made by the Chandra X-ray Observatory and on data obtained from the Chandra Data Archive. This research has made use of software provided by the Chandra X-ray Center (CXC) in the application package CIAO. DW would also like to thank Sam Connolly, Dimitrios Emmanolopoulos and Sara Motta for useful discussions.
References
- Ajello et al. (2012) Ajello M., Alexander D. M., Greiner J., Madejski G. M., Gehrels N., Burlon D., 2012, ApJ, 749, 21
- Akylas & Georgantopoulos (2009) Akylas A., Georgantopoulos I., 2009, A&A, 500, 999
- Allen et al. (2008) Allen M. G., Groves B. A., Dopita M. A., Sutherland R. S., Kewley L. J., 2008, ApJS, 178, 20
- Anderson & Darling (1954) Anderson T. W., Darling D. A., 1954, Journal of the American Statistical Association, 49, 765
- Arnaud (1996) Arnaud K. A., 1996, in Jacoby G. H., Barnes J., eds, Astronomical Society of the Pacific Conference Series Vol. 101, Astronomical Data Analysis Software and Systems V. p. 17
- Baldi & Capetti (2010) Baldi R. D., Capetti A., 2010, A&A, 519, A48
- Baldi et al. (2018) Baldi R. D., et al., 2018, MNRAS, 476, 3478
- Baldi et al. (2021a) Baldi R. D., et al., 2021a, MNRAS, 500, 4749
- Baldi et al. (2021b) Baldi R. D., et al., 2021b, MNRAS, 508, 2019
- Baldwin et al. (1981) Baldwin J. A., Phillips M. M., Terlevich R., 1981, PASP, 93, 5
- Ballantyne (2014) Ballantyne D. R., 2014, MNRAS, 437, 2845
- Balmaverde & Capetti (2006) Balmaverde B., Capetti A., 2006, A&A, 447, 97
- Balmaverde et al. (2008) Balmaverde B., Baldi R. D., Capetti A., 2008, A&A, 486, 119
- Beswick et al. (2014) Beswick R., Argo M. K., Evans R., McHardy I., Williams D. R. A., Westcott J., 2014, in Proceedings of the 12th European VLBI Network Symposium and Users Meeting (EVN 2014). 7-10 October 2014. Cagliari, Italy.. p. 10
- Boorman et al. (2018) Boorman P. G., Gandhi P., Baloković M., Brightman M., Harrison F., Ricci C., Stern D., 2018, MNRAS, 477, 3775
- Brightman et al. (2017) Brightman M., et al., 2017, doi:10.3847/1538-4357/aa75c9, 844, 10
- Burlon et al. (2011) Burlon D., Ajello M., Greiner J., Comastri A., Merloni A., Gehrels N., 2011, ApJ, 728, 58
- Buttiglione et al. (2010) Buttiglione S., Capetti A., Celotti A., Axon D. J., Chiaberge M., Macchetto F. D., Sparks W. B., 2010, A&A, 509, A6
- Capetti & Baldi (2011) Capetti A., Baldi R. D., 2011, A&A, 529, A126
- Comastri (2004) Comastri A., 2004, Compton-Thick AGN: The Dark Side of the X-Ray Background. p. 245
- Condon (1992) Condon J. J., 1992, ARA&A, 30, 575
- Connolly et al. (2016) Connolly S. D., McHardy I. M., Skipper C. J., Emmanoulopoulos D., 2016, MNRAS, 459, 3963
- Constantin et al. (2009) Constantin A., Green P., Aldcroft T., Kim D.-W., Haggard D., Barkhouse W., Anderson S. F., 2009, ApJ, 705, 1336
- Czerny et al. (2009) Czerny B., Siemiginowska A., Janiuk A., Nikiel-Wroczyński B., Stawarz Ł., 2009, ApJ, 698, 840
- Fabbiano (2006) Fabbiano G., 2006, ARA&A, 44, 323
- Filho et al. (2006) Filho M. E., Barthel P. D., Ho L. C., 2006, A&A, 451, 71
- Filippenko & Sargent (1985) Filippenko A. V., Sargent W. L. W., 1985, ApJS, 57, 503
- Foreman-Mackey (2016) Foreman-Mackey D., 2016, The Journal of Open Source Software, 24
- Fotopoulou et al. (2016) Fotopoulou S., et al., 2016, A&A, 587, A142
- Freeman et al. (2002) Freeman P. E., Kashyap V., Rosner R., Lamb D. Q., 2002, ApJS, 138, 185
- Gandhi et al. (2017) Gandhi P., et al., 2017, MNRAS, 467, 4606
- Gehrels (1986) Gehrels N., 1986, ApJ, 303, 336
- Gilfanov et al. (2004) Gilfanov M., Grimm H.-J., Sunyaev R., 2004, Nuclear Physics B Proceedings Supplements, 132, 369
- González-Martín et al. (2006) González-Martín O., Masegosa J., Márquez I., Guerrero M. A., Dultzin-Hacyan D., 2006, A&A, 460, 45
- González-Martín et al. (2009) González-Martín O., Masegosa J., Márquez I., Guainazzi M., Jiménez-Bailón E., 2009, A&A, 506, 1107
- González-Martín et al. (2015) González-Martín O., et al., 2015, A&A, 578, A74
- Graham & Scott (2013) Graham A. W., Scott N., 2013, ApJ, 764, 151
- Hardcastle et al. (2009) Hardcastle M. J., Evans D. A., Croston J. H., 2009, MNRAS, 396, 1929
- Heckman (1980) Heckman T. M., 1980, A&A, 87, 152
- Hernández-García et al. (2014) Hernández-García L., González-Martín O., Masegosa J., Márquez I., 2014, A&A, 569, A26
- Hernández-García et al. (2016) Hernández-García L., Masegosa J., González-Martín O., Márquez I., Perea J., 2016, ApJ, 824, 7
- Ho (1999a) Ho L. C., 1999a, Advances in Space Research, 23, 813
- Ho (1999b) Ho L. C., 1999b, ApJ, 516, 672
- Ho (2008) Ho L. C., 2008, ARA&A, 46, 475
- Ho & Ulvestad (2001) Ho L. C., Ulvestad J. S., 2001, ApJS, 133, 77
- Ho et al. (1995) Ho L. C., Filippenko A. V., Sargent W. L., 1995, ApJS, 98, 477
- Ho et al. (1997a) Ho L. C., Filippenko A. V., Sargent W. L. W., 1997a, ApJS, 112, 315
- Ho et al. (1997b) Ho L. C., Filippenko A. V., Sargent W. L. W., Peng C. Y., 1997b, ApJS, 112, 391
- Ho et al. (1997c) Ho L. C., Filippenko A. V., Sargent W. L. W., 1997c, ApJ, 487, 568
- Ho et al. (1997d) Ho L. C., Filippenko A. V., Sargent W. L. W., 1997d, ApJ, 487, 591
- Ho et al. (2001) Ho L. C., et al., 2001, ApJ, 549, L51
- Ho et al. (2003) Ho L. C., Filippenko A. V., Sargent W. L. W., 2003, ApJ, 583, 159
- Ho et al. (2009) Ho L. C., Greene J. E., Filippenko A. V., Sargent W. L. W., 2009, ApJS, 183, 1
- Ishibashi & Courvoisier (2010) Ishibashi W., Courvoisier T. J.-L., 2010, A&A, 512, A58
- Kaaret et al. (2017) Kaaret P., Feng H., Roberts T. P., 2017, ARA&A, 55, 303
- Kalberla et al. (2005) Kalberla P. M. W., Burton W. B., Hartmann D., Arnal E. M., Bajaja E., Morras R., Pöppel W. G. L., 2005, A&A, 440, 775
- Kammoun et al. (2019) Kammoun E. S., et al., 2019, ApJ, 877, 102
- Kammoun et al. (2020) Kammoun E. S., et al., 2020, ApJ, 901, 161
- Kaspi et al. (2000) Kaspi S., Smith P. S., Netzer H., Maoz D., Jannuzi B. T., Giveon U., 2000, ApJ, 533, 631
- Kauffmann & Heckman (2009) Kauffmann G., Heckman T. M., 2009, MNRAS, 397, 135
- Kelly (2007) Kelly B. C., 2007, ApJ, 665, 1489
- Kewley et al. (2006) Kewley L. J., Groves B., Kauffmann G., Heckman T., 2006, MNRAS, 372, 961
- King (2004) King A. R., 2004, MNRAS, 347, L18
- Koratkar & Gaskell (1991) Koratkar A. P., Gaskell C. M., 1991, ApJ, 370, L61
- Kormendy & Ho (2013) Kormendy J., Ho L. C., 2013, ARA&A, 51, 511
- LaMassa et al. (2019) LaMassa S. M., Yaqoob T., Boorman P. G., Tzanavaris P., Levenson N. A., Gandhi P., Ptak A. F., Heckman T. M., 2019, ApJ, 887, 173
- Lightman & White (1988) Lightman A. P., White T. R., 1988, ApJ, 335, 57
- Liu (2011) Liu J., 2011, ApJS, 192, 10
- Maoz (2007) Maoz D., 2007, MNRAS, 377, 1696
- Marchesi et al. (2018) Marchesi S., Ajello M., Marcotulli L., Comastri A., Lanzuisi G., Vignali C., 2018, ApJ, 854, 49
- Masini et al. (2019) Masini A., Comastri A., Hickox R. C., Koss M., Civano F., Brigthman M., Brusa M., Lanzuisi G., 2019, ApJ, 882, 83
- Matt et al. (2000) Matt G., Fabian A. C., Guainazzi M., Iwasawa K., Bassani L., Malaguti G., 2000, MNRAS, 318, 173
- Mattila et al. (2018) Mattila S., et al., 2018, Science, 361, 482
- Merloni et al. (2003) Merloni A., Heinz S., di Matteo T., 2003, MNRAS, 345, 1057
- Murphy & Yaqoob (2009) Murphy K. D., Yaqoob T., 2009, MNRAS, 397, 1549
- Muxlow et al. (2010) Muxlow T. W. B., et al., 2010, MNRAS, 404, L109
- Nagao et al. (2002) Nagao T., Murayama T., Shioya Y., Taniguchi Y., 2002, ApJ, 567, 73
- Nandra & Pounds (1994) Nandra K., Pounds K. A., 1994, MNRAS, 268, 405
- Narayan et al. (1997) Narayan R., Kato S., Honma F., 1997, ApJ, 476, 49
- Narayan et al. (1998) Narayan R., Mahadevan R., Quataert E., 1998, in Abramowicz M. A., Björnsson G., Pringle J. E., eds, Theory of Black Hole Accretion Disks. p. 148 (arXiv:astro-ph/9803141)
- Netzer (2019) Netzer H., 2019, MNRAS, 488, 5185
- Oskinova (2005) Oskinova L. M., 2005, MNRAS, 361, 679
- Panessa et al. (2006) Panessa F., Bassani L., Cappi M., Dadina M., Barcons X., Carrera F. J., Ho L. C., Iwasawa K., 2006, A&A, 455, 173
- Panessa et al. (2007) Panessa F., Barcons X., Bassani L., Cappi M., Carrera F. J., Ho L. C., Pellegrini S., 2007, A&A, 467, 519
- Pellegrini (2005) Pellegrini S., 2005, ApJ, 624, 155
- Piconcelli et al. (2005) Piconcelli E., Jimenez-Bailón E., Guainazzi M., Schartel N., Rodríguez-Pascual P. M., Santos-Lleó M., 2005, A&A, 432, 15
- Ptak (2001) Ptak A., 2001, X-ray Astronomy: Stellar Endpoints, AGN, and the Diffuse X-ray Background, 599, 326
- Reynolds (1997) Reynolds C. S., 1997, MNRAS, 286, 513
- Reynolds et al. (1999) Reynolds C. S., Young A. J., Begelman M. C., Fabian A. C., 1999, ApJ, 514, 164
- Ricci et al. (2015) Ricci C., Ueda Y., Koss M. J., Trakhtenbrot B., Bauer F. E., Gandhi P., 2015, ApJ, 815, L13
- Roberts & Warwick (2000) Roberts T. P., Warwick R. S., 2000, MNRAS, 315, 98
- Saikia et al. (2015) Saikia P., Körding E., Falcke H., 2015, MNRAS, 450, 2317
- Saikia et al. (2018a) Saikia P., Körding E., Dibi S., 2018a, MNRAS, 477, 2119
- Saikia et al. (2018b) Saikia P., Körding E., Coppejans D. L., Falcke H., Williams D., Baldi R. D., Mchardy I., Beswick R., 2018b, A&A, 616, A152
- Sarzi et al. (2010) Sarzi M., et al., 2010, MNRAS, 402, 2187
- Sazonov et al. (2008) Sazonov S., Krivonos R., Revnivtsev M., Churazov E., Sunyaev R., 2008, A&A, 482, 517
- Schmidt (1968) Schmidt M., 1968, ApJ, 151, 393
- Seyfert (1941) Seyfert C. K., 1941, PASP, 53, 231
- Shakura & Sunyaev (1973) Shakura N. I., Sunyaev R. A., 1973, A&A, 24, 337
- Shankar et al. (2016) Shankar F., et al., 2016, MNRAS, 460, 3119
- Shankar et al. (2019) Shankar F., et al., 2019, MNRAS, 485, 1278
- She et al. (2017) She R., Ho L. C., Feng H., 2017, ApJ, 835, 223
- Shemmer et al. (2006) Shemmer O., Brandt W. N., Netzer H., Maiolino R., Kaspi S., 2006, ApJ, 646, L29
- Singh et al. (2013) Singh R., et al., 2013, A&A, 558, A43
- Stephens (1974) Stephens M. A., 1974, Journal of the American Statistical Association, 69, 730
- Swartz et al. (2009) Swartz D. A., Tennant A. F., Soria R., 2009, ApJ, 703, 159
- Swartz et al. (2011) Swartz D. A., Soria R., Tennant A. F., Yukita M., 2011, ApJ, 741, 49
- Tremaine et al. (2002) Tremaine S., et al., 2002, ApJ, 574, 740
- Tueller et al. (2008) Tueller J., Mushotzky R. F., Barthelmy S., Cannizzo J. K., Gehrels N., Markwardt C. B., Skinner G. K., Winter L. M., 2008, ApJ, 681, 113
- Ueda et al. (2011) Ueda Y., et al., 2011, PASJ, 63, S937
- Ueda et al. (2014) Ueda Y., Akiyama M., Hasinger G., Miyaji T., Watson M. G., 2014, ApJ, 786, 104
- Weisskopf et al. (2000) Weisskopf M. C., Tananbaum H. D., Van Speybroeck L. P., O’Dell S. L., 2000, in Truemper J. E., Aschenbach B., eds, Society of Photo-Optical Instrumentation Engineers (SPIE) Conference Series Vol. 4012, X-Ray Optics, Instruments, and Missions III. pp 2–16 (arXiv:astro-ph/0004127), doi:10.1117/12.391545
- Zhang et al. (2009) Zhang W. M., Soria R., Zhang S. N., Swartz D. A., Liu J. F., 2009, ApJ, 699, 281
- van den Bosch (2016) van den Bosch R. C. E., 2016, ApJ, 831, 134
7 Online Supplementary Material
| Galaxy | Right | Dec. | Gal. Lat. | Dist | Obs. | Exposure | Sample | Det. | Mass | O[III] | AGN | Hubble |
|---|---|---|---|---|---|---|---|---|---|---|---|---|
| Name | Asc. | || | (Mpc) | ID. | (secs) | Status | Sig. | log(M⊙) | log(Lum.) | Class | Type | |
| (1) | (2) | (3) | (4) | (5) | (6) | (7) | (8) | (9) | (10) | (11) | (12) | (13) |
| NGC7817 | 0.995 | 20.75 | 40.76 | 31.5 | - | - | - | Not obs. | 39.29 | HII | Spi. | |
| IC10 | 5.096 | 59.29 | 3.34 | 1.3 | 8458 | 43571 | - | Undet | 37.13 | HII | Irr. | |
| NGC147 | 8.299 | 48.51 | 14.25 | 0.7 | - | - | - | Not obs. | - | ALG | Ell. | |
| NGC185 | 9.739 | 48.34 | 14.48 | 0.7 | - | - | - | Not obs. | 34.63 | LINER | Ell. | |
| NGC205 | 10.092 | 41.69 | 21.14 | 0.7 | 4691 | 9870 | C | Undet | - | ALG | Ell. | |
| NGC221 | 10.674 | 40.87 | 21.98 | 0.7 | 5690 | 113027 | C | Undet | - | ALG | Ell. | |
| NGC224 | 10.685 | 41.27 | 21.57 | 0.7 | 14196 | 42848 | C | 146.78 | - | ALG | Spi. | |
| NGC266 | 12.449 | 32.28 | 30.59 | 62.4 | 16013 | 84950 | - | 204.06 | 39.43 | LINER | Spi. | |
| NGC278 | 13.018 | 47.55 | 15.32 | 11.8 | 2055 | 38259 | - | 11.87 | 37.47 | HII | Spi. | |
| NGC315 | 14.454 | 30.35 | 32.50 | 65.8 | 4156 | 55016 | - | 33.96 | 39.44 | LINER | Ell. | |
| NGC404 | 17.363 | 35.72 | 27.01 | 2.4 | 12239 | 98257 | - | 89.63 | 37.16 | LINER | Len. | |
| NGC410 | 17.746 | 33.15 | 29.54 | 70.6 | 5897 | 2557 | - | 26.74 | 39.32 | LINER | Ell. | |
| NGC507 | 20.917 | 33.26 | 29.13 | 65.7 | 16354 | 49426 | - | 58.35 | - | ALG | Len. | |
| NGC598 | 23.463 | 30.66 | 31.33 | 0.7 | 7728 | 44380 | - | 280.24 | 34.62 | HII | Spi. | |
| IC1727 | 26.875 | 27.33 | 33.90 | 8.2 | 1634 | 1725 | - | Undet | 37.35 | LINER | Spi. | |
| NGC672 | 26.975 | 27.43 | 33.78 | 7.5 | 10118 | 9859 | - | Undet | 6.15 | 37.66 | HII | Spi. |
| NGC697 | 27.823 | 22.36 | 38.44 | 41.6 | 7090 | 2157 | - | Undet | 37.85 | HII | Spi. | |
| NGC777 | 30.063 | 31.43 | 29.19 | 66.5 | 7101 | 1930 | - | Undet | 38.38 | LINER | Ell. | |
| NGC783 | 30.278 | 31.88 | 28.70 | 68.1 | - | - | - | Not obs. | 38.81 | HII | Spi. | |
| NGC784 | 30.321 | 28.84 | 31.59 | 4.7 | - | - | - | Not obs. | 37.68 | HII | Spi. | |
| NGC812 | 31.715 | 44.57 | 16.26 | 108.8 | - | - | - | Not obs. | 38.68 | HII | Len. | |
| NGC818 | 32.185 | 38.78 | 21.66 | 59.4 | - | - | - | Not obs. | 38.46 | HII | Spi. | |
| NGC841 | 32.822 | 37.50 | 22.71 | 59.5 | - | - | - | Not obs. | 38.74 | LINER | Spi. | |
| NGC890 | 35.504 | 33.27 | 25.89 | 53.4 | 7124 | 3542 | - | Undet | - | ALG | Len. | |
| NGC891 | 35.637 | 42.35 | 17.42 | 9.6 | 5001 | 10038 | - | 14.23 | 36.29 | HII | Spi. | |
| NGC925 | 36.820 | 33.58 | 25.17 | 9.4 | 19325 | 34602 | - | 6.76 | 6.34 | 37.21 | HII | Spi. |
| NGC959 | 38.101 | 35.49 | 23.00 | 10.1 | 4613 | 118879 | - | Undet | 37.40 | HII | Spi. | |
| NGC972 | 38.556 | 29.31 | 28.43 | 21.4 | - | - | - | Not obs. | 38.64 | HII | Spi. | |
| IC239 | 39.116 | 38.97 | 19.50 | 16.8 | 7131 | 4538 | - | Undet | 36.93 | HII | Spi. | |
| NGC1003 | 39.818 | 40.87 | 17.55 | 10.7 | 7116 | 2672 | - | Undet | - | 37.23 | HII | Spi. |
| NGC1023 | 40.100 | 39.06 | 19.09 | 10.5 | 8198 | 49730 | - | 97.11 | - | ALG | Len. | |
| NGC1058 | 40.876 | 37.34 | 20.37 | 9.1 | 9579 | 19452 | - | 15.16 | 35.95 | LINER | Spi. | |
| NGC1156 | 44.928 | 25.24 | 29.19 | 6.4 | 7088 | 1930 | - | Undet | 39.15 | HII | Irr. | |
| NGC1161 | 45.309 | 44.90 | 12.13 | 25.9 | 12958 | 7446 | - | 14.7 | 38.13 | LINER | Len. | |
| NGC1167 | 45.426 | 35.21 | 20.49 | 65.3 | 19313 | 12880 | - | 25.17 | 40.17 | LINER | Len. | |
| NGC1169 | 45.895 | 46.39 | 10.63 | 33.7 | - | - | - | Not obs. | 38.58 | LINER | Spi. | |
| NGC1186 | 46.379 | 42.84 | 13.54 | 35.4 | - | - | - | Not obs. | 38.95 | HII | Spi. | |
| NGC1275 | 49.951 | 41.51 | 13.26 | 70.1 | 4952 | 164246 | - | 205.26 | 41.61 | LINER | Irr. | |
| IC342 | 56.705 | 68.10 | 10.58 | 3.0 | 7069 | 57808 | - | 132.95 | 35.99 | HII | Spi. | |
| IC356 | 61.944 | 69.81 | 13.11 | 18.1 | - | - | - | Not obs. | 37.57 | HII | Spi. | |
| NGC1569 | 67.705 | 64.85 | 11.24 | 1.6 | 782 | 96795 | - | Undet | 36.49 | HII | Irr. | |
| NGC1560 | 68.205 | 71.88 | 16.02 | 3.0 | - | - | - | Not obs. | 37.38 | HII | Spi. | |
| NGC1961 | 85.523 | 69.38 | 19.47 | 53.1 | 10531 | 32835 | - | 32.74 | 39.11 | LINER | Spi. | |
| NGC2146 | 94.657 | 78.36 | 24.90 | 17.2 | 3135 | 10019 | - | 8.84 | 38.36 | HII | Spi. | |
| NGC2273 | 102.536 | 60.85 | 23.31 | 28.4 | 19377 | 9942 | C+Y | 84.06 | 40.43 | Seyfert | Spi. | |
| NGC2342 | 107.326 | 20.64 | 13.04 | 69.5 | - | - | - | Not obs. | 39.71 | HII | Spi. | |
| UGC3714 | 108.136 | 71.75 | 27.30 | 40.9 | - | - | - | Not obs. | 38.49 | HII | Spi. | |
| NGC2268 | 108.579 | 84.38 | 27.55 | 34.4 | - | - | - | Not obs. | 39.26 | HII | Spi. | |
| UGC3828 | 111.150 | 57.97 | 27.04 | 46.8 | 7104 | 2246 | C+Y | Undet | 38.83 | HII | Spi. | |
| NGC2336 | 111.767 | 80.18 | 28.22 | 33.9 | - | - | - | Not obs. | 38.20 | LINER | Spi. | |
| NGC2276 | 111.823 | 85.75 | 27.71 | 36.8 | 4968 | 45573 | - | 3.67 | 38.17 | HII | Spi. | |
| NGC2366 | 112.216 | 69.21 | 28.53 | 2.9 | - | - | - | Not obs. | - | - | HII | Irr. |
| IC467 | 112.577 | 79.87 | 28.38 | 27.4 | - | - | - | Not obs. | 37.15 | HII | Spi. | |
| NGC2300 | 113.091 | 85.71 | 27.81 | 31.0 | 4968 | 45573 | - | 39.02 | - | ALG | Len. | |
| NGC2403 | 114.211 | 65.60 | 29.19 | 4.2 | 4630 | 49936 | - | 151.93 | 35.91 | HII | Spi. | |
| UGC4028 | 117.708 | 74.36 | 30.04 | 52.7 | - | - | - | Not obs. | 38.89 | HII | Spi. | |
| NGC2500 | 120.472 | 50.74 | 31.57 | 10.1 | 7112 | 2573 | C | 3.15 | 36.55 | HII | Spi. | |
| NGC2543 | 123.241 | 36.25 | 31.31 | 32.9 | - | - | - | Not obs. | 38.55 | HII | Spi. | |
| NGC2537 | 123.311 | 45.99 | 32.96 | 9.0 | 19359 | 9945 | C+Y | Undet | 38.72 | HII | Spi. | |
| NGC2541 | 123.668 | 49.06 | 33.48 | 10.6 | 19354 | 7964 | C+Y | 3.21 | 36.80 | HII | Spi. | |
| NGC2549 | 124.743 | 57.80 | 34.24 | 18.8 | 19339 | 9942 | C+Y | 15.18 | - | ALG | Irr. | |
| NGC2639 | 130.909 | 50.21 | 38.19 | 42.6 | 5682 | 5021 | C | 40.84 | 39.60 | LINER | Spi. | |
| NGC2634 | 132.106 | 73.97 | 33.94 | 30.2 | 13005 | 4909 | - | Undet | - | ALG | Ell. | |
| NGC2683 | 133.174 | 33.42 | 38.76 | 5.7 | 11311 | 38530 | - | 58.89 | 37.06 | LINER | Spi. | |
| NGC2681 | 133.386 | 51.31 | 39.68 | 13.3 | 2060 | 80898 | C | 160.3 | 38.37 | LINER | Len. | |
| IC520 | 133.426 | 73.49 | 34.46 | 47.0 | - | - | - | Not obs. | 39.04 | LINER | Spi. | |
| NGC2685 | 133.895 | 58.73 | 38.90 | 16.2 | - | - | C | Not obs. | 38.41 | LINER | Len. | |
| NGC2655 | 133.907 | 78.22 | 32.69 | 24.4 | - | - | - | Not obs. | 39.44 | LINER | Len. | |
| NGC2750 | 136.450 | 25.44 | 39.83 | 38.4 | - | - | - | Not obs. | 39.20 | HII | Spi. | |
| NGC2742 | 136.890 | 60.48 | 39.96 | 22.2 | 19353 | 9780 | C+Y | Undet | 37.73 | HII | Spi. | |
| NGC2715 | 137.026 | 78.09 | 33.32 | 20.4 | - | - | - | Not obs. | 37.79 | HII | Spi. | |
| NGC2770 | 137.391 | 33.12 | 42.20 | 29.6 | 9104 | 17901 | - | Undet | 37.56 | HII | Spi. | |
| NGC2768 | 137.906 | 60.04 | 40.56 | 23.7 | 9528 | 64607 | C | 85.01 | 38.61 | LINER | Ell. | |
| NGC2776 | 138.061 | 44.95 | 43.25 | 38.7 | 19384 | 9939 | C+Y | 7.42 | 38.32 | HII | Spi. | |
| NGC2748 | 138.430 | 76.48 | 34.36 | 23.8 | 11776 | 29670 | - | 8.58 | 37.83 | HII | Spi. | |
| NGC2782 | 138.521 | 40.11 | 43.68 | 37.3 | 3014 | 29584 | C | 112.45 | 39.99 | HII | Spi. | |
| NGC2787 | 139.827 | 69.20 | 38.05 | 13.0 | 4689 | 30848 | - | 147.73 | 38.37 | LINER | Len. | |
| NGC2832 | 139.945 | 33.75 | 44.39 | 91.6 | 5904 | 3011 | - | 3.21 | 39.05 | LINER | Ell. | |
| NGC2841 | 140.508 | 50.98 | 44.15 | 12.0 | 6096 | 28217 | C | 54.21 | 38.19 | LINER | Spi. | |
| NGC2859 | 141.077 | 34.51 | 45.40 | 25.4 | - | - | - | Not obs. | 38.57 | LINER | Len. | |
| NGC2903 | 143.042 | 21.50 | 44.54 | 6.3 | 11260 | 93551 | - | 76.23 | 37.35 | HII | Spi. | |
| NGC2950 | 145.647 | 58.85 | 44.66 | 23.3 | 19338 | 9939 | C+Y | 6.71 | - | ALG | Len. | |
| NGC2964 | 145.726 | 31.85 | 49.02 | 21.9 | - | - | - | Not obs. | 38.71 | HII | Spi. | |
| NGC2977 | 145.945 | 74.86 | 36.79 | 40.9 | - | - | - | Not obs. | 38.20 | HII | Spi. | |
| NGC2976 | 146.814 | 67.92 | 40.90 | 2.1 | 9542 | 9824 | - | 3.05 | 36.58 | HII | Spi. | |
| NGC3003 | 147.150 | 33.42 | 50.34 | 24.4 | - | - | - | Not obs. | 38.90 | HII | Spi. | |
| NGC2985 | 147.593 | 72.28 | 38.68 | 22.4 | 11669 | 13776 | - | 90.18 | 38.69 | LINER | Spi. | |
| NGC3031 | 148.888 | 69.07 | 40.90 | 1.4 | 12301 | 78050 | - | 622.22 | 37.72 | LINER | Spi. | |
| NGC3027 | 148.920 | 72.20 | 39.05 | 19.5 | - | - | - | Not obs. | 37.69 | HII | Spi. | |
| NGC3034 | 148.967 | 69.68 | 40.57 | 5.2 | 10542 | 118614 | - | 110.07 | 38.33 | HII | Irr. | |
| NGC3043 | 149.060 | 59.31 | 46.05 | 39.1 | 19365 | 9939 | C+Y | Undet | 38.08 | HII | Spi. | |
| NGC3073 | 150.218 | 55.62 | 48.25 | 19.3 | 2038 | 26579 | C | Undet | 38.02 | HII | Len. | |
| NGC3079 | 150.494 | 55.68 | 48.36 | 20.4 | 2038 | 26579 | C | 28.31 | 37.67 | LINER | Spi. | |
| NGC3077 | 150.829 | 68.73 | 41.66 | 2.1 | 2076 | 53437 | - | 68.78 | 37.15 | HII | Irr. | |
| NGC3162 | 153.382 | 22.74 | 54.08 | 22.2 | - | - | - | Not obs. | 38.04 | HII | Spi. | |
| NGC3147 | 154.223 | 73.40 | 39.46 | 40.9 | 1615 | 2203 | - | 338.43 | 39.53 | LINER | Spi. | |
| NGC3185 | 154.411 | 21.69 | 54.70 | 21.3 | 2760 | 19814 | - | 11.51 | 39.44 | Seyfert | Len. | |
| NGC3190 | 154.524 | 21.83 | 54.85 | 22.4 | 2760 | 19814 | - | 68.72 | 38.71 | LINER | Spi. | |
| NGC3184 | 154.571 | 41.42 | 55.64 | 8.7 | 804 | 42124 | C | 34.93 | 37.31 | HII | Spi. | |
| NGC3193 | 154.604 | 21.89 | 54.93 | 23.2 | 11360 | 7149 | - | 8.66 | 38.42 | LINER | Ell. | |
| NGC3198 | 154.978 | 45.55 | 54.83 | 10.8 | 9551 | 61625 | C | 30.81 | 36.97 | HII | Spi. | |
| NGC3245 | 156.827 | 28.51 | 58.22 | 22.2 | 2926 | 9635 | - | 31.02 | 38.70 | HII | Len. | |
| IC2574 | 157.090 | 68.41 | 43.61 | 3.4 | 792 | 10038 | - | Undet | 35.55 | HII | Spi. | |
| NGC3254 | 157.333 | 29.49 | 58.75 | 23.6 | - | - | - | Not obs. | 38.60 | Seyfert | Spi. | |
| NGC3294 | 159.068 | 37.32 | 59.84 | 26.7 | - | - | - | Not obs. | 38.33 | HII | Spi. | |
| NGC3301 | 159.233 | 21.88 | 59.05 | 23.3 | - | - | - | Not obs. | 38.30 | LINER | Len. | |
| NGC3310 | 159.691 | 53.50 | 54.06 | 18.7 | 2939 | 47158 | C | 159.06 | 38.43 | HII | Spi. | |
| NGC3319 | 159.790 | 41.69 | 59.34 | 11.5 | 19350 | 9939 | C+Y | 30.77 | 37.07 | HII | Spi. | |
| NGC3344 | 160.880 | 24.92 | 61.25 | 6.1 | 15387 | 47442 | - | 42.61 | 38.24 | HII | Spi. | |
| NGC3359 | 161.654 | 63.22 | 48.59 | 19.2 | 16347 | 49302 | C | Undet | 37.36 | HII | Spi. | |
| NGC3348 | 161.792 | 72.84 | 41.35 | 37.8 | - | - | - | Not obs. | - | ALG | Ell. | |
| NGC3395 | 162.459 | 32.98 | 63.14 | 27.4 | 2042 | 13478 | - | 13.8 | 37.93 | HII | Spi. | |
| NGC3414 | 162.818 | 27.97 | 63.42 | 24.9 | 6779 | 13706 | - | 195.7 | 39.06 | LINER | Len. | |
| NGC3430 | 163.048 | 32.95 | 63.64 | 26.7 | 16821 | 9926 | - | Undet | 37.74 | HII | Spi. | |
| NGC3432 | 163.130 | 36.62 | 63.16 | 7.8 | 7091 | 1930 | - | Undet | 38.00 | HII | Spi. | |
| NGC3448 | 163.662 | 54.31 | 55.45 | 24.5 | 19360 | 9973 | C+Y | 28.32 | 39.48 | HII | Irr. | |
| NGC3486 | 165.100 | 28.97 | 65.49 | 7.4 | 393 | 1757 | - | Undet | 37.93 | Seyfert | Spi. | |
| NGC3504 | 165.797 | 27.97 | 66.04 | 26.5 | - | - | - | Not obs. | 39.88 | HII | Spi. | |
| NGC3516 | 166.698 | 72.57 | 42.40 | 38.9 | 2080 | 73062 | - | 1353.47 | 40.80 | Seyfert | Len. | |
| NGC3556 | 167.880 | 55.68 | 56.25 | 14.1 | 2025 | 59366 | C | 83.27 | 37.62 | HII | Spi. | |
| NGC3583 | 168.546 | 48.32 | 61.63 | 34.0 | 19381 | 9939 | C+Y | 6.34 | 38.26 | HII | Spi. | |
| NGC3600 | 168.967 | 41.59 | 65.68 | 10.5 | 19356 | 6978 | C+Y | 36.78 | 38.21 | HII | Spi. | |
| NGC3610 | 169.606 | 58.79 | 54.46 | 29.2 | 7141 | 4926 | C | 4.07 | - | ALG | Ell. | |
| NGC3613 | 169.652 | 58.00 | 55.10 | 32.9 | 19320 | 9970 | C | Undet | - | ALG | Ell. | |
| NGC3631 | 170.262 | 53.17 | 59.04 | 21.6 | 3951 | 89068 | C | 75.83 | 37.53 | HII | Spi. | |
| NGC3646 | 170.430 | 20.17 | 68.35 | 56.8 | - | - | - | Not obs. | 39.15 | LINER | Irr. | |
| NGC3642 | 170.574 | 59.07 | 54.53 | 27.5 | 19379 | 9780 | C+Y | 38.06 | 38.96 | LINER | Spi. | |
| NGC3652 | 170.663 | 37.77 | 68.54 | 33.5 | - | - | - | Not obs. | 38.51 | HII | Spi. | |
| NGC3665 | 171.182 | 38.76 | 68.49 | 32.4 | 3222 | 17958 | - | 20.66 | 38.28 | HII | Len. | |
| NGC3675 | 171.533 | 43.59 | 66.19 | 12.8 | 19368 | 7967 | C+Y | Undet | 37.78 | LINER | Spi. | |
| NGC3690 | 172.138 | 58.57 | 55.41 | 40.4 | 15077 | 51888 | C | 97.24 | 39.98 | HII | Irr. | |
| UGC6484 | 172.300 | 57.13 | 56.64 | 32.4 | 7111 | 2179 | C+Y | Undet | 37.47 | HII | Spi. | |
| NGC3718 | 173.146 | 53.07 | 60.22 | 17.0 | 3993 | 4912 | C | 405.72 | 37.41 | LINER | Spi. | |
| NGC3726 | 173.338 | 47.03 | 64.88 | 17.0 | 19346 | 9781 | C+Y | Undet | 37.80 | HII | Spi. | |
| NGC3729 | 173.456 | 53.13 | 60.28 | 17.0 | 10356 | 7853 | C | 8.88 | 36.60 | HII | Spi. | |
| NGC3738 | 173.952 | 54.52 | 59.32 | 4.3 | 19357 | 9343 | C+Y | Undet | 37.77 | HII | Irr. | |
| NGC3735 | 173.989 | 70.54 | 45.28 | 41.0 | - | - | - | Not obs. | 39.88 | Seyfert | Spi. | |
| NGC3756 | 174.200 | 54.29 | 59.59 | 23.5 | 19355 | 9936 | C+Y | Undet | 37.04 | HII | Spi. | |
| NGC3780 | 174.844 | 56.27 | 58.12 | 37.2 | 19373 | 9936 | C+Y | Undet | 37.43 | LINER | Spi. | |
| NGC3813 | 175.328 | 36.55 | 72.42 | 26.4 | - | - | - | Not obs. | 37.59 | HII | Spi. | |
| NGC3838 | 176.057 | 57.95 | 56.99 | 24.6 | 19342 | 9936 | C+Y | 7.83 | - | ALG | Len. | |
| NGC3877 | 176.533 | 47.49 | 65.96 | 17.0 | 1972 | 28723 | C | 11.58 | 37.86 | HII | Spi. | |
| NGC3884 | 176.551 | 20.39 | 73.64 | 91.6 | 12999 | 4899 | - | 186.12 | 40.20 | LINER | Len. | |
| NGC3893 | 177.160 | 48.71 | 65.23 | 17.0 | 21091 | 9945 | C+Y | Undet | 37.44 | HII | Spi. | |
| NGC3900 | 177.290 | 27.02 | 76.14 | 29.4 | - | - | - | Not obs. | 38.35 | ALG | Len. | |
| NGC3898 | 177.314 | 56.08 | 58.96 | 21.9 | 4740 | 57443 | C | 52.8 | 38.52 | LINER | Spi. | |
| NGC3917 | 177.690 | 51.82 | 62.79 | 17.0 | 19380 | 9780 | C+Y | Undet | 36.90 | LINER | Spi. | |
| NGC3938 | 178.206 | 44.12 | 69.32 | 17.0 | 18456 | 45529 | C | 11.6 | 37.61 | HII | Spi. | |
| NGC3941 | 178.231 | 36.99 | 74.19 | 18.9 | - | - | - | Not obs. | 38.52 | Seyfert | Len. | |
| NGC3945 | 178.307 | 60.68 | 55.03 | 22.5 | 6780 | 13760 | C | 162.23 | 38.38 | LINER | Len. | |
| NGC3949 | 178.425 | 47.86 | 66.41 | 17.0 | 16990 | 3391 | C | Undet | 37.44 | HII | Spi. | |
| NGC3953 | 178.454 | 52.33 | 62.59 | 17.0 | 19367 | 10735 | C+Y | 7.27 | 37.90 | LINER | Spi. | |
| NGC3963 | 178.746 | 58.49 | 57.12 | 42.7 | 19362 | 8869 | C+Y | 19.01 | 38.09 | HII | Spi. | |
| NGC3982 | 179.118 | 55.12 | 60.27 | 17.0 | 4845 | 9204 | C | 27.6 | 39.83 | Seyfert | Spi. | |
| NGC3992 | 179.400 | 53.38 | 61.92 | 17.0 | 19366 | 9939 | C+Y | 3.41 | 37.10 | LINER | Spi. | |
| NGC3998 | 179.485 | 55.45 | 60.06 | 21.6 | 6781 | 13607 | C | 1817.56 | 39.56 | LINER | Len. | |
| NGC4013 | 179.631 | 43.95 | 70.09 | 17.0 | 4739 | 79100 | C | 84.77 | 37.37 | LINER | Spi. | |
| NGC4026 | 179.855 | 50.96 | 64.20 | 17.0 | 6782 | 13772 | C | 10.82 | - | LINER | Len. | |
| NGC4036 | 180.361 | 61.90 | 54.25 | 24.6 | 6783 | 13723 | C | 54.81 | 39.16 | LINER | Len. | |
| NGC4041 | 180.551 | 62.14 | 54.05 | 22.7 | 19383 | 9939 | C+Y | 5.86 | 38.24 | HII | Spi. | |
| NGC4051 | 180.790 | 44.53 | 70.09 | 17.0 | 859 | 79769 | C | 1158.28 | 40.18 | Seyfert | Spi. | |
| NGC4062 | 181.016 | 31.90 | 78.65 | 9.7 | 7106 | 2186 | - | Undet | 36.51 | HII | Spi. | |
| NGC4088 | 181.390 | 50.54 | 65.01 | 17.0 | 14442 | 19806 | C | 12.55 | 37.48 | HII | Spi. | |
| NGC4096 | 181.505 | 47.48 | 67.79 | 8.8 | 19345 | 7964 | C+Y | 3.55 | 36.15 | HII | Spi. | |
| NGC4100 | 181.536 | 49.58 | 65.92 | 17.0 | 19347 | 9936 | C+Y | Undet | 37.95 | HII | Spi. | |
| NGC4102 | 181.596 | 52.71 | 63.07 | 17.0 | 17117 | 28995 | C | 264.99 | 39.10 | HII | Spi. | |
| NGC4111 | 181.763 | 43.07 | 71.70 | 17.0 | 1578 | 9340 | C | 62.38 | 38.65 | LINER | Len. | |
| NGC4125 | 182.026 | 65.17 | 51.34 | 24.2 | 2071 | 64234 | - | 39.39 | 38.71 | LINER | Ell. | |
| NGC4136 | 182.324 | 29.93 | 80.33 | 9.7 | 2921 | 19709 | - | 5.9 | 37.39 | HII | Spi. | |
| NGC4138 | 182.374 | 43.69 | 71.40 | 17.0 | 17118 | 27779 | C | 416.37 | 38.75 | LINER | Len. | |
| NGC4143 | 182.400 | 42.53 | 72.40 | 17.0 | 1617 | 2515 | C | 71.08 | 38.81 | LINER | Len. | |
| NGC4144 | 182.494 | 46.46 | 69.01 | 4.1 | 16991 | 1051 | C | Undet | 6.15 | 36.27 | HII | Spi. |
| NGC4145 | 182.506 | 39.88 | 74.62 | 20.7 | - | - | - | Not obs. | 36.80 | HII | Spi. | |
| NGC4151 | 182.636 | 39.41 | 75.06 | 20.3 | 9217 | 117122 | - | 2440.54 | 41.74 | Seyfert | Spi. | |
| NGC4150 | 182.640 | 30.40 | 80.47 | 9.7 | 1638 | 1738 | - | Undet | 35.83 | LINER | Len. | |
| NGC4157 | 182.767 | 50.48 | 65.41 | 17.0 | 11310 | 59256 | C | 22.85 | 36.96 | HII | Spi. | |
| NGC4162 | 182.969 | 24.12 | 80.59 | 38.5 | - | - | - | Not obs. | 38.44 | HII | Spi. | |
| NGC4169 | 183.078 | 29.18 | 81.14 | 50.4 | - | - | - | Not obs. | 38.99 | Seyfert | Len. | |
| NGC4183 | 183.320 | 43.70 | 71.73 | 17.0 | 16992 | 4111 | C | Undet | 37.90 | HII | Spi. | |
| NGC4203 | 183.771 | 33.20 | 80.08 | 9.7 | 10535 | 41633 | - | 985.94 | 38.28 | LINER | Len. | |
| NGC4214 | 183.913 | 36.33 | 78.07 | 3.5 | 4743 | 27209 | - | Undet | 38.71 | HII | Irr. | |
| NGC4217 | 183.962 | 47.09 | 68.85 | 17.0 | 4738 | 72729 | C | 23.74 | 36.93 | HII | Spi. | |
| NGC4220 | 184.049 | 47.88 | 68.13 | 17.0 | 19378 | 9663 | C+Y | 7.48 | 36.19 | LINER | Len. | |
| NGC4236 | 184.174 | 69.47 | 47.36 | 2.2 | 9543 | 11014 | - | Undet | 6.11 | 36.24 | HII | Spi. |
| NGC4244 | 184.374 | 37.81 | 77.16 | 3.1 | 942 | 49215 | - | Undet | 36.05 | HII | Spi. | |
| NGC4242 | 184.376 | 45.62 | 70.32 | 7.5 | 19351 | 9939 | C+Y | Undet | - | 36.30 | HII | Spi. |
| NGC4245 | 184.403 | 29.61 | 82.16 | 9.7 | 7107 | 2186 | - | Undet | 37.36 | HII | Len. | |
| NGC4251 | 184.535 | 28.18 | 82.55 | 9.7 | 4695 | 10047 | - | Undet | - | ALG | Len. | |
| NGC4258 | 184.740 | 47.30 | 68.84 | 6.8 | 1618 | 20944 | C | 405.77 | 38.76 | Seyfert | Spi. | |
| NGC4274 | 184.961 | 29.61 | 82.62 | 9.7 | 7108 | 1907 | - | Undet | 38.49 | LINER | Spi. | |
| NGC4278 | 185.028 | 29.28 | 82.77 | 9.7 | 7081 | 110726 | - | 575.27 | 38.88 | LINER | Ell. | |
| NGC4291 | 185.074 | 75.37 | 41.60 | 29.4 | 11778 | 29782 | - | 16.24 | - | ALG | Ell. | |
| NGC4314 | 185.633 | 29.90 | 83.08 | 9.7 | 2062 | 16073 | - | 6.5 | 37.75 | LINER | Spi. | |
| NGC4346 | 185.867 | 46.99 | 69.39 | 17.0 | 19374 | 9942 | C+Y | 5.47 | 37.88 | LINER | Len. | |
| NGC4369 | 186.151 | 39.38 | 76.53 | 21.6 | - | - | - | Not obs. | 38.83 | HII | Spi. | |
| NGC4395 | 186.454 | 33.55 | 81.53 | 3.6 | 5302 | 28226 | - | 653.73 | 38.35 | Seyfert | Spi. | |
| NGC4414 | 186.613 | 31.22 | 83.18 | 9.7 | 14796 | 9938 | - | 10.63 | 36.46 | LINER | Spi. | |
| NGC4449 | 187.046 | 44.09 | 72.40 | 3.0 | 10875 | 59389 | C | 22.96 | 38.28 | HII | Irr. | |
| NGC4448 | 187.064 | 28.62 | 84.67 | 9.7 | 7110 | 1990 | - | Undet | 37.34 | HII | Spi. | |
| NGC4460 | 187.190 | 44.86 | 71.69 | 8.1 | 19363 | 10084 | C+Y | Undet | 38.09 | HII | Len. | |
| NGC4485 | 187.630 | 41.70 | 74.81 | 9.3 | 4726 | 39632 | C | 377.8 | 36.95 | HII | Irr. | |
| NGC4490 | 187.653 | 41.64 | 74.87 | 7.8 | 4726 | 39632 | C | 319.79 | 37.12 | HII | Spi. | |
| NGC4494 | 187.850 | 25.77 | 85.32 | 9.7 | 2079 | 24841 | - | 123.47 | 37.35 | LINER | Ell. | |
| NGC4559 | 188.991 | 27.96 | 86.47 | 9.7 | 2026 | 9376 | - | 21.08 | 37.00 | HII | Spi. | |
| NGC4565 | 189.088 | 25.99 | 86.44 | 9.7 | 3950 | 59203 | - | 402.44 | 38.22 | Seyfert | Spi. | |
| NGC4589 | 189.354 | 74.19 | 42.90 | 30.0 | 6785 | 13773 | - | 21.29 | 38.78 | LINER | Ell. | |
| NGC4605 | 189.997 | 61.61 | 55.47 | 4.0 | 19344 | 9675 | C+Y | 3.05 | 36.63 | HII | Spi. | |
| NGC4618 | 190.387 | 41.15 | 75.83 | 7.3 | 7147 | 9312 | C | Undet | 5.86 | 37.97 | HII | Spi. |
| NGC4648 | 190.435 | 74.42 | 42.69 | 27.5 | 11362 | 10906 | - | 7.65 | - | ALG | Ell. | |
| NGC4631 | 190.532 | 32.54 | 84.22 | 6.9 | 797 | 59215 | - | Undet | 6.34 | 37.12 | HII | Spi. |
| NGC4656 | 190.990 | 32.17 | 84.70 | 7.2 | - | - | - | Not obs. | 37.94 | HII | Spi. | |
| NGC4750 | 192.530 | 72.87 | 44.25 | 26.1 | 4020 | 4934 | - | 59.93 | 38.76 | LINER | Spi. | |
| NGC4725 | 192.611 | 25.50 | 88.36 | 12.4 | 2976 | 24646 | - | 62.2 | 38.52 | Seyfert | Spi. | |
| NGC4736 | 192.719 | 41.12 | 76.01 | 4.3 | 808 | 47369 | C | 241.51 | 37.33 | LINER | Spi. | |
| NGC4800 | 193.657 | 46.53 | 70.59 | 15.2 | 19385 | 9939 | C+Y | 8.3 | 37.62 | HII | Spi. | |
| NGC4793 | 193.670 | 28.94 | 88.05 | 38.9 | - | - | - | Not obs. | 38.84 | HII | Spi. | |
| NGC4826 | 194.183 | 21.68 | 84.42 | 4.1 | 9545 | 25958 | - | 34.25 | 37.92 | LINER | Spi. | |
| NGC4914 | 195.179 | 37.32 | 79.63 | 62.4 | 18037 | 6268 | - | Undet | - | ALG | Ell. | |
| NGC5005 | 197.734 | 37.06 | 79.25 | 21.3 | 19364 | 9942 | - | 74.58 | 39.41 | LINER | Spi. | |
| NGC5012 | 197.904 | 22.92 | 83.78 | 40.4 | - | - | - | Not obs. | 38.59 | LINER | Spi. | |
| NGC5033 | 198.365 | 36.59 | 79.45 | 18.7 | 19343 | 10140 | - | 1143.3 | 39.34 | LINER | Spi. | |
| NGC5055 | 198.955 | 42.03 | 74.29 | 7.2 | 4021 | 4902 | C | 58 | 37.43 | LINER | Spi. | |
| NGC5112 | 200.485 | 38.73 | 76.76 | 20.5 | - | - | - | Not obs. | 37.42 | HII | Spi. | |
| NGC5204 | 202.402 | 58.42 | 58.01 | 4.8 | 13814 | 189851 | C | Undet | 36.58 | HII | Spi. | |
| NGC5194 | 202.468 | 47.19 | 68.56 | 7.7 | 2197 | 27996 | C | 165.74 | 38.91 | Seyfert | Spi. | |
| NGC5195 | 202.497 | 47.27 | 68.49 | 9.3 | 2882 | 43632 | C | 45.28 | 37.84 | LINER | Irr. | |
| NGC5273 | 205.535 | 35.65 | 76.25 | 21.3 | 13814 | 189851 | - | 46.83 | 39.83 | Seyfert | Len. | |
| NGC5297 | 206.599 | 43.87 | 69.93 | 37.8 | 3933 | 46230 | C+Y | Undet | 38.23 | LINER | Spi. | |
| NGC5308 | 206.752 | 60.97 | 54.88 | 32.4 | 415 | 1734 | C+Y | 4.97 | - | ALG | Len. | |
| NGC5322 | 207.313 | 60.19 | 55.49 | 31.6 | 19370 | 9945 | C | 21.35 | 38.20 | LINER | Ell. | |
| NGC5354 | 208.361 | 40.30 | 71.62 | 32.8 | 6787 | 13767 | C | 20.07 | 38.61 | LINER | Len. | |
| NGC5353 | 208.361 | 40.28 | 71.63 | 37.8 | 19341 | 9939 | C | 20.07 | 38.74 | LINER | Len. | |
| NGC5371 | 208.917 | 40.46 | 71.20 | 37.8 | 14903 | 40269 | C | 3.95 | 39.04 | LINER | Spi. | |
| NGC5377 | 209.069 | 47.24 | 66.21 | 31.0 | 14903 | 40269 | C+Y | 6.22 | 38.81 | LINER | Spi. | |
| NGC5383 | 209.271 | 41.85 | 70.08 | 37.8 | 13006 | 5392 | C+Y | Undet | 38.06 | HII | Spi. | |
| NGC5395 | 209.658 | 37.42 | 72.50 | 46.7 | 19372 | 9939 | - | 29.73 | 38.66 | LINER | Spi. | |
| NGC5448 | 210.709 | 49.17 | 64.01 | 32.6 | 13007 | 4902 | C+Y | 13.2 | 38.55 | LINER | Spi. | |
| NGC5457 | 210.802 | 54.35 | 59.77 | 5.4 | 10395 | 15654 | C | 97.3 | 36.99 | HII | Spi. | |
| NGC5473 | 211.180 | 54.89 | 59.20 | 33.0 | 19322 | 9821 | C | 3.37 | - | ALG | Len. | |
| NGC5474 | 211.256 | 53.66 | 60.19 | 6.0 | 19371 | 9936 | C | 88.09 | 37.35 | HII | Spi. | |
| NGC5485 | 211.797 | 55.00 | 58.91 | 32.8 | 4736 | 77353 | C+Y | 7.28 | 38.31 | LINER | Len. | |
| NGC5523 | 213.718 | 25.32 | 71.22 | 21.5 | - | - | - | Not obs. | 37.24 | HII | Spi. | |
| NGC5548 | 214.498 | 25.14 | 70.50 | 67.0 | 9546 | 29788 | - | 1886 | 41.60 | Seyfert | Len. | |
| NGC5557 | 214.607 | 36.49 | 69.35 | 42.6 | 19375 | 9939 | - | Undet | - | ALG | Ell. | |
| NGC5585 | 214.951 | 56.73 | 56.47 | 7.0 | 3046 | 151411 | C+Y | Undet | 37.68 | HII | Spi. | |
| NGC5631 | 216.639 | 56.58 | 56.01 | 32.7 | 19324 | 8838 | C+Y | 8.37 | 38.76 | LINER | Len. | |
| NGC5660 | 217.457 | 49.62 | 60.64 | 37.2 | 7150 | 5318 | C+Y | Undet | 38.10 | HII | Spi. | |
| NGC5656 | 217.606 | 35.32 | 67.38 | 42.6 | - | - | - | Not obs. | 37.99 | LINER | Spi. | |
| NGC5678 | 218.023 | 57.92 | 54.50 | 35.6 | 19361 | 9942 | C+Y | Undet | 38.27 | HII | Spi. | |
| NGC5676 | 218.197 | 49.46 | 60.39 | 34.5 | 19376 | 9939 | C+Y | 7.55 | 37.95 | HII | Spi. | |
| NGC5866 | 226.623 | 55.76 | 52.49 | 15.3 | 19352 | 9939 | C | 9.67 | 37.50 | LINER | Len. | |
| NGC5879 | 227.445 | 57.00 | 51.40 | 16.8 | 4022 | 4733 | C | 28.58 | 37.89 | LINER | Spi. | |
| NGC5905 | 228.847 | 55.52 | 51.59 | 44.4 | 2879 | 33737 | C | 20.45 | 39.02 | HII | Spi. | |
| NGC5907 | 228.974 | 56.33 | 51.09 | 14.9 | 2241 | 88988 | C | 9.74 | 36.89 | HII | Spi. | |
| NGC5982 | 234.666 | 59.36 | 46.92 | 38.7 | 20830 | 51271 | C | 18.77 | 38.54 | ALG | Ell. | |
| NGC5985 | 234.903 | 59.33 | 46.83 | 39.2 | 786 | 46262 | C+Y | 50.78 | 38.76 | LINER | Spi. | |
| NGC6015 | 237.855 | 62.31 | 44.12 | 17.5 | 20069 | 22751 | C+Y | 5.01 | 37.19 | HII | Spi. | |
| NGC6140 | 245.242 | 65.39 | 39.85 | 18.6 | - | - | - | Not obs. | 37.52 | HII | Spi. | |
| NGC6217 | 248.163 | 78.20 | 33.36 | 23.9 | - | - | - | Not obs. | 39.25 | HII | Spi. | |
| NGC6207 | 250.766 | 36.83 | 40.68 | 17.4 | - | - | - | Not obs. | 38.30 | HII | Spi. | |
| NGC6236 | 251.143 | 70.78 | 35.77 | 23.3 | - | - | - | Not obs. | 37.93 | HII | Spi. | |
| NGC6340 | 257.605 | 72.30 | 33.36 | 22.0 | - | - | - | Not obs. | 38.31 | LINER | Len. | |
| NGC6412 | 262.404 | 75.70 | 31.24 | 23.5 | - | - | - | Not obs. | 37.59 | HII | Spi. | |
| NGC6503 | 267.360 | 70.14 | 30.64 | 6.1 | 19349 | 9942 | - | 6.45 | - | LINER | Spi. | |
| NGC6482 | 267.954 | 23.07 | 22.91 | 52.3 | 19369 | 9935 | - | 72.15 | - | LINER | Ell. | |
| NGC6643 | 274.943 | 74.57 | 28.17 | 25.5 | 3218 | 19350 | - | 3.28 | 37.52 | HII | Spi. | |
| NGC6654 | 276.033 | 73.18 | 27.85 | 29.5 | - | - | - | Not obs. | - | ALG | Len. | |
| NGC6689 | 278.708 | 70.52 | 26.83 | 12.2 | 872 | 13190 | - | Undet | 37.17 | LINER | Spi. | |
| NGC6702 | 281.740 | 45.71 | 19.79 | 62.8 | - | - | - | Not obs. | - | ALG | Ell. | |
| NGC6703 | 281.829 | 45.55 | 19.68 | 35.9 | - | - | - | Not obs. | 38.46 | LINER | Len. | |
| NGC6946 | 308.714 | 60.16 | 11.67 | 5.5 | 7123 | 3478 | - | Undet | 37.03 | HII | Spi. | |
| NGC6951 | 309.310 | 66.11 | 14.85 | 24.1 | - | - | - | Not obs. | 38.69 | LINER | Spi. | |
| NGC7080 | 322.509 | 26.72 | 17.59 | 64.1 | - | - | - | Not obs. | - | HII | Spi. | |
| NGC7217 | 331.969 | 31.36 | 19.71 | 16.0 | - | - | - | Not obs. | 38.31 | LINER | Spi. | |
| NGC7331 | 339.268 | 34.42 | 20.72 | 14.3 | 1043 | 58290 | - | 26.87 | 38.30 | LINER | Spi. | |
| NGC7332 | 339.352 | 23.80 | 29.67 | 18.2 | - | - | - | Not obs. | - | ALG | Len. | |
| NGC7457 | 345.250 | 30.14 | 26.94 | 12.3 | 15046 | 14778 | - | Undet | - | ALG | Len. | |
| NGC7640 | 350.527 | 40.85 | 18.94 | 8.6 | 2198 | 29462 | - | 8.38 | 36.83 | HII | Spi. | |
| NGC7741 | 355.978 | 26.08 | 34.37 | 12.3 | 11786 | 28672 | - | Undet | 37.90 | HII | Spi. | |
| NGC7798 | 359.857 | 20.75 | 40.49 | 32.6 | - | - | - | Not obs. | 38.65 | HII | Spi. |
| Galaxy | Detection | log Flux | log Flux | log Flux | log Lum. | log Lum. | log Lum. |
|---|---|---|---|---|---|---|---|
| Name | Signif. | 0.3–10 keV | 0.3–2 keV | 2–10 keV | 0.3–10 keV | 0.3–2 keV | 2–10 keV |
| erg s-1 cm-2 | erg s-1 cm-2 | erg s-1 cm-2 | erg s-1 | erg s-1 | erg s-1 | ||
| (1) | (2) | (3) | (4) | (5) | (6) | (7) | (8) |
| IC 10 | < | -13.92 | - | - | 36.38 | - | - |
| NGC 205 | < | -14.00 | - | - | 35.77 | - | - |
| NGC 221 | < | -14.24 | - | - | 35.53 | - | - |
| NGC 224 | 146.78 | -12.590.05 | -12.770.10 | -13.040.10 | 37.180.05 | 37.000.10 | 36.730.10 |
| NGC 266 | 204.06 | -12.810.06 | -13.280.10 | -12.990.10 | 40.860.06 | 40.390.10 | 40.680.10 |
| NGC 278 | 11.87 | -14.180.10 | -14.290.11 | -14.800.20 | 38.050.10 | 37.930.11 | 37.420.20 |
| NGC 315 | 33.96 | -11.860.03 | -12.580.04 | -11.950.04 | 41.860.03 | 41.130.04 | 41.770.04 |
| NGC 404 | 89.63 | -13.530.07 | -13.710.16 | -14.000.16 | 37.310.07 | 37.130.16 | 36.840.16 |
| NGC 410 | 26.74 | -12.210.06 | -12.350.03 | -12.770.28 | 41.570.06 | 41.430.03 | 41.000.28 |
| NGC 507 | 58.35 | -12.950.02 | -12.980.02 | -14.080.02 | 40.760.02 | 40.730.02 | 39.630.02 |
| NGC 598 | 280.24 | -13.510.12 | -13.580.33 | -14.320.33 | 36.260.12 | 36.180.33 | 35.440.33 |
| IC 1727 | < | -14.02 | - | - | 37.88 | - | - |
| NGC 672 | < | -13.39 | - | - | 38.43 | - | - |
| NGC 697 | < | -12.37 | - | - | 40.95 | - | - |
| NGC 777 | < | -12.95 | - | - | 40.77 | - | - |
| NGC 890 | < | -13.34 | - | - | 40.19 | - | - |
| NGC 891 | 14.23 | -13.130.04 | -14.000.03 | -13.190.04 | 38.910.04 | 38.040.03 | 38.850.04 |
| NGC 925 | 6.76 | -13.840.27 | -14.290.41 | -14.040.41 | 38.180.27 | 37.740.41 | 37.980.41 |
| NGC 959 | < | -14.04 | - | - | 38.04 | - | - |
| IC 239 | < | -14.37 | - | - | 38.15 | - | - |
| NGC 1003 | < | -14.06 | - | - | 38.08 | - | - |
| NGC 1023 | 97.11 | -13.070.08 | -13.420.14 | -13.330.14 | 39.050.08 | 38.700.14 | 38.790.14 |
| NGC 1058 | 15.16 | -13.650.20 | -13.710.19 | -14.530.19 | 38.350.20 | 38.290.19 | 37.470.19 |
| NGC 1156 | < | -14.00 | - | - | 37.69 | - | - |
| NGC 1161 | 14.7 | -12.880.06 | -13.250.07 | -13.110.08 | 40.020.06 | 39.660.07 | 39.790.08 |
| NGC 1167 | 25.17 | -13.250.21 | -13.530.45 | -13.590.45 | 40.450.21 | 40.180.45 | 40.120.45 |
| NGC 1275 | 205.26 | -11.400.02 | -12.510.02 | -11.430.02 | 42.370.02 | 41.260.02 | 42.340.02 |
| IC 342 | 132.95 | -12.610.05 | -12.900.09 | -12.910.09 | 38.430.05 | 38.130.09 | 38.120.09 |
| NGC 1569 | < | -14.87 | - | - | 35.62 | - | - |
| NGC 1961 | 32.74 | -13.100.15 | -13.630.22 | -13.250.22 | 40.430.15 | 39.900.22 | 40.270.22 |
| NGC 2146 | 8.84 | -12.170.29 | -13.810.30 | -12.180.30 | 40.380.29 | 38.740.30 | 40.370.30 |
| NGC 2273 | 84.06 | -12.080.16 | -13.560.17 | -12.100.17 | 40.900.16 | 39.430.17 | 40.890.17 |
| UGC 3828 | < | -12.13 | - | - | 41.29 | - | - |
| NGC 2276 | 3.67 | -13.770.14 | -13.880.34 | -14.430.34 | 39.440.14 | 39.330.34 | 38.780.34 |
| NGC 2300 | 39.02 | -12.930.10 | -12.940.10 | -14.410.19 | 40.140.10 | 40.120.10 | 38.650.19 |
| NGC 2403 | 151.93 | -12.750.05 | -13.110.03 | -12.990.08 | 38.580.05 | 38.210.03 | 38.340.08 |
| NGC 2500 | 3.15 | -13.660.22 | -13.910.22 | -13.990.22 | 38.430.22 | 38.180.22 | 38.100.22 |
| NGC 2537 | < | -12.40 | - | - | 39.58 | - | - |
| NGC 2541 | 3.21 | -14.030.67 | -14.430.67 | -14.250.67 | 38.100.67 | 37.700.67 | 37.870.67 |
| NGC 2549 | 15.18 | -13.110.29 | -13.840.35 | -13.190.35 | 39.520.29 | 38.780.35 | 39.430.35 |
| NGC 2639 | 40.84 | -12.280.22 | -12.300.32 | -13.610.32 | 41.050.22 | 41.030.32 | 39.720.32 |
| NGC 2634 | < | -13.43 | - | - | 39.61 | - | - |
| NGC 2683 | 58.89 | -12.200.04 | -13.960.18 | -12.210.04 | 39.390.04 | 37.630.18 | 39.380.04 |
| NGC 2681 | 160.3 | -13.110.06 | -13.340.12 | -13.490.12 | 39.220.06 | 38.980.12 | 38.840.12 |
| NGC 2742 | < | -14.52 | - | - | 38.25 | - | - |
| NGC 2770 | < | -14.68 | - | - | 38.34 | - | - |
| NGC 2768 | 85.01 | -13.000.12 | -13.670.15 | -13.100.15 | 39.830.12 | 39.160.15 | 39.730.15 |
| NGC 2776 | 7.42 | -14.140.20 | -14.200.20 | -15.020.20 | 39.110.20 | 39.050.20 | 38.230.20 |
| NGC 2748 | 8.58 | -14.420.20 | -14.800.18 | -14.660.25 | 38.410.20 | 38.030.18 | 38.180.25 |
| NGC 2782 | 112.45 | -12.430.02 | -13.140.02 | -12.530.02 | 40.790.02 | 40.080.02 | 40.690.02 |
| NGC 2787 | 147.73 | -12.870.11 | -13.230.17 | -13.110.17 | 39.440.11 | 39.080.17 | 39.200.17 |
| NGC 2832 | 3.21 | -12.220.08 | -12.310.09 | -12.950.18 | 41.780.08 | 41.690.09 | 41.060.18 |
| NGC 2841 | 54.21 | -13.040.05 | -13.380.03 | -13.300.10 | 39.200.05 | 38.860.03 | 38.940.10 |
| NGC 2903 | 76.23 | -12.990.02 | -13.320.02 | -13.270.04 | 38.680.02 | 38.360.02 | 38.400.04 |
| NGC 2950 | 6.71 | -13.550.30 | -13.620.28 | -14.380.28 | 39.260.30 | 39.190.28 | 38.440.28 |
| NGC 2976 | 3.05 | -14.230.40 | -14.290.38 | -15.110.38 | 36.490.40 | 36.430.38 | 35.610.38 |
| NGC 2985 | 90.18 | -12.970.14 | -13.240.28 | -13.300.28 | 39.810.14 | 39.540.28 | 39.480.28 |
| NGC 3031 | 622.22 | -11.160.01 | -12.010.01 | -11.220.01 | 39.210.01 | 38.360.01 | 39.150.01 |
| NGC 3034 | 110.07 | -12.260.01 | -12.800.01 | -12.410.02 | 39.250.01 | 38.710.01 | 39.100.02 |
| NGC 3043 | < | -14.53 | - | - | 38.74 | - | - |
| NGC 3073 | < | -14.23 | - | - | 38.42 | - | - |
| NGC 3079 | 28.31 | -12.600.14 | -13.530.16 | -12.650.16 | 40.100.14 | 39.170.16 | 40.050.16 |
| NGC 3077 | 68.78 | -13.090.03 | -14.030.05 | -13.150.04 | 37.630.03 | 36.690.05 | 37.580.04 |
| NGC 3147 | 338.43 | -11.240.07 | -11.810.09 | -11.380.09 | 42.060.07 | 41.490.09 | 41.920.09 |
| NGC 3185 | 11.51 | -12.800.24 | -13.700.08 | -12.850.33 | 39.930.24 | 39.030.08 | 39.890.33 |
| NGC 3190 | 68.72 | -12.520.06 | -12.960.07 | -12.710.10 | 40.260.06 | 39.810.07 | 40.070.10 |
| NGC 3184 | 34.93 | -13.490.21 | -13.930.29 | -13.690.29 | 38.470.21 | 38.030.29 | 38.270.29 |
| NGC 3193 | 8.66 | -13.230.23 | -13.300.21 | -14.040.21 | 39.580.23 | 39.510.21 | 38.760.21 |
| NGC 3198 | 30.81 | -13.480.24 | -14.240.28 | -13.570.28 | 38.660.24 | 37.910.28 | 38.580.28 |
| NGC 3245 | 31.02 | -13.050.17 | -13.380.27 | -13.320.27 | 39.720.17 | 39.390.27 | 39.450.27 |
| IC 2574 | < | -14.59 | - | - | 36.55 | - | - |
| NGC 3310 | 159.06 | -12.470.09 | -13.210.11 | -12.560.11 | 40.150.09 | 39.410.11 | 40.060.11 |
| NGC 3319 | 30.77 | -12.880.31 | -13.390.47 | -13.040.47 | 39.320.31 | 38.810.47 | 39.160.47 |
| NGC 3344 | 42.61 | -13.180.05 | -13.500.07 | -13.460.11 | 38.470.05 | 38.150.07 | 38.190.11 |
| NGC 3359 | < | -14.76 | - | - | 37.88 | - | - |
| NGC 3395 | 13.8 | -13.240.13 | -13.390.05 | -13.740.50 | 39.720.13 | 39.560.05 | 39.210.50 |
| NGC 3414 | 195.7 | -12.250.09 | -12.790.13 | -12.390.13 | 40.620.09 | 40.080.13 | 40.480.13 |
| NGC 3430 | < | -14.24 | - | - | 38.69 | - | - |
| NGC 3432 | < | -13.96 | - | - | 37.90 | - | - |
| NGC 3448 | 28.32 | -12.930.09 | -13.810.08 | -12.990.10 | 39.930.09 | 39.050.08 | 39.870.10 |
| NGC 3486 | < | -14.31 | - | - | 37.50 | - | - |
| NGC 3516 | 1353.47 | -10.720.02 | -11.710.02 | -10.770.02 | 42.530.02 | 41.550.02 | 42.490.02 |
| NGC 3556 | 83.27 | -13.090.12 | -13.740.15 | -13.190.15 | 39.290.12 | 38.630.15 | 39.180.15 |
| NGC 3583 | 6.34 | -13.400.24 | -13.650.46 | -13.760.46 | 39.740.24 | 39.500.46 | 39.380.46 |
| NGC 3600 | 36.78 | -12.800.21 | -13.270.33 | -12.980.33 | 39.320.21 | 38.850.33 | 39.140.33 |
| NGC 3610 | 4.07 | -13.440.22 | -13.500.21 | -14.320.21 | 39.570.22 | 39.510.21 | 38.690.21 |
| NGC 3613 | < | -14.50 | - | - | 38.61 | - | - |
| NGC 3631 | 75.83 | -13.290.11 | -13.650.19 | -13.540.19 | 39.460.11 | 39.090.19 | 39.210.19 |
| NGC 3642 | 38.06 | -12.770.28 | -12.830.37 | -13.640.37 | 40.190.28 | 40.120.37 | 39.320.37 |
| NGC 3665 | 20.66 | -13.120.32 | -13.840.39 | -13.210.39 | 39.980.32 | 39.260.39 | 39.890.39 |
| NGC 3675 | < | -13.90 | - | - | 38.39 | - | - |
| NGC 3690 | 97.24 | -12.290.06 | -13.030.08 | -12.380.08 | 41.000.06 | 40.260.08 | 40.910.08 |
| UGC 6484 | < | -14.77 | - | - | 38.33 | - | - |
| NGC 3718 | 405.72 | -11.280.09 | -12.320.10 | -11.320.10 | 41.260.09 | 40.220.10 | 41.220.10 |
| NGC 3726 | < | -14.33 | - | - | 38.21 | - | - |
| NGC 3729 | 8.88 | -12.730.09 | -13.340.09 | -12.850.09 | 39.810.09 | 39.200.09 | 39.690.09 |
| NGC 3738 | < | -14.49 | - | - | 36.85 | - | - |
| NGC 3756 | < | -14.35 | - | - | 38.47 | - | - |
| NGC 3780 | < | -14.35 | - | - | 38.87 | - | - |
| NGC 3838 | 7.83 | -13.570.29 | -13.630.28 | -14.450.28 | 39.290.29 | 39.230.28 | 38.410.28 |
| NGC 3877 | 11.58 | -13.380.47 | -13.380.60 | -15.420.59 | 39.160.47 | 39.160.60 | 37.120.59 |
| NGC 3884 | 186.12 | -11.910.09 | -12.400.14 | -12.080.14 | 42.090.09 | 41.600.14 | 41.920.14 |
| NGC 3893 | < | -14.35 | - | - | 38.19 | - | - |
| NGC 3898 | 52.8 | -13.370.08 | -13.550.17 | -13.830.17 | 39.390.08 | 39.210.17 | 38.930.17 |
| NGC 3917 | < | -14.19 | - | - | 38.35 | - | - |
| NGC 3938 | 11.6 | -14.360.50 | -14.420.48 | -15.240.48 | 38.180.50 | 38.120.48 | 37.300.48 |
| NGC 3945 | 162.23 | -12.610.08 | -12.840.16 | -12.990.16 | 40.180.08 | 39.940.16 | 39.800.16 |
| NGC 3949 | < | -13.48 | - | - | 39.05 | - | - |
| NGC 3953 | 7.27 | -13.620.31 | -13.680.30 | -14.500.30 | 38.920.31 | 38.850.30 | 38.040.30 |
| NGC 3963 | 19.01 | -13.050.14 | -13.650.13 | -13.180.21 | 40.290.14 | 39.690.13 | 40.160.21 |
| NGC 3982 | 27.6 | -13.310.08 | -13.340.10 | -14.470.22 | 39.230.08 | 39.190.10 | 38.070.22 |
| NGC 3992 | 3.41 | -13.560.27 | -14.140.36 | -13.700.35 | 38.980.27 | 38.400.36 | 38.840.35 |
| NGC 3998 | 1817.56 | -10.790.02 | -11.340.02 | -10.930.02 | 41.960.02 | 41.410.02 | 41.820.02 |
| NGC 4013 | 84.77 | -13.710.46 | -14.780.49 | -13.740.49 | 38.830.46 | 37.760.49 | 38.800.49 |
| NGC 4026 | 10.82 | -13.630.23 | -13.870.39 | -14.000.39 | 38.910.23 | 38.670.39 | 38.540.39 |
| NGC 4036 | 54.81 | -12.480.06 | -12.950.14 | -12.650.08 | 40.380.06 | 39.910.14 | 40.210.08 |
| NGC 4041 | 5.86 | -13.380.24 | -13.610.44 | -13.760.44 | 39.410.24 | 39.180.44 | 39.030.44 |
| NGC 4051 | 1158.28 | -10.720.01 | -11.290.01 | -10.860.01 | 41.810.01 | 41.250.01 | 41.680.01 |
| NGC 4062 | < | -14.05 | - | - | 38.00 | - | - |
| NGC 4088 | 12.55 | -13.200.41 | -14.130.46 | -13.250.46 | 39.340.41 | 38.410.46 | 39.290.46 |
| NGC 4096 | 3.55 | -13.850.29 | -14.320.29 | -14.030.29 | 38.120.29 | 37.650.29 | 37.930.29 |
| NGC 4100 | < | -14.53 | - | - | 38.01 | - | - |
| NGC 4102 | 264.99 | -11.710.03 | -12.700.02 | -11.760.03 | 40.830.03 | 39.840.02 | 40.780.03 |
| NGC 4111 | 62.38 | -12.520.02 | -12.780.02 | -12.860.02 | 40.020.02 | 39.760.02 | 39.680.02 |
| NGC 4125 | 39.39 | -13.330.02 | -13.510.02 | -13.790.02 | 39.520.02 | 39.330.02 | 39.060.02 |
| NGC 4136 | 5.9 | -14.290.23 | -14.820.23 | -14.450.24 | 37.760.23 | 37.240.23 | 37.600.24 |
| NGC 4138 | 416.37 | -11.330.07 | -13.360.07 | -11.330.07 | 41.210.07 | 39.180.07 | 41.200.07 |
| NGC 4143 | 71.08 | -12.290.18 | -12.650.27 | -12.550.27 | 40.250.18 | 39.890.27 | 39.990.27 |
| NGC 4144 | < | -13.66 | - | - | 37.65 | - | - |
| NGC 4151 | 2440.54 | -10.300.01 | -12.000.01 | -10.310.01 | 42.390.01 | 40.700.01 | 42.390.01 |
| NGC 4150 | < | -14.27 | - | - | 37.78 | - | - |
| NGC 4157 | 22.85 | -13.120.28 | -14.540.29 | -13.140.29 | 39.420.28 | 38.000.29 | 39.400.29 |
| NGC 4183 | < | -14.02 | - | - | 38.52 | - | - |
| NGC 4203 | 985.94 | -11.590.03 | -12.180.03 | -11.720.03 | 40.460.03 | 39.870.03 | 40.330.03 |
| NGC 4214 | < | -15.87 | - | - | 35.30 | - | - |
| NGC 4217 | 23.74 | -13.740.09 | -14.350.07 | -13.970.32 | 38.800.09 | 38.440.32 | 38.570.32 |
| NGC 4220 | 7.48 | -13.340.17 | -14.390.17 | -13.380.20 | 39.200.17 | 38.150.17 | 39.160.20 |
| NGC 4236 | < | -12.79 | - | - | 37.97 | - | - |
| NGC 4244 | < | -15.15 | - | - | 35.91 | - | - |
| NGC 4242 | < | -14.52 | - | - | 37.31 | - | - |
| NGC 4245 | < | -14.05 | - | - | 38.00 | - | - |
| NGC 4251 | < | -12.81 | - | - | 39.24 | - | - |
| NGC 4258 | 405.77 | -11.060.01 | -13.780.01 | -11.060.01 | 40.680.01 | 37.960.01 | 40.680.01 |
| NGC 4274 | < | -11.91 | - | - | 40.14 | - | - |
| NGC 4278 | 575.27 | -12.310.02 | -12.550.04 | -12.690.04 | 39.740.02 | 39.500.04 | 39.370.04 |
| NGC 4291 | 16.24 | -13.360.05 | -13.730.04 | -13.600.07 | 39.660.05 | 39.280.04 | 39.420.07 |
| NGC 4314 | 6.5 | -13.690.22 | -13.830.46 | -14.230.46 | 38.370.22 | 38.220.46 | 37.820.46 |
| NGC 4346 | 5.47 | -13.390.23 | -13.470.22 | -14.140.22 | 39.150.23 | 39.060.22 | 38.400.22 |
| NGC 4395 | 653.73 | -11.280.05 | -13.100.05 | -11.290.05 | 39.910.05 | 38.090.05 | 39.900.05 |
| NGC 4414 | 10.63 | -13.390.31 | -13.750.53 | -13.640.53 | 38.660.31 | 38.300.53 | 38.410.53 |
| NGC 4449 | 22.96 | -14.190.30 | -14.270.63 | -14.960.63 | 36.850.30 | 36.770.63 | 36.070.63 |
| NGC 4448 | < | -13.57 | - | - | 38.48 | - | - |
| NGC 4460 | < | -13.77 | - | - | 38.13 | - | - |
| NGC 4485 | 377.8 | -15.270.49 | -15.460.51 | -15.740.51 | 36.740.49 | 36.560.51 | 36.280.51 |
| NGC 4490 | 319.79 | -12.140.08 | -13.020.09 | -12.210.09 | 39.720.08 | 38.850.09 | 39.660.09 |
| NGC 4494 | 123.47 | -12.770.09 | -13.170.14 | -13.000.14 | 39.280.09 | 38.890.14 | 39.050.14 |
| NGC 4559 | 21.08 | -13.030.29 | -13.970.32 | -13.080.32 | 39.030.29 | 38.080.32 | 38.970.32 |
| NGC 4565 | 402.44 | -12.330.05 | -12.970.07 | -12.440.07 | 39.720.05 | 39.080.07 | 39.610.07 |
| NGC 4589 | 21.29 | -13.320.16 | -13.510.37 | -13.780.38 | 39.710.16 | 39.520.37 | 39.250.38 |
| NGC 4605 | 3.05 | -13.640.23 | -14.000.23 | -13.890.23 | 37.640.23 | 37.280.23 | 37.400.23 |
| NGC 4618 | < | -12.68 | - | - | 39.12 | - | - |
| NGC 4648 | 7.65 | -13.990.31 | -14.090.30 | -14.680.30 | 38.970.31 | 38.860.30 | 38.280.30 |
| NGC 4631 | < | -12.91 | - | - | 38.85 | - | - |
| NGC 4750 | 59.93 | -12.500.17 | -12.940.26 | -12.700.26 | 40.410.17 | 39.980.26 | 40.210.26 |
| NGC 4725 | 62.2 | -13.130.09 | -13.170.25 | -14.190.25 | 39.140.09 | 39.100.25 | 38.070.25 |
| NGC 4736 | 241.51 | -11.850.03 | -12.330.04 | -12.020.04 | 39.500.03 | 39.010.04 | 39.320.04 |
| NGC 4800 | 8.3 | -13.620.31 | -13.900.31 | -13.950.31 | 38.820.31 | 38.550.31 | 38.490.31 |
| NGC 4826 | 34.25 | -13.220.02 | -13.270.03 | -14.220.07 | 38.080.02 | 38.040.04 | 37.080.07 |
| NGC 4914 | < | -14.08 | - | - | 39.58 | - | - |
| NGC 5005 | 74.58 | -13.590.27 | -13.730.27 | -14.160.27 | 39.150.27 | 39.010.27 | 38.580.27 |
| NGC 5033 | 1143.3 | -13.980.42 | -14.120.41 | -14.550.41 | 38.640.42 | 38.500.41 | 38.080.41 |
| NGC 5055 | 58 | -12.340.11 | -12.450.23 | -13.020.23 | 39.450.11 | 39.350.23 | 38.770.23 |
| NGC 5204 | < | -15.26 | - | - | 36.18 | - | - |
| NGC 5194 | 165.74 | -12.460.01 | -12.640.01 | -12.930.02 | 39.390.01 | 39.210.01 | 38.920.02 |
| NGC 5195 | 45.28 | -12.350.14 | -12.360.18 | -13.950.18 | 39.670.14 | 39.660.18 | 38.070.18 |
| NGC 5273 | 46.83 | -11.780.04 | -13.000.04 | -11.810.04 | 40.960.04 | 39.740.04 | 40.930.04 |
| NGC 5297 | < | -14.01 | - | - | 39.23 | - | - |
| NGC 5308 | 4.97 | -11.670.23 | -13.150.24 | -11.680.24 | 41.430.23 | 39.950.24 | 41.420.24 |
| NGC 5322 | 21.35 | -13.110.06 | -13.190.04 | -13.900.26 | 39.970.06 | 39.890.04 | 39.180.26 |
| NGC 5354 | 20.07 | -13.010.21 | -13.030.36 | -14.300.36 | 40.100.21 | 40.080.36 | 38.810.36 |
| NGC 5353 | 20.07 | -13.790.38 | -13.850.37 | -14.670.37 | 39.440.38 | 39.380.37 | 38.560.37 |
| NGC 5371 | 3.95 | -13.120.11 | -13.220.23 | -13.780.23 | 40.120.11 | 40.010.23 | 39.450.23 |
| NGC 5377 | 6.22 | -13.470.23 | -14.270.27 | -13.550.27 | 39.590.23 | 38.790.27 | 39.510.27 |
| NGC 5383 | < | -13.03 | - | - | 40.20 | - | - |
| NGC 5395 | 29.73 | -13.250.21 | -13.360.39 | -13.910.39 | 40.170.21 | 40.060.39 | 39.500.39 |
| NGC 5448 | 13.2 | -13.740.36 | -13.810.35 | -14.620.35 | 39.360.36 | 39.300.35 | 38.480.35 |
| NGC 5457 | 97.3 | -11.821.12 | -11.840.39 | -13.260.39 | 39.721.12 | 39.710.39 | 38.280.39 |
| NGC 5473 | 3.37 | -13.480.27 | -14.510.32 | -13.530.32 | 39.630.27 | 38.610.32 | 39.590.32 |
| NGC 5474 | 88.09 | -13.050.23 | -13.120.36 | -13.940.36 | 38.580.23 | 38.520.36 | 37.700.36 |
| NGC 5485 | 7.28 | -13.240.08 | -13.620.13 | -13.480.13 | 39.870.08 | 39.490.13 | 39.630.13 |
| NGC 5548 | 1886 | -10.520.01 | -11.330.01 | -10.590.01 | 43.210.01 | 42.400.01 | 43.140.01 |
| NGC 5557 | < | -12.29 | - | - | 41.05 | - | - |
| NGC 5585 | < | -12.01 | - | - | 39.76 | - | - |
| NGC 5631 | 8.37 | -13.430.26 | -13.490.25 | -14.310.25 | 39.680.26 | 39.610.25 | 38.800.25 |
| NGC 5660 | < | -14.01 | - | - | 39.21 | - | - |
| NGC 5678 | < | -12.01 | - | - | 41.17 | - | - |
| NGC 5676 | 7.55 | -13.440.27 | -13.500.26 | -14.300.26 | 39.720.27 | 39.650.26 | 38.850.26 |
| NGC 5866 | 9.67 | -12.870.02 | -13.160.02 | -13.190.02 | 39.570.02 | 39.280.02 | 39.260.02 |
| NGC 5879 | 28.58 | -14.010.40 | -14.070.38 | -14.890.39 | 38.520.40 | 38.450.38 | 37.640.39 |
| NGC 5905 | 20.45 | -13.460.21 | -14.050.27 | -13.600.27 | 39.910.21 | 39.320.27 | 39.780.27 |
| NGC 5907 | 9.74 | -12.830.12 | -14.180.13 | -12.850.13 | 39.590.12 | 38.240.13 | 39.570.13 |
| NGC 5982 | 18.77 | -13.710.35 | -14.770.39 | -13.750.39 | 39.550.35 | 38.480.39 | 39.510.39 |
| NGC 5985 | 50.78 | -11.740.03 | -12.570.04 | -11.810.04 | 41.520.03 | 40.700.04 | 41.450.04 |
| NGC 6015 | 5.01 | -13.070.20 | -13.160.30 | -13.800.30 | 39.500.20 | 39.410.30 | 38.770.30 |
| NGC 6503 | 6.45 | -13.530.25 | -13.970.30 | -13.930.29 | 38.120.25 | 37.680.30 | 37.720.29 |
| NGC 6482 | 72.15 | -12.660.18 | -13.220.27 | -12.810.27 | 40.850.18 | 40.300.27 | 40.710.27 |
| NGC 6643 | 3.28 | -12.630.08 | -12.830.18 | -13.050.18 | 40.270.08 | 40.060.18 | 39.840.18 |
| NGC 6689 | < | -13.96 | - | - | 38.29 | - | - |
| NGC 6946 | < | -12.38 | - | - | 39.18 | - | - |
| NGC 7331 | 26.87 | -12.600.08 | -13.250.01 | -12.720.10 | 39.780.08 | 39.140.10 | 39.670.10 |
| NGC 7457 | < | -13.91 | - | - | 38.34 | - | - |
| NGC 7640 | 8.38 | -12.360.26 | <-15.26 | -12.360.2 | 39.590.26 | <36.68 | 39.590.26 |
| NGC 7741 | < | -13.86 | - | - | 38.39 | - | - |
| Det. | phabs | ztbabs | zpowerlw | cstat/ | |||
|---|---|---|---|---|---|---|---|
| Name | Sig. | mod. | Phot.I. | norm. | |||
| (1) | (2) | (3) | (4) | (5) | (6) | (7) | (8) |
| IC10 | - | 50.6 | - | - | - | - | |
| NGC205 | - | 5.83 | - | - | - | - | |
| NGC221 | - | 18.3 | - | - | - | - | |
| NGC224 | 146.78 | 16.9 | 0.04 | 2.82 | 9.9610-5 | 0.87 | |
| NGC266 | 204.06 | 5.68 | 0.23 | 1.91 | 3.0510-5 | 0.69 | |
| NGC278 | 11.87 | 12.9 | 0.15 | 2.25 | 2.3010-6 | 10.13/9c | |
| NGC315 | 33.96 | 5.90 | 0.08 | 1.49 | 1.8410-4 | 1.06 | |
| NGC404 | 89.63 | 5.71 | 0.44 | 1.88 | 4.8910-6 | 15.57/20c | |
| NGC410 | 26.74 | 5.11 | 0.06 | 2.18 | 1.9510-5 | 0.79 | |
| NGC507 | 58.35 | 5.25 | 0.07 | 2.77 | 3.7110-6 | 1.02 | |
| NGC598 | 280.24 | 18.6 | 0.03 | 1.33 | 5.1310-2 | 0.89 | |
| IC1727 | - | 8.5 | - | - | - | - | |
| NGC672 | - | 8.6 | - | - | - | - | |
| NGC697 | - | 6.4 | - | - | - | - | |
| NGC777 | - | 4.6 | - | - | - | - | |
| NGC890 | - | 6.2 | - | - | - | - | |
| NGC891 | 14.23 | 7.4 | 0.19 | 2.90 | 2.0410-4 | 1.05 | |
| NGC925 | 6.76 | 7.4 | 0.44 | 1.42 | 9.7010-6 | 6.37/6c | |
| NGC959 | - | 5.4 | - | - | - | - | |
| IC239 | - | 6.1 | - | - | - | - | |
| NGC1003 | - | 7.2 | - | - | - | - | |
| NGC1023 | 97.11 | 5.6 | 0.04 | 1.96 | 1.5510-5 | 0.81 | |
| NGC1058 | 15.16 | 6.6 | 0.43 | 1.41 | 3.1810-6 | 13.44/18c | |
| NGC1156 | - | 11.7 | - | - | - | - | |
| NGC1161 | 14.7 | 14.8 | 0.001 † | 3.45 | 9.7110-4 | 0.70 | |
| NGC1167 | 25.17 | 9.7 | 0.16 | 3.18 | 2.0510-5 | 0.77 | |
| NGC1275 | 205.26 | 13.5 | 0.15 | 1.96 | 7.6510-2 | 1.06 | |
| IC342 | 132.95 | 36.2 | 0.16 | 2.44 | 7.8310-5 | 0.98 | |
| NGC1569 | - | 22.4 | - | - | - | - | |
| NGC1961 | 32.74 | 8.0 | 6.4910-15 | 1.47 | 9.0910-6 | 1.60 | |
| NGC2146 | 8.84 | 6.9 | 5.20 | 2.29 | 2.0910-4 | 0.89 | |
| NGC2273 | 84.06 | 5.8 | 0.16 | 2.75 | 2.4310-4 | 0.88 | |
| UGC3828 | - | 5.0 | - | - | - | - | |
| NGC2276 | 3.67 | 6.0 | 0.29 | 3.55 | 7.8910-6 | 1.46 | |
| NGC2300 | 39.02 | 5.8 | 0.24 | 3.90 | 2.7210-5 | 1.06 | |
| NGC2403 | 151.93 | 11.5 | 0.23 | 2.60 | 8.3110-5 | 40.00/34c | |
| NGC2500 | 3.15 | 4.5 | 0.54 | 1.89 | 2.3010-5 | 7.01/6c | |
| NGC2537 | - | 4.7 | - | - | - | - | |
| NGC2541 | 3.21 | 5.7 | 0.77 | 1.41 | 7.8510-6 | 0.74 | |
| NGC2549 | 15.18 | 4.5 | 0.51 | - | - | - | |
| NGC2639 | 40.84 | 2.7 | 1.40 | 2.22 | 6.5510-5 | 0.92 | |
| NGC2634 | - | 1.8 | - | - | - | - | |
| NGC2683 | 58.89 | 3.5 | 0.27 | 1.02 | 1.5810-4 | 0.97 | |
| NGC2681 | 160.3 | 2.3 | 0.04 | 1.50 | 5.5510-6 | 1.12 | |
| NGC2742 | - | 3.9 | - | - | - | - | |
| NGC2770 | - | 1.7 | - | - | - | - | |
| NGC2768 | 85.01 | 4.2 | 0.26 | 1.75 | 1.4010-5 | 1.10 | |
| NGC2776 | 7.42 | 1.3 | 1.88 | 3.27 | 3.2610-6 | 28.64/21c | |
| NGC2748 | 8.58 | 1.9 | 0.13 | 2.00 | 7.4110-6 | 28.29/26c | |
| NGC2782 | 112.45 | 1.4 | 1.71 | 1.35 | 3.0610-5 | 1.24 | |
| NGC2787 | 147.73 | 4.8 | 0.12 | 2.33 | 3.1710-5 | 34.95/30c | |
| NGC2832 | 3.21 | 1.2 | 7.5610-2 | 2.78 | 9.0710-5 | 0.79 | |
| NGC2841 | 54.21 | 2.3 | 0.71 | 1.68 | 1.0910-5 | 16.41/21c | |
| NGC2903 | 76.23 | 3.9 | 0.22 | 2.19 | 2.7510-5 | 0.97 | |
| NGC2950 | 6.71 | 1.5 | 0.89 | 3.32 | 6.6610-5 | 1.44 | |
| NGC2976 | 3.05 | 4.9 | 0.66 | 1.20 | 1.2610-5 | 55.17/40c | |
| NGC2985 | 90.18 | 2.2 | 0.17 | 2.26 | 2.3810-5 | 5.47/9c | |
| NGC3031 | 622.22 | 10.2 | 2.2210-15 | 1.24 | 3.0010-3 | 1.34 | |
| NGC3034 | 110.07 | 6.5 | 0.16 | 1.90 | 1.2410-4 | 1.00 | |
| NGC3043 | - | 1.3 | - | - | - | - | |
| NGC3073 | - | 0.9 | - | - | - | - | |
| NGC3079 | 28.31 | 0.9 | 1.03 | 1.96 | 4.2310-5 | 1.23 | |
| NGC3077 | 68.78 | 6.4 | 0.91 | 1.39 | 1.1610-5 | 30.18/20c | |
| NGC3147 | 338.43 | 2.0 | 2.5410-2 | 1.44 | 6.0910-4 | 1.17 | |
| NGC3185 | 11.51 | 1.9 | 0.13 | 2.71 | 1.2510-2 | 0.73 | |
| NGC3190 | 68.72 | 1.8 | 0.23 | 3.71 | 8.5110-3 | 0.58 | |
| NGC3184 | 34.93 | 1.7 | 0.19 | 2.17 | 6.7210-6 | 3.69/6c | |
| NGC3193 | 8.66 | 1.9 | 0.07 | 2.14 | 1.4210-5 | 19.52/13c | |
| NGC3198 | 30.81 | 1.6 | 0.63 | 2.07 | 5.9610-6 | 4.40/6c | |
| NGC3245 | 31.02 | 1.8 | 0.08 | 1.96 | 1.5710-5 | 1.58/4c | |
| IC2574 | - | 5.9 | - | - | - | - | |
| NGC3310 | 159.06 | 1.5 | 8.3410-2 | 1.17 | 2.5710-5 | 119.25/122c | |
| NGC3319 | 30.77 | 1.3 | 0.31 | 1.95 | 1.4510-5 | 15.69/10c | |
| NGC3344 | 42.61 | 3.7 | 0.09 | 2.00 | 1.1510-5 | 53.72/48c | |
| NGC3359 | - | 0.9 | - | - | - | - | |
| NGC3395 | 13.8 | 2.2 | 9.6810-2 | 2.48 | 1.9710-5 | 52.94/39c | |
| NGC3414 | 195.7 | 1.5 | 0.24 | 1.87 | 9.7210-5 | 0.55 | |
| NGC3430 | - | 1.8 | - | - | - | - | |
| NGC3432 | - | 1.8 | - | - | - | - | |
| NGC3448 | 28.32 | 0.9 | 2.08 | 2.67 | 1.3510-4 | 20.18/24c | |
| NGC3486 | - | 1.8 | - | - | - | - | |
| NGC3516 | 1353.47 | 3.1 | 0.10 | 2.50 | 1.4310-3 | 1.21 | |
| NGC3556 | 83.27 | 1.2 | 0.52 | 1.91 | 1.5410-5 | 19.24/20c | |
| NGC3583 | 6.34 | 1.4 | 7.7910-2 | 2.12 | 1.0310-5 | 9.99/7c | |
| NGC3600 | 36.78 | 1.4 | 8.5310-2 | 1.64 | 2.0110-5 | 15.74/13c | |
| NGC3610 | 4.07 | 0.6 | 0.26 | 2.31 | 1.5710-5 | 31.63/33c | |
| NGC3613 | - | 0.7 | - | - | - | - | |
| NGC3631 | 75.83 | 1.0 | 0.13 | 2.45 | 1.2610-5 | 1.02 | |
| NGC3642 | 38.06 | 0.7 | 0.17 | 2.81 | 3.6310-5 | 16.56/19c | |
| NGC3665 | 20.66 | 1.8 | 2.5710-2 | 2.15 | 2.4810-5 | 42.83/37c | |
| NGC3675 | - | 2.8 | - | - | - | - | |
| NGC3690 | 97.24 | 0.8 | 0.43 | 1.66 | 6.8410-5 | 1.07 | |
| UGC6484 | - | 1.1 | - | - | - | - | |
| NGC3718 | 405.72 | 0.9 | 1.28 | 1.67 | 7.7210-4 | 0.87 | |
| NGC3726 | - | 1.6 | - | - | - | - | |
| NGC3729 | 8.88 | 0.9 | 1.0010-3† | 3.42 | 2.1410-4 | 25.47/24c | |
| NGC3738 | - | 1.0 | - | - | - | - | |
| NGC3756 | - | 0.8 | - | - | - | - | |
| NGC3780 | - | 1.1 | - | - | - | - | |
| NGC3838 | 7.83 | 0.7 | 0.63 | 3.18 | 1.5610-5 | 18.62/15c | |
| NGC3877 | 11.58 | 2.5 | 0.16 | 3.08 | 7.5110-6 | 18.40/25c | |
| NGC3884 | 186.12 | 1.9 | 7.3410-2 | 1.62 | 1.6410-4 | 0.85 | |
| NGC3893 | - | 2.4 | - | - | - | - | |
| NGC3898 | 52.8 | 0.8 | 2.1310-2 | 2.31 | 8.4810-6 | 22.29/20c | |
| NGC3917 | - | 1.5 | - | - | - | - | |
| NGC3938 | 11.6 | 1.8 | 0.66 | 1.75 | 1.8010-6 | 29.26/28c | |
| NGC3945 | 162.23 | 2.0 | 0.14 | 2.62 | 6.8610-5 | 1.07 | |
| NGC3949 | - | 2.2 | - | - | - | - | |
| NGC3953 | 7.27 | 2.1 | 0.24 | 1.39 | 5.9810-6 | 40.48/52c | |
| NGC3963 | 19.01 | 1.7 | 0.12 | 1.17 | 7.1010-6 | 12.46/9c | |
| NGC3982 | 27.6 | 1.0 | 0.20 | 4.83 | 2.3610-5 | 35.52/28c | |
| NGC3992 | 3.41 | 2.0 | 3.48 | 1.17 | 1.6310-4 | 28.05/23c | |
| NGC3998 | 1817.56 | 1.0 | 1.2610-2 | 1.77 | 1.3310-4 | 1.05 | |
| NGC4013 | 84.77 | 1.4 | 0.20 | 3.00 | 2.7410-6 | 97.84/95c | |
| NGC4026 | 10.82 | 2.1 | 0.10 | 1.41 | 4.3410-6 | 38.37/32c | |
| NGC4036 | 54.81 | 1.9 | 0.12 | 2.76 | 1.1610-3 | 0.68 | |
| NGC4041 | 5.86 | 1.8 | 0.25 | 3.36 | 3.3110-5 | 1.28 | |
| NGC4051 | 1158.28 | 1.2 | 9.5710-3 | 2.26 | 0.70 | 1.06 | |
| NGC4062 | - | 1.8 | - | - | - | - | |
| NGC4088 | 12.55 | 1.6 | 0.13 | 1.07 | 3.7410-6 | 30.13/18c | |
| NGC4096 | 3.55 | 2.0 | 0.97 | 1.80† | 2.7210-6 | 14.93/11c | |
| NGC4100 | - | 2.2 | - | - | - | - | |
| NGC4102 | 264.99 | 1.6 | 0.59 | 2.13 | 6.6510-3 | 0.92 | |
| NGC4111 | 62.38 | 1.4 | 3.6910-2 | 2.25 | 1.7710-4 | 0.82 | |
| NGC4125 | 39.39 | 1.8 | 9.5710-3 | 1.80 | 5.1710-6 | 1.09 | |
| NGC4136 | 5.9 | 1.7 | 0.23 | 1.80† | 1.0610-6 | 15.48/12c | |
| NGC4138 | 416.37 | 1.1 | 9.48 | 1.34 | 4.5710-4 | 0.98 | |
| NGC4143 | 71.08 | 1.2 | 6.6510-2 | 1.56 | 7.1610-5 | 1.29 | |
| NGC4144 | - | 2.1 | - | - | - | - | |
| NGC4151 | 2440.54 | 2.1 | 8.7310-3 | 1.84 | 0.5 | 1.18 | |
| NGC4150 | - | 1.4 | - | - | - | - | |
| NGC4157 | 22.85 | 2.1 | 0.12 | 1.02 | 3.3010-6 | 71.29/45c | |
| NGC4183 | - | 1.2 | - | - | - | - | |
| NGC4203 | 985.94 | 1.1 | 0.10 | 2.34 | 4.3510-2 | 0.84 | |
| NGC4214 | - | 4.0 | - | - | - | - | |
| NGC4217 | 23.74 | 1.9 | 1.0810-3 | 2.80 | 2.9210-5 | 46.00/53c | |
| NGC4220 | 7.48 | 1.6 | 2.51 | 2.46 | 4.1510-6 | 21.41/34c | |
| NGC4236 | - | 5.5 | - | - | - | - | |
| NGC4244 | - | 5.0 | - | - | - | - | |
| NGC4242 | - | 1.5 | - | - | - | - | |
| NGC4245 | - | 1.9 | - | - | - | - | |
| NGC4251 | - | 1.9 | - | - | - | - | |
| NGC4258 | 405.77 | 4.2 | 5.97 | 1.22 | 1.0410-2 | 1.15 | |
| NGC4274 | - | 2.2 | - | - | - | - | |
| NGC4278 | 575.27 | 2.0 | 1.5010-2 | 2.24 | 1.0110-4 | 1.40 | |
| NGC4291 | 16.24 | 3.0 | 0.49 | 1.57 | 5.9610-5 | 11.29/9c | |
| NGC4314 | 6.5 | 2.3 | 0.31 | 4.73 | 5.9610-5 | 1.20 | |
| NGC4346 | 5.47 | 1.2 | 0.17 | 1.94 | 7.3010-6 | 54.81/40c | |
| NGC4395 | 653.73 | 4.3 | 0.21 | 1.19 | 4.5410-4 | 1.06 | |
| NGC4414 | 10.63 | 1.6 | 3.5610-2 | 1.90 | 1.9710-5 | 28.77/24c | |
| NGC4449 | 22.96 | 4.1 | 5.9010-2 | 2.64 | 4.0810-5 | 1.16 | |
| NGC4448 | - | 1.8 | - | - | - | - | |
| NGC4460 | - | 1.5 | - | - | - | - | |
| NGC4485 | 377.8 | 3.9 | 1.13 | 2.56 | 2.3610-4 | 0.88 | |
| NGC4490 | 319.79 | 3.8 | 1.21 | 2.39 | 2.3110-4 | 1.06 | |
| NGC4494 | 123.47 | 1.4 | 0.12 | 2.13 | 3.2510-5 | 1.20 | |
| NGC4559 | 21.08 | 1.4 | 0.20 | 1.21 | 5.5910-6 | 0.94 | |
| NGC4565 | 402.44 | 1.1 | 0.34 | 1.91 | 8.0910-5 | 0.97 | |
| NGC4589 | 21.29 | 2.2 | 0.35 | 2.49 | 1.1510-5 | 1.14 | |
| NGC4605 | 3.05 | 1.6 | 0.10 | 1.80† | 6.3510-6 | 19.70/21c | |
| NGC4618 | - | 2.5 | - | - | - | - | |
| NGC4648 | 7.65 | 1.9 | 0.29 | 2.00 | 3.4710-6 | 20.80/30c | |
| NGC4631 | - | 3.4 | - | - | - | - | |
| NGC4750 | 59.93 | 1.6 | 0.18 | 1.88 | 5.3710-5 | 0.75 | |
| NGC4725 | 62.2 | 0.8 | 0.049 | 3.38 | 1.3210-5 | 0.99 | |
| NGC4736 | 241.51 | 1.9 | 0.10 | 1.91 | 7.8110-6 | 0.94 | |
| NGC4800 | 8.3 | 1.3 | 0.28 | 2.05 | 6.2610-6 | 15.97/17c | |
| NGC4826 | 34.25 | 3.0 | 0.14 | 1.80† | 1.2910-6 | 21.01/14c | |
| NGC4914 | - | 1.2 | - | - | - | - | |
| NGC5005 | 74.58 | 1.2 | 6.6610-2 | 1.90 | 4.0110-5 | 0.86 | |
| NGC5033 | 1143.3 | 1.1 | 1.2710-2 | 1.39 | 6.6010-3 | 1.14 | |
| NGC5055 | 58 | 3.7 | 6.2910-2 | 1.60 | 1.8010-5 | 25.31/25c | |
| NGC5204 | - | 2.7 | - | - | - | - | |
| NGC5194 | 165.74 | 3.3 | 66.01 | 3.5 | 2.0410-5 | 1.94 | |
| NGC5195 | 45.28 | 3.2 | 1.6810-2 | 1.48 | 1.0110-5 | 68.71/44c | |
| NGC5273 | 46.83 | 0.8 | 7.5610-2 | 1.66 | 6.8710-4 | 0.80 | |
| NGC5297 | - | 1.3 | - | - | - | - | |
| NGC5308 | 4.97 | 1.7 | 1.78 | 2.06 | 6.3610-5 | 0.79 | |
| NGC5322 | 21.35 | 1.4 | 0.13 | 3.46 | 3.6510-5 | 1.06 | |
| NGC5354 | 20.07 | 1.0 | 5.9010-2 | 1.86 | 1.1210-5 | 89.38/71c | |
| NGC5353 | 20.07 | 1.0 | 1.58 | 3.63 | 3.8010-5 | 1.10 | |
| NGC5371 | 3.95 | 0.9 | 0.46 | 3.83 | 4.7710-5 | 0.62 | |
| NGC5377 | 6.22 | 1.7 | 4.27 | 1.52 | 5.8710-6 | 0.77 | |
| NGC5383 | - | 1.0 | - | - | - | - | |
| NGC5395 | 29.73 | 1.1 | 7.9010-2 | 1.49 | 9.7310-6 | 32.59/30c | |
| NGC5448 | 13.2 | 1.4 | 0.28 | 2.81 | 1.7310-5 | 0.63 | |
| NGC5457 | 97.3 | 8.6 | 6.6910-2 | 2.12 | 1.3010-6 | 29.92/31c | |
| NGC5473 | 3.37 | 1.21 | 1.31 | 1.80† | 9.5910-6 | 2.72/6c | |
| NGC5474 | 88.09 | 1.9 | 0.15 | 1.88 | 2.5910-6 | 69.36/53c | |
| NGC5485 | 7.28 | 1.1 | 0.25 | 1.98 | 6.4810-6 | 1.00 | |
| NGC5548 | 1886 | 1.6 | 9.7810-2 | 1.95 | 0.73 | 1.14 | |
| NGC5557 | - | 0.9 | - | - | - | - | |
| NGC5585 | - | 2.7 | - | - | - | - | |
| NGC5631 | 8.37 | 1.4 | 0.22 | 3.47 | 1.3210-5 | 9.49/18c | |
| NGC5660 | - | 1.8 | - | - | - | - | |
| NGC5678 | - | 1.1 | - | - | - | - | |
| NGC5676 | 7.55 | 2.6 | 0.86 | 1.87 | 6.6210-6 | 19.33/18c | |
| NGC5866 | 9.67 | 1.3 | 0.26 | 4.22 | 1.2010-3 | 1.36 | |
| NGC5879 | 28.58 | 1.6 | 0.27 | 3.23 | 4.4710-3 | 1.23 | |
| NGC5905 | 20.45 | 1.3 | 0.17 | 2.49 | 2.7110-6 | 7.48/6c | |
| NGC5907 | 9.74 | 2.0 | 0.25 | 0.89 | 2.4310-6 | 50.94/38c | |
| NGC5982 | 18.77 | 1.5 | 8.0310-2 | 2.52 | 1.5610-5 | 15.55/8c | |
| NGC5985 | 50.78 | 1.6 | 1.01 | 2.27 | 6.8210-5 | 0.67 | |
| NGC6015 | 5.01 | 1.3 | 0.45 | 2.69 | 1.0710-5 | 44.41/42c | |
| NGC6503 | 6.45 | 4.8 | 0.50 | 2.28 | 3.4410-6 | 12.30/16c | |
| NGC6482 | 72.15 | 8.2 | 0.23 | 3.19 | 2.1910-5 | 0.90 | |
| NGC6643 | 3.28 | 5.1 | 0.59 | 2.01 | 3.9310-6 | 17.19/14c | |
| NGC6689 | - | 5.3 | - | - | - | - | |
| NGC6946 | - | 22.0 | - | - | - | - | |
| NGC7331 | 26.87 | 7.0 | 0.13 | 1.67 | 7.4610-6 | 1.04 | |
| NGC7457 | - | 4.4 | - | - | - | - | |
| NGC7640 | 8.38 | 10.5 | 108.92 | 3.26 | 5.5510-3 | 8.04/13c | |
| NGC7741 | - | 4.9 | - | - | - | - | |
| apec | zgauss | gabs | |||||||
|---|---|---|---|---|---|---|---|---|---|
| Name | mod. | norm. | LineE | sigma | norm. | LineE | sigma | Strength | |
| (1) | (2) | (3) | (4) | (5) | (6) | (7) | (8) | (9) | (10) |
| NGC315 | 0.54 | 2.6210-4 | - | - | - | - | - | - | |
| NGC404 | 0.24 | 5.1710-5 | - | - | - | - | - | - | |
| NGC410 | 0.78 | 2.0710-4 | - | - | - | - | - | - | |
| NGC507 | 0.91 | 5.8910-5 | - | - | - | - | - | - | |
| NGC1275 | 0.79 | 1.4210-2 | - | - | - | 6.64 | 0.69 | 1 † | |
| IC342* | 0.82 | 6.7510-5 | - | - | - | - | - | - | |
| NGC2273 | - | - | 6.41 | 9.5410-2 | 5.5610-5 | - | - | - | |
| NGC2549 | 1.80 | 7.7210-2 | - | - | - | - | - | - | |
| NGC2639 | 0.11 | 0.48 | - | - | - | - | - | - | |
| NGC2681 | 0.79 | 1.1110-5 | - | - | - | - | |||
| NGC2782 | 0.11 | 0.55 | 6.48 | 0.23 | 8.1610-6 | - | - | - | |
| NGC2832 | 1.21 | 2.2710-4 | - | - | - | - | - | - | |
| NGC2841 | 0.24 | 3.8310-4 | - | - | - | - | - | - | |
| NGC2903 | 0.68 | 9.5410-6 | - | - | - | - | - | - | |
| NGC3034 | 0.83 | 1.3110-3 | 6.69 | 0.01 † | 2.2410-6 | - | - | - | |
| NGC3079 | - | - | 6.44 | 0.18 | 8.3710-6 | - | - | - | |
| NGC3690* | - | - | 6.41 | 7.8310-2 | 4.9810-6 | - | - | - | |
| NGC3729 | - | - | 6.42 | 0.14 | 1.3010-5 | - | - | - | |
| NGC4036 | 0.74 | 8.6710-4 | - | - | - | - | - | - | |
| NGC4102 | 0.79 | 2.9510-2 | - | - | - | - | - | - | |
| NGC4111* | 0.66 | 1.5610-3 | - | - | - | - | - | - | |
| NGC4125 | 0.85 | 2.2310-5 | - | - | - | - | - | - | |
| NGC4151 | 0.15 | 1.12 | 6.41 | 6.7410-2 | 1.4510-3 | 6.69 | 0.92 | 1.46 | |
| NGC4291 | 0.27 | 5.5910-5 | - | - | - | - | - | - | |
| NGC4826 | 0.61 | 3.0010-5 | - | - | - | - | - | - | |
| NGC5005 | 1.00 | 5.1410-5 | - | - | - | - | - | - | |
| NGC5194 | 0.74 | 8.4710-5 | 6.41 | 0.05 | 4.5210-6 | - | - | - | |
| NGC5353 | 9.0910-2 | 0.47 | - | - | - | - | - | - | |
| NGC5905 | 0.68 | 4.4510-6 | - | - | - | - | - | - | |
| NGC6482 | 0.83 | 1.2910-4 | - | - | - | - | - | - | |
| zpcfabs | zxipcf | zxipcf (2) | apec (2) | ||||||||
|---|---|---|---|---|---|---|---|---|---|---|---|
| Name | mod. | CvrFract. | logxi | CvrFract. | logxi | CvrFract. | norm. | ||||
| (1) | (2) | (3) | (4) | (5) | (6) | (7) | (8) | (9) | (10) | (11) | (12) |
| NGC315 | - | - | 0.39 | -1.59 | 0.84 | - | - | - | - | - | |
| NGC598 | - | - | 177.28 | 0.26 | 0.99 | - | - | - | - | - | |
| NGC891 | 9.34 | 0.95 | - | - | - | - | - | - | - | - | |
| NGC1161 | 20.63 | 0.97 | - | - | - | - | - | - | - | - | |
| NGC1275 | - | - | 1.79 | -3 † | 0.79 | 61.86 | -0.55 | 0.99 | - | - | |
| NGC2273 | - | - | 15.69 | 0.01 † | 0.90 | - | - | - | - | - | |
| NGC2549 | - | - | 65.95 | 1.70 | 0.84 | - | - | - | - | - | |
| NGC2683 | - | - | 46.16 | -2.00 | 1 † | - | - | - | - | - | |
| NGC2782 | - | - | 0.88 | -2.73 | 1 † | - | - | - | - | - | |
| NGC3031 | 137.63 | 0.84 | - | - | - | - | - | - | - | - | |
| NGC3034 | - | - | 1.85 | -0.67 | 0.98 | - | - | - | - | - | |
| NGC3185 | - | - | 50.16 | 2.09 | 0.99 | - | - | - | - | - | |
| NGC3190 | - | - | 22.11 | 0.54 | 0.99 | - | - | - | - | - | |
| NGC3516 | - | - | 15.12 | 1.09 | 0.94 | - | - | - | - | - | |
| NGC3729 | 13.94 | 0.96 | - | - | - | - | - | - | - | - | |
| NGC4036 | - | - | 34.56 | 1.93 | 0.99 | - | - | - | - | - | |
| NGC4051 | - | - | 7.93 | 1.48 | 0.70 | 162.74 | -0.29 | 0.99 | - | - | |
| NGC4102 | - | - | 22.80 | -1.83 | 0.99 | - | - | - | - | - | |
| NGC4111 | 16.40 | 0.96 | - | - | - | - | - | - | - | - | |
| NGC4125 | - | - | 8.21 | 2.52 | 0.74 | - | - | - | - | - | |
| NGC4151 | - | - | 4.04 | -1.05 | 0.98 | 58.64 | -0.55 | 0.98 | 0.82 | 0.21 | |
| NGC4203 | - | - | 142.87 | 0.27 | 0.97 | 1.03 | -1.63 | 0.74 | - | - | |
| NGC4217 | 5.73 | 0.94 | - | - | - | - | - | - | - | - | |
| NGC4258 | - | - | 92.91 | -0.55 | 0.92 | - | - | - | - | - | |
| NGC4395 | - | - | 8.40 | 1.67 | 0.98 | - | - | - | - | - | |
| NGC5033 | - | - | 64.86 | -0.49 | 0.92 | - | - | - | - | - | |
| NGC5273 | - | - | 12.84 | 1.15 | 0.95 | - | - | - | - | - | |
| NGC5548 | - | - | 8.34 | 2.10 | 0.67 | 156.68 | -0.54 | 0.99 | - | - | |
| NGC5866 | 7.13 | 0.95 | - | - | - | - | - | - | - | - | |
| NGC5879 | - | - | 17.98 | 0.80 | 0.99 | - | - | - | - | - | |
| cabs | cutoffpl | pexrav | ||||||||||
|---|---|---|---|---|---|---|---|---|---|---|---|---|
| Name | mod. | Phot.I. | HighECut (keV) | norm. | Phot.I. | foldE(keV) | relrefl | abund | Fe abund | cosIncl | norm. | |
| (1) | (2) | (3) | (4) | (5) | (6) | (7) | (8) | (9) | (10) | (11) | (12) | |
| NGC5194 | 6601.11 | 1.8 † | 300 † | 6.5710-5 | 1.8 † | 300 † | -1 † | 1.0 † | 1.0 † | 0.45 † | 6.5710-5 | |
We plot all of the 150 detected sources in the following images. In all plots, the source is labelled at the top of the image. The top panel in each plot shows the number of photons cm-2 s-1 keV-1 plotted against the energy in keV across the whole 0.3–10.0 keV band. The bottom panel in each plot shows the model subtracted from the data, divided by the error. The fit parameters to make these plots are shown in this Online Supplementary Material Tables.
7.1 X-ray Spectra
We plot all of the 150 detected sources in the following images. In all plots, the source is labelled at the top of the image. The top panel in each plot shows the number of photons cm-2 s-1 keV-1 plotted against the energy in keV across the whole 0.3–10.0 keV band. The bottom panel in each plot shows the model subtracted from the data, divided by the error. The fit parameters to make these plots are shown in this Appendix.
![[Uncaptioned image]](2111.09077v1/x1.png)
![[Uncaptioned image]](2111.09077v1/18-spec-resid-eps-converted-to.png)
![[Uncaptioned image]](2111.09077v1/24-spec-resid-eps-converted-to.png)
![[Uncaptioned image]](2111.09077v1/38-spec-resid-eps-converted-to.png)
![[Uncaptioned image]](2111.09077v1/77-spec-resid-eps-converted-to.png)
![[Uncaptioned image]](2111.09077v1/ngc410-eps-converted-to.png)
![[Uncaptioned image]](2111.09077v1/119-spec-resid-eps-converted-to.png)
![[Uncaptioned image]](2111.09077v1/143-spec-resid-eps-converted-to.png)
![[Uncaptioned image]](2111.09077v1/153-spec-resid-eps-converted-to.png)
![[Uncaptioned image]](2111.09077v1/154-spec-resid-eps-converted-to.png)
![[Uncaptioned image]](2111.09077v1/2-spec-resid-eps-converted-to.png)
![[Uncaptioned image]](2111.09077v1/ngc1058-eps-converted-to.png)
![[Uncaptioned image]](2111.09077v1/ngc1161-eps-converted-to.png)
![[Uncaptioned image]](2111.09077v1/ngc1167-eps-converted-to.png)
![[Uncaptioned image]](2111.09077v1/ngc1275-eps-converted-to.png)
![[Uncaptioned image]](2111.09077v1/1-spec-resid-eps-converted-to.png)
![[Uncaptioned image]](2111.09077v1/7-spec-resid-eps-converted-to.png)
![[Uncaptioned image]](2111.09077v1/8-spec-resid-eps-converted-to.png)
![[Uncaptioned image]](2111.09077v1/10-spec-resid-eps-converted-to.png)
![[Uncaptioned image]](2111.09077v1/11-spec-resid-eps-converted-to.png)
![[Uncaptioned image]](2111.09077v1/12-spec-resid-eps-converted-to.png)
![[Uncaptioned image]](2111.09077v1/ngc2403-eps-converted-to.png)
![[Uncaptioned image]](2111.09077v1/ngc2500-eps-converted-to.png)
![[Uncaptioned image]](2111.09077v1/ngc2541-eps-converted-to.png)
![[Uncaptioned image]](2111.09077v1/ngc2549-eps-converted-to.png)
![[Uncaptioned image]](2111.09077v1/17-spec-resid-eps-converted-to.png)
![[Uncaptioned image]](2111.09077v1/20-spec-resid-eps-converted-to.png)
![[Uncaptioned image]](2111.09077v1/19-spec-resid-eps-converted-to.png)
![[Uncaptioned image]](2111.09077v1/22-spec-resid-eps-converted-to.png)
![[Uncaptioned image]](2111.09077v1/ngc2776-eps-converted-to.png)
![[Uncaptioned image]](2111.09077v1/ngc2748-eps-converted-to.png)
![[Uncaptioned image]](2111.09077v1/25-spec-resid-eps-converted-to.png)
![[Uncaptioned image]](2111.09077v1/26-spec-resid-eps-converted-to.png)
![[Uncaptioned image]](2111.09077v1/ngc2832-eps-converted-to.png)
![[Uncaptioned image]](2111.09077v1/28-spec-resid-eps-converted-to.png)
![[Uncaptioned image]](2111.09077v1/ngc2903-eps-converted-to.png)
![[Uncaptioned image]](2111.09077v1/30-spec-resid-eps-converted-to.png)
![[Uncaptioned image]](2111.09077v1/31-spec-resid-eps-converted-to.png)
![[Uncaptioned image]](2111.09077v1/32-spec-resid-eps-converted-to.png)
![[Uncaptioned image]](2111.09077v1/33-spec-resid-eps-converted-to.png)
![[Uncaptioned image]](2111.09077v1/ngc3034-eps-converted-to.png)
![[Uncaptioned image]](2111.09077v1/36-spec-resid-eps-converted-to.png)
![[Uncaptioned image]](2111.09077v1/35-spec-resid-eps-converted-to.png)
![[Uncaptioned image]](2111.09077v1/37-spec-resid-eps-converted-to.png)
![[Uncaptioned image]](2111.09077v1/40-spec-resid-eps-converted-to.png)
![[Uncaptioned image]](2111.09077v1/41-spec-resid-eps-converted-to.png)
![[Uncaptioned image]](2111.09077v1/39-spec-resid-eps-converted-to.png)
![[Uncaptioned image]](2111.09077v1/ngc3193-eps-converted-to.png)
![[Uncaptioned image]](2111.09077v1/43-spec-resid-eps-converted-to.png)
![[Uncaptioned image]](2111.09077v1/44-spec-resid-eps-converted-to.png)
![[Uncaptioned image]](2111.09077v1/45-spec-resid-eps-converted-to.png)
![[Uncaptioned image]](2111.09077v1/ngc3319-eps-converted-to.png)
![[Uncaptioned image]](2111.09077v1/47-spec-resid-eps-converted-to.png)
![[Uncaptioned image]](2111.09077v1/ngc3395-eps-converted-to.png)
![[Uncaptioned image]](2111.09077v1/49-spec-resid-eps-converted-to.png)
![[Uncaptioned image]](2111.09077v1/ngc3448-eps-converted-to.png)
![[Uncaptioned image]](2111.09077v1/ngc3516-eps-converted-to.png)
![[Uncaptioned image]](2111.09077v1/52-spec-resid-eps-converted-to.png)
![[Uncaptioned image]](2111.09077v1/ngc3583-eps-converted-to.png)
![[Uncaptioned image]](2111.09077v1/ngc3600-eps-converted-to.png)
![[Uncaptioned image]](2111.09077v1/55-spec-resid-eps-converted-to.png)
![[Uncaptioned image]](2111.09077v1/56-spec-resid-eps-converted-to.png)
![[Uncaptioned image]](2111.09077v1/57-spec-resid-eps-converted-to.png)
![[Uncaptioned image]](2111.09077v1/58-spec-resid-eps-converted-to.png)
![[Uncaptioned image]](2111.09077v1/59-spec-resid-eps-converted-to.png)
![[Uncaptioned image]](2111.09077v1/60-spec-resid-eps-converted-to.png)
![[Uncaptioned image]](2111.09077v1/ngc3729-eps-converted-to.png)
![[Uncaptioned image]](2111.09077v1/63-spec-resid-eps-converted-to.png)
![[Uncaptioned image]](2111.09077v1/ngc3877-eps-converted-to.png)
![[Uncaptioned image]](2111.09077v1/65-spec-resid-eps-converted-to.png)
![[Uncaptioned image]](2111.09077v1/66-spec-resid-eps-converted-to.png)
![[Uncaptioned image]](2111.09077v1/67-spec-resid-eps-converted-to.png)
![[Uncaptioned image]](2111.09077v1/68-spec-resid-eps-converted-to.png)
![[Uncaptioned image]](2111.09077v1/69-spec-resid-eps-converted-to.png)
![[Uncaptioned image]](2111.09077v1/70-spec-resid-eps-converted-to.png)
![[Uncaptioned image]](2111.09077v1/ngc3982-eps-converted-to.png)
![[Uncaptioned image]](2111.09077v1/ngc3992-eps-converted-to.png)
![[Uncaptioned image]](2111.09077v1/ngc3998-eps-converted-to.png)
![[Uncaptioned image]](2111.09077v1/ngc4013-eps-converted-to.png)
![[Uncaptioned image]](2111.09077v1/ngc4026-eps-converted-to.png)
![[Uncaptioned image]](2111.09077v1/76-spec-resid-eps-converted-to.png)
![[Uncaptioned image]](2111.09077v1/78-spec-resid-eps-converted-to.png)
![[Uncaptioned image]](2111.09077v1/79-spec-resid-eps-converted-to.png)
![[Uncaptioned image]](2111.09077v1/ngc4088-eps-converted-to.png)
![[Uncaptioned image]](2111.09077v1/81-spec-resid-eps-converted-to.png)
![[Uncaptioned image]](2111.09077v1/83-spec-resid-eps-converted-to.png)
![[Uncaptioned image]](2111.09077v1/ngc4111-eps-converted-to.png)
![[Uncaptioned image]](2111.09077v1/85-spec-resid-eps-converted-to.png)
![[Uncaptioned image]](2111.09077v1/86-spec-resid-eps-converted-to.png)
![[Uncaptioned image]](2111.09077v1/87-spec-resid-eps-converted-to.png)
![[Uncaptioned image]](2111.09077v1/88-spec-resid-eps-converted-to.png)
![[Uncaptioned image]](2111.09077v1/ngc4151-eps-converted-to.png)
![[Uncaptioned image]](2111.09077v1/90-spec-resid-eps-converted-to.png)
![[Uncaptioned image]](2111.09077v1/91-spec-resid-eps-converted-to.png)
![[Uncaptioned image]](2111.09077v1/ngc4217-eps-converted-to.png)
![[Uncaptioned image]](2111.09077v1/93-spec-resid-eps-converted-to.png)
![[Uncaptioned image]](2111.09077v1/ngc4258-eps-converted-to.png)
![[Uncaptioned image]](2111.09077v1/95-spec-resid-eps-converted-to.png)
![[Uncaptioned image]](2111.09077v1/ngc4291-eps-converted-to.png)
![[Uncaptioned image]](2111.09077v1/97-spec-resid-eps-converted-to.png)
![[Uncaptioned image]](2111.09077v1/98-spec-resid-eps-converted-to.png)
![[Uncaptioned image]](2111.09077v1/99-spec-resid-eps-converted-to.png)
![[Uncaptioned image]](2111.09077v1/ngc4414-eps-converted-to.png)
![[Uncaptioned image]](2111.09077v1/ngc4449-eps-converted-to.png)
![[Uncaptioned image]](2111.09077v1/103-spec-resid-eps-converted-to.png)
![[Uncaptioned image]](2111.09077v1/104-spec-resid-eps-converted-to.png)
![[Uncaptioned image]](2111.09077v1/105-spec-resid-eps-converted-to.png)
![[Uncaptioned image]](2111.09077v1/ngc4559-eps-converted-to.png)
![[Uncaptioned image]](2111.09077v1/107-spec-resid-eps-converted-to.png)
![[Uncaptioned image]](2111.09077v1/108-spec-resid-eps-converted-to.png)
![[Uncaptioned image]](2111.09077v1/109-spec-resid-eps-converted-to.png)
![[Uncaptioned image]](2111.09077v1/110-spec-resid-eps-converted-to.png)
![[Uncaptioned image]](2111.09077v1/113-spec-resid-eps-converted-to.png)
![[Uncaptioned image]](2111.09077v1/111-spec-resid-eps-converted-to.png)
![[Uncaptioned image]](2111.09077v1/112-spec-resid-eps-converted-to.png)
![[Uncaptioned image]](2111.09077v1/114-spec-resid-eps-converted-to.png)
![[Uncaptioned image]](2111.09077v1/ngc4826-eps-converted-to.png)
![[Uncaptioned image]](2111.09077v1/116-spec-resid-eps-converted-to.png)
![[Uncaptioned image]](2111.09077v1/117-spec-resid-eps-converted-to.png)
![[Uncaptioned image]](2111.09077v1/118-spec-resid-eps-converted-to.png)
![[Uncaptioned image]](2111.09077v1/n5194-eps-converted-to.png)
![[Uncaptioned image]](2111.09077v1/121-spec-resid-eps-converted-to.png)
![[Uncaptioned image]](2111.09077v1/123-spec-resid-eps-converted-to.png)
![[Uncaptioned image]](2111.09077v1/124-spec-resid-eps-converted-to.png)
![[Uncaptioned image]](2111.09077v1/125-spec-resid-eps-converted-to.png)
![[Uncaptioned image]](2111.09077v1/ngc5354-eps-converted-to.png)
![[Uncaptioned image]](2111.09077v1/126-spec-resid-eps-converted-to.png)
![[Uncaptioned image]](2111.09077v1/128-spec-resid-eps-converted-to.png)
![[Uncaptioned image]](2111.09077v1/129-spec-resid-eps-converted-to.png)
![[Uncaptioned image]](2111.09077v1/ngc5395-eps-converted-to.png)
![[Uncaptioned image]](2111.09077v1/ngc5448-eps-converted-to.png)
![[Uncaptioned image]](2111.09077v1/132-spec-resid-eps-converted-to.png)
![[Uncaptioned image]](2111.09077v1/ngc5473-eps-converted-to.png)
![[Uncaptioned image]](2111.09077v1/134-spec-resid-eps-converted-to.png)
![[Uncaptioned image]](2111.09077v1/135-spec-resid-eps-converted-to.png)
![[Uncaptioned image]](2111.09077v1/136-spec-resid-eps-converted-to.png)
![[Uncaptioned image]](2111.09077v1/137-spec-resid-eps-converted-to.png)
![[Uncaptioned image]](2111.09077v1/138-spec-resid-eps-converted-to.png)
![[Uncaptioned image]](2111.09077v1/ngc5866-eps-converted-to.png)
![[Uncaptioned image]](2111.09077v1/140-spec-resid-eps-converted-to.png)
![[Uncaptioned image]](2111.09077v1/141-spec-resid-eps-converted-to.png)
![[Uncaptioned image]](2111.09077v1/ngc5907-eps-converted-to.png)
![[Uncaptioned image]](2111.09077v1/144-spec-resid-eps-converted-to.png)
![[Uncaptioned image]](2111.09077v1/145-spec-resid-eps-converted-to.png)
![[Uncaptioned image]](2111.09077v1/146-spec-resid-eps-converted-to.png)
![[Uncaptioned image]](2111.09077v1/148-spec-resid-eps-converted-to.png)
![[Uncaptioned image]](2111.09077v1/147-spec-resid-eps-converted-to.png)
![[Uncaptioned image]](2111.09077v1/149-spec-resid-eps-converted-to.png)
![[Uncaptioned image]](2111.09077v1/151-spec-resid-eps-converted-to.png)
![[Uncaptioned image]](2111.09077v1/ngc7640-eps-converted-to.png)
![[Uncaptioned image]](2111.09077v1/152-spec-resid-eps-converted-to.png)