An Exploratory Study on Perceptual Spaces of the Singing Voice
Abstract
Sixty participants provided dissimilarity ratings between various singing techniques. Multidimensional scaling, class averaging and clustering techniques were used to analyse timbral spaces and how they change between different singers, genders and registers. Clustering analysis showed that ground-truth similarity and silhouette scores that were not significantly different between gender or register conditions, while similarity scores were positively correlated with participants’ instrumental abilities and task comprehension. Participant feedback showed how a revised study design might mitigate noise in our data, leading to more detailed statistical results. Timbre maps and class distance analysis showed us which singing techniques remained similar to one another across gender and register conditions. This research provides insight into how the timbre space of singing changes under different conditions, highlights the subjectivity of perception between participants, and provides generalised timbre maps for regularisation in machine learning.
Keywords:
voice, vocal perception, singing, singing technique, timbre space, clustering, dissimilarity rating, multidimensional scaling1 Introduction
The human voice is arguably one of the most diverse instruments available to musicians, making use of its own complex structure of source excitation, filtering and articulation functions to produce a wide variety of vocal sounds. In this paper we investigate how the perception of vocal timbre space changes under different listeners biases and singer conditions. We challenge the standard taxonomy of vocal techniques, as labelled in the VocalSet dataset (Wilkins et al. (2018)), and consider how a listener’s musical background affects this. We use psuedo-randomly chosen samples from 6 of this dataset’s singers to represent 5 singing techniques under the different conditions of singer identity, gender and register. Participants produced pairwise dissimilarity ratings between these vocalisations, and the results were analysed using multidimensional scaling, class averaging and cluster analysis. The source code, stimuli and collected data are available online.11 1 https://github.com/Trebolium/VoicePerception
2 Related Work
2.1 Voice Production
There is much literature describing how the mechanics of the voice organs combined with individual morphological differences affect vocal sounds (García-López & Gavilán Bouzas (2010); Sundberg (1987); Kayes (2015); Zhang (2016)), providing detailed insight into how vocal production techniques influence perception of a singer’s voice. A survey of voice transformation techniques by Stylianou (2009) discusses interdependence between vocal mechanisms and how it is a vital consideration when building a model of the voice. García-López & Gavilán Bouzas (2010) compare values and perspectives between artistic and scientific professions specialising in the voice and observe that differences between these two communities lead to a convoluted and inconsistent tapestry of technical terminology often leading to mislabelling or misunderstanding vocal production processes - an observation shared by many others (Sundberg (1987); Gerratt & Kreiman (2001); Sundberg (1981); Proutskova (2019)). The term ‘phonation modes’ classifies specific configurations of the voice organs that lead to a particular timbre quality in the voice (Sundberg (1987)). Proutskova et al. (2013) assert that phonation modes are not linked to singing registers, introducing the question of how changes in pitch affect the timbre while this subset of vocal techniques remains constant.
2.2 Perceptual Studies
An intuitive method for building timbre maps of an instrument is to collect perceptual dissimilarity data between audio clips. These can be formatted into dissimilarity matrices and converted into a representation of fewer dimensions via Multidimensional Scaling (MDS). MDS is especially useful for representing the cognitive process of how humans perceive and generalise the diversity of data within a given domain (Mugavin (2008)). The first to use MDS for perceptual representations were Kruskal (1964); Shepard (1962); Shepard (1962), employing ‘nonmetric’ MDS techniques (due to the rank-ordered nature of the data) to reflect the data monotonically in the MDS representations, which has been commonly used for investigating timbre spaces (Gerratt & Kreiman (2001); McAdams et al. (1995); Wedin & Goude (1972); Krimphoff et al. (1994); Serafini (1993)).
MDS has been adapted for different uses over the years. Carroll & Chang (1970) improved on classical MDS with the algorithm INDSCAL (used by Grey (1977)) which avoids rotational invariance for simplified dimensional interpretation and provides weights relating the contribution of participants’ collected data to these dimensions (Mugavin (2008)). Interpreting the timbral meaning of MDS dimensions often requires a post-hoc analysis to find correlations to audio descriptors (Krimphoff et al. (1994)). McAdams et al. (1995) however, combined perceptual dissimiliarities with acoustic parameters to generate timbre maps using the CLASCAL algorithm (Winsberg & De Soete (1993)), which greatly improved dimensional interpretation.
Iverson & Krumhansl (1993) investigated the influence of entire tones and their corresponding onsets/remainders on timbre spaces, concluding that the salience of acoustic attributes in entire tones cannot be attributed to either their onsets or remainders alone. Interestingly, it has been commonly reported that elements such as attack transients assisted in identifying an instrument, yet without affecting perceptual structures between the instruments/classes (Wedin & Goude (1972); McAdams et al. (1995); Iverson & Krumhansl (1993); Krimphoff et al. (1994); Grey (1977)).
McAdams et al. (1995) used nearest-neighbour clustering analysis to detect significant differences between participants, highlighting instances where some individuals may have misinterpreted instructions. Gerratt & Kreiman (2001) used the K-means algorithm to confirm that their choice of dimensionality separated their three classes into statistically significant clusters. Grey (1977) did similar calculations and applied the HICLUS hierarchical clustering algorithm (Johnson (1967)) to group the stimuli into clusters and assess the compactness of these clusters. Iverson & Krumhansl (1993) averaged dissimilarity values across all participants’ perceptual data in order to generate MDS on averaged values, although it may have been beneficial to use INDSCAL’s participants’ weight values to confirm whether there were outlier participants in the data.
Grey (1977) reports that the order in which comparisons are represented causes differences in judgements between participants, and it is therefore common practice to randomise the presented order of pairwise comparisons. Mehrabi (2018); Gerratt & Kreiman (2001) include repeated examples for rating within experiments to assure intra-participant reliability and consistency. In relation to how participant profiles affected their rating techniques, Wedin & Goude (1972); Carterette & Miller (1974) found that participants’ different levels of musical training did not lead to major systematic differences between them. McAdams et al. (1995) noted similarly, but observed that more musical participants achieved more precise ratings. However Serafini (1993) reported that musicians familiar with the gamalan sounds being evaluated attributed more importance to the attack of the sound than its resonant volume, while non-musicians considered these aspects equally.
3 Experiment
The literature referenced in Section 2.1 describes disagreement and confusion between professionals specialising in the voice when describing and ascribing vocal techniques. As a result of this, we hypothesise that participants’ dissimilarity ratings will cause clusters to diverge significantly from those implied by the ground truth labels. Observing how much variance there is in vocal timbre space between the different conditions of gender, pitch, singer identity and participant musicality will allow us to assess how generalisable a single model of a singing voice can be.
3.1 The Stimuli
3 male and 3 female singers (identified in Section 4) were randomly selected from VocalSet (Wilkins et al. (2018)), a dataset containing audio of singers vocalising a range of pitches and sustained vowels, annotated by the different vocal techniques being used. The techniques straight, belt, breathy, fry, vibrato were selected based on their frequent occurrence in popular Western singing. We extracted 2 separate sets of vocalisations from individual singers’ recordings - each set consisting of either low or high register singing. For each set, 3 one-second audio clips per vocal technique were randomly extracted from the singers vocalisations, provided they obeyed the following rules. The hierarchy of audio sampling for each set is presented in Appendix 0.A.
Only one extract from a specific VocalSet recording could be used per set. Each low/high register set was assigned a ‘central pitch’ which was determined by calculating a mean pitch value from all of the recordings for a given singer and lowering/raising this value by one standard deviation. The average pitch of each audio clip for a given set must be matched (within 2 semitones) to the assigned central pitch. If the average and central pitch do not match, a new audio clip is generated and the matched-pitch check is repeated. Often a singer’s pitch for fry utterances is a number of octaves below their other vocalisations (explained further in Section 4.3), making it impossible to match this technique’s average pitch to the register’s central pitch. If the central pitch cannot be matched after 20 audio clip generations, the low/un-pitched nature of the vocalisation is considered to be a feature of that singer’s fry technique, and the pitch-matching process is bypassed in these circumstances.
There was a notably large variance in perceived volumes between singers and techniques. Extracted audio clips were therefore normalised to make the comparative task easier for participants. Due to an error in automated data collection, dissimilarities relating to 1 random audio clip were not saved correctly, leaving dissimilarity ratings for 14 audio files (instead of 15) to be used.
3.2 Procedure
60 participants were recruited from audio/music-based academic departments as well as the author’s music network, covering a wide range of music-enthusiasts. The study was conducted online using WAET.22 2 Web Audio Evaluation Tool (Jillings et al. (2015)) Participants first completed a questionnaire33 3 Includes ‘Perceptual ability’ questions from GOLD-MSI (Müllensiefen et al. (2014)) which provided the demographic distributions presented in Appendix 0.B. Participants were then instructed to listen to pairs of vocalisations and rate the dissimilarities between them on a continuous scale of 0 - 1 (see Appendix 0.C and 0.D for more details on the interface, instructive text and survey questions used). Participants were told their ratings should be irrespective of deviation in pitch (notes) or utterances (vowels). They were randomly assigned to listen to any of the 12 prepared vocal sets and were subjected to several practice rounds, allowing them to become familiar with the required task and diversity of timbres. Following this was the recorded experiment of 120 pairs of vocal recordings, plus 16 repeated pairs for calculating intra-participant consistency. Participants were also invited to give open feedback at the end of the experiment regarding their experience and the techniques they used for rating. The dissimilarity ratings were then subjected to MDS, clustering, and statistical analysis.
4 Results and Discussion
In this section we report statistically significant results from the data analysis. Participant data was divided into condition groups of singers, genders and registers. We refer to singers by their VocalSet ID, shortened to a ‘letter-index’ format. Participants’ questionnaire responses and feedback provided us with estimates for their perceptual ability (MSI scores); ranked scores for instrumental ability to reflect familiarity with music and singing (non-musician=0, musician=1 and singers=2); and task comprehension. We also calculated intra-participant consistency, generated by the repeated-rating comparisons using RMSE metrics.
4.1 Clustering
Values for the missing data mentioned in Section 3.1 were filled in with participant average ratings to create a uniform structure for all participant dissimilarity matrices. A correlation matrix was generated to show correlation coefficients between these matrices, upon which hierarchical clustering (HC) was performed. We observed that the data did not break off into minor clusters outside majority clusters for values of k=1-5, indicating that outlier matrices of unusual behaviour such as inverse or binary raters were not detected.
To determine how participants perceptually clustered vocalisations, unsupervised clustering with HC algorithms was performed on dissimilarity matrices for k=1-15. We generated optimal k values using the elbow and silhouette score methods (Tan et al. (2018)). A lack of elbows in sum of squared error (SSE) plots implied that participants provided noisy dissimilarity data, or more likely, that distances between vocalisation techniques were fairly similar. Silhouette scores suggested the minimum value of k=2 implying that there is little salience among these singing techniques that would allow them to be segregated into more than 2 clusters.
Ground-truth labels were compared with HC predictions to determine an accuracy score.44 4 Computed using scikit-learn’s adjusted_rand_score() function In total we use SSE, accuracy, and silhouette metrics to measure the performance of clustering. A Mann-Whitney test showed significant differences between conditions for cluster performance metrics for k=5 (ground truth solution) and k=2 (HC solution), as seen in Table 1.
| k | Metric | Conditions with Higher Means | Conditions with Lower Means | U-value |
|---|---|---|---|---|
| 2 | Acc | M1=0.16, M4=0.23, F2=0.16, F5=0.22 | M2=0.02 | 9.5, 3.0, 5.0, 6.0 |
| 2 | Acc | F5=0.22 | M1=0.16 | 13.0 |
| 2 | Acc | M4=0.23, F5=0.22 | F3=0.09 | 14.0, 8.0 |
| 5 | Acc | M1=0.61 | M2=0.09, M4=0.35, F3=0.20, F5=0.32 | 5.0, 15.0, 10.5, 12.5 |
| 5 | Acc | F5=0.32 | M2=0.09 | 11.5 |
| 5 | Sil | M1=0.36, M4=0.35 | M2=0.22 | 5.0, 13.0 |
This table shows compared conditions that exhibited significantly different distributions for a given metric (p0.02). We observe for k=2, that compared to the majority of singers, M2’s cluster accuracy is lower and F5’s cluster accuracy is higher. One similarity between both k solutions is that M2 scores lowest in accuracy, suggesting that this singer’s singing techniques are particularly difficult to perceptually differentiate. For k=5, M1 and M4 silhouette score distributions were higher than those of M2, implying that the clusters perceived for M1 and M4 vocalisations were better separated. There were no significant difference reported for SSE, and none for any metric between gender or register condition groups.
We also tested for correlations across participant profile data and clustering quality metrics for k=5 to see how participant profiles related to perceptions of the ground truth classes. Strong correlations existed between accuracy and silhouette scores (r=0.60, p0.001), moderately negative between silhouette and SSE scores (r=-0.51, p0.001) and faintly negative between accuracy and SSE (r=-0.28, p0.05) due to the similarity in what is being measured. Instrumental rankings had a weak correlation with MSI scores (rs=0.30, p0.02) and moderate correlations with task comprehension (rs=0.40, p0.01) and accuracy/silhouette (rs=0.45/0.30, p0.001/0.02), which suggests that participants’ level of instrumental familiarity allowed them to possess a more structured perception of the voice that was similar to the ground truth. The MSI scores were weakly correlated with SSE/Silhouette scores (r=-0.30/0.27, p0.02/0.05), suggesting self-reported perceptual abilities were only vaguely reflected in cluster performance metrics. SSEs were moderately correlated with intra-participant consistency (rs=0.57, p0.001) showing that participants’ inability to reproduce their ratings is indicative of loose clustering and unstable perceptual structures. Task comprehension was moderately correlated with accuracy (rs=0.53, p0.001) and slightly negatively with SSEs (rs=-0.34, p0.02), showing that task comprehension is indicative of good clustering metrics.
4.2 Class Distance
We averaged all dissimilarity ratings of the same class-pairs within each dissimilarity matrix (class-pair names will be abbreviated to 3 letters in this section). This allowed us to consider how class distances increase/decrease in the timbre space under different conditions. Table 2 shows statistically significant differences between conditions. There were many significant results for singer conditions, but these observations are not particularly meaningful without additional information and so are not included in the table (this is discussed further in Section 5). Dissimilarities for class-pairs (Str - Bel), (Bel - Vib) and (Fry - Vib) were larger for low registers, which is mildly reflected in the corresponding MDS plot in Figure 1. These plots should be noted with caution, as there are a considerable amount of high intra-class dissimilarities present in the data, which can raise issues when attempting to interpret MDS plots as they assume all intra-class dissimilarities to be zero. Certain class-pairs like (Bel - Bel) for males are an example of high intra-class dissimilarity values, implying that males’ reproductions of similar vocal techniques are perceptually diverse for belt. This is also the case for females’ breathy and vibrato classes. Both Table 2 and Figure 1 reflect larger (Str - Bre) distances for males and larger (Fry - Vib) distances for females. Lastly, Figure 1 shows that belt, vibrato and straight techniques are perceptually similar across both register and gender conditions, while fry is consistently most dissimilar from the other classes.
| Condition Group | Class Pair | Condition with Higher Means | Condition with Lower Means | U-value |
| Register | Str - Bel | low=0.59 | high=0.45 | 263.0 |
| Register | Bel - Vib | low=0.58 | high = 0.46 | 301.0 |
| Register | Fry - Vib | low = 0.81 | high = 0.70 | 304.0 |
| Gender | Bel - Bel | male=0.32 | female=0.24 | 303.5 |
| Gender | Str - Bre | male=0.67 | female=0.51 | 235.0 |
| Gender | Fry - Vib | female=0.82 | male=0.70 | 275.0 |
| Gender | Bre - Bre | female=0.21 | male=0.16 | 291.0 |
| Gender | Vib - Vib | female=0.22 | male=0.16 | 298.5 |


4.3 Potential Sources of Noise
VocalSet has some shortcomings that may contribute towards noise in the data. Many recordings contain multiple techniques, despite being labelled exclusively as one. The quality of performances seems to vary considerably between singers. Due to the nature of the fry technique and variance in performance style, its pitch is often several octaves below the singer’s intended pitch (and the dataset’s implied pitch label). The perceived volume also differs between recordings.
Participants reported factors that influenced or dictated their dissimilarity evaluations which are summarised as: performers lack of control, soft/harshness, clean/dirtiness, distortion, dynamics, temporal pitch variation, subglottal pressure, larynx placement, resonance, total amount of notes per sample, melody, emotion, register mechanics and assumed class types. Many of these imply that there is a considerable degree of uncertainty regarding the dissimilarity evaluation task. It is reasonable to believe that these issues may have also caused a significant level of noise in the results.
5 Conclusion
In this study we have shown that participants’ instrumental ability and consistency in their ratings supported similarity between their perceptions of the voice and the ground truth labels, as well as cluster cohesion/separation. We have also shown that there are subtle similarities and differences in the timbre space between genders and registers and that intra-class variance for female vocalisations are wider than for males. Clustering analysis however, showed that participants’ data did not separate into clusters easily. Participant feedback analysis suggested that instructions given to participants could be revised to better articulate how dissimilarity ratings should be evaluated. Part of our assumption was that very minor deviations in pitch would have a negligible affect on timbre perception. However, as pitch variance was distracting for participants, it may be worth focusing soley on sustained single pitches in future work.
In this study, there were significant differences in clustering performances and class distances between singers. Reasons for these are best explored with joint analysis of acoustic descriptors and dissimilarities for vocalisations, allowing us to understand how singers’ acoustic attributes influence clustering behaviour, while also assisting in the interpretation of the MDS dimensions. In future work, we also intend to use the MDS-generated timbre maps for regularisation in generative neural networks for inferring a model of vocal timbre in accord with human perception.
References
- Carroll & Chang ((1970)) Carroll, J.D. & Chang, J. (1970). Analysis of individual differences in multidimensional scaling via an n-way generalization of “Eckart-Young” decomposition. Psychometrika 35 3 283–319. doi:10.1007/BF02310791
- Carterette & Miller ((1974)) Carterette, E.C. & Miller, J.R. (1974). Perceptual space for musical structures. The Journal of the Acoustical Society of America 56 S1 S44-S44. doi:10.1121/1.1914187
- García-López & Gavilán Bouzas ((2010)) García-López, I. & Gavilán Bouzas, J. (2010). The singing voice. Acta Otorrinolaringologica (English Edition) 61 6 441–451. doi:10.1016/S2173-5735(10)70082-X
- Gerratt & Kreiman ((2001)) Gerratt, B.R. & Kreiman, J. (2001). Toward a taxonomy of nonmodal phonation. Journal of Phonetics 29 4 365–381. doi:10.1006/jpho.2001.0149
- Grey ((1977)) Grey, J.M. (1977). Multidimensional perceptual scaling of musical timbres. The Journal of the Acoustical Society of America 61 5 1270–1277. doi:10.1121/1.381428
- Iverson & Krumhansl ((1993)) Iverson, P. & Krumhansl, C.L. (1993). Isolating the dynamic attributes of musical timbre. The Journal of the Acoustical Society of America 94 5 2595–2603. doi:10.1121/1.407371
- Jillings et al. ((2015)) Jillings, N., Moffat, D., De Man, B. & Reiss, J.D. (2015). Web Audio Evaluation Tool: A browse-based listening environment. In 12th Sound and Music Computing Conference. Maynooth, Ireland: .
- Johnson ((1967)) Johnson, S.C. (1967). Hierarchical clustering schemes. Psychometrika 32 3 241–254. doi:10.1007/BF02289588
- Kayes ((2015)) Kayes, G. (2015). How Does Genre Shape thee Vocal Performance of Female Singers? . London: Institute of Education University of London.
- Krimphoff et al. ((1994)) Krimphoff, J., McAdams, S. & Winsberg, S. (1994). Caractérisation du timbre des sons complexes.II. Analyses acoustiques et quantification psychophysique (French) [ Characterisation of the timbre of complex sounds. II. Acoustic analysis and psychophysical quantification]. Le Journal de Physique IV 04 C5 C5-625-C5-628. doi:10.1051/jp4:19945134
- Kruskal ((1964)) Kruskal, J.B. (1964). Multidimensional scaling by optimizing goodness of fit to a nonmetric hypothesis. Psychometrika 29 1 1–27. doi:10.1007/BF02289565
- McAdams et al. ((1995)) McAdams, S., Winsberg, S., Donnadieu, S., Soete, G.D. & Krimphoff, J. (1995). Perceptual scaling of synthesized musical timbres: Common dimensions, specificities, and latent subject classes. Psychological research 58 3 177–192.
- Mehrabi ((2018)) Mehrabi, A. (2018). Vocal imitation for query by vocalisation . London: Queen Mary University of London.
- Mugavin ((2008)) Mugavin, M.E. (2008). Multidimensional Scaling: A Brief Overview. Nursing Research 57 1 64–68. doi:10.1097/01.NNR.0000280659.88760.7c
- Müllensiefen et al. ((2014)) Müllensiefen, D., Gingras, B., Musil, J. & Stewart, L. (2014). The Musicality of Non-Musicians: An Index for Assessing Musical Sophistication in the General Population. PLOS ONE 9 2 e89642. doi:10.1371/journal.pone.0089642
- Proutskova ((2019)) Proutskova, P. (2019). Investigating the Singing Voice: Quantitative and Qualitative Approaches to Studying Cross-Cultural Vocal Production . London: Goldsmiths University of London.
- Proutskova et al. ((2013)) Proutskova, P., Rhodes, C., Crawford, T. & Wiggins, G. (2013). Breathy, Resonant, Pressed – Automatic Detection of Phonation Mode from Audio Recordings of Singing. Journal of New Music Research 42 2 171–186. doi:10.1080/09298215.2013.821496
- Serafini ((1993)) Serafini, S. (1993). Timbre Perception of Cultural Insiders: A Case Study With Javanese Gamel an Instruments . University of British Columbia: University of British Columbia.
- Shepard ((1962)) Shepard, R.N. (19621). The analysis of proximities: Multidimensional scaling with an unknown distance function. I. Psychometrika 27 2 125–140. doi:10.1007/BF02289630
- Shepard ((1962)) Shepard, R.N. (19622). The analysis of proximities: Multidimensional scaling with an unknown distance function. II. Psychometrika 27 3 219–246. doi:10.1007/BF02289621
- Stylianou ((2009)) Stylianou, Y. (2009). Voice Transformation: A survey. In 2009 IEEE International Conference on Acoustics, Speech and Signal Processing ( 3585–3588). doi:10.1109/ICASSP.2009.4960401
- Sundberg ((1981)) Sundberg, J. (1981). Larynx height and voice source. A relationship? Speech Transmission Laboratory. Quarterly Progress and Status Reports 22 3 23–36. Retrieved from http://www.speech.kth.se/prod/publications/files/qpsr/1981/1981_22_2-3_023-036.pdf.
- Sundberg ((1987)) Sundberg, J. (1987). The Science of the Singing Voice. Dekalb, Ill: Cornell University Press.
- Tan et al. ((2018)) Tan, P-N., Steinbach, M., Karpatne, A. & Kumar, V. (2018). Introduction to Data Mining (2edition ed.). New York, New York: Pearson.
- Wedin & Goude ((1972)) Wedin, L. & Goude, G. (1972). Dimension Analysis of the Perception of Instrumental Timbre. Scandinavian Journal of Psychology 13 1 228–240. doi:10.1111/j.1467-9450.1972.tb00071.x
- Wilkins et al. ((2018)) Wilkins, J., Seetharaman, P., Wahl, A. & Pardo, B. (2018). VocalSet: A Singing Voice Dataset. In ISMIR ( 468–474).
- Winsberg & De Soete ((1993)) Winsberg, S. & De Soete, G. (1993). A latent class approach to fitting the weighted Euclidean model, clascal. Psychometrika 58 2 315–330. doi:10.1007/BF02294578
- Zhang ((2016)) Zhang, Z. (2016). Mechanics of human voice production and control. The Journal of the Acoustical Society of America 140 4 2614–2635. doi:10.1121/1.4964509
Appendix 0.A Hierarchical Structure of Session Sets

Appendix 0.B Participant Demographic Distributions

.

Appendix 0.C Interface View
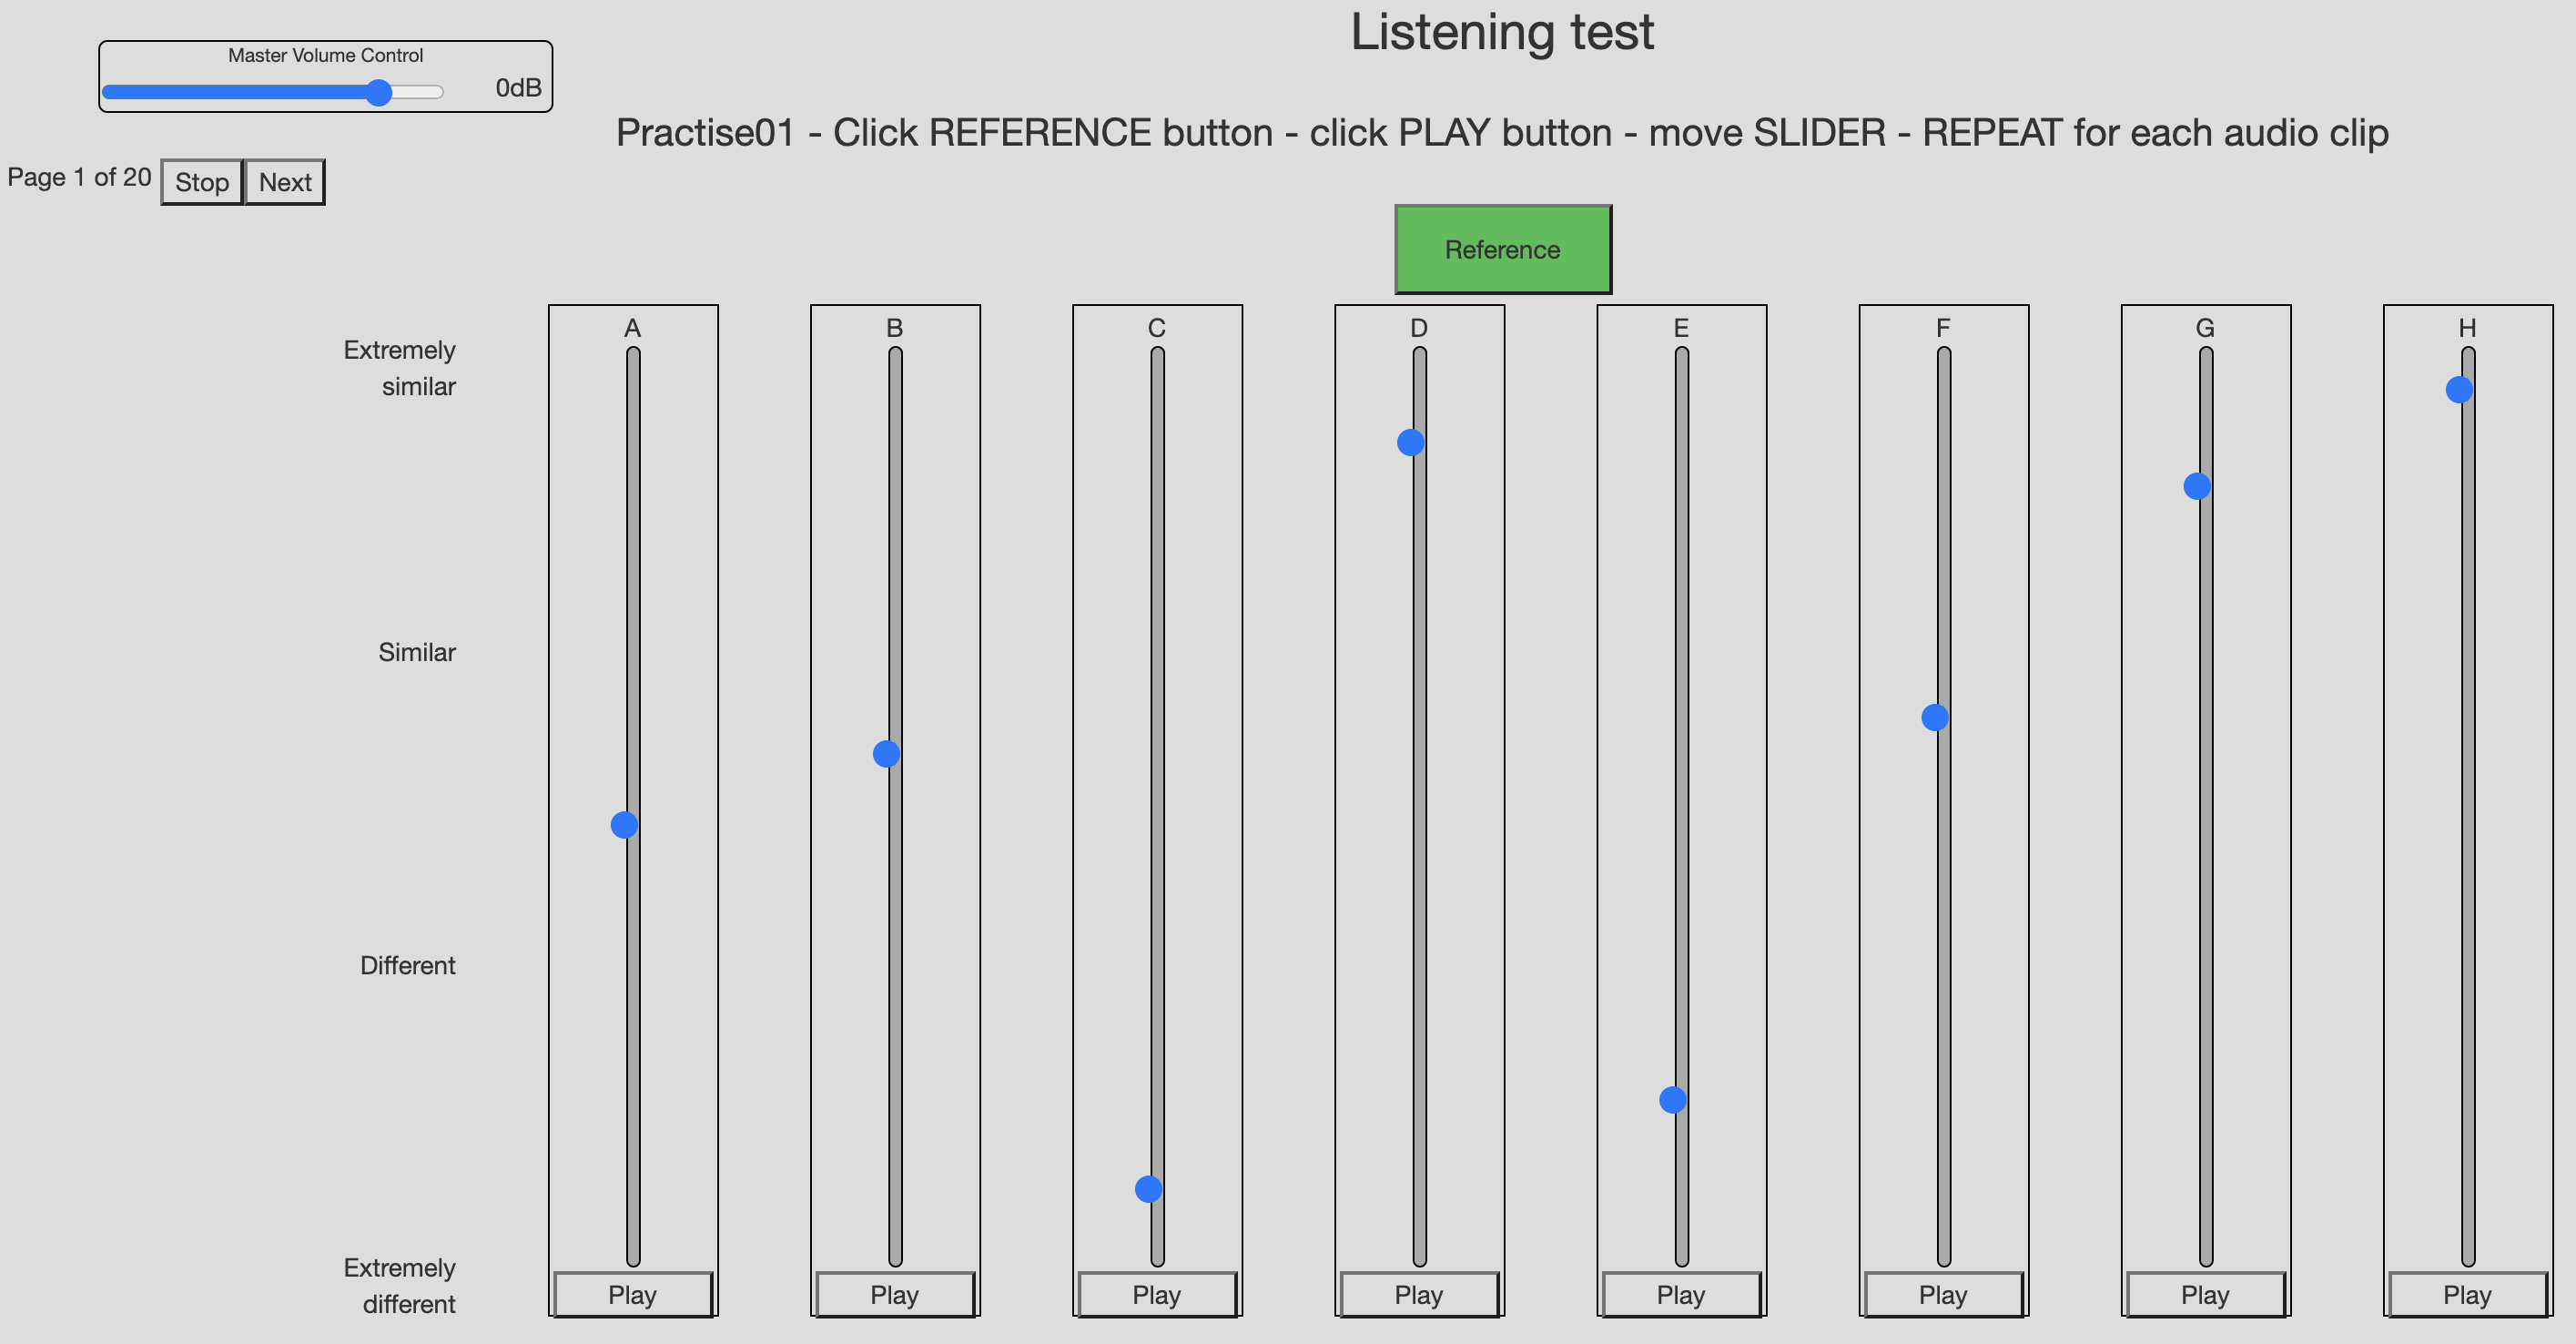
Appendix 0.D Study Texts
0.D.1 GOLD-MSI Perceptual Ability Questions
The following questions were extracted from the GOLD-MSI ‘Perceptual Abilities’ subset (Müllensiefen et al. (2014)), and uses a 7-point agreement scale:
- 1.
I am able to judge whether someone is a good singer or not.
- 2.
I usually know when I’m hearing a song for the first time.
- 3.
I find it difficult to spot mistakes in a performance of a song even if I know the tune.
- 4.
I can compare and discuss differences between two performances or versions of the same piece of music.
- 5.
I have trouble recognizing a familiar song when played in a different way or by a different performer.
- 6.
I can tell when people sing or play out of time with the beat.
- 7.
I can tell when people sing or play out of tune.
- 8.
When I sing, I have no idea whether I’m in tune or not.
- 9.
When I hear a music I can usually identify its genre.
0.D.2 Additional Questions
Apart from question 6, the following questions were taken before the study was conducted:
- 1.
Please indicate what listening equipment you intend to use for this experiment (Headphones are preferrable). If you wish to change your setup, please do so before continuing and refresh this page [Inbuilt speakers, external speaker, ear/headphones]
- 2.
How would you assess your current listening environment on a scale of 1 (very noisy) to 5 (very quiet)? [Integer]
- 3.
Please provide your age in the space below. [Integer]
- 4.
Please provide your gender identity in the space below. [Male, female]
- 5.
What instrument are you best at playing? [Instrument name]
- 6.
Do you have any other comments regarding your evaluations, or any other aspect of the study? [Post-study question, open-ended response]
0.D.3 Task Description
The following text quotes the instructions given to participants regarding the task required of them:
We are interested in measuring how differently listeners perceive the sounds of a singer’s voice when undergoing various singing techniques. In this experiment you will be comparing between multiple, unedited and unprocessed recordings of one individual singer. Your task is to rate how similar or different the singer’s sustained vocalisations sound to you, due to different singing techniques. The challenge therefore, is to rate vocal similarities IRRESPECTIVE of the singer’s changes in pitch (notes) and utterance (vowels) between recordings.