MoRe-Fi: Motion-robust and Fine-grained Respiration Monitoring via Deep-Learning UWB RadarConference: The 19th ACM Conference on Embedded Networked Sensor Systems; November 15–17, 2021; Coimbra, PortugalThe 19th ACM Conference on Embedded Networked Sensor Systems (SenSys’21), November 15–17, 2021, Coimbra, PortugalPrice: 15.00DOI: 10.1145/3485730.3485932ISBN: 978-1-4503-9097-2/21/11CCS: Human-centered computing Ubiquitous and mobile computing design and evaluation methods
Abstract.
Crucial for healthcare and biomedical applications, respiration monitoring often employs wearable sensors in practice, causing inconvenience due to their direct contact with human bodies. Therefore, researchers have been constantly searching for contact-free alternatives. Nonetheless, existing contact-free designs mostly require human subjects to remain static, largely confining their adoptions in everyday environments where body movements are inevitable. Fortunately, radio-frequency (RF) enabled contact-free sensing, though suffering motion interference inseparable by conventional filtering, may offer a potential to distill respiratory waveform with the help of deep learning. To realize this potential, we introduce MoRe-Fi to conduct fine-grained respiration monitoring under body movements. MoRe-Fi leverages an IR-UWB radar to achieve contact-free sensing, and it fully exploits the complex radar signal for data augmentation. The core of MoRe-Fi is a novel variational encoder-decoder network; it aims to single out the respiratory waveforms that are modulated by body movements in a non-linear manner. Our experiments with 12 subjects and 66-hour data demonstrate that MoRe-Fi accurately recovers respiratory waveform despite the interference caused by body movements. We also discuss potential applications of MoRe-Fi for pulmonary disease diagnoses.
Keywords:
Respiratory waveform recovery, contact-free RF-sensing, commercial-grade radars, deep learning, variational encoder-decoder.1. Introduction
Respiratory diseases (Corren et al. 2003; Williams 1993; Soriano et al. 2020) are so common that the deadly health conditions caused by them influence people worldwide: they affect 2.4% of the global population (Vos et al. 2016) and cause 7.6 million deaths per year globally (Organization 2020). Fortunately, most of them can be detected in their early stages with proper monitoring, as symptoms of these diseases, such as airflow obstruction (Fletcher and Peto 1977) and shortness of breath (Holland et al. 2012), are usually reflected on different vital signs including respiratory rate (Pollock et al. 1993; Gift et al. 1992) and fine-grained patterns in the respiratory waveform (Bhatt et al. 2014; Tsuyuki et al. 2020). Traditionally, to obtain such vital signs for disease diagnosis, wearable devices ranging from smartwatches to medical sensors have been used (Hao et al. 2017; Min et al. 2014; Güder et al. 2016; NeuLog 2017; Jia et al. 2017; Fang et al. 2016). Unfortunately, the inconvenience caused by the contact (even intrusive) nature of these sensors has prevented them from being widely adopted under daily environments. To overcome the drawbacks of contact sensing for achieving ubiquitous respiration monitoring, contact-free sensing has attracted increasing attention from both academia and industry (Kaltiokallio et al. 2014; Adib et al. 2015; Wang et al. 2018; Xu et al. 2019; Nguyen et al. 2016; Zheng et al. 2020; Yang et al. 2017; Wang et al. 2019; Song et al. 2020). Among these developments. radio-frequency (RF) sensing leveraging various commercial-grade radars has demonstrated a promising future (Adib et al. 2015; Yang et al. 2017; Zheng et al. 2020; Chen et al. 2021b), thanks to its noise resistance at a reasonable cost.
Ideally, monitoring should be performed continuously so that respiration patterns can be used as markers for intervention or evidence for diagnoses (Brochard et al. 2012; Folke et al. 2003). However, existing RF-sensing systems fail to deliver continuous monitoring as they often assume static human subjects. Facing strong body movements, these systems have to suspend respiration monitoring (Adib et al. 2015; Yue et al. 2018); otherwise, they would obtain noise-like readings as shown in Figure 1.

In reality, we cannot expect subjects to remain static during monitoring for two major reasons. On one hand, human subjects may undergo a constant motion, e.g., typewriting or exercising. On the other hand, unintentional posture drifts (Rasouli et al. 2017) and unconscious movements (e.g., turning-over during sleep) may always occur. Therefore, the static assumption contradicts the intention of continuous monitoring, rendering existing systems less applicable to real-life scenarios. Now the key question becomes: can we design a fine-grained respiration monitoring system working on subjects with body movements?
Answering this question faces four major challenges. First of all, recovering respiratory waveform with RF-sensing is far from trivial even for static subjects, as existing systems often rely on linear filtering (potentially susceptible to nonlinear interference) to obtain coarse-grained waveform or only respiratory rate (Adib et al. 2015; Yue et al. 2018; Zeng et al. 2019). Secondly, the effect of body movements on the complex RF signal has never been put under scrutiny; prior art resorts to either phase or amplitude of RF signals (Yue et al. 2018; Zheng et al. 2020; Chen et al. 2021b). Thirdly, the reflected signals caused by body movements and respiration are composed in a nonlinear manner due to varying body positions, making it extremely hard to separate respiration from motion interference. Last but not least, reflected signals by body movements exhibit various statistical properties that cannot be readily processed by a single model-based method. So far, very few proposals have touched motion-robust respiration monitoring: the RF-sensing methods either incur a high complexity (Chen et al. 2021b) or handle very small-scale movements (Zheng et al. 2020), while the acoustic sensing methods can be susceptible to real-life acoustic interference (Xu et al. 2019; Song et al. 2020).
To tackle these challenges, we propose MoRe-Fi for motion-robust and fine-grained respiration monitoring. We construct MoRe-Fi based on a commercial-grade IR-UWB radar platform (Chen et al. 2021a), leveraging its large bandwidth to achieve high-resolution motion sensing. Given the raw motion-induced IR-UWB signal embedded with fine-grained spatial information, we first analyze how respiration is modulated in the complex in-phase and quadrature (I/Q) components, as well as the limitations of model-based methods in extracting respiratory waveform. Based on the characteristics of I/Q-domain signal representation, we design a corresponding data augmentation process for enriching our dataset, which further drives an IQ Variational Encoder-Decoder (IQ-VED) for robust recovery of respiratory waveform. As the core of MoRe-Fi, IQ-VED captures the complementary I/Q information from the radar signal and encodes it to an interpretable latent representation for facilitating fine-grained respiratory waveform extraction. Our major contributions in designing and implementing MoRe-Fi are as follows:
- •
To the best of our knowledge, MoRe-Fi is the first fine-grained respiration monitoring system operating in a low-complexity and full-scale motion-robust manner.
- •
We analyze the necessity to process radar signal in its complex I/Q domain, instead of leveraging incomplete information, such as only phase or amplitude of the signal.
- •
We propose IQ-VED for recovering and refining respiratory waveform. This novel encoder-decoder architecture fully utilizes the I/Q components together and achieves fine-grained respiratory waveform recovery leveraging the generalizability brought by the variational inference.
- •
We conduct extensive evaluations on MoRe-Fi with a 66-hour dataset; the results strongly confirm its excellent waveform recovery ability under body movements.
The rest of the paper is organized as follows. Section 2 introduces the background for respiration monitoring with IR-UWB radar. Section 3 presents the system design of MoRe-Fi, with detailed implementation discussed in Section 4. Section 5 reports the evaluation results. Potential applications of MoRe-Fi are discussed in Section 6. Related works are presented in Section 7. Finally, Section 8 concludes this paper and points out future directions.
2. Background and preliminaries
In this section, we carefully study the principles of respiration monitoring with an IR-UWB radar. We focus on modeling the radar signal to reflect how it represents respiration in the I/Q domain, hence laying a theoretical foundation for the robust respiration monitoring discussed in Section 3.
2.1. Capturing Breath with IR-UWB Radar
We first explain the working principles of IR-UWB radar on how it captures human respiration. As shown by the system diagram of IR-UWB radar in Figure 2,
each frame is formed by a baseband Gaussian pulse modulated by a cosine carrier at frequency . This frame is then transmitted and reflected by a moving human chest and other irrelevant objects, so as to produce the received signal , where denotes the channel impulse response. After I/Q downconversion, the demodulated complex signal becomes . In Figure 3a, we plot the amplitude of the complex signal; objects at different distances can be clearly differentiated thanks to the large bandwidth.

However, a single frame of the received signal is not enough for respiration monitoring. To observe periodic movements, the radar transmits frames at a regular interval, and stacks the received frames to form a signal matrix , where and are respectively the fast-time and slow-time indices, and is the number of slow-time frames (Zheng et al. 2021a; Ding et al. 2020). We hereafter slightly abuse the terminology by writing as to clearly indicate its matrix nature, as illustrated in Figure 3b. One may easily recognize a breathing person in the matrix, as circled in the red box. Considering a particular corresponding to the respiration, conventional methods individually adopt either amplitude or phase of the slow-time signal to characterize respiration (Adib et al. 2015; Zeng et al. 2019; Yue et al. 2018; Zheng et al. 2020); we plot two such results in Figure 4.


In fact, neither of these two real sequences can fully depict respiratory waveform accurately, despite their periodic structures resembling the “baseband” of respiration. As illustrated in Figure 4, both amplitude and phase waveforms exhibit distortions to various extents, including strength variations (amplitude in Figure 4a) and missing cycles (phase in Figure 4b). To understand why such distortions take place, we analyze (subscript neglected for brevity) on both I/Q components with Equations (1) and (2):
| (1) | |||
| (2) |
where is the strength of the reflected signal from the human chest, is the distance from the radar to the chest, is carrier wavelength, and denotes human chest movement. In both equations, the first terms are caused by respiration, and the second terms and are the offsets caused by body background reflection (BBR). To visualize and , we take the signal of the breathing person (as bounded by the red box in Figure 3b) as an example, and display it as a constellation diagram in Figure 5a. The blue respiration vector in the graph corresponds to the complex signal ; they are the sum of BBR offset (green vector) and respiration-induced variation (red vector). One may observe that, as the human subject breathes, the red vector rotates and the trace of the blue vector forms an elliptic arc. The arc may not be circular because , the radius, is time-varying due to a varying radar cross-section (Lee et al. 2017).
2.2. Interference Caused by Body Movements
To better understand the effects of body movements, we begin by defining their scope, as shown in Figure 6. Basically, our concerned movements should maintain the position of the human subject i) to stay within the Field of View (FoV) of the radar and ii) to have the variable distance between the radar and the subject lying within a reasonable range (e.g., 50 cm) around its mean .
Such a scope encompasses body movements not affecting the chest (e.g., typewriting or limb position drift), as well as even larger-scale ones involving chest motion (e.g., exercising on treadmill or at a fixed spot). It, therefore, forbids the subject to i) drastically change its posture (e.g., from standing to lying) and ii) significantly alter its position (so as to avoid the need for tracking). This movement scope has barely been studied in the literature, as previous “motion-robust” systems mostly tackle small-scale movements, e.g., hand drifts when holding a device (Song et al. 2020) and turning steering wheels during driving (Xu et al. 2019; Zheng et al. 2020). It should be noted that acoustic sensing (Song et al. 2020; Xu et al. 2019) are not applicable to our problem scope, because they are easily interfered with by acoustic noise accompanying large-scale movements (e.g., typewriting or exercising on treadmill) and real-life environments (e.g., music in vehicles).
With the scope defined, we hereby analyze the impacts of body movements on the I/Q signal with a simple experiment. We let a human subject move his body (lean forward and backward, sway left and right) while sitting in a chair. The corresponding shown in Figure 5b demonstrates that body movements prevent the trace of from falling onto a single elliptic arc; the trace is scattered across the I/Q plane in a rather arbitrary manner. The reason is that the BBR offset (caused by reflections from limbs and torso other than the chest) previously presumed to be static is no longer so, resulting in a random shift of the elliptic center . In addition, the distance from the radar to the human subject also varies and further changes the signal phase.11 1 Being a constant in (1) and (2), the distance becomes a variable now. Furthermore, the radar cross-section changes with body movements as well, causing a varying reflected signal strength and hence unpredictable changes in the long/short axes of the ellipse. Last but not least, Figure 5b only shows for a single fast-time index, yet large-scale movements can potentially affect multiple fast-time indices.
2.3. Conventional Respiration Recovery
In order to recover respiratory waveform, conventional approaches measure the human chest displacement ; it is related to the phase change of the respiration vector in Figure 5a by . Because the center of the ellipse may not coincide with the origin due to the BBR offset, is not always obtainable from the raw I/Q signal. To recover the respiratory waveform, a recent proposal (Song et al. 2020) suggests fitting elliptic arcs to (acoustic) I/Q signal and unifies their centers to the origin. Although this method theoretically allows the phase of the respiration vector to be calculated by taking the inverse tangent of the shifted I/Q signal, it is intrinsically designed for quasi-static human subjects, although it can tolerate very small limb position drifts (e.g., hand motions when holding a phone (Song et al. 2020)) by selectively fitting to relatively “clean” data segments free of strong motion interference.
Under stronger movements, the traces of respiration vector in the form of elliptic arcs are no longer identifiable and analyzable, because they are severely deformed and blended, as explained in Section 2.2. As a result, one has to fall back to the 1-D signal projection shown by Figure 4, and hence apply linear processing methods taken by previous works to extract respiration, such as bandpass filter (Ravichandran et al. 2015), Ensemble Empirical Mode Decomposition (EEMD) (Xu et al. 2019), and Variational Mode Decomposition (VMD) (Zheng et al. 2020). We briefly illustrate the recovery results achieved by these 1-D methods in Figure 7, when the subject was exercising on the spot. One may observe that the resulting waveforms are very coarse-grained and lack correct event details (e.g., rate, duration of inhalation and exhalation, as well as tidal volume). Essentially, as these methods fail to properly treat the I/Q scrambling and fast-time crossing issues of large-scale movements, they definitely cannot handle the body movement scope defined in Section 2.2.

Remark
To summarize, in order to recover fine-grained respiratory waveform under strong body movements, we have to fully utilize the I/Q signal and trace its variations across multiple fast-time indices. Nonetheless, since conventional model-based signal processing algorithms have been demonstrated as unable to cope with this situation, we resort to a data-driven approach.
3. System Design
This section introduces the design of MoRe-Fi, whose rough diagram is shown in Figure 8. Upon obtaining the IQ signal matrix from the IR-UWB radar, MoRe-Fi locates respiration by extracting a sub-matrix corresponding to the concerned human subject. It then leverages the rotation invariance in the I/Q domain to augment the sub-matrix. The core of MoRe-Fi is a novel IQ Variational Encoder-Decoder (IQ-VED) neural network to distill respiratory waveform from the sub-matrix. Trained by the ground truth waveform obtained from a wearable sensor (NeuLog 2017), our IQ-VED is capable of recovering fine-grained respiratory waveform under severe interference produced by body movements.
3.1. Locating Respiration
To locate respiration in the signal matrix , MoRe-Fi first uses a loopback filter (Adib et al. 2014) to remove the influence of static background. The static clutter of the system can be described as: and the background subtracted signal can be represented as , where denotes the -th frame and the weight is empirically set to 0.9. Then the Constant False Alarm Rate (CFAR) algorithm (Levanon 1988) kicks in to detect the peaks in using an adaptive threshold; the threshold is estimated by averaging values at neighboring fast-time indices. MoRe-Fi selects multiple fast-time indices adjacent to the detected peaks to form a sub-matrix , and it finally transposes to obtain a new matrix with slow-time index as the argument, as shown in Figure 9.

3.2. Data Augmentation
Before putting the I/Q signal contained in into deep analytics, it is necessary to perform data augmentation for the following reasons. On one hand, data collection is highly non-trivial because one has to coordinate among human subjects, data recording of the IR-UWB radar, and the wearable ground truth sensor. Therefore, it is desirable to increase the diversity of a dataset by applying certain transformations. On the other hand, data augmentation often helps a deep neural network comprehend intrinsic structures of the raw data. For MoRe-Fi, this I/Q-induced intrinsic structure is non-trivially preserved only by rotation but not other transforms such as translation. Therefore, we propose to augment by rotating its every complex element in I/Q domain:
| (3) |
where specifies a rotation angle and it is varied to achieve data augmentation. Figure 10 illustrates five versions of augmented : the rotation preserves the respiration traces, because it affects only the distance (which is anyway varying drastically under body movements, according to Section 2.2) but not the respiration-induced periodic motions of the chest.
As shown in Figure 10, the overlapped respiration ellipses maintain the overall distribution despite varying rotations. In practice, MoRe-Fi may choose to employ more rotation angles for better enriching a dataset.
3.3. Fine-Grained Waveform Recovery
In this section, we first study the background of Variational Encoder-Decoder (VED), then discuss how to adapt VED architecture for I/Q complex signals, and finally provide details on respiratory waveform recovery using IQ-VED.
3.3.1. Design Rationale
Extracting certain signals from a nonlinear signal mixture is highly non-trivial (Hyvärinen and Pajunen 1999; Jutten and Karhunen 2003); the deep learning community has been employing an Encoder-Decoder (ED) network for this task (Luo and Mesgarani 2018; Mimilakis et al. 2017). Unfortunately, the latent space of a regular ED network is not continuous given limited training data, so it lacks sufficient generalization ability when dealing with unseen data. Inspired by the idea of variational inference (Blei et al. 2017; Hoffman et al. 2013), we tackle the problem of latent space irregularity by forcing the encoder to return probability distributions rather than discrete vectors, and we name the modified network Variational Encoder-Decoder (VED). It is worth noting that our VED is fundamentally different from Variational AutoEncoder (VAE) (Kingma and Welling 2013; Rezende et al. 2014): whereas VED aims to extract signal from a nonlinear mixture, VAE intends to learn an efficient representation of the input.
To achieve the objective of MoRe-Fi in respiratory waveform recovery, a regular ED learns an encoder mapping input data to a latent representation , and generates output (i.e., respiratory waveform) by a decoder . In other words, represents the partial features extracted from to characterize only . VED shares the pair of encoder and decoder with ED, but it maps to a Gaussian distribution parameterized by a mean and variance. Essentially, the generative process of the VED is enabled by maximizing the variational lower bound (VLB) (Kingma and Welling 2013):
| (4) |
where is a Gaussian prior on the latent representation and donotes the Kullback-Leibler (KL) divergence (Kullback and Leibler 1951); it works as a regularizer by minimizing the difference between and . In this way, VED gets around the hardness in estimating the (distribution) of directly from , by using the latent representation as an intermediate relay. Moreover, representing as a (continuous) probability distribution rather than a discrete vector set, VED is equipped with a continuous latent space. Upon unseen inputs, this latent space will be sampled in a more meaningful manner than that of a conventional ED. Essentially, the continuous property of the latent space enables VED to avoid overfitting and hence better handle out-of-range inputs.
There is yet one link missing before applying VED to separate respiration from I/Q-represented RF signal mixture: most building blocks for deep learning are based on real-valued operations and representations, how to reform VED to handle complex I/Q signals remains a problem. Previously, deep complex networks (Trabelsi et al. 2018; Potok et al. 2018) have been proposed to handle complex numbers, but they require redefining calculus operations including differentiation crucial to backpropagation (Trabelsi et al. 2018), so they are in general hard to train (with super slow convergence) and hence not widely adopted. The same convergence and complexity issues also apply to neural networks for sequential processing, such as general RNNs that include LSTM (Trinh et al. 2018). Consequently, our IQ-VED performs a bivariate analysis of the I/Q signal, as explained in Section 3.3.2.

3.3.2. IQ-VED Encoder
The encoder of IQ-VED takes in the I/Q signal matrix ( in Section 3.1 for brevity) and encodes it to a latent representation . Specifically, IQ-VED adopts a two-stream design, where the I/Q components and are fed into two separate encoders, as shown in Figure 11. Each encoder consists of i) multiple layers of One-Dimensional Convolutional Neural Network (1D-CNN) (LeCun et al. 1999) for feature extraction, ii) batch norm layers (Ioffe and Szegedy 2015) for normalization, and iii) leaky ReLU (Glorot et al. 2011) layers for adding non-linearity, as illustrated in Figure 12a. Both and are treated as multi-channel 1-D sequences, with each channel corresponding to one fast-time index in .
Essentially, the IQ-VED encoder decomposes the input I/Q signals and filters out motion interference. The resulting respiration-induced signal is compressed and mapped to the latent distribution, which will then be sampled to drive the decoder so as to recover the desired respiratory waveform. The overall convolutional filter aims to extract useful features, so it can be deemed as a demixing function (Khemakhem et al. 2020) to reverse the entanglement between respiration signal and non-linear motion interference. It is well known that processing the I/Q components of complex signals separately, though substantially lowering the training complexity, may cause misalignment. To overcome this problem, we specifically align their respective latent spaces in Section 3.3.3.
3.3.3. Latent Space Alignment
The outputs of the encoder are two Gaussian distributions and parameterized by respective means and variances, according to Equation (4). Since both latent distributions are integral parts of the complex signal representation, IQ-VED should guarantee that their processing (via individual encoders) has been conducted in a coordinated manner. Fortunately, since both in-phase and quadrature signals are 1-D perspectives of the same complex radar signal, they share common structures sufficient to align their corresponding latent representations. To this end, we choose to minimize the 2-Wasserstein distance (Olkin and Pukelsheim 1982) between them:
| (5) |
where denotes the set of all joint distributions that has and as respective marginals. The reason for employing the Wasserstein distance is twofold. On one hand, minimizing the distance shifts the two distributions “close” to each other, enforcing them to encode the same respiration features. On the other hand, unlike KL divergence, Wasserstein distance is able to provide a useful gradient when the distributions are not overlapping (Kolouri et al. 2018). As a result, while most parts of the two distributions are meant to be aligned, some discrepancies inherent to the I/Q components, e.g., amplitude and phase of BBR offset are allowed to be maintained.
In the case of multivariate Gaussian distributions, a closed-form solution of Equation (5) can be obtained according to (Givens et al. 1984):
| (6) |
Since the covariance matrices obtained by IQ-VED are of diagonal form, Equation (6) can be simplified as follows:
| (7) |
where is the Frobenius norm, defined as the square root of the sum of the absolute squares of the matrix elements.
3.3.4. IQ-VED Decoder and Loss Function
As shown in Figure 12b, the decoder can be deemed as the reverse of the encoder. To this end, we replace 1D-CNN in the decoder with 1-D transposed convolutional layers (Zeiler et al. 2010) to upsample the latent representation and map them to a longer sequence, so as to finally derive respiratory waveform . Note that the encoder and decoder are not exactly symmetric: at the last stage of the decoder, a single-channel signal is recovered, instead of a multi-channel one as the input to the encoder. To train IQ-VED, we employ three loss functions, namely the reconstruction loss, the I/Q regularizing loss, and the distribution alignment loss.
Reconstruction Loss
To correctly recover respiratory waveform, this loss function compares the output of IQ-VED decoder with the ground truth obtained by a wearable sensor, and tries to make them similar. loss is used to define the reconstruction loss , which measures the sum of all the squared differences between the two waveforms. This loss practically implements the term in Equation (4):
| (8) |
I/Q Regularizing Loss
In Section 3.3.1, it is pointed out that VED regularizes the latent distribution according to a standard Gaussian prior. For IQ-VED, two distributions from the I/Q encoders should be regularized. The I/Q regularizing losses are defined as:
| (9) | ||||
| (10) |
Distribution Alignment Loss
As described in Section 3.3.3, the misalignment between the two distributions from the I/Q encoders can be measured by a Wasserstein distance. Therefore, the distribution alignment loss is defined according to Equation (7):
| (11) |
Combining these loss functions, the overall loss function for training IQ-VED can be obtained as follows:
| (12) |
where and are the respective weights for regularizing losses and distribution alignment loss. and share the same weight because the I/Q data and encoders are symmetric and of equal importance. In addition, is supposed to be greater than 1, so as to emphasize the representation capacity of the latent variables and encourage disentanglement of the representations (Higgins et al. 2016), as will be confirmed in Section 5.4.4.
3.3.5. Waveform Recovery and Biomarker Recognition
With a well-trained IQ-VED, respiratory waveform can be recovered from radar signal even under motion interference. One immediate way of applying IQ-VED to waveform recovery is to re-sample the latent vectors and from and . However, this leads to non-deterministic outputs that may cause problem in practice. To tackle this problem, we perform a deterministic inference without sampling and as follows:
| (13) |
where the deterministic latent vectors and are obtained as and .
To determine the respiratory rate based on the recovered waveform, Fast Fourier Transform (FFT) can be applied. Since the frequency of respiration ranges from 0.16 Hz to 0.6 Hz, the search space can be narrowed down, and the peak frequency in the range can be identified as the respiratory rate. As an example, a sample respiration given subject exercising on the spot is shown in Figure 13, with both time and frequency representations. In particular, Figure 13b shows that the respiratory rate can be estimated to be 0.24 Hz, or approximately 14.4 beats per minute (bpm). In addition, the instantaneous frequency can also be obtained by taking the reciprocal of the total cycle time.
Apart from respiratory rate, other biomarkers can also be inferred, such as tidal volume () denoting the amount of air that moves in or out of the lungs with each respiratory cycle, total cycle time measuring the total time for a respiration cycle (peak to peak), inspiratory time indicating the time of inhaling in a cycle (valley to peak), expiratory time indicating the time of exhaling in a cycle (peak to valley), and inhalation/exhalation ratio (I/E ratio) representing a compromise between ventilation and oxygenation. By finding the peaks and valleys, and their corresponding timestamp in the recovered waveform, these biomarkers can be calculated. We illustrate all the aforementioned time-related biomarkers in Figure 13a.
4. Implementation
Hardware Implementations
Our MoRe-Fi prototype leverages IR-UWB signals for monitoring human respiration. The core component of MoRe-Fi is a compact and low-cost Novelda X4M05 (Novelda AS 2017) IR-UWB radar transceiver. The radar operates at a center frequency of 7.29 or 8.7 GHz with a bandwidth of 1.5 GHz. The sampling rate of the radar is 23.328 GHz, and the frame rate is set to 50 fps. The radar has a pair of tx-rx antennas with an FoV of in both azimuth and elevation angles. A Raspberry Pi single-board computer (Raspberry Pi Foundation 2021) is used to control the transceiver and to interface with a desktop computer; this computer has an Intel Xeon W-2133 CPU, 16 GB RAM, and a GeForce RTX 2080 Ti graphics card. NeuLog respiration monitor belt logger sensor NUL-236 (NeuLog 2017) is used to collect ground truth respiratory waveform, the sampling rate of the NeuLog sensor is also set to 50 fps, the same as the radar.
Software Implementations
We implement MoRe-Fi based on Python 3.7 and C/C++, with the neural network components built upon PyTorch 1.7.1 (Paszke et al. 2019). To align the ground truth respiration signal from the respiration monitor belt logger and radar signals, the Precision Time Protocol (IEFT 2017) relying on message exchanges over Ethernet is used to synchronize the clocks between hardware components. In the data augmentation process, each signal is rotated from to with an interval of for 60 times. The parameters of IQ-VED are set as follows: and in Equation (12) are set to 3 and 2e-4, respectively. For the encoder, 5 consecutive 1-D convolutional layers are used, whose kernel size is set to 3, stride to 1, padding size to 1; and the number of output channels of these convolutional layers is set to 32, 64, 128, 256, and 512. As for the decoder, 5 consecutive transposed convolutional layers are used, their kernel size is set to 3, stride to 1, scale factor to 2, and the number of output channels of these layers is set to 512, 256, 128, 64, and 32. All weights are initialized by the Xavier uniform initializer (Kumar 2017). Consequently, IQ-VED involves parameters; it incurs multiply-accumulate operations for each signal instance during inference. The collected dataset is divided into training and test sets. The training set contains 8,000 pairs of radar signal matrices and respiration ground truths obtained from NeuLog sensor, and the test set contains 4,000 pairs. The size of the raw training radar signal matrix is . For the training process, the batch size is set to 64, the IQ-VED loss in Equation (12) is adopted, and the learning rate and momentum of the Stochastic Gradient Descent optimizer (Bottou 2012) are respectively set to 0.01 and 0.9.
5. Evaluation
In this section, we perform intensive evaluations on the performance of MoRe-Fi given several real-life scenarios and under various parameter settings.
5.1. Experiment Setup
In order to conduct the evaluations, we recruit 12 volunteers (6 females and 6 males), aged from 15 to 64, and weighing from 50 to 80 kg. All volunteers are healthy, and we measure their respiration in the natural state without the volunteers consciously controlling breathing or undergoing external forceful intervention. The volunteers are asked to carry out 7 common activities with different degrees of body movements: playing on phone, typewriting, exercising on the spot, shaking legs, walking on a treadmill, standing up/sitting down, and turning over in bed, all in real-life environments such as office, gym, and bedroom. For brevity, the names of these movements are abbreviated as PP, TW, ES, SL, WT, SS, and TO, respectively. All experiments have strictly followed the standard procedures of IRB of our institute.
The IR-UWB radar is placed to face a human subject, within a range of 0.5 to 2 m, and on the same height as the chest of the subject. We collect a larger number of data entries for shorter activities (e.g. walking on treadmill that costs several minutes) and a smaller number of data entries for longer activities (overnight sleeping with turning over in bed) so as to guarantee a balanced dataset. Our data collection leads to a 66-hour dataset of RF and ground truth recordings, including approximately 72,000 respiration cycles and roughly the same amount of data from every subject. After collection, both the raw and ground truth data are sliced into 20 s samples. Two-thirds of the collected data are used for training IQ-VED, and the remaining one-third is used for testing the performance of MoRe-Fi in recovering respiratory waveform.
5.2. Metric and Baseline Selection
5.2.1. Cosine Similarity
The cosine similarity between the IQ-VED recovered waveform and the ground truth is used to measure the recovering performance of IQ-VED. Specifically, the cosine similarity is measured by the cosine of the angle between two vectors and , and then determines to what extent the two vectors point to the same “direction” in a high dimensional space. It is defined as follows:
| (14) |
whose value lies in the range of .
5.2.2. Time Estimation Error
In Section 3.3.5, we have discussed several time-related biomarkers that can be deduced from the waveform, including , , and . All of them can be calculated from the timestamps of the peaks and valleys in respiratory waveforms, so we study estimation errors in terms of the peak and valley times. Suppose the timestamps of the peak and valley are and , then the errors are defined as absolute differences between the estimated and actual values, i.e., and .
5.2.3. Respiratory Rate Estimation Error
After recovering peaks and valleys in respiratory waveforms, the instantaneous respiratory rate can be estimated by taking the reciprocal of . The error of respiratory rate is defined as the absolute difference between the estimated respiratory rate and the actual respiratory rate , namely, .
5.2.4. Volume Estimation Error
Besides the event times in the waveform, the amplitude of the waveform is also worthy of exploring, as it can be used to represent the tidal volume of respiration given their proportional relation. Since we are not interested in the absolute value of the waveform amplitude, we define the relative error of volume as the absolute difference between the estimated value and actual value divided by the actual value .
5.2.5. Baseline Selection
BreathListener (Xu et al. 2019), a respiration monitoring system for driving environments, is picked as a comparison baseline, because BreathListener also claims to take into account motion interference (albeit only small-scale ones) caused by running vehicles. However, we have to port BreathListener to radar as it was designed for acoustic sensing. Essentially, Breathlistener adopts a two-stage processing pipeline. It first employs EEMD (Wu and Huang 2009) to separate respiration from interference. As discussed in Section 2.3, EEMD can only recover coarse-grained waveform (if not incorrect one). Therefore, it further applies a Generative Adversarial Network (GAN) (Goodfellow et al. 2014) for adding details to the recovered waveform.
5.3. Performance Results
We start by performing an overall evaluation, showing intuitive waveform results and cosine similarities under different body movements. We then compare MoRe-Fi with a baseline method. Finally, we measure various estimation errors quantitatively.
5.3.1. Overall Performance
Figure 14 shows the respiratory waveform generated by IQ-VED compared to its corresponding ground truth versions during several 50 s activities.22 2 Although our IQ-VED is trained with 20 s samples, its CNN-based encoder is flexible enough to accommodate an arbitrary sample length in practice. In Figure 14a, it can be observed that the motion interference caused by typewriting is sporadic, but the intensive interference period can affect the non-intensive one by shifting the phase of respiration significantly (the respiratory waveform can be roughly observed during the latter period). Fortunately, MoRe-Fi not only recovers respiratory waveform during the intensive period, but also corrects the phase throughout the whole period, at a minor cost of waveform deforming during the transitional phase. Compared with Figure 14a, both ES (Figure 14b) and WT (Figure 14c) incur more stationary motion interference with WT being much more intensive, clearly affecting respiration to a greater extent and causing deterioration in both respiratory waveforms and . As the last example, Figure 14d shows that, though TO (during the time span of s and s) affects the signal phase significantly, IQ-VED successfully recovers respiration both when the human subject is lying quasi-statically and turning over.
To further explore how individual body movement types affect the performance of MoRe-Fi, the cosine similarity under each body movement is studied in Figure 15. PP and SL can be observed as having the least impact on the MoRe-Fi performance, as the body parts involved in the movements are far from the subject’s chest. As expected, WT and SS cause the worst performance of MoRe-Fi since they both induce large body movements that severely interfere with the respiration signal. Overall, the average cosine similarity between the recovered and ground truth respiratory waveform is 0.9162, indicating a very successful recovery, as a similarity greater than 0.8 suggests a strong positive correlation.
5.3.2. Comparison with Baseline Method
We compare MoRe-Fi with BreathListener (Xu et al. 2019) in terms of recovered waveform quality in Figure 16. Two examples are shown in Figure 16a and 16b to directly contrast the waveforms, then comparisons in terms of three metrics are provided in the remaining subfigures. In general, MoRe-Fi recovers respiratory waveform accurately, whereas BreathListener tends to generate distorted (sometimes even erroneous) waveform when the body movements become more intensive. In Figures 16c, 16d, and 16e, MoRe-Fi exhibits a much better performance in cosine similarity, respiratory rate estimation, and peak/valley time estimation than the baseline, all thanks to its motion-robust design.
The inferior performance of BreathListener can be attributed to the mismatch between EEMD and GAN adopted by it. As discussed in Section 2.3, the EEMD algorithm is incapable of handling complex I/Q signals, so one has to first project the I/Q signals to a 1-D sequence in an information-lossy manner. A consequence of this drawback is that motion interference cannot be correctly separated, as illustrated in Figure 7. Given the potentially erroneous decomposition of EEMD, GAN that already suffers from instability during training (Shmelkov et al. 2018) becomes even harder to converge. For those converged cases, the EEMD decomposed waveform is already close to ground truth, though possibly with wrong features (e.g., phase) that GAN barely helps to correct. Consequently, the biomarkers inferred from the BreathListener recovered waveform can have very large errors, as shown in In Figures 16d and 16e.
On the contrary, our IQ-VED is trained and operates in an integrated manner: it uses the encoder to decompose signal and the decoder to reconstruct respiratory waveform. As a result, MoRe-Fi is far more effective than the baseline, as demonstrated by these comparisons.
5.3.3. Estimation Errors of Indicators
Given the overall performance of MoRe-Fi reported in the previous sub-sections, we hereby pay special attention to the estimation errors of several indicators. Naturally, the performance of MoRe-Fi in estimating instantaneous respiratory rate is first evaluated in Figure 17, showing a very consistent accuracy with the majority of errors being under 0.1 bpm. Similar to the cosine similarity, both PP and SL have the least impact on rate estimation, while WT and SS cause the worst performance because they entail large body movements.
To evaluate the accuracy of time-related biomarkers such as , , and , we inspect the estimation errors of the peak and valley times on respiratory waveform, and the results are shown in Figure 18. It can be observed that most of the mean errors are below 0.1 s, indicating high accuracy of MoRe-Fi’s event time estimation. An interesting phenomenon is that the errors of valley time are noticeably larger than those of the peak time; this can be attributed to the fact that the valleys in the waveform, as shown in Figure 14, are relatively “flatter” than the peaks, thus making it harder for IQ-VED to capture and recover the exact times of the valleys.
Finally, the performance of tidal volume estimation is reported in Figure 19, which shows that the mean errors for all seven body movements are below 3%, and more than 75% of the errors are below 5%. Similar to previous sections, we find that PP and SL have the least impact on rate estimation, while WT and SS cause the worst performance. Particularly, it appears that SS has the most adverse effects on the result, which can be explained by the fact that the chest displacement caused by a human subject standing up or sitting down varies the most (comparing with other body movements) along the propagation direction of radar signals. Overall, these promising results suggest that MoRe-Fi has the potential to further enable lung volume monitoring, as will be discussed in Section 6.
5.4. Impact of Practical Factors
Because biomarkers can all be inferred from respiratory waveform, we focus on evaluating the cosine similarity of the waveforms in this section.
5.4.1. Human Subjects
We show the cosine similarities of MoRe-Fi recovered respiratory waveform for all 12 subjects in Figure 20. Based on the figure, one may readily conclude that the mean cosine similarities are always greater than 0.95, and more than 75% of all similarities are above 0.85. These results show that the respiratory waveform recovery of MoRe-Fi remains accurate across all involved subjects, largely insensitive to physical discrepancies among them.
5.4.2. Training Set Size
As stated in Section 4, we collect 8,000 data samples of subjects performing different activities for training the IQ-VED network of MoRe-Fi. Figure 22 shows the impact of training set size on the cosine similarity between the recovered and ground truth waveforms. One may observe that, as the training set size increases, the cosine similarity first increases and then comes to saturation. Specifically, MoRe-Fi achieves a cosine similarity greater than 0.9 with 6,000 training samples, which corresponds to 33 hours of activity data. Because more training data improve the waveform recovery performance only by a negligible margin, our selection of 8,000 training samples is sufficient.
5.4.3. Latent Space Dimension
Another property of IQ-VED that affects the recovery performance is the number of latent space dimensions. On one hand, a small latent space dimension may limit the capacity of the latent representation and potentially prevent the loss function from converging to a sufficiently small value. On the other hand, as most practical signals are sparse, overly increasing the dimension of the latent space can be unnecessary while causing slow convergence in training. Consequently, a competent system should strike a balance between expressiveness and compactness of the latent space. According to Figure 22 that shows the impact of latent space dimension on the cosine similarity between the recovered and ground truth waveforms, the performance first improves with the dimension thanks to a better expressiveness but degrades after the dimension reaching 64 due to the increased hardness in training. Therefore, 64 is chosen as the dimension of the latent space for IQ-VED.
5.4.4. Weights of the Loss Function
The weights in Equation (12) are crucial parameters to be tuned for IQ-VED. In theory, a larger encourages continuity and disentanglement of the latent space, potentially improving the generalization capability of IQ-VED. A larger improves the alignment of the I/Q representations but may restrict their expressiveness of the underlying I/Q signal. To determine the optimal weights, Figure 23 shows the cosine similarity between the recovered and ground truth waveforms as the functions of individual weights; one can clearly observe that and allow IQ-VED to achieve the best performance in waveform recovery.
5.4.5. Subject Clothing
In the experiments, we ask the subjects to wear different clothes and record respective measurements accordingly. The results shown in Figure 25 involve four types of clothes: i) lightweight T-shirt, ii) heavyweight T-shirt, iii) coat+lightweight T-shirt, and iv) coat + heavyweight T-shirt. According to Figure 25, MoRe-Fi reaches an overall average cosine similarity above 0.9 across all types of clothes. Intuitively, MoRe-Fi does performs slightly better when a subject wears less, because heavier clothes attenuate more severely the reflected signals from the subject’s chest. Fortunately, even in the worst case (with coat and heavy T-shirt), the average cosine similarity remains well above 0.8.
5.4.6. Sensing Distance
Sensing distance is a major limiting factor of RF respiration monitoring system. We ask the human subjects to be away from the radar at 0.5 m, 1 m, 1.5 m, and 2 m to study the impact of sensing distance. Not surprisingly, the cosine similarities reported in Figure 25 clearly demonstrate a negative effect of sensing distance on performance. Nonetheless, the average cosine similarity remains above 0.8 even under the most intensive body movements, firmly proving the effectiveness of MoRe-Fi.
6. Potential Medical Adoptions
MoRe-Fi is expected to not only continuously extract respiratory waveform, but also enable earlier intervention for people with potential pulmonary disease. Unfortunately, we cannot fully evaluate the second one due to the lack of subjects with related diseases and of the support from medical professionals. Therefore, instead of evaluating the performance in disease diagnosis, we hereby give a brief discussion on potential medical adoptions of MoRe-Fi.
The biomarkers evaluated in Sections 3.3.5 and 5.3.3 are directly obtainable from the timestamps and amplitude of respiratory waveform; they certainly reflect changes in respiratory patterns and hence can serve as indicators to a series of health conditions, including apnea (cessation of breathing) (White 2006), tachypnea (abnormally rapid breathing) (Avery et al. 1966), hyperpnea (abnormally slow breathing) (Aaron et al. 1992), dyspnea (Manning and Schwartzstein 1995) (shortness of breath), Cheyne-Stokes respiration (progressively deeper breathing followed by a gradual decrease that results in an apnea) (Lanfranchi et al. 1999), and Biot respiration (regular deep inhalations followed by periods of apnea) (Farney et al. 2008).
In addition to the directly observable biomarkers, respiration flow can also be derived from the fine-grained waveform. Because respiration flow can be seen as the derivative of respiration volume, and respiration volume is proportional to the amplitude of the recovered waveform , we have , where denotes time, and is a scaling factor. We further apply the noise-robust differentiator (Holoborodko 2008) to get the respiration flow :
| (15) |
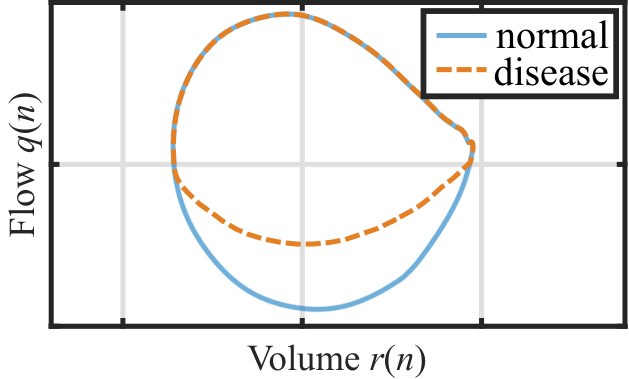
where , is the time interval between two consecutive points, , , and is the number of points used to estimate derivative. An example is provide in Figure 26a. By tracing the change of flow and volume together, the flow-volume loop graph is obtained in Figure 26b, which clearly visualizes both inhalation and exhalation processes.
The shape of the flow-volume loop can provide diagnostic information for many chronic pulmonary diseases related to abnormal airflow, as illustrated in Figure 27. Figures 27a to 27d respectively demonstrate i) restrictive lung disease as a result of a decreased lung volume (Naji et al. 2006), ii) obstructive lung disease caused by obstruction to airflow when exhaling (Flenley 1985), iii) fixed upper airway obstruction occurring when infections spread along the planes formed by the deep cervical fascia (Miller et al. 1985), and iv) variable extrathoracic obstruction resulting from tumors of the lower trachea or main bronchus (Haponik et al. 1981).


The capabilities of continuous, motion-robust monitoring potential lung diseases make MoRe-Fi useful in many scenarios. To take a few examples, MoRe-Fi can be deployed in hospitals, nursing facilities, as well at homes. In hospitals, the long-term respiration data provided by MoRe-Fi allow effective triage and ongoing care management. In nursing facilities and at home, health professionals and normal users will become more aware of the respiratory status of the care recipients, and any sudden changes in the recovered respiratory waveform can be addressed immediately to prevent further exacerbation. Moreover, in the recent COVID-19 pandemic, MoRe-Fi can be deployed to enable earlier intervention, and prevent the spread of the deadly infectious disease.
7. Related Work
Existing works on respiration monitoring can be roughly categorized into wearable sensor-based methods (NeuLog 2017; Güder et al. 2016; Min et al. 2014; Chu et al. 2019; Fang et al. 2016) and contact-free methods (Kaltiokallio et al. 2014; Xu et al. 2019; Song et al. 2020; Wang et al. 2019; Min et al. 2010; Ravichandran et al. 2015; Adib et al. 2015; Yang et al. 2017; Nguyen et al. 2016). The contact nature of wearable sensors causes time-consuming adoptions, degrades user experience, and may even change users’ respiration habits (Gu and Li 2015), so our paper focuses on innovating contact-free respiration monitoring. Contact-free respiration monitoring exploits either RF-sensing (Kaltiokallio et al. 2014; Ravichandran et al. 2015; Adib et al. 2015; Nguyen et al. 2016; Yang et al. 2017; Zeng et al. 2019; Zheng et al. 2020) or acoustic sensing (Wang et al. 2018; Xu et al. 2019; Song et al. 2020; Wang et al. 2019; Min et al. 2010).33 3 We deliberately omit the light sensing methods (e.g., (van Gastel et al. 2016)) as they rely on a camera to perform motion tracking, which is both complicated and ineffective: it certainly cannot handle large-scale body movements faced by MoRe-Fi. Being a typical RF-sensing system, MoRe-Fi aims to achieve both motion-robust and fine-grained respiratory waveform recovery, hence our brief literature survey emphasizes these two aspects when discussing both sensing media.
RF-based respiration monitoring started with estimating respiratory rate and recovering coarse-grained waveform of human subjects in static conditions (Kaltiokallio et al. 2014; Adib et al. 2015; Ravichandran et al. 2015; Yang et al. 2017; Zhang et al. 2017; Zeng et al. 2019; Yue et al. 2018), readily achievable by basic spectrum analysis and filtering. Because these methods do not take motion-robustness into account, they simply suspend respiration monitoring upon encountering sudden motion interference. To achieve motion robustness, early proposals (Li and Lin 2008; Muñoz-Ferreras et al. 2016) rely on tricky placements of multiple radars, so as to cancel out motion interference at the cost of cumbersome synchronization. Later researchers have also tried to apply linear filtering for mitigating the effects of motion interference (Tu et al. 2016; Lv et al. 2018), but their assumptions of unrealistic 1-D body movements (Tu et al. 2016) or the existence of quasi-static periods during movements (Lv et al. 2018) are too strong to be realistic. The latest proposal V2iFi (Zheng et al. 2020) employs an adapted VMD algorithm for removing motion interference from turning steering wheel and the running vehicle, but it achieves coarse-grained respiration monitoring by leveraging only the amplitude of RF signal.
Besides RF-sensing, acoustic sensing is an alternative candidate for respiration monitoring due to its readily deployable consumer-grade hardware. C-FMCW (Wang et al. 2018) and BreathJunior (Wang et al. 2019) adopt either continuous-wave or white-noise for respiration monitoring. They both target respiratory rate by assuming a subject to remain static. BreathListener (Xu et al. 2019) targets respiratory waveform recovery in driving environments by tackling only small-scale body movements. As explained in Section 5.3.2, the two-stage algorithm adopted there is both complex and incompatible between its two stages. SpiroSonic (Song et al. 2020) monitors human lung function by turning the speaker and microphone of a smartphone into a spirometer; it leverages deep learning to extract several vital indicators such as peak expiratory flow, forced expiratory volume, and forced vital capacity. Though SpiroSonic is not a continuous respiration monitoring system as MoRe-Fi does, it does tolerate very small-scale hand drifts when holding a phone, by selectively fitting to relatively “clean” data segments free of strong motion interference. In general, acoustic sensing has limited applicability because they are prone to ambient and motion-induced acoustic interference.
8. Conclusion
Taking an important step toward continuous and ubiquitous health care, we have proposed MoRe-Fi in this paper for motion-robust and contact-free respiration monitoring, aiming to recover fine-grained waveform rather than respiratory rate only. Built upon a radar platform (Chen et al. 2021a) and up-to-date deep learning technologies, MoRe-Fi expands the scope of contact-free vital sign monitoring by tackling full-scale body movements gracefully. Essentially, though existing signal processing methods unanimously fail to handle the composition between body movements and respiration-induced chest motion, our IQ-VED (the core of MoRe-Fi) succeeds by exerting its non-linear decomposition ability. Via extensive experiments on healthy subjects, we have demonstrated the promising performance of MoRe-Fi in fine-grained waveform recovery and long-term respiration monitoring. As this line of work progresses, we are planning to evaluate MoRe-Fi’s performance in real-life clinical scenarios, as we believe this work has significant implications to various medical applications including pulmonary disease diagnosis. Moreover, we are planning to exploit the spatial diversity of offered by large-scale antenna arrays (Zhang et al. 2014; Zheng et al. 2021b) to approach the issue of monitoring vital signs of a walking subject.
Acknowledgments
We are grateful to the anonymous reviewers for their valuable and constructive comments. We would also like to thank WiRUSH (WiRUSH/AIWiSe 2019) for providing fund to develop MoRe-Fi.
References
- (1)
- Aaron et al. (1992) E.A. Aaron, K.C. Seow, B.D. Johnson, and J.A. Dempsey. 1992. Oxygen Cost of Exercise Hyperpnea: Implications for Performance. Journal of Applied Physiology 72, 5 (1992), 1818–1825.
- Adib et al. (2014) Fadel Adib, Zach Kabelac, Dina Katabi, and Robert C. Miller. 2014. 3D Tracking via Body Radio Reflections. In Proc. of the 10th USENIX NSDI. 317–329.
- Adib et al. (2015) Fadel Adib, Hongzi Mao, Zachary Kabelac, Dina Katabi, and Robert C. Miller. 2015. Smart Homes that Monitor Breathing and Heart Rate. In Proc. of the 33rd ACM CHI. 837–846.
- Avery et al. (1966) Mary Ellen Avery, Olga Baghdassarian Gatewood, and George Brumley. 1966. Transient Tachypnea of Newborn: Possible Delayed Resorption of Fluid at Birth. American Journal of Diseases of Children 111, 4 (1966), 380–385.
- Bhatt et al. (2014) Surya P. Bhatt, Young-il Kim, James M. Wells, William C. Bailey, Joe W. Ramsdell, Marilyn G. Foreman, Robert L. Jensen, Douglas S. Stinson, Carla G. Wilson, David A. Lynch, et al. 2014. FEV1/FEV6 to Diagnose Airflow Obstruction. Comparisons with Computed Tomography and Morbidity Indices. Annals of the American Thoracic Society 11, 3 (2014), 335–341.
- Blei et al. (2017) David M. Blei, Alp Kucukelbir, and Jon D. McAuliffe. 2017. Variational Inference: A Review for Statisticians. Journal of the American statistical Association 112, 518 (2017), 859–877.
- Bottou (2012) Léon Bottou. 2012. Stochastic Gradient Descent Tricks. In Neural Networks: Tricks of the Trade. Springer, 421–436.
- Brochard et al. (2012) Laurent Brochard, Greg S. Martin, Lluis Blanch, Paolo Pelosi, F. Javier Belda, Amal Jubran, Luciano Gattinoni, Jordi Mancebo, V. Marco Ranieri, Jean-Christophe M. Richard, et al. 2012. Clinical Review: Respiratory Monitoring in the ICU-A Consensus of 16. Critical Care 16, 2 (2012), 1–14.
- Chen et al. (2021b) Zhe Chen, Tianyue Zheng, Chao Cai, and Jun Luo. 2021b. MoVi-Fi: Motion-robust Vital Signs Waveform Recovery via Deep Interpreted RF Sensing. In Proc. of the 27th ACM MobiCom. 1–14.
- Chen et al. (2021a) Zhe Chen, Tianyue Zheng, and Jun Luo. 2021a. Octopus: A Practical and Versatile Wideband MIMO Sensing Platform. In Proc. of the 27th ACM MobiCom. 1–14.
- Chu et al. (2019) Michael Chu, Thao Nguyen, Vaibhav Pandey, Yongxiao Zhou, Hoang N. Pham, Ronen Bar-Yoseph, Shlomit Radom-Aizik, Ramesh Jain, Dan M. Cooper, and Michelle Khine. 2019. Respiration Rate and Volume Measurements Using Wearable Strain Sensors. NPJ digital medicine 2, 1 (2019), 1–9.
- Corren et al. (2003) Jonathan Corren, Alkis Togias, and Jean Bousquet. 2003. Upper and Lower Respiratory Disease. CRC Press.
- Ding et al. (2020) Shuya Ding, Zhe Chen, Tianyue Zheng, and Jun Luo. 2020. RF-Net: A Unified Meta-Learning Framework for RF-Enabled One-Shot Human Activity Recognition. In Proc. of the 18th ACM SenSys. 517–530.
- Fang et al. (2016) Biyi Fang, Nicholas D. Lane, Mi Zhang, Aidan Boran, and Fahim Kawsar. 2016. BodyScan: Enabling Radio-based Sensing on Wearable Devices for Contactless Activity and Vital Sign Monitoring. In Proc. of the 14th ACM MobiSys. 97–110.
- Farney et al. (2008) Robert J. Farney, James M. Walker, Kathleen M. Boyle, Tom V. Cloward, and Kevin C. Shilling. 2008. Adaptive Servoventilation (ASV) in Patients with Sleep Disordered Breathing Associated with Chronic Opioid Medications for Non-Malignant Pain. Journal of Clinical Sleep Medicine 4, 4 (2008), 311–319.
- Flenley (1985) D.C. Flenley. 1985. Sleep in Chronic Obstructive Lung Disease. Clinics in Chest Medicine 6, 4 (1985), 651–661.
- Fletcher and Peto (1977) Charles Fletcher and Richard Peto. 1977. The Natural History of Chronic Airflow Obstruction. Br Med J 1, 6077 (1977), 1645–1648.
- Folke et al. (2003) Mia Folke, Lars Cernerud, Martin Ekström, and Bertil Hök. 2003. Critical Review of Non-Invasive Respiratory Monitoring in Medical Care. Medical and Biological Engineering and Computing 41, 4 (2003), 377–383.
- Gift et al. (1992) Audrey G. Gift, Trellis Moore, and Karen Soeken. 1992. Relaxation to Reduce Dyspnea and Anxiety in COPD Patients. Nursing Research (1992).
- Givens et al. (1984) Clark R. Givens, Rae Michael Shortt, et al. 1984. A Class of Wasserstein Metrics for Probability Distributions. The Michigan Mathematical Journal 31, 2 (1984), 231–240.
- Glorot et al. (2011) Xavier Glorot, Antoine Bordes, and Yoshua Bengio. 2011. Deep Sparse Rectifier Neural Networks. In Proc. of the 14th AISTATS. 315–323.
- Goodfellow et al. (2014) Ian J. Goodfellow, Jean Pouget-Abadie, Mehdi Mirza, Bing Xu, David Warde-Farley, Sherjil Ozair, Aaron Courville, and Yoshua Bengio. 2014. Generative Adversarial Networks. In Proc. of The 27th NIPS. 1–9.
- Gu and Li (2015) Changzhan Gu and Changzhi Li. 2015. Assessment of Human Respiration Patterns via Noncontact Sensing using Doppler Multi-Radar System. Sensors 15, 3 (2015), 6383–6398.
- Güder et al. (2016) Firat Güder, Alar Ainla, Julia Redston, Bobak Mosadegh, Ana Glavan, T.J. Martin, and George M. Whitesides. 2016. Paper-based Electrical Respiration Sensor. Angewandte Chemie International Edition 55, 19 (2016), 5727–5732.
- Hao et al. (2017) Tian Hao, Chongguang Bi, Guoliang Xing, Roxane Chan, and Linlin Tu. 2017. MindfulWatch: A Smartwatch-based System for Real-Time Respiration Monitoring during Meditation. In Proc. of the 19th ACM UbiComp. 1–19.
- Haponik et al. (1981) Edward F. Haponik, Eugene R. Bleecker, Richard P. Allen, Philip L. Smith, and Joseph Kaplan. 1981. Abnormal Inspiratory Flow-Volume Curves in Patients with Sleep-Disordered Breathing. American Review of Respiratory Disease 124, 5 (1981), 571–574.
- Higgins et al. (2016) Irina Higgins, Loic Matthey, Arka Pal, Christopher Burgess, Xavier Glorot, Matthew Botvinick, Shakir Mohamed, and Alexander Lerchner. 2016. beta-VAE: Learning Basic Visual Concepts with a Constrained Variational Framework. (2016).
- Hoffman et al. (2013) Matthew D. Hoffman, David M. Blei, Chong Wang, and John Paisley. 2013. Stochastic Variational Inference. Journal of Machine Learning Research 14, 5 (2013).
- Holland et al. (2012) Anne E. Holland, Catherine J. Hill, Alice Y. Jones, and Christine F. McDonald. 2012. Breathing Exercises for Chronic Obstructive Pulmonary Disease. Cochrane Database of Systematic Reviews 10 (2012).
- Holoborodko (2008) Pavel Holoborodko. 2008. Smooth Noise Robust Differentiators. http://www.holoborodko.com/pavel/numerical-methods/numerical-derivative/smooth-low-noise-differentiators/.
- Hyvärinen and Pajunen (1999) Aapo Hyvärinen and Petteri Pajunen. 1999. Nonlinear Independent Component Analysis: Existence and Uniqueness Results. Neural Netw. 12, 3 (1999), 429–439.
- IEFT (2017) IEFT. 2017. Precision Time Protocol Version 2 (PTPv2). Accessed: 2021-04-30.
- Ioffe and Szegedy (2015) Sergey Ioffe and Christian Szegedy. 2015. Batch Normalization: Accelerating Deep Network Training by Reducing Internal Covariate Shift. In Proc. of ICML. PMLR, 448–456.
- Jia et al. (2017) Zhenhua Jia, Amelie Bonde, Sugang Li, Chenren Xu, Jingxian Wang, Yanyong Zhang, Richard E. Howard, and Pei Zhang. 2017. Monitoring a Person’s Heart Rate and Respiratory Rate on a Shared Bed using Geophones. In Proc. of the 15th ACM SenSys. 1–14.
- Jutten and Karhunen (2003) Christian Jutten and Juha Karhunen. 2003. Advances in Nonlinear Blind Source Separation. In Proc. of the 4th Int. Symp. on Independent Component Analysis and Blind Signal Separation (ICA2003). 245–256.
- Kaltiokallio et al. (2014) Ossi Kaltiokallio, Hüseyin Yiğitler, Riku Jäntti, and Neal Patwari. 2014. Non-Invasive Respiration Rate Monitoring using a Single COTS TX-RX Pair. In Proc. of the 13th ACM IPSN. IEEE, 59–69.
- Khemakhem et al. (2020) Ilyes Khemakhem, Diederik Kingma, Ricardo Monti, and Aapo Hyvarinen. 2020. Variational Autoencoders and Nonlinear ICA: A Unifying Framework. In Proc. of the 20th AISTATS. PMLR, 2207–2217.
- Kingma and Welling (2013) Diederik P. Kingma and Max Welling. 2013. Auto-Encoding Variational Bayes. In Proc. of ICLR. 1–14.
- Kolouri et al. (2018) Soheil Kolouri, Phillip E. Pope, Charles E. Martin, and Gustavo K. Rohde. 2018. Sliced Wasserstein Auto-Encoders. In Proc. of ICLR. 1–19.
- Kullback and Leibler (1951) Solomon Kullback and Richard A. Leibler. 1951. On Information and Sufficiency. The Annals of Mathematical Statistics 22, 1 (1951), 79–86.
- Kumar (2017) Siddharth Krishna Kumar. 2017. On Weight Initialization in Deep Neural Networks. arXiv preprint arXiv:1704.08863 (2017).
- Lanfranchi et al. (1999) Paola A. Lanfranchi, Alberto Braghiroli, Enzo Bosimini, Giorgio Mazzuero, Roberto Colombo, Claudio F. Donner, and Pantaleo Giannuzzi. 1999. Prognostic Value of Nocturnal Cheyne-Stokes Respiration in Chronic Heart Failure. Circulation 99, 11 (1999), 1435–1440.
- LeCun et al. (1999) Yann LeCun, Patrick Haffner, Léon Bottou, and Yoshua Bengio. 1999. Object Recognition with Gradient-Based Learning. In Shape, Contour and Grouping in Computer Vision. Springer, 319–345.
- Lee et al. (2017) Alexander Lee, Xiaomeng Gao, Jia Xu, and Olga Boric-Lubecke. 2017. Effects of Respiration Depth on Human Body Radar Cross Section Using 2.4 GHz Continuous Wave Radar. In 2017 39th Annual International Conference of the IEEE Engineering in Medicine and Biology Society (EMBC). IEEE, 4070–4073.
- Levanon (1988) Nadav Levanon. 1988. Radar Principles. Wiley.
- Li and Lin (2008) Changzhi Li and Jenshan Lin. 2008. Random Body Movement Cancellation in Doppler Radar Vital Sign Detection. IEEE Transactions on Microwave Theory and Techniques 56, 12 (2008), 3143–3152.
- Luo and Mesgarani (2018) Yi Luo and Nima Mesgarani. 2018. TasNet: Time-Domain Audio Separation Network for Real-Time, Single-Channel Speech Separation. In 2018 IEEE International Conference on Acoustics, Speech and Signal Processing (ICASSP). IEEE, 696–700.
- Lv et al. (2018) Qinyi Lv, Lei Chen, Kang An, Jun Wang, Huan Li, Dexin Ye, Jiangtao Huangfu, Changzhi Li, and Lixin Ran. 2018. Doppler Vital Signs Detection in the Presence of Large-Scale Random Body Movements. IEEE Transactions on Microwave Theory and Techniques 66, 9 (2018), 4261–4270.
- Manning and Schwartzstein (1995) Harold L. Manning and Richard M. Schwartzstein. 1995. Pathophysiology of Dyspnea. New England Journal of Medicine 333, 23 (1995), 1547–1553.
- Miller et al. (1985) Albert Miller, Lee K. Brown, and Alvin S. Teirstein. 1985. Stenosis of Main Bronchi Mimicking Fixed Upper Airway Obstruction in Sarcoidosis. Chest 88, 2 (1985), 244–248.
- Mimilakis et al. (2017) Stylianos Ioannis Mimilakis, Konstantinos Drossos, Tuomas Virtanen, and Gerald Schuller. 2017. A Recurrent Encoder-Decoder Approach with Skip-Filtering Connections for Monaural Singing Voice Separation. In 2017 IEEE 27th International Workshop on Machine Learning for Signal Processing (MLSP). IEEE, 1–6.
- Min et al. (2010) Se Dong Min, Jin Kwon Kim, Hang Sik Shin, Yong Hyeon Yun, Chung Keun Lee, and Myoungho Lee. 2010. Noncontact Respiration Rate Measurement System Using an Ultrasonic Proximity Sensor. IEEE Sensors Journal 10, 11 (2010), 1732–1739.
- Min et al. (2014) Se Dong Min, Yonghyeon Yun, and Hangsik Shin. 2014. Simplified Structural Textile Respiration Sensor based on Capacitive Pressure Sensing Method. IEEE Sensors Journal 14, 9 (2014), 3245–3251.
- Muñoz-Ferreras et al. (2016) José-María Muñoz-Ferreras, Zhengyu Peng, Roberto Gómez-García, and Changzhi Li. 2016. Random Body Movement Mitigation for FMCW-radar-based Vital-Sign Monitoring. In IEEE Topical Conference on Biomedical Wireless Technologies, Networks, and Sensing Systems. 22–24.
- Naji et al. (2006) Nizar A. Naji, Marian C. Connor, Seamas C. Donnelly, and Timothy J. McDonnell. 2006. Effectiveness of Pulmonary Rehabilitation in Restrictive Lung Disease. Journal of Cardiopulmonary Rehabilitation and Prevention 26, 4 (2006), 237–243.
- NeuLog (2017) NeuLog. 2017. Respiration Monitor Belt Logger Sensor NUL-236. https://neulog.com/respiration-monitor-belt/. Accessed: 2021-04-28.
- Nguyen et al. (2016) Phuc Nguyen, Xinyu Zhang, Ann Halbower, and Tam Vu. 2016. Continuous and Fine-Grained Breathing Volume Monitoring from Afar Using Wireless Signals. In Proc. of the 35th IEEE INFOCOM. 1–9.
- Novelda AS (2017) Novelda AS. 2017. The World Leader in Ultra Wideband (UWB) Sensing. https://novelda.com/technology/. Accessed: 2021-04-22.
- Olkin and Pukelsheim (1982) Ingram Olkin and Friedrich Pukelsheim. 1982. The Distance between Two Random Vectors with Given Dispersion Matrices. Linear Algebra Appl. 48 (1982), 257–263.
- Organization (2020) World Health Organization. 2020. The Top 10 Causes of Death. https://www.who.int/news-room/fact-sheets/detail/the-top-10-causes-of-death. Accessed: 2021-04-14.
- Paszke et al. (2019) Adam Paszke, Sam Gross, Francisco Massa, Adam Lerer, James Bradbury, Gregory Chanan, Trevor Killeen, Zeming Lin, Natalia Gimelshein, Luca Antiga, et al. 2019. PyTorch: An Imperative Style, High-Performance Deep Learning Library. arXiv preprint arXiv:1912.01703 (2019).
- Pollock et al. (1993) Mark Pollock, Jairo Roa, Joshua Benditt, and Bartolome Celli. 1993. Estimation of Ventilatory Reserve by Stair Climbing: A Study in Patients with Chronic Airflow Obstruction. Chest 104, 5 (1993), 1378–1383.
- Potok et al. (2018) Thomas E. Potok, Catherine Schuman, Steven Young, Robert Patton, Federico Spedalieri, Jeremy Liu, Ke-Thia Yao, Garrett Rose, and Gangotree Chakma. 2018. A Study of Complex Deep Learning Networks on High-performance, Neuromorphic, and Quantum Computers. ACM Journal on Emerging Technologies in Computing Systems (JETC) 14, 2 (2018), 1–21.
- Rasouli et al. (2017) Omid Rasouli, Stanisław Solnik, Mariusz P. Furmanek, Daniele Piscitelli, Ali Falaki, and Mark L. Latash. 2017. Unintentional Drifts During Quiet Stance and Voluntary Body Sway. Experimental brain research 235, 7 (2017), 2301–2316.
- Raspberry Pi Foundation (2021) Raspberry Pi Foundation. 2021. Teach, Learn and Make with Raspberry Pi - Raspberry Pi. https://https://www.raspberrypi.org/. Accessed: 2021-04-28.
- Ravichandran et al. (2015) Ruth Ravichandran, Elliot Saba, Ke-Yu Chen, Mayank Goel, Sidhant Gupta, and Shwetak N. Patel. 2015. WiBreathe: Estimating Respiration Rate Using Wireless Signals in Natural Settings in the Home. In Proc. of the 13rd IEEE PerCom. 131–139.
- Rezende et al. (2014) Danilo Jimenez Rezende, Shakir Mohamed, and Daan Wierstra. 2014. Stochastic Backpropagation and Approximate Inference in Deep Generative Models. In Proc. of ICML. 1278–1286.
- Shmelkov et al. (2018) Konstantin Shmelkov, Cordelia Schmid, and Karteek Alahari. 2018. How Good is My GAN?. In Proc. of the 15th ECCV. 213–229.
- Song et al. (2020) Xingzhe Song, Boyuan Yang, Ge Yang, Ruirong Chen, Erick Forno, Wei Chen, and Wei Gao. 2020. SpiroSonic: Monitoring Human Lung Function via Acoustic Sensing on Commodity Smartphones. In Proc. of The 26th ACM MobiCom. 1–14.
- Soriano et al. (2020) Joan B. Soriano, Parkes J. Kendrick, Katherine R. Paulson, Vinay Gupta, Elissa M. Abrams, Rufus Adesoji Adedoyin, Tara Ballav Adhikari, Shailesh M. Advani, Anurag Agrawal, Elham Ahmadian, et al. 2020. Prevalence and Attributable Health Burden of Chronic Respiratory Diseases, 1990–2017: A Systematic Analysis for the Global Burden of Disease Study 2017. The Lancet Respiratory Medicine 8, 6 (2020), 585–596.
- Trabelsi et al. (2018) Chiheb Trabelsi, Olexa Bilaniuk, Ying Zhang, Dmitriy Serdyuk, Sandeep Subramanian, Joao Felipe Santos, Soroush Mehri, Negar Rostamzadeh, Yoshua Bengio, and Christopher J. Pal. 2018. Deep Complex Networks. In Proc. of ICLR. 1–19.
- Trinh et al. (2018) Trieu Trinh, Andrew Dai, Thang Luong, and Quoc Le. 2018. Learning Longer-Term Dependencies in RNNs with Auxiliary Losses. In Proc. of ICML. PMLR, 4965–4974.
- Tsuyuki et al. (2020) Ross T. Tsuyuki, William Midodzi, Cristina Villa-Roel, Darcy Marciniuk, Irvin Mayers, Dilini Vethanayagam, Michael Chan, and Brian H. Rowe. 2020. Diagnostic Practices for Patients with Shortness of Breath and Presumed Obstructive Airway Disorders: A Cross-Sectional Analysis. CMAJ open 8, 3 (2020), E605.
- Tu et al. (2016) Jianxuan Tu, Taesong Hwang, and Jenshan Lin. 2016. Respiration Rate Measurement Under 1-D Body Motion Using Single Continuous-Wave Doppler Radar Vital Sign Detection System. IEEE Transactions on Microwave Theory and Techniques 64, 6 (2016), 1937–1946.
- van Gastel et al. (2016) Mark van Gastel, Sander Stuijk, and Gerard de Haan. 2016. Robust Respiration Detection from Remote Photoplethysmography. Biomedical Optics Express 7, 12 (2016), 4941–4957.
- Vos et al. (2016) Theo Vos, Christine Allen, Megha Arora, Ryan M. Barber, Zulfiqar A. Bhutta, Alexandria Brown, Austin Carter, Daniel C. Casey, Fiona J. Charlson, Alan Z. Chen, et al. 2016. Global, Regional, and National Incidence, Prevalence, and Years Lived with Disability for 310 Diseases and Injuries, 1990–2015: A Systematic Analysis for the Global Burden of Disease Study 2015. The Lancet 388, 10053 (2016), 1545–1602.
- Wang et al. (2019) Anran Wang, Jacob E. Sunshine, and Shyamnath Gollakota. 2019. Contactless Infant Monitoring Using White Noise. In Proc. of The 25th ACM MobiCom. 52:1–16.
- Wang et al. (2018) Tianben Wang, Daqing Zhang, Yuanqing Zheng, Tao Gu, Xingshe Zhou, and Bernadette Dorizzi. 2018. C-FMCW based Contactless Respiration Detection using Acoustic Signal. In Proc. of the 20th ACM UbiComp. 170:1–20.
- White (2006) David P. White. 2006. Sleep Apnea. Proceedings of the American Thoracic Society 3, 1 (2006), 124–128.
- Williams (1993) Simon Johnson Williams. 1993. Chronic Respiratory Illness. Psychology Press.
- WiRUSH/AIWiSe (2019) WiRUSH/AIWiSe. 2019. Guangxi Wanyun and Guangzhou AIWiSe Technology Co., Ltd. https://www.wirush.ai and https://aiwise.wirush.ai.
- Wu and Huang (2009) Zhaohua Wu and Norden E. Huang. 2009. Ensemble Empirical Mode Decomposition: A Noise-Assisted Data Analysis Method. Advances in Adaptive Data Analysis 1, 01 (2009), 1–41.
- Xu et al. (2019) Xiangyu Xu, Jiadi Yu, Yingying Chen, Yanmin Zhu, Linghe Kong, and Minglu Li. 2019. BreathListener: Fine-Grained Breathing Monitoring in Driving Environments Utilizing Acoustic Signals. In Proc. of the 17th ACM MobiSys. 54–66.
- Yang et al. (2017) Zhicheng Yang, Parth H. Pathak, Yunze Zeng, Xixi Liran, and Prasant Mohapatra. 2017. Vital Sign and Sleep Monitoring using Millimeter Wave. ACM Transactions on Sensor Networks 13, 2 (2017), 1–32.
- Yue et al. (2018) Shichao Yue, Hao He, Hao Wang, Hariharan Rahul, and Dina Katabi. 2018. Extracting Multi-Person Respiration from Entangled RF Signals. In Proc. of the 20th ACM UbiComp. 86:1–22.
- Zeiler et al. (2010) Matthew D. Zeiler, Dilip Krishnan, Graham W. Taylor, and Rob Fergus. 2010. Deconvolutional Networks. In Proc. of the 23rd IEEE CVPR. IEEE, 2528–2535.
- Zeng et al. (2019) Youwei Zeng, Dan Wu, Jie Xiong, Enze Yi, Ruiyang Gao, and Daqing Zhang. 2019. FarSense: Pushing the Range Limit of WiFi-based Respiration Sensing with CSI Ratio of Two Antennas. In Proc. of the 21st ACM UbiComp. 1–26.
- Zhang et al. (2014) Chi Zhang, Feng Li, Jun Luo, and Ying He. 2014. iLocScan: Harnessing Multipath for Simultaneous Indoor Source Localization and Space Scanning. In Proc. of the 12th ACM SenSys. 91—104.
- Zhang et al. (2017) Jin Zhang, Weitao Xu, Wen Hu, and Salil S. Kanhere. 2017. WiCare: Towards in-Situ Breath Monitoring. In Proc. of the 14th EAI MobiQuitous. 126–135.
- Zheng et al. (2020) Tianyue Zheng, Zhe Chen, Chao Cai, Jun Luo, and Xu Zhang. 2020. V2iFi: in-Vehicle Vital Sign Monitoring via Compact RF Sensing. In Proc. of the 22th ACM UbiComp. 70:1–27.
- Zheng et al. (2021a) Tianyue Zheng, Zhe Chen, Shuya Ding, and Jun Luo. 2021a. Enhancing RF Sensing with Deep Learning: A Layered Approach. IEEE Communications Magazine 59, 2 (2021), 70–76.
- Zheng et al. (2021b) Tianyue Zheng, Zhe Chen, Jun Luo, Lin Ke, Chaoyang Zhao, and Yaowen Yang. 2021b. SiWa: See into Walls via Deep UWB Radar. In Proc. of the 27th ACM MobiCom. 1–14.