Gamma-ray spectral properties of the Galactic globular clusters: constraint on the numbers of millisecond pulsars
Abstract
We study the -ray spectra of 30 globular clusters (GCs) thus far detected with the Fermi Gamma-ray Space Telescope. Presuming that -ray emission of a GC comes from millisecond pulsars (MSPs) contained in, a model that generates spectra for the GCs is built based on the -ray properties of the detected MSP sample. We fit the GCs’ spectra with the model, and for 27 of them, their emission can be explained with arising from MSPs. The spectra of the other three, NGC 7078, 2MS-GC01, and Terzan 1, can not be fit with our model, indicating that MSPs’ emission should not be the dominant one in the first two and the third one has a unique hard spectrum. We also investigate six nearby GCs that have relatively high encounter rates as the comparison cases. The candidate spectrum of NGC 6656 can be fit with that of one MSP, supporting its possible association with the -ray source at its position. The five others do not have detectable -ray emission. Their spectral upper limits set limits of MSPs in them, consistent with the numbers of radio MSPs found in them. The estimated numbers of MSPs in the -ray GCs generally match well those reported for radio pulsars. Our studies of the -ray GCs and the comparison nearby GCs indicate that the encounter rate should not be the only factor determining the number of -ray MSPs a GC contains.
Keywords:
Globular star clusters (656) — Gamma-rays sources (633) — Millisecond pulsars (1062)I Introduction
From high-energy observations with the Large Area Telescope (LAT) onboard the Fermi Gamma-ray Space Telescope (Fermi), globular clusters (GCs) in our Milky Way have been identified as a class of -ray sources in the sky (Abdo et al. 2009; Abdollahi et al. 2020). Thus far, approximately 30 GCs have been detected at -rays (Abdo et al. 2009; Abdo et al. 2010; Kong et al. 2010; Tam et al. 2011; Zhou et al. 2015; Zhang et al. 2016; Lloyd et al. 2018; de Menezes et al. 2019; Song et al. 2021; see also Table 1). Their -ray emission presumably arises from millisecond pulsars (MSPs) that are contained in. One side is because that pulsars have been established by Fermi LAT as the dominant -ray sources in the Milky Way (Abdo et al. 2013; Abdollahi et al. 2020), and on the other side GCs, due to their 10 Gyr old ages and high star densities (e.g., Harris 1996), naturally contain compact binaries (see, e.g., Henleywillis et al. 2018; Oh et al. 2020; Zhao et al. 2020) that enable MSP formation. Direct observational evidence has also been found showing -ray MSPs in the GCs (Freire et al. 2011; Wu et al. 2013; Johnson et al. 2013).

Using the -ray detections, the numbers of -ray MSPs and the related properties of the GCs have been studied. Assuming a typical -ray luminosity value, the numbers for MSPs in each GCs can be estimated (Abdo et al. 2010). Moreover, the numbers should be correlated with the stellar encounter rates (as well as with the metallicities), , where is the central cluster density and the cluster core radius. Studies have indicated the possible presence of the correlation (Abdo et al. 2010; Hui et al. 2011; de Menezes et al. 2019). In Figure 1, we show the GCs from the catalog given by Harris 1996, among which the -ray-detected GCs are marked. The latter do appear to have large , although it can be noted that several high- ones at comparably close distances (e.g., 5 kpc) have not been reported to have detectable -ray emission. Also there is a possible trend showing farther GCs have smaller , the reason for which is not clear, but we may speculate that and/or of the distant GCs (i.e., the left top ones in Figure 1) could be underestimated. As the simple estimation for given above could suffer large uncertainties (e.g., Bahramian et al. 2013), we consider the values as a very approximate indicator.
The numbers of -ray MSPs in each GCs may be further investigated by using the spectral information obtained with Fermi LAT. -ray emission of pulsars generally has a form of a power law with an exponential cutoff (PLEC; Abdo et al. 2013), while specifically for MSPs, Xing & Wang 2016 have determined the spectral parameter ranges using the spectra of 39 -ray MSPs known at the time. The -ray spectra of the GCs have a similar PLEC form (e.g., Abdo et al. 2010), and there are the particular cases, NGC 6624 and NGC 6626 (M28), which were found to have detectable -ray emission coming from a single bright MSP (Freire et al. 2011; Wu et al. 2013; Johnson et al. 2013). Given the relatively well determined spectral shape for MSPs, -ray emission of the GCs can be studied by fitting their spectra with that of MSPs and thus the numbers of MSPs in the GCs can be estimated. Previously, -ray spectra of the GCs have been studied in detail by Lloyd et al. 2018 and (Song et al. 2021) through spectral fitting using different models. Spectral types different from PLEC or additional spectral components have been claimed to be present, resulting in suggestions that other types of high-energy sources in the GCs may also contribute to the observed -ray emission. A study with consideration of MSPs as the main sources in the GCs would potentially be able to help clarify the picture, checking if other components are needed in addition to the MSPs’ PLEC component.
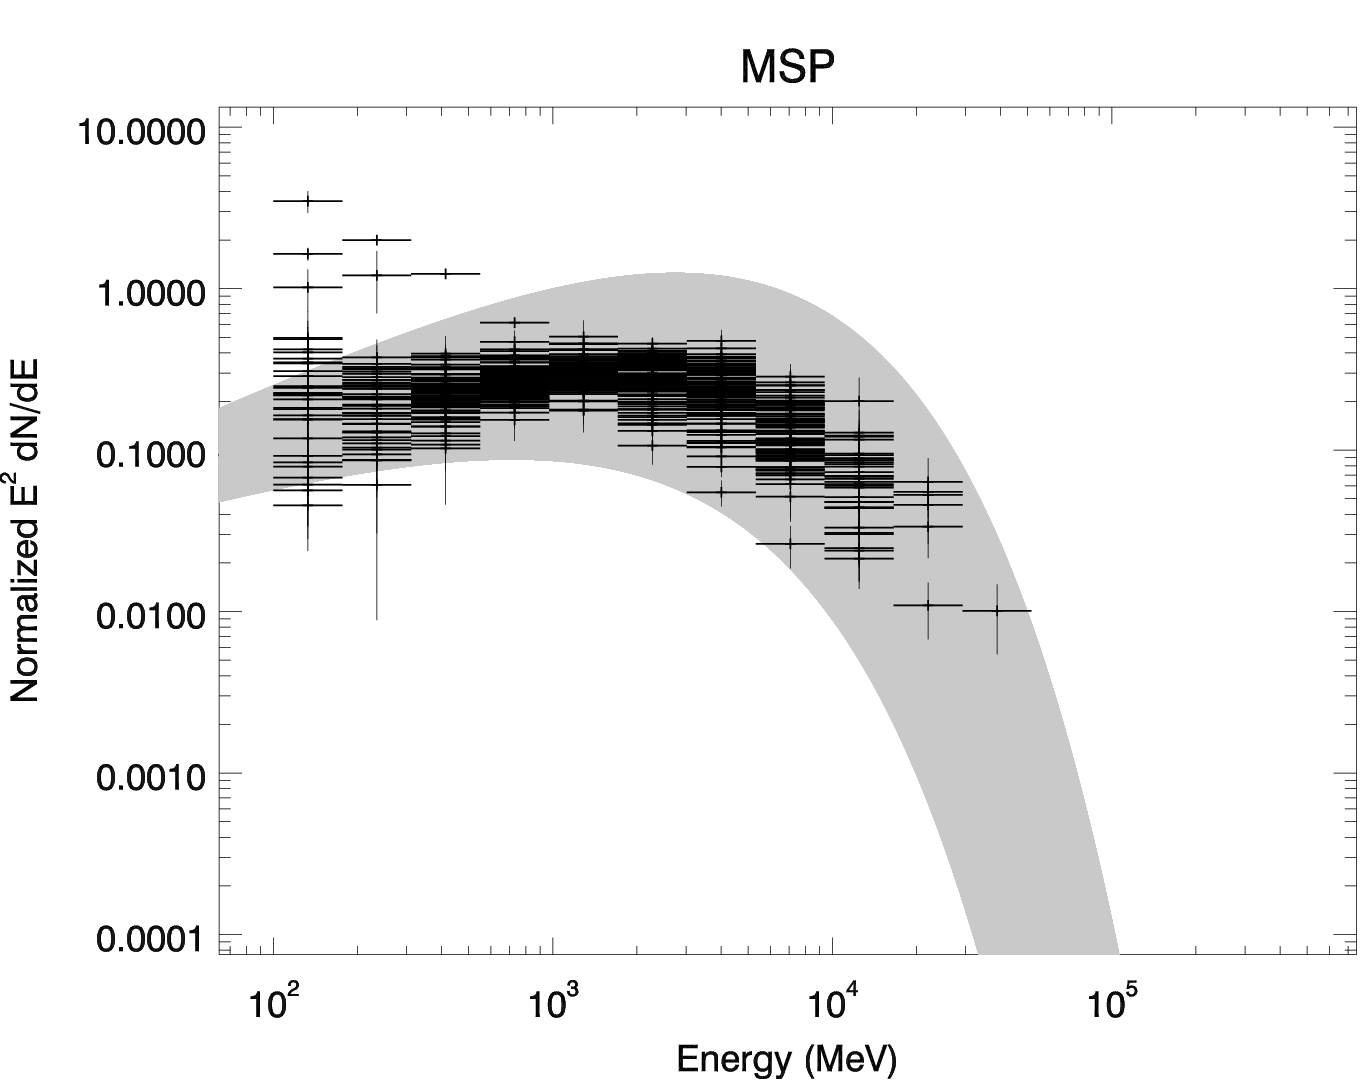
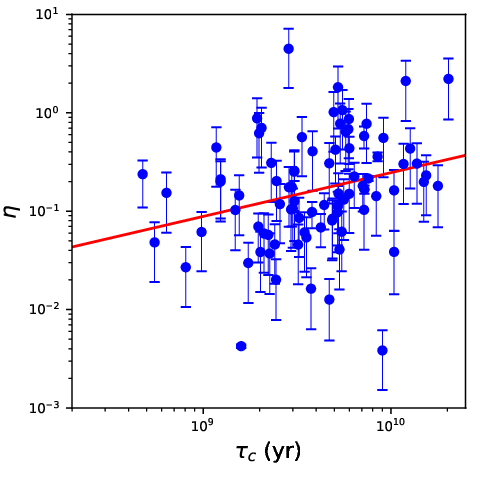
We thus conducted studies of the -ray spectra of the GCs, by fitting them with those generated from the typical MSP -ray spectral parameters. In the studies, we first obtained the -ray spectra of 104 MSPs reported11 1 https://confluence.slac. stanford.edu/display/GLAMCOG/Public+List+of+LAT-Detected+Gamma-Ray+Pulsars, and following Xing & Wang 2016 determined the spectral parameter ranges for their PLEC form. Among the MSPs, 85 were found to have estimated distance and age values, providing a relationship between -ray efficiency and characteristic age for -ray-emitting MSPs. We then obtained the -ray spectra of 30 GCs (Table 1; not including NGC 6624 and NGC 6626 since their emission is dominated by a bright -ray MSP). For each of the GCs, we generated a number of MSPs whose spin period values were randomly given based on the distribution of the 85 -ray MSPs and was assumed to be that of the GC. The spectra of the generated MSPs were randomly produced from the spectral parameter ranges. As the distance of a GC is relatively well known, the spectrum, added from those of the generated MSPs, was obtained, where the – relationship was used to assign -ray luminosities to the MSPs . The model spectrum was compared with the observed -ray spectrum of the GC, allowing to determine the number of MSPs and check the MSP scenario for -ray emission of GCs.
Using this method, the -ray spectra of the 30 GCs were studied. In addition, six GCs (cf., Figure 1) with relatively high and 5 kpc distances, but no -ray emission were also studied as the comparison cases. Below in Section II, we describe the analysis of the Fermi LAT data to obtain the spectra of 104 -ray MSPs and those of the GCs. The detailed procedure for modeling and spectral fitting is given in Section III. The results are presented in Section IV, and discussed in Section V.
II Fermi LAT Data analysis
II.1 Spectral analysis for -ray MSPs
In the analysis, 108 MSPs listed in the released Fermi LAT 10-year source catalog (4FGL-DR2; Ballet et al. 2020) were taken as our targets. We selected the 0.1–500 GeV LAT events within region centered at the position of each targets. The time duration of the data was from 2008-08-04 15:43:36 (UTC) to 2020-11-25 12:26:35 (UTC). Following the recommendations of the LAT team22 2 http://fermi.gsfc.nasa.gov/ssc/data/analysis/scitools/, we excluded the events with zenith angles larger than 90 degrees (to prevent the contamination from the Earth’s limb) and the events with quality flags of ‘bad’.
We constructed a source model for each of the targets based on 4FGL-DR2, which include the catalog sources within 20-degree radius centered at a target. Their spectral forms are provided in the catalog. In our analysis, the spectral normalization parameters of the sources within 5 degree from a target were set free, and all other parameters of the sources in the source model were fixed to their catalog values. An MSP target was set as a point source having power-law emission with photon spectral index fixed at 2.0. The background Galactic and extragalactic diffuse spectral models (gll_iem_v07.fits and iso_P8R3_SOURCE_V2_v1.txt respectively) were also included in the source model, with their normalizations set as free parameters in the analysis.
We extracted the -ray spectra of the MSP targets by performing the maximum likelihood analysis of the LAT data in 15 evenly divided energy band from 0.1 to 500 GeV in logarithmic scale. For the spectra, we kept spectral data points with test statistic (TS) values greater than 16. Among the 108 MSPs, four were found to have spectral data points and thus they were excluded from the sample. A total of 670 data points were obtained for 104 MSPs.
II.2 Spectral Analysis for the -ray GCs
In the analysis, the 30 -ray GCs listed in 4FGL-DR2 were taken as the targets (Table 1). The time period of the LAT events we used was from 2008-08-04 15:43:36 to 2021-07-06 04:59:55 (UTC), and the updated extragalactic diffuse spectral model iso_P8R3_SOURCE_V3_v1.txt was used in the source models. Except these, the data selection and source model construction were the same as those for the -ray MSPs.
We extracted the -ray spectra of the GCs by performing the maximum likelihood analysis in 10 evenly divided energy band from 0.1 to 500 GeV in logarithmic scale. Because the GCs are relatively faint due to their large distances and we would like to have as many as possible data points for their spectra, we kept spectral data points with TS values greater than 4 (2 significance) and calculated the 95% flux upper limits otherwise.
II.3 Analysis for the six nearby GCs
We also searched for -ray emission from six nearby GCs, which are NGC 3201, NGC 6121, NGC 6254, NGC 6366, NGC 6544, and NGC 6656. Only NGC 6656 was found to have -ray emission at its position (for its properties, see Table 1), which had a TS value of 157 in 0.1–500 GeV. However this possible -ray counterpart was marked with ASSOC2 in 4FGL-DR2, indicating that the association probability is not sufficiently high.
We obtained the spectral upper limits for the five none-detected GCs and spectral fluxes and upper limits for NGC 6656 following the procedure given above in Section II.2.


III Modeling and spectral fitting
III.1 Spectral parameter range determination for the -ray MSPs
Following the procedure described in Xing & Wang 2016, we determined the spectral shape based on the spectra of the 104 -ray MSPs. The spectral data points of each MSPs were normalized with the corresponding 0.1–100 GeV energy flux given in 4FGL-DR2, and the normalized 104 spectra are shown in Figure 2. We fit these data points with a power law with a sub-exponential cutoff (PLSEC), , where is the cutoff energy and is fixed to 2/3, a characteristic value for -ray pulsars listed in 4FGL-DR2. was obtained for given and values by requiring the integrated energy flux to be 1.
In our fitting to the spectral data points, a systematic uncertainty parameter of 0.1 was added to the flux uncertainties in quadrature, possibly representing the intrinsic spectral differences of the targets. With this value added, the minimum reduced was approximately equal to 1. At a 3- confidence level, and GeV were obtained. The 3 region is shown in Figure 2.
III.2 -ray efficiency and characteristic age distribution of -ray MSPs
For the 104 -ray MSPs, we searched their spin-down rate and distance information in literature, and 85 of them were found to have the information (listed in Table 2). From spin period and , the spin-down luminosities and were calculated. The -ray luminosities were also obtained, where the energy fluxes in 0.1–100 GeV were from 4FGL-DR2 and most of the 85 MSPs only had distances estimated from the dispersion measures (DMs). For the DM distances, a 30% uncertainty was assumed. Then -ray efficiency was calculated from .
Values of and of the 85 MSPs are shown in the left panel of Figure 3. We note that four MSPs have face values of greater than 1. The unphysical values could be caused by over-estimation of distance values or the uncertain beam correction factor (we followed Abdo et al. 2013 and assumed ). There appears to have a trend between and : older pulsars tend to have larger . Using the linear least squares method, we found a relationship of (see Figure 3).
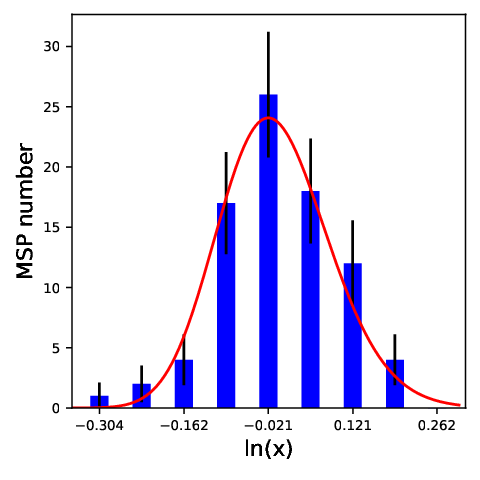
Nearly an order of magnitude scatters are present around the relationship. In order to have them accounted for, we calculated the perpendicular distance (denoted by ) of each MSPs in the left panel of Figure 3 from the relationship, and their distribution along the direction perpendicular to the relationship was obtained (right panel of Figure 3). While the distribution is close to being Gaussian, we found that it was slightly better fit with a log-normal function , where is the value at the distribution peak. From the fitting, we obtained and , where the minimum for 5 degrees of freedom (DoF).
III.3 Characteristic ages of the GC MSPs
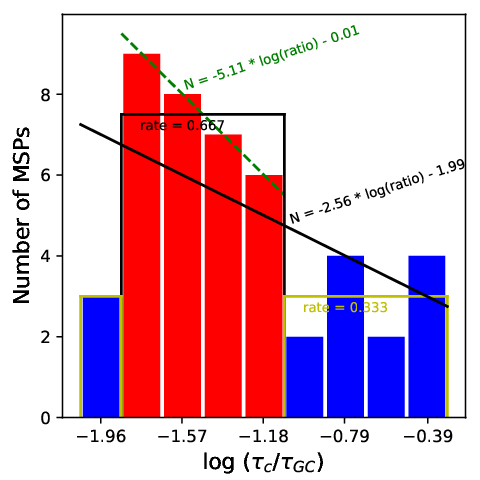
We collected the characteristic ages of the MSPs listed in the GC radio pulsar catalog33 3 http://www.naic.edu/pfreire/GCpsr.html, and compared them with the ages of their corresponding GCs. The ratio distribution between the former and the latter is shown in Figure 4. As can be seen, the ratios are in a range of 0.01–0.4. There is a possible trend: the younger the MSPs, the more there are. We tested to fit the distribution with one simple function, which would return the number of the MSPs to be . This simple function obviously would over- or under-predicts the numbers of MSPs at different ratio values. Alternatively we noted that the ranges of from to 1.18 can be described with a function of , which constitute 66.7% of the MSPs, and the remaining 33.3% MSPs be described with a constant distribution (cf., Figure 4).
III.4 Period distribution of -ray MSPs
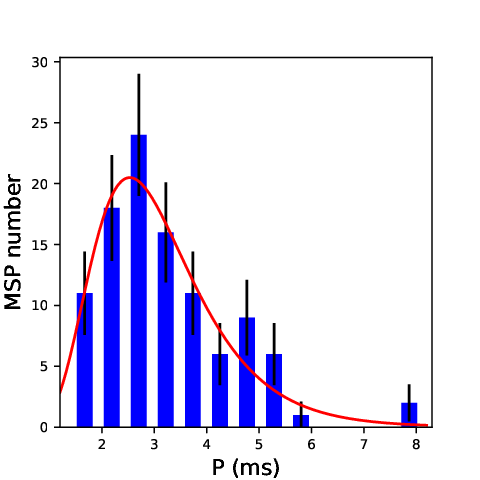
The final piece of information needed is of a pulsar. We constructed the distribution for the -ray MSPs, which is shown in Figure 5. Comparing to the whole MSP sample listed in the Australia Telescope National Facility (ATNF) pulsar catalogue (more than 300 MSPs; Manchester et al. 2005), the -ray MSPs tend to have shorter . We fit the distribution with a log-normal function, and obtained ms at the peak of the function and (the minimum for DoF).

III.5 -ray spectrum generation for an MSP in a GC
Using the models set up above, we generated -ray spectra of MSPs in each GC targets. The procedure is listed below:
- •
Generate for a pulsar based on the distribution of the -ray MSPs;
- •
of this pulsar is generated based on the distribution that depends on the age of a GC target;
- •
is estimated from and using , and is also calculated for this pulsar;
- •
Given , the – relationship is used to obtain an initial value, and for this pulsar , where the latter is generated based on the distribution for the scatters around the relationship (cf., Section III.2);
- •
of this pulsar is obtained from and ;
- •
Based on the spectral parameter ranges (we used 3 ranges) determined for the -ray MSPs in Section III.1, and are randomly generated for this pulsar, and its -ray spectrum is obtained given and the distance to the GC target.
III.6 Spectral fitting procedure for the GCs
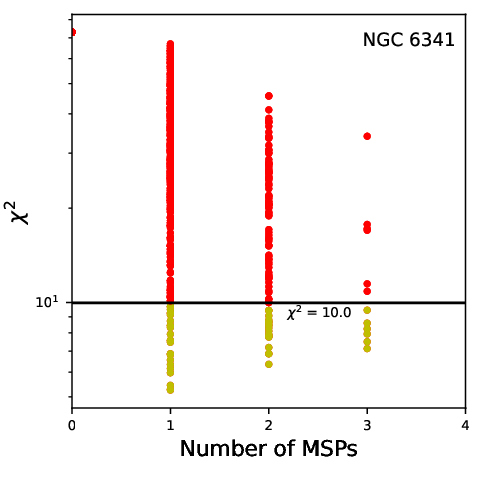
The -ray spectrum (or spectral upper limits) obtained for each -ray GCs (or nearby GCs) was fitted with spectra of MSPs generated according to the steps given above in Section III.5. For a GC target, we started from one pulsar, obtained its spectrum, fit the spectrum (or spectral upper limits) of the GC with it, obtained , and then repeated the process of fitting with the spectrum added from that of two, three, and more pulsars. In this run of fitting, the minimum was found and the corresponding number of MSPs was obtained. For each GC targets, 1000 such runs were conducted. Since there are flux upper limits in the GC spectra, one condition was set: when a model spectrum at the energy of an upper limit has a flux greater than the upper limit, the fitting was considered to have reached a limit and the run was stopped. When such a case was met, if the last number of MSPs (before reaching over an upper limit) provided the smallest , the value was taken as the minimum one and the number as that of MSPs.
IV Results
We carried out fitting to the spectrum of each GC targets, using the procedure given above. A number for MSPs in a given GC that results in a minimum value was obtained for most cases. In order to provide a range for the MSP number, we defined 5% lowest values in 1000 runs and used their corresponding MSP numbers as the representative range values. Figure 6 shows an example of our fitting results, in which the -ray spectrum of the GC NGC 104 (47 Tuc) was best fitted with 4 MSPs and a range of 1–11 was estimated from the lowest 5% values. The results for 30 -ray GCs are summarized in Table 1. The estimated numbers of -ray MSPs can also be seen in Figure 7, in which GLIMPSE-C01, GLIMPSE-C02, 2MS-GC01, NGC 7078, and Terzan 1 are not included because they do not either have or have a MSP-type spectrum (for the latter case, see below). Most of the figures showing the spectra and fitting results for the GCs are presented in Appendix Section B.
The spectra we obtained for the -ray GCs mostly contain 3–6 flux data points, with Terzan 5 as the exception having 8 data points. The minimum values from spectral fitting can generally indicate the goodness of how well a spectrum is fitted. Based on the values (see Table 1 and figures in Appendix Section B), we conclude that the -ray emission from most of the GCs can be explained with the containment of -ray MSPs (), although it should be noted that some of the spectra have large flux uncertainties. Four GCs, NGC 104, NGC 1904, Terzan 5, and GLIMPSE-C02, have the minimum values of 7–10. The relatively large values suggest that MSPs may not be the only -ray sources in these GCs; additional components may be needed. Finally there are three GCs, NGC 7078, Terzan 1, and 2MS-GC01, that have the minimum . Their spectra and fitting results are shown in Figure 8. Examining their spectral fitting, whether their -ray emissions are due to MSPs is not certain.


V Discussion and Summary
From the whole-sky observations for more than 10 years with Fermi LAT, highly representative samples for different types of high-energy objects have been established. We took advantage of the progress, and built a model to study the GCs’ -ray emission based on the presumption that the -ray MSPs in the GCs are the main source of the -ray emission. The model produces -ray spectra of MSPs randomly but within the properties of the known -ray MSP sample. Using spectra generated from the model, we have fitted the -ray spectra of the known -ray GCs and determined the numbers of -ray MSPs in the GCs. Among 30 known -ray GCs, we have found that 23 have -ray spectra consistent with arising from -ray MSPs, 4 have the relatively large minimum values, and 3 are not certain to have MSPs as the main -ray sources in them (non-MSP type). Below we first discuss the latter two types of the cases. As we also investigated -ray properties of six nearby GCs that have relatively high , we discuss our test results with our model applying to fitting of their -ray spectrum or spectral upper limits. We then compare our results with those of previous studies of the -ray GCs and related radio MSPs. In the end, we provide a summary of this work.
V.1 GCs with the relatively large minimum
In our fitting, NGC 104, NGC 1904, Terzan 5, and GLIMPSE-C02 have the minimum values of 7–10, which possibly indicate that the fitting for the four sources may not be satisfactory. In particular, Terzan 5 is required to contain the most, 9–38 -ray MSPs based on our fitting results, and NGC 104 (47 Tuc) has been reported to show an 18.4 hr periodic signal in its -ray emission (Zhang et al. 2020). Both facts suggest that these two GCs could be more complicated than the MSP scenario considered in this work.
We checked the residuals of the spectral fitting for the four GCs, but no significant deviations from the respective best-fitting model spectrum were found, partly due to the large flux uncertainties of the observed spectra. In Figure 9, the spectral data points of NGC 104 and Terzan 5, normalized by the respective best-fitting model spectra, are shown, as these two have the last data point appearing away from the model. In particular for Terzan 5, the data point is nearly 100 times the model flux. However, because the flux uncertainties are large, the significances of the deviations of the last data points are 2.3 in NGC 104 and 1.7 in Terzan 5 respectively. Thus both deviations are not sufficiently significant such that additional source of -ray emission would be definitely needed. Recently Song et al. 2021 have applied a double-component (PLEC plus power law) model to spectral fitting for the -ray GCs and stated that a power law component is significantly present. Although the significances in our studies are not high, the deviations at the high-energy tails of the spectra of NGC 104 and Terzan 5 do hint the existence of an extra component in -ray emission from these two GCs.


V.2 Non-MSP type
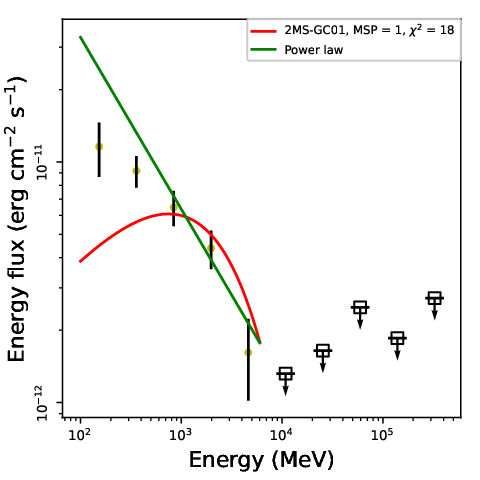
As can be seen in Figure 8, the spectra of NGC 7078, Terzan 1, and 2MS-GC01 do not have pulsars’ PLEC spectral shape and can not be well fit with our model spectra of MSPs. The first seemingly has a sharp drop (cutoff) after 1 GeV, the second has a relatively narrow spectral range of 1–10 GeV, and the third is more consistent with a power law. For these three sources, we constructed TS maps and confirmed the detection of them and in particular the narrow spectral range of Terzan 1. For example, in the energy ranges of GeV or GeV, no sources were seen at the position of Terzan 1 in the TS maps. In order to check if the -ray sources at the positions of the three GCs could be background sources such as blazars, we also constructed their light curves (60-d a bin). No obvious variability showing flares or significant flux changes was seen from each of them.
We extracted fine energy-bin spectra of NGC 7078 and Terzan 1, for the purpose of better understanding their spectral shapes. The spectrum of NGC 7078 is shown in the left panel of Figure 10, which can approximately be described with a power law. In fact, power-law emission (with ) is given in 4FGL-DR2 for the source and it is consistent with the spectrum we obtained (Figure 10).
The fine energy-bin spectrum of Terzan 1 is shown in the middle panel of Figure 10. This spectrum is actually not typical among those of the known Galactic -ray sources such as MSPs or other classes; MSPs generally have a PLEC shape with the power-law components detectable from 0.1 GeV to several GeV (cf., Figure 2), and others are often described with a power law (e.g., Abdollahi et al. 2020). We conducted global fits to the emission of Terzan 1 with a PLEC model and a Gaussian one. For the first model, the TS value is 148 with and cutoff energy GeV. The difference of the emission from that of a typical MSP is its hardness, as it is detectable only above 1 GeV. For the second model, the fitting resulted in a slightly higher TS value, 151, with the peak value at 1.492 GeV and the standard deviation of the Gaussian function being 1.933 GeV. The narrow energy emission, likely described with a Gaussian function, may suggest an abnormal origin for the emission, such as the dark matter particle annihilations (see, e.g., Bertoni et al. 2015). We note that Terzan 1 is located along the direction towards the Galactic center and it is the only special case we found among the GCs. Further discussion for the origin of its emission is beyond the scope of this paper and will be presented elsewhere (Huang, Wang, et al. in preparation).
For 2MS-GC01, we conducted a global fit to its emission. To avoid possible contamination from the background since the GC is located close to the Galactic center, the energy range we used was 0.3–500 GeV. We obtained a power law with . This power law, shown in the right panel of Figure 10, can approximately describe the source’s spectrum, although at the low energies, the spectral data points are slightly lower than the model fit. We conclude that a power law at least better fits the spectrum of the GC.
V.3 Nearby GCs with high encounter rates
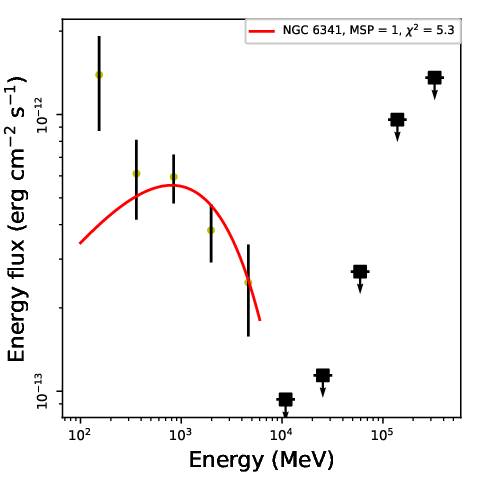
For six nearby GCs with high , only NGC 6656 has a possible -ray counterpart, but the counterpart does not have a sufficiently high association probability according to 4FGL-DR2. In any case, we fit its -ray spectrum with our model and the fitting results are shown in Figure 11. Interestingly, we found that the spectrum can be fit with a single MSP and the number of MSPs in this GC would be limited to be 1. The fitting results thus support the association, if we consider MSPs are the main sources of -ray emission in GCs.
For other five GCs, we obtained their spectral upper limits and tested our model fitting on the upper limits (see Figure 21 in Appendix Section C). All of them are limited to have MSP but with the dominant numbers being zero. Therefore, the likely reason why these five GCs have not been detected at -rays is because they do not contain detectable -ray MSPs.
Given the close distances of these five GCs, it is hard to miss the detections with Fermi LAT if they have detectable -ray emission. The limits on mostly zero -ray MSPs in them we set should be reliable. One possibility is that they contain a few MSPs but the MSPs do not have pulsed -ray emission towards the Earth by chance. We checked the GC radio pulsar catalog, the reported numbers for them are only 1 or 2 (NGC 6121, NGC 6254, NGC 6544, and NGC 6656). The radio results seem to be consistent with our upper-limit results, suggesting that the GCs probably do not have many MSPs.
We tested the relationship derived in de Menezes et al. 2019, which was based on -ray luminosities of 20 GCs. The relationship would predict 46 -ray MSPs in NGC 6544 and 2–9 in other four GCs. Considering their relatively high values, the non-detection of -ray emission in the five GCs (in particular NGC 6544) suggests that the number of -ray MSPs in a GC may not be directly indicated by ; other factors could play important roles in determining the number of -ray MSPs a GC contains (e.g., de Menezes et al. 2019; Song et al. 2021).


V.4 Comparison with previous studies and radio results
In our studies, we took into account the detailed properties of the -ray MSPs that included the spectral information, and based on the properties we constructed a model that produces spectra of GCs by adding the generated MSPs’ spectra in a GC. We found that the model spectra can generally well fit most of the observed spectra of the -ray GCs. The fitting thus indicates that -ray emission in 27 of the GCs can be explained with MSPs contained in them. This result is different from that found by Song et al. 2021, since our fitting results do not show the need of an additional power-law component (due to inverse-Compton scattering of infrared and optical photons). We note that several power-law like spectra (e.g., NGC 6093, NGC 6139, NGC 6304; see Appendix Figures 13, 14 & 15) can actually be fit with our PLEC-like spectral form, partly due to the large flux uncertainties, and in some cases the flux upper limits do require a curved spectrum (e.g., NGC 6304). In the future when more data are collected to improve the spectrum measurements, the picture whether these spectra are better described with a PLEC type spectral form would become clear.
We did identify three GCs whose spectra do not appear to have a PLEC shape that can be described with our model spectra of MSPs, among which NGC 7078 and 2MS-GC01 have power-law like spectra. One possibility could be that the -ray sources are background blazars due to positional coincidence, which can be verified by monitoring their variability. While if they are indeed the true counterparts to the two GCs, our fitting indicates that MSPs’ emission is not the dominant one at least. These results are consistent with that reported in Lloyd et al. 2018 and Song et al. 2021. Thus the power-law -ray emission from the two GCs is intriguing and may be the inverse-Compton component proposed by Song et al. 2021.
Different from previous estimations for numbers of -ray MSPs in the GCs, which used typical luminosity parameters for -ray MSPs and then compared with -ray luminosities of the GCs, we worked through spectral fitting. The numbers of -ray MSPs for 25 GCs we estimated are shown in Figure 7. We also found the numbers of radio pulsars in these GCs (listed in the GC radio pulsar catalog) and marked them in the figure. As can be seen, the numbers from our spectral fitting generally match those reported at radio, while several GCs (e.g., NGC 104, NGC 5904, NGC 6752) notably have significantly more radio MSPs. We note that recently observations with Five-hundred-meter Aperture Spherical radio Telescope (FAST) have found many new radio pulsars in GCs (e.g., Pan et al. 2021a; Pan et al. 2021b). Hopefully high-sensitivity observations with FAST will reveal more pulsars in the near future and the comparison of our results with the updated numbers of radio pulsars would provide a clear understanding for the relation of -ray MSPs to radio ones in the GCs.
As the correlation between the numbers of MSPs and have been studied, we checked our results. If we consider the ranges of numbers as the uncertainties, we would find a relationship of . This relationship, shown in Figure 7, depends more weakly on than that derived by de Menezes et al. 2019 from -ray luminosities of 20 GCs. It would predict 1–3 -ray MSPs in the five nearby GCs with relatively high values (cf., Section V.3). Specifically for NGC 6544, 3 -ray MSPs would be expected. Considering uncertainties on the estimation of and the large ranges for our estimated numbers of -ray MSPs, the relationship likely represents more closely the observational facts (i.e., the non-detection of -ray emission in the five GCs). Then again as discussed in Section V.3, it is likely that high GCs tend to have more -ray MSPs, but whether there is a relationship that can be well defined for the numbers of -ray MSPs in GCs is uncertain.
V.5 Summary
We have studied high-energy properties of 30 -ray GCs and 6 nearby, high GCs by considering MSPs as the main high-energy sources in them. From fitting the spectra or spectral upper limits of the GCs with that of the MSPs presumed in them, we have found that -ray emission of 27 GCs can be explained as due to MSPs. If we consider that the -ray sources at the positions of NGC 7078, Terzan 1, and 2MS-GC01 are their true counterparts, -ray emission of them needs explanations, as their spectra can not be well fit with the MSP-type spectral model. For the 6 nearby GCs, we have found evidence supporting the possible detection of -ray emission from NGC 6656 and set limits of -ray MSPs in the other 5 GCs from our model fitting.
Numbers of -ray MSPs in the 27 -ray GCs have been estimated, and they generally match well those of radio MSPs found in the GCs. Deep radio searches for finding new MSPs in the GCs are warranted. The samples of radio MSPs, if built as fully as possible from the searches, could be compared with those estimated from the -ray properties of the GCs and the comparisons would help improve our understanding of the properties of -ray MSPs among the total MSPs in each of the GCs.
References
- Abdo et al. (2009) Abdo, A. A., Ackermann, M., Ajello, M., et al. 2009, Science, 325, 845
- Abdo et al. (2010) —. 2010, A&A, 524, A75
- Abdo et al. (2013) Abdo, A. A., Ajello, M., Allafort, A., et al. 2013, ApJS, 208, 17
- Abdollahi et al. (2020) Abdollahi, S., Acero, F., Ackermann, M., et al. 2020, ApJS, 247, 33
- Arzoumanian et al. (2018) Arzoumanian, Z., Baker, P. T., Brazier, A., et al. 2018, ApJ, 859, 47
- Bahramian et al. (2013) , Bahramian, A. Heinke, C. O., Sivakoff, G. R., & Gladstone, J. C. 2013, ApJ,766, 136
- Ballet et al. (2020) Ballet, J., Burnett, T. H., Digel, S. W., & Lott, B. 2020, arXiv e-prints, arXiv:2005.11208
- Bertoni et al. (2015) Bertoni, B., Hooper, D., & Linden, T. 2015, J. Cosmology Astropart. Phys, 2015, 035
- Carballo-Bello et al. (2018) Carballo-Bello, J. A., Martínez-Delgado, D., Navarrete, C., et al. 2018, MNRAS, 474, 683
- Cezario et al. (2013) Cezario, E., Coelho, P. R. T., Alves-Brito, A., Forbes, D. A., & Brodie, J. P. 2013, A&A, 549, A60
- Contreras Peña et al. (2013) Contreras Peña, C., Catelan, M., Grundahl, F., Stephens, A. W., & Smith, H. A. 2013, AJ, 146, 57
- Davidge et al. (2016) Davidge, T. J., Andersen, D. R., Lardière, O., et al. 2016, AJ, 152, 173
- de Menezes et al. (2019) de Menezes, R., Cafardo, F., & Nemmen, R. 2019, MNRAS, 486, 851
- Desvignes et al. (2016) Desvignes, G., Caballero, R. N., Lentati, L., et al. 2016, MNRAS, 458, 3341
- Ferraro et al. (2016) Ferraro, F. R., Massari, D., Dalessandro, E., et al. 2016, ApJ, 828, 75
- Forbes & Bridges (2010) Forbes, D. A., & Bridges, T. 2010, MNRAS, 404, 1203
- Freire et al. (2011) Freire, P. C. C., Abdo, A. A., Ajello, M., et al. 2011, Science, 334, 1107
- Hare et al. (2018) Hare, J., Kargaltsev, O., & Rangelov, B. 2018, ApJ, 865, 33
- Harris (1996) Harris, W. E. 1996, AJ, 112, 1487
- Henleywillis et al. (2018) Henleywillis, S., Cool, A. M., Haggard, D., et al. 2018, MNRAS, 479, 2834
- Hui et al. (2011) Hui, C. Y., Cheng, K. S., Wang, Y., et al. 2011, ApJ, 726, 100
- Johnson et al. (2013) Johnson, T. J., Guillemot, L., Kerr, M., et al. 2013, ApJ, 778, 106
- Kharchenko et al. (2013) Kharchenko, N. V., Piskunov, A. E., Schilbach, E., Röser, S., & Scholz, R. D. 2013, A&A, 558, A53
- Kong et al. (2010) Kong, A. K. H., Hui, C. Y., & Cheng, K. S. 2010, ApJ, 712, L36
- Lloyd et al. (2018) Lloyd, S. J., Chadwick, P. M., & Brown, A. M. 2018, MNRAS, 480, 4782
- Manchester et al. (2005) Manchester, R. N., Hobbs, G. B., Teoh, A., & Hobbs, M. 2005, AJ, 129, 1993
- Oh et al. (2020) Oh, K., Hui, C. Y., Li, K. L., & Kong, A. K. H. 2020, MNRAS, 498, 292
- Origlia et al. (2008) Origlia, L., Lena, S., Diolaiti, E., et al. 2008, ApJ, 687, L79
- Pan et al. (2021a) Pan, Z., Qian, L., Ma, X., et al. 2021a, ApJ, 915, L28
- Pan et al. (2021b) Pan, Z., Ma, X.-Y., Qian, L., et al. 2021b, Research in Astronomy and Astrophysics, 21, 143
- Reardon et al. (2016) Reardon, D. J., Hobbs, G., Coles, W., et al. 2016, MNRAS, 455, 1751
- Song et al. (2021) Song, D., Macias, O., Horiuchi, S., Crocker, R. M., & Nataf, D. M. 2021, MNRAS, doi:10.1093/mnras/stab2406
- Tam et al. (2011) Tam, P. H. T., Kong, A. K. H., Hui, C. Y., et al. 2011, ApJ, 729, 90
- VandenBerg et al. (2013) VandenBerg, D. A., Brogaard, K., Leaman, R., & Casagrande, L. 2013, ApJ, 775, 134
- Verbiest & Lorimer (2014) Verbiest, J. P. W., & Lorimer, D. R. 2014, MNRAS, 444, 1859
- Wu et al. (2013) Wu, J. H. K., Hui, C. Y., Wu, E. M. H., et al. 2013, ApJ, 765, L47
- Xing & Wang (2016) Xing, Y., & Wang, Z. 2016, ApJ, 831, 143
- Zhang et al. (2016) Zhang, P. F., Xin, Y. L., Fu, L., et al. 2016, MNRAS, 459, 99
- Zhang et al. (2020) Zhang, P.-F., Zhou, J.-N., Yan, D.-H., et al. 2020, ApJ, 904, L29
- Zhao et al. (2020) Zhao, Y., Heinke, C. O., Cohn, H. N., et al. 2020, MNRAS, 499, 3338
- Zhou et al. (2015) Zhou, J. N., Zhang, P. F., Huang, X. Y., et al. 2015, MNRAS, 448, 3215
| Name | Age | Distancea | |||||
|---|---|---|---|---|---|---|---|
| (Gyr) | (kpc) | ( pc-3) | (arcmin) | ||||
| NGC 1041 | 11.8 | 4.5 | 4.9 | 0.36 | 4 | 7.7/6 | 1–11 |
| NGC 3621 | 10.8 | 8.6 | 4.7 | 0.18 | 2 | 0.9/3 | 1–3 |
| NGC 19042 | 11.0 | 12.9 | 4.1 | 0.16 | 3 | 7.9/5 | 1–4 |
| NGC 28081 | 11.0 | 9.6 | 4.7 | 0.25 | 2 | 1.6/4 | 1–5 |
| NGC 51393 | 11.5 | 5.2 | 3.2 | 2.4 | 3 | 3.6/5 | 1–6 |
| NGC 59041 | 11.5 | 7.5 | 3.9 | 0.44 | 1 | 0.012/3 | 1-3 |
| NGC 60933 | 12.5 | 10 | 4.8 | 0.15 | 1 | 2.0/6 | 1–3 |
| NGC 61394 | 12.6 | 10.1 | 4.7 | 0.15 | 2 | 1.4/4 | 1–8 |
| NGC 62181 | 13.0 | 4.8 | 3.2 | 0.79 | 1 | 5.0/4 | 1–2 |
| NGC 62663 | 11.8 | 6.8 | 5.2 | 0.22 | 8 | 5.5/7 | 1–13 |
| NGC 63041 | 11.3 | 5.9 | 4.5 | 0.21 | 3 | 2.3/4 | 1–3 |
| NGC 63165 | 14.8 | 10.4 | 4.2 | 0.17 | 13 | 5.2/6 | 4–16 |
| NGC 63411 | 12.8 | 8.3 | 4.3 | 0.26 | 1 | 5.3/5 | 1–3 |
| NGC 63883 | 12.0 | 9.9 | 5.4 | 0.12 | 10 | 2.9/6 | 4–20 |
| NGC 63971 | 13.0 | 2.3 | 5.8 | 0.05 | 1 | 2.3/5 | 1–1 |
| NGC 64026 | 11.0 | 9.3 | 3.4 | 0.79 | 3 | 0.8/5 | 1–6 |
| NGC 64407 | 11.0 | 8.5 | 5.2 | 0.14 | 8 | 4.8/6 | 1–11 |
| NGC 64413 | 11.3 | 11.6 | 5.3 | 0.13 | 7 | 6.3/5 | 4–20 |
| NGC 65411 | 12.5 | 7.5 | 4.7 | 0.18 | 2 | 1.2/5 | 1–7 |
| NGC 66521 | 11.3 | 10 | 4.5 | 0.10 | 4 | 0.34/5 | 1–7 |
| NGC 67171 | 12.5 | 7.1 | 4.6 | 0.08 | 1 | 0.71/4 | 1–4 |
| NGC 67521 | 12.5 | 4.0 | 5.0 | 0.17 | 1 | 2.5/4 | 1–2 |
| NGC 68381 | 11.0 | 4.0 | 2.8 | 0.63 | 1 | 2.5/4 | 1–2 |
| NGC 70781 | 12.8 | 10.4 | 5.1 | 0.14 | 1 | 13/5 | 1–5 |
| Terzan 14 | 12.6 | 6.7 | 3.9 | 0.04 | 1 | 67/3 | 1–3 |
| Terzan 24 | 8.9 | 7.5 | 4.9 | 0.03 | 4 | 2.6/5 | 1–7 |
| Terzan 58 | 12.0 | 6.9 | 5.1 | 0.16 | 17 | 9.5/8 | 9–38 |
| 2MS-GC014 | 15.9 | 3.6 | 0.85 | 1 | 18/5 | 1–6 | |
| GLIMPSE-C019,10 | 2.0 | 4.2 | 0.59 | 3 | 5.3/5 | 1–6 | |
| GLIMPSE-C029 | 2.0 | 5.5 | 0.70 | 2 | 8.1/5 | 1–4 | |
| NGC 66561,c | 12.5 | 3.2 | 3.6 | 1.3 | 1 | 5.3/3 | 1–1 |
References for the ages of the GCs: 1VandenBerg et al. 2013; 2Carballo-Bello et al. 2018; 3Forbes & Bridges 2010; 4Kharchenko et al. 2013; 5Cezario et al. 2013; 6Contreras Peña et al. 2013; 7Origlia et al. 2008; 8Ferraro et al. 2016; 9Davidge et al. 2016; 10Hare et al. 2018. aDistance, central luminosity density, and core radius values are from the GC catalog of Harris 1996. b is the number of spectral data points in each spectrum. cA candidate -ray counterpart is considered for this GC.
Appendix A Information for 85 -ray MSPs
Among 104 -ray MSPs used to determine the spectral shape (Section III.1), we found and distance information for 85 of them. They are listed in Table 2. The fluxes of them are in 0.1–100 GeV energy range, given in the 4FGL-DR2 (Ballet et al. 2020). The luminosities were calculated from , where is the distance and the beam correction factor was assumed to be 1 (following Abdo et al. 2013).
| Name | ||||||
|---|---|---|---|---|---|---|
| (ms) | (erg s-1) | (Gyr) | (kpc) | (erg s-1 cm-2) | (erg s-1) | |
| J0023+09231 | 3.05 | 1.6 | 4.23 | 7.55 | 1.1 | |
| J0030+04511 | 4.87 | 0.35 | 7.58 | 59.5 | 0.75 | |
| J00340534 | 1.88 | 3.0 | 5.99 | 1.348 | 20.7 | 4.5 |
| J0218+42322 | 2.32 | 24 | 0.48 | 48.1 | 57 | |
| J0248+4230 | 2.60 | 3.8 | 2.44 | 1.853 | 1.86 | 0.76 |
| J0251+2606 | 2.54 | 1.8 | 5.32 | 1.170 | 4.48 | 0.73 |
| J0340+4130 | 3.30 | 0.77 | 7.42 | 1.603 | 19.4 | 6.0 |
| J043747153 | 5.76 | 1.2 | 1.59 | 17.3 | 0.051 | |
| J0533+6759 | 4.39 | 0.59 | 5.52 | 2.392 | 9.17 | 6.3 |
| J0605+3757 | 2.73 | 0.93 | 9.01 | 0.215 | 6.46 | 0.036 |
| J06102100 | 3.86 | 0.85 | 4.96 | 3.259 | 6.80 | 8.6 |
| J061302001 | 3.06 | 1.3 | 5.06 | 37.9 | 5.5 | |
| J06143329 | 3.15 | 2.2 | 2.85 | 2.690 | 114 | 98 |
| J0621+2514 | 2.72 | 4.9 | 1.74 | 1.641 | 4.53 | 1.5 |
| J0740+6620 | 2.89 | 2.0 | 3.75 | 0.929 | 3.16 | 0.33 |
| J0751+18074 | 3.48 | 0.73 | 7.08 | 9.64 | 1.3 | |
| J09311902 | 4.64 | 0.14 | 20.26 | 3.722 | 1.87 | 3.1 |
| J09520607 | 1.41 | 6.7 | 4.70 | 1.740 | 2.34 | 0.85 |
| J09556150 | 2.00 | 7.0 | 2.22 | 2.170 | 7.13 | 4.0 |
| J1012+5307 | 5.26 | 0.47 | 4.87 | 0.805 | 4.88 | 0.38 |
| J102407194 | 5.16 | 0.53 | 4.41 | 4.39 | 0.61 | |
| J10356720 | 2.87 | 7.7 | 0.98 | 1.460 | 18.6 | 4.7 |
| J1048+2339 | 4.67 | 1.2 | 2.46 | 2.002 | 5.07 | 2.4 |
| J11255825 | 3.10 | 8.1 | 0.81 | 1.744 | 5.99 | 2.2 |
| J11256014 | 2.63 | 0.87 | 10.40 | 0.989 | 2.87 | 0.34 |
| J1142+0119 | 5.08 | 0.45 | 5.37 | 2.169 | 6.20 | 3.5 |
| J12075050 | 4.84 | 0.21 | 12.66 | 1.268 | 4.73 | 0.91 |
| J12274853 | 1.69 | 9.1 | 2.41 | 1.244 | 22.6 | 4.2 |
| J12311411 | 3.68 | 1.8 | 2.56 | 0.420 | 101 | 2.1 |
| J13023258 | 3.77 | 0.48 | 9.12 | 1.432 | 10.9 | 2.7 |
| J13113430 | 2.56 | 4.9 | 1.94 | 2.430 | 61.0 | 43 |
| J1312+0051 | 4.23 | 0.92 | 3.82 | 1.471 | 14.4 | 3.8 |
| J14314715 | 2.01 | 6.8 | 2.26 | 1.822 | 6.35 | 2.5 |
| J14464701 | 2.19 | 3.7 | 3.55 | 1.569 | 6.80 | 2.0 |
| J15132550 | 2.12 | 9.0 | 1.55 | 3.956 | 6.95 | 13 |
| J15144946 | 3.59 | 1.6 | 3.05 | 0.909 | 40.8 | 4.0 |
| J15364948 | 3.08 | 2.9 | 2.30 | 0.978 | 78.5 | 9.0 |
| J15435149 | 2.06 | 7.3 | 2.02 | 1.148 | 17.8 | 2.8 |
| J1544+4937 | 2.16 | 1.2 | 11.67 | 2.991 | 3.38 | 3.6 |
| J1552+5437 | 2.43 | 0.77 | 13.76 | 2.636 | 2.82 | 2.4 |
| J15552908 | 1.79 | 31 | 0.64 | 7.555 | 6.97 | 48 |
| J160030531 | 3.60 | 0.81 | 6.00 | 7.38 | 3.5 | |
| J161422301 | 3.15 | 1.2 | 5.19 | 25.3 | 1.4 | |
| J16220315 | 3.85 | 0.81 | 5.26 | 1.141 | 7.86 | 1.2 |
| J16250021 | 2.83 | 3.7 | 2.11 | 0.951 | 20.3 | 2.2 |
| J1630+3734 | 3.32 | 1.2 | 4.88 | 1.187 | 5.97 | 1.0 |
| J1640+2224 | 3.16 | 0.35 | 17.80 | 1.507 | 2.33 | 0.63 |
| J16585324 | 2.44 | 3.0 | 3.47 | 0.880 | 19.8 | 1.8 |
| J1713+07471 | 4.57 | 0.35 | 8.50 | 7.05 | 1.3 | |
| J173023043 | 8.12 | 0.15 | 6.38 | 7.35 | 0.34 | |
| J17325049 | 5.31 | 0.37 | 5.93 | 1.875 | 6.00 | 2.5 |
| J1741+13511 | 3.75 | 2.3 | 1.97 | 4.14 | 1.6 | |
| J174411341 | 4.07 | 0.52 | 7.23 | 37.4 | 0.87 | |
| J1745+1017 | 2.65 | 0.58 | 15.41 | 1.214 | 7.60 | 1.3 |
| J17474036 | 1.65 | 12 | 1.99 | 7.151 | 12.2 | 74 |
| J1805+0615 | 2.13 | 9.3 | 1.48 | 3.885 | 5.29 | 9.6 |
| J18112405 | 2.66 | 2.9 | 3.06 | 1.830 | 18.6 | 7.5 |
| J1816+4510 | 3.19 | 5.2 | 1.17 | 4.356 | 10.2 | 23 |
| J1824+1014 | 4.07 | 0.32 | 12.00 | 2.904 | 6.68 | 6.7 |
| J18320836 | 2.72 | 1.6 | 5.21 | 0.807 | 20.1 | 1.6 |
| J18431113 | 1.85 | 6.0 | 3.06 | 1.706 | 21.8 | 7.6 |
| J18551436 | 3.59 | 0.93 | 5.23 | 5.126 | 5.38 | 17 |
| J19010125 | 2.79 | 6.5 | 1.24 | 2.360 | 19.5 | 13 |
| J19025105 | 1.74 | 6.9 | 3.00 | 1.645 | 22.7 | 7.3 |
| J19037051 | 3.60 | 0.88 | 5.47 | 0.930 | 5.26 | 0.54 |
| J1908+2105 | 2.56 | 3.2 | 2.94 | 2.601 | 4.12 | 3.3 |
| J1921+0137 | 2.50 | 4.9 | 2.05 | 5.085 | 11.1 | 34 |
| J2006+0148 | 2.16 | 1.3 | 10.39 | 2.437 | 2.98 | 2.1 |
| J20171614 | 2.31 | 0.78 | 14.98 | 1.444 | 6.20 | 1.6 |
| J2017+0603 | 2.90 | 1.3 | 5.74 | 1.399 | 35.7 | 8.4 |
| J20395617 | 2.65 | 3.0 | 2.97 | 1.707 | 15.1 | 5.3 |
| J2043+1711 | 2.38 | 1.5 | 7.20 | 1.476 | 5.93 | 1.6 |
| J2043+17111 | 2.38 | 1.5 | 7.20 | 28.4 | 8.7 | |
| J20510827 | 4.51 | 0.55 | 5.61 | 1.469 | 2.79 | 0.72 |
| J2052+1219 | 1.99 | 3.4 | 4.70 | 3.916 | 5.68 | 10 |
| J2115+5448 | 2.60 | 17 | 0.55 | 3.106 | 7.10 | 8.2 |
| J212433584 | 4.93 | 0.68 | 3.80 | 38.6 | 0.67 | |
| J2214+3000 | 3.12 | 1.9 | 3.36 | 1.673 | 32.1 | 11 |
| J2215+5135 | 2.61 | 7.4 | 1.24 | 2.773 | 17.0 | 16 |
| J2234+0944 | 3.63 | 1.7 | 2.86 | 1.587 | 9.89 | 3.0 |
| J22415236 | 2.19 | 2.5 | 5.22 | 0.963 | 25.4 | 2.8 |
| J22561024 | 2.29 | 3.7 | 3.20 | 1.329 | 8.01 | 1.7 |
| J2302+4442 | 5.19 | 0.39 | 5.97 | 0.859 | 38.2 | 3.4 |
| J23100555 | 2.61 | 1.1 | 8.35 | 1.556 | 5.40 | 1.6 |
| J23390533 | 2.88 | 2.3 | 3.24 | 0.751 | 29.2 | 2.0 |
| Distances without errors are assumed to have 30% uncertainties; ,,, Distances are from Arzoumanian et al. 2018, Verbiest & Lorimer 2014, Reardon et al. 2016, and Desvignes et al. 2016, respectively. |
Appendix B Spectral fitting results for Gamma-Ray GCs
Spectra of 26 -ray GCs and spectral fitting results are shown in the following figures. We note that several spectra appear to have high fluxes at the low end (0.1–0.2 GeV) of the spectral energy range, away from the other spectral data points (and our model spectra). Checking them with TS maps, we found that they were due to the contamination by the strong background emission or nearby sources, since the point spread function of LAT at 100 MeV is as large as .




Appendix C Spectral fitting for five nearby GCs
Spectral upper limits derived for five nearby GCs are shown in the following figure.


