H-based Star Formation Rates in and around z 0.5 EDisCS clusters2021H-based Star Formation Rates in and around z 0.5 EDisCS clusters–11
Abstract
We investigate the role of environment on star-formation rates of galaxies at various cosmic densities in well-studied clusters. We present the star-forming main sequence for 163 galaxies in four EDisCS clusters in the range 0.4 z 0.7. We use Hubble Space Telescope/Wide Field Camera 3 observations of the H emission line to span three distinct local environments: the cluster core, infall region, and external field galaxies. The main sequence defined from our observations is consistent with other published H distributions at similar redshifts, but differs from those derived from star-formation tracers such as 24m. We find that the H-derived star-formation rates for the 67 galaxies with stellar masses greater than the mass-completeness limit of M 109.75M show little dependence on environment. At face value, the similarities in the star-formation rate distributions in the three environments may indicate that the process of finally shutting down star formation is rapid, however, the depth of our data and size of our sample make it difficult to conclusively test this scenario. Despite having significant H emission, 21 galaxies are classified as UVJ-quiescent and may represent a demonstration of the quenching of star formation caught in the act.
Keywords:
galaxies – clusters – star formation – evolution1 Introduction
Star formation governs the conversion of a galaxy’s gas into stars and is characterized by the balance of cold gas accretion and feedback (Dutton et al. 2010; Bouché et al. 2010). Global star formation peaked at z 2 and has been in a rapid decline to the present day (Madau & Dickinson 2014; Bouwens et al. 2015; Cucciati et al. 2012). Across all redshifts and masses, a tight correlation illustrates that more massive star-forming galaxies are forming stars at a quicker rate than those at lower stellar masses; this relation is referred to as the star-forming main sequence (Noeske et al. 2007; Peng et al. 2010; Whitaker et al. 2012). The normalization of the star-forming main sequence evolves with time, where galaxies at z 2 and 1 have a main sequence that is 20x (Daddi et al. 2007) and 7x higher (Elbaz et al. 2007), respectively, than at z 0 (Brinchmann et al. 2004). This decline in overall star formation to the present day poses many questions surrounding the nature and fate of the universe.
While the main sequence is generally presented with a slope ranging from 0.2 – 1.2 (Speagle et al. 2014), there have been numerous studies that show that bulge-dominated massive galaxies contribute towards a flattening in the star-formation rate (SFR) at higher masses (Karim et al. 2011; Whitaker et al. 2012; Whitaker et al. 2014; Schreiber et al. 2015; Erfanianfar et al. 2016). This ‘internal’ quenching mechanism is directly related to the morphology of the galaxy and results in a less efficient conversion of gas to stars (Martig et al. 2009). Processes that suppress star formation, such an expulsion of the gas through feedback, a cutoff in gas accretion (Larson et al. 1980), or the removal of the gas via ram-pressure stripping (Quilis et al. 2000) can also cause a deviation to SFRs lower than the main sequence. Additionally, some ram-pressure stripping and merger events have been observed to first create enhanced SFR activity, followed by a suppression phase (Poggianti et al. 2016; Jaffé et al. 2016; Vulcani et al. 2018). The overall observed scatter in the main sequence is likely due to varying star formation histories of each galaxy (Hopkins et al. 2014; Domínguez Sánchez et al. 2014), where this scatter is consistent across stellar mass and redshift at 0.3 dex (Whitaker et al. 2012; Tacchella et al. 2016).
Further exploration of the SFR – stellar mass relation is expanded by investigating distinct cosmic environments. The densest regions of the universe consist of galaxy clusters with thousands of members that are gravitationally bound and contain a hot intracluster medium (ICM). Many of the most massive galaxies reside in the cluster cores, with the brightest cluster galaxy (BCG) generally being at the minimum or center of the cluster potential well and elliptical in shape. However, cluster membership extends far beyond the virial radius and encompasses the infall region where galaxies are initially accreted into the cluster environment. This infall region of galaxy clusters has the potential to host the sites of galaxy transformation and quenching processes in situ that may differ from those in the core. Just et al. 2019 found that 30 - 70% of the galaxies in local clusters were located in the infall region at z 0.6, meaning that these galaxies may become the majority of cluster galaxies at z 0. This finding reinforces the importance of the cluster infall region with respect to the environmentally-driven transformation of galaxies.
There have been numerous studies of star formation in clusters, conducted using various emission lines. Studies which consider the galaxy population as a whole see a clear suppression of star formation in dense environments (Balogh et al. 1997; Kauffmann et al. 2004; Patel et al. 2009, e.g.). It is now recognized that this difference is primarily driven by the higher fraction of passive galaxies in clusters compared to the field. When considering only star-forming galaxies, studies yield conflicting pictures as to the effect of galaxy environment on the SFR of star-forming galaxies. For example, various authors find no difference in the SFRs of star-forming galaxies in low and high density environments (Poggianti et al. 2008; Peng et al. 2010; Koyama et al. 2013; Tiley et al. 2020, e.g.). However, other studies find evidence for a suppression of star formation in cluster galaxies relative to the field, mostly manifested in a tail to low SFRs (Wolf et al. 2009; Finn et al. 2010; Vulcani et al. 2010; Paccagnella et al. 2016; Old et al. 2020). These studies indicate that the cluster environment is indeed suppressing SFRs of star-forming galaxies, though perhaps only for a subset of the population. The apparent contradiction between these studies is somewhat difficult to reconcile for multiple reasons. The studies use various tracers, have different sensitivities to low SFR, and do not all probe the same dynamic range in density. However, most modern studies that examine clusters and are sensitive to low SFRs do find an excess population in clusters with suppressed star formation (Paccagnella et al. 2016, e.g.). These results indicate that star formation is being quenched in clusters. The timescale needed to quench star formation is highly dependent on the exact distribution of SFRs below the main sequence. For example, a lack of galaxies below the main sequence would argue for a fast quenching timescale (). This is necessary to avoid a substantial population of galaxies with significantly reduced, but non-zero SFRs.
In contrast to this fast timescale, studies which model the buildup of quiescent galaxies in clusters over time require a significantly longer timescale between when galaxies cross the virial radius and when they quench, on the order of five Gyr at and shorter at higher redshift (McGee et al. 2011; De Lucia et al. 2012; Muzzin et al. 2014; Taranu et al. 2014; Haines et al. 2015; Fossati et al. 2017). A proposal for reconciling these different timescales is one in which galaxies follow a delayed-then-rapid quenching process as they fall into a more massive halo (Wetzel et al. 2013). In this picture, galaxy SFRs are unaffected for the first two – four Gyr (Wetzel et al. 2013), followed by a rapid quenching period. This proposal has been remarkably successful at explaining both the evolution in the quenched fraction and the distribution of galaxy SFRs. Despite this success, the physical processes acting during the ‘delay’ phase, and the process responsible for the ultimate ‘rapid’ quenching remain ambiguous. Indeed, some recent studies indicate that this phase is one in which the spatial extent of the star formation within star-forming cluster galaxies is being slowly reduced, thus indicating that the ‘delay’ phase is really a slow quenching phase (Finn et al. 2018).
Making progress in our understanding of galaxy quenching in dense environments requires studies that probe the distribution of SFRs for star-forming galaxies to low levels of SFR and over a large dynamic range in densities and with a single tracer. It is also important that studies extend beyond the local universe, as quenching timescales evolved to longer times at lower redshift (Balogh et al. 2016; Foltz et al. 2018). To probe the full evolution of galaxy SFRs as galaxies fall into clusters, a final ingredient is that studies probe beyond the virial radius into the infall regions, as that is where environmental transformation may first occur (Lewis et al. 2002; Gómez et al. 2003). H is an excellent tracer of star formation as it is less susceptible to extinction or metallicity than other optical emission lines, such as [O ii] (Moustakas et al. 2006, e.g.), and because it probes the instantaneous SFR (Kennicutt 1998). There have been a small number of wide-field H studies of clusters beyond the local universe (Kodama et al. 2004; Koyama et al. 2011; Sobral et al. 2011). These have focused on very massive clusters and have included only one cluster per study. However, they do not present a consistent picture of the effect of the infall region. For example, Koyama et al. 2011 find that the fraction of H emitters with red colors peaks in groups, but is elevated in groups in the infall region with respect to the core. On the other hand, Sobral et al. 2011 finds that the SFR of H emitters climbs significantly from low to intermediate densities, but declines again at the highest densities that correspond to cluster cores. However, Sobral et al. 2011 also find that this boosting of the SFR is dominated by galaxies with stellar masses lower than . These varied results highlight the need for studies of the SFR in the infall regions of multiple clusters with the same tracer and survey selection. Having larger samples of clusters is especially important given the significant cluster-to-cluster variation in galaxy properties (Poggianti et al. 2006; Moran et al. 2007; Patel et al. 2011; Oemler et al. 2013, e.g.)
At z 0.5, the H line is located at m which is difficult to observe from the ground. The Hubble Space Telescope (HST) provides access to H through slitless spectroscopy using The Wide Field Camera 3 (WFC3). The 3DHST survey (van Dokkum et al. 2011; Momcheva et al. 2016) demonstrated the power of this mode by observing more than 100,000 galaxies in the CANDELS fields. The grism spectra, coupled with broad-band imaging, allowed the 3DHST team to produce and release robust redshifts, emission line fluxes, and 2D emission line spatial maps. This showcased the power of the grism and led to numerous publications regarding sizes (Nelson et al. 2012; van der Wel et al. 2014), the main sequence (Whitaker et al. 2012; Whitaker et al. 2014) and assembly of galaxies (van Dokkum et al. 2013; Barro et al. 2014; Lang et al. 2014). The success of this study led to other surveys utilizing the same combination of observation modes such as the Grism Lens-Amplified Survey from Space (GLASS; Treu et al. 2015), which was able to observe galaxies in varying cosmic environments (Vulcani et al. 2015; Vulcani et al. 2016; Vulcani et al. 2017; Abramson et al. 2018). GLASS and other surveys (Lotz et al. 2013; Lee-Brown et al. 2017) demonstrated the abilities of the HST grism even in crowded cosmic regions.
This study aims to characterize the distribution of SFRs in galaxies in the infall and core regions of four clusters, and to compare them to a consistently measured field sample. We seek to quantify how SFRs are affected during a galaxy’s journey into the cluster environment. This paper is organized as follows. In § 2, we describe the sample properties, observations and reduction methodologies. In § 3 and § 4, we present the SFR – stellar mass results and comparison to the literature. In § 5 we discuss future work and analysis possible with this dataset. The virial radius (R200) is defined as the radius of the enclosed circle that has a density 200x that of the critical density of the Universe at a given redshift. All magnitudes are given in the AB system, and we assume a Chabrier IMF (Chabrier 2003). We adopt a CDM cosmology with = 0.307, = 0.693, and H0 = 67.7 km s-1 Mpc-1 (Planck Collaboration et al. 2016).
2 Methodology & Data
2.1 ESO Distant Cluster Survey
| Cluster ID | RA | Dec | zspec | R200 | Rinfall | M200 | |
|---|---|---|---|---|---|---|---|
| (hours) | (degrees) | (Mpc) | (Mpc) | (1014 M) | (km s-1) | ||
| (1) | (2) | (3) | (4) | (5) | (6) | (7) | (8) |
| Cl1059.2-1253 | 10:59:07.1 | -12:53:15 | 0.4564 | 3.19 | |||
| Cl1138.2-1133 | 11:38:10.3 | -11:33:38 | 0.4796 | 4.62 | |||
| Cl1227.9-1138 | 12:27:58.9 | -11:35:13 | 0.6357 | 3.76 | |||
| Cl1301.7-1139 | 13:01:40.1 | -11:39:23 | 0.4828 | 4.34 |
The ESO Distant Cluster Survey (EDisCS; White et al. 2005). is an ESO Large Program derived from the optically brightest objects of the Las Campañas Distant Cluster Survey (Gonzalez et al. 2001) and comprises 20 clusters within 0.4 z 0.8. The velocity dispersion () of these clusters ranges from 200 - 1200 km s-1 (Halliday et al. 2004; Milvang-Jensen et al. 2008a) and is characteristic of local cluster progenitors due to mid-mass halo sizes (Milvang-Jensen et al. 2008a). The main goal of EDisCS is to examine the evolution of cluster populations over a large span of cosmic time and compare results to with respect to halo mass and local cluster populations.
For the purpose of this study we decide to separate our galaxies into three distinct, but broadly defined, environments: (i) the cluster core, within , (ii) the infall region, which corresponds to all galaxies at the cluster redshift but beyond the virial radius, and (iii) the field, which corresponds to foreground and background galaxies. We define the cluster center in all cases as the location of the BCG and measure clustercentric radii from that location. The BCG lies at the approximate center of the member distribution (White et al. 2005) for our clusters and Just et al. 2019 showed that any offsets of the BCG location from the center are of the infall radius for the clusters in our sample. However, some of our clusters exhibit significant substructure De Lucia et al. 2009, indicating that defining environment purely by clustercentric radius may wash out some trends with local density.
2.1.1 Cluster Core
The core regions, which are typically on the order of 0.5 – 2 Mpc across, are defined as the area within the virial radius and typically include the BCG. For EDisCS, the cores have been extensively studied with deep optical imaging and spectroscopy on VLT (White et al. 2005; Halliday et al. 2004; Milvang-Jensen et al. 2008a; Vulcani et al. 2012) and NIR observations on the New Technology Telescope (White et al. 2005; Rudnick et al. 2009) which has allowed further EDisCS studies such as brightest cluster galaxy identification (White et al. 2005; Whiley et al. 2008), morphologies (Desai et al. 2007; Simard et al. 2009; Vulcani et al. 2011b; Vulcani et al. 2011a), fundamental-plane parameters (Saglia et al. 2010), red-sequence identification (De Lucia et al. 2004), weak lensing (Clowe et al. 2006), 24 MIPS SFRs (Finn et al. 2010) and [O ii] SFRs (Poggianti et al. 2006; Poggianti et al. 2009; Vulcani et al. 2010). Cluster cores are dense regions that are attractive for studying cluster properties and are well-suited for observations due to high contrast with the background and density of objects within a given FOV. However, physical processes affecting the evolution of a galaxy appear to occur as these sources enter a cluster environment, and thus the cores likely only provide information on their fate. This is reinforced through observations that the cores typically include a higher fraction of massive red disk or quiescent galaxies (Dressler 1980; Bell et al. 2004; Kauffmann et al. 2004; Erfanianfar et al. 2016). A spatially-expanded view of clusters is required to gather information on environmentally-driven quenching mechanisms across a representative sample of galaxies within a cluster.
2.1.2 Wide Field Follow-up Surveys
Galaxy clusters extend far beyond their cores and virial radii, and in order to achieve a more informed understanding of the role of environment on galaxy evolution, it is important to extend analyses to projected radii greater than R200. This is a challenging task, as the reduced density of the cluster density profile results in a decreased contrast with the foreground and background (Newman et al. 2013), so large and wide-field spectroscopic studies are required to conclusively establish membership in these regions.
For this reason, we undertook a wide-field imaging and spectroscopic follow-up of the EDisCS clusters. The imaging consisted of data covering approximately ′ around the cluster. The VRI photometry was observed with the Wide Field Imager (WFI) on the 2.2m Max Planck Gesellschaft/European Southern Observatory (MPG/ESO) telescope (Baade et al. 1999), while Bz observations were completed on the MOSAIC instrument on the Cerro Tololo Inter-American Observatory (CTIO) Blanco or Mayall 4-meter telescope. The -band data were taken with the NEWFIRM instrument on the Mayall telescope. These imaging observations are described in detail in Just et al. 2019 and Mann et al. (in prep). The spectroscopic component of the survey was conducted with the Low-Dispersion Prism (LDP) on IMACS/Magellan, which covers out to 6 for our clusters. These observations produced a deep catalog of 25,000 redshifts with an accuracy of = 0.007 and a high spectroscopic completeness up to RAUTO 23.3 (Just et al. 2019). This information is crucial towards establishing cluster membership beyond the central core as in previous EDisCS studies and allows for targeted followup observations of groups or infalling populations.
As described in Just et al. 2019, we derived rest-frame and (hereafter ) colors for all of our galaxies. Due to residual zeropoint calibration issues, these colors required secondary adjustments to bring them in line with the colors as measured for core galaxies from the EDisCS survey. This process is described in Appendix A. Following those adjustments, we have reliable colors that can be used to separate galaxies into quiescent and star-forming (Wuyts et al. 2007; Williams et al. 2009, e.g.). However, the way in which we performed the adjustments impacted the reliability of our -through- SEDs and added an unacceptable level of systematic uncertainty to SED-based stellar mass estimates. In §2.6 we describe our alternate method for our computation of the stellar mass using just the calibrated colors.
Just et al. 2019 utilized the theory of secondary infall to identify the infall region of the galaxy clusters with the equations given in White & Zaritsky 1992. This theory describes how shells of mass evolve with redshift when centered on a cosmic perturbation; shells that are contained within a critical mass will eventually follow a gravitational collapse and become bound. The outermost boundary of the mass shell that experiences collapse at the cluster redshift is defined as the infall radius.
Followup observations with HST were possible due to the extensive spectroscopic and photometric coverage of the EDisCS sample in Just et al. 2019 and the proven abilities of the grism with 3DHST (Momcheva et al. 2016) and GLASS in dense cluster environments (Treu et al. 2015). From the full EDisCS sample of 17 EDisCS clusters we selected four clusters for follow-up with the HST/WFC3 G102 IR grism to produce high-spatial resolution emission line maps for individual galaxies. These clusters were chosen according to the following criteria: 1) The ability of HST to observe H with the G102 at the redshift of the cluster and 2) the degree to which the infall region of the cluster was populated with groups at a range of cluster-centric radii and with enough galaxies in each group so as to maximize the multiplexing efficiency for the grism observations.
These clusters have a velocity dispersion ranging from km s-1, which is squarely in the middle of the velocity dispersion range of EDisCS clusters (Halliday et al. 2004; Milvang-Jensen et al. 2008b). The limited range in velocity dispersion of our target clusters will help to minimize and halo-mass dependent cluster-to-cluster variations (Poggianti et al. 2006; Moran et al. 2007). Just et al. 2019 performed a characterization of the infall region of the EDisCS clusters using the LDP spectroscopy, which showed that red galaxies are more clustered than blue galaxies. Because of the magnitude limited density-dependent sparse spectroscopic target sampling, the limited number of galaxies in each cluster’s infall region, and because of the aggressive masking of bright stars in the targeting (Fig. 1), it is significantly more difficult to characterize local densities in the infall region and to identify other structures, like filaments. Details for each pointing including cluster membership and location are listed in Table 2.
2.2 Field Sample
In order to form a comparison set of galaxies in an effort to constrain environmental effects from the cosmic web, we establish a field sample that is assumed to occupy a less dense and interactive region of the universe. Nearly of all galaxies in the universe reside in the field and have been the subject of many surveys such as 3DHST (Momcheva et al. 2016) and CANDELS (Grogin et al. 2011). However, no large H field sample with significant ancillary data exists at the redshift of our clusters, so we therefore construct a field sample from our own data. In our study, we construct the field using HST-observed galaxies within each pointing FOV in the range of 0.4 z 0.7 that lie outside 0.02 of each cluster redshift. This span in redshift is dictated by the range of our four target clusters.

HST/WFC3 G102 observations are represented by the black squares, where the two unused infall pointings in Cl1059 are dashed. The distributed sampling among the core and infall region allows for a direct comparison of SFRs by environment.


2.3 HST/WFC3 observations
We obtained HST/Wide Field Camera 3 F105W imaging and G102 grism spectroscopy in a Cycle 20 program (GO-12945: PI Rudnick) for four EDisCS clusters at z 0.5 to target star-forming H emitters. Details for each cluster in this study are listed in Table 1.
There are 14 pointings consisting of two orbits each (2800 seconds) that are distributed over the four clusters, where 15% of the time is devoted to F105W (rest-frame R-band) direct imaging and the remaining 85% used for G102 grism spectroscopy. This is a similar split between modes as in 3DHST (Nelson et al. 2012; Momcheva et al. 2016). The distribution of the pointings aims to equally cover the cluster core and infalling region in each cluster in order to sample a range of environments, as shown in Figure 1. The infall region pointings were chosen based on a preliminary LDP catalog to contain projected overdensities of blue galaxies spectroscopically confirmed to lie at the cluster redshift. The LDP catalog underwent significant revisions following the original targeting and some of the originally chosen projected groups reduced their density contrast. Of the 14 pointings, only 12 are utilized due to unreliable photometry in Cl1059; this results in the loss of two infall pointings, which are designated as dashes in Figure 1. There are a total of 581 galaxies with LDP redshifts in these 12 pointings, which will be further reduced based on H detection.
The G102 grism spans a wavelength range of 0.7 – 1.1m, which contains the H emission for 0.4 z 0.7. As the brightest Balmer series emission line, the H flux can straightforwardly be transformed into a SFR (see § 2.5 for a further explanation) and is an excellent tracer of nearly instantaneous star-formation on 10 million year timescales, despite having typical attenuation of magnitudes.
The G102 grism resolution of 700 km s-1 is much higher than the typical internal galaxy velocity dispersion, which results in a resolved H map of the galaxy. The emission line map is produced by subtracting a polynomial fit to the background from the 2D spectrum, where the emission line is initially masked. The residual provides an image of the galaxy at a given wavelength within the grism range for the masked emission line. An example of z 1 H emission line maps are available from 3DHST observations in Nelson et al. 2012. Additionally, as a robust optical tracer, H can detect SFR to low surface brightness levels, which is crucial for creating a sample that encompasses galaxies as they are shutting off star formation. The SFR detection limit is variable depending on the extent and morphology of the galaxy, which makes defining a detection limit nontrivial. The lowest log(SFR) derived in this study are M yr-1, which is considered a typical value for a regular star forming galaxy at masses similar to our target galaxies.
| Pointing ID | RA | Dec | Location | Ngalaxies | Ncluster | Nfield |
|---|---|---|---|---|---|---|
| (hours) | (degrees) | (cluster/infall) | (H) | (H) | ||
| (1) | (2) | (3) | (4) | (5) | (6) | (7) |
| Cl1059-12.0 | 10:59:08.16 | -12:45:05.04 | I | 161 | x | x |
| Cl1059-12.1 | 10:59:03.36 | -12:51:59.04 | I | 152 | x | x |
| Cl1059-12.2 | 10:59:14.16 | -12:53:11.04 | C | 152 | 8(4) | 15 |
| Cl1059-12.3 | 10:59:32.16 | -12:54:12.64 | C | 179 | 17(2) | 12 |
| Cl1138-11.0 | 11:38:16.56 | -11:33:23.04 | C | 80 | 15(6) | 13(24) |
| Cl1138-11.1 | 11:38:51.60 | -11:33:30.24 | I | 108 | 4 | 5(4) |
| Cl1138-11.2 | 11:37:54.48 | -11:30:23.04 | I | 179 | 3(1) | 7 |
| Cl1227-11.0 | 12:28:02.40 | -11:35:11.04 | C | 117 | 3(4) | 3(2) |
| Cl1227-11.1 | 12:28:08.16 | -11:31:02.64 | I | 167 | 3 | 5(3) |
| Cl1227-11.2 | 12:28:20.64 | -11:30:59.04 | I | 129 | 3 | 9(3) |
| Cl1301-11.0 | 13:01:35.76 | -11:36:59.04 | C | 167 | 4(3) | 3(6) |
| Cl1301-11.1 | 13:01:25.44 | -11:31:42.24 | I | 143 | 6(3) | 6(1) |
| Cl1301-11.2 | 13:01:33.36 | -11:40:27.84 | C | 184 | 5(7) | 1(5) |
| Cl1301-11.3 | 13:01:02.88 | -11:30:15.84 | I | 145 | 4 | 7(5) |
2.4 Data Reduction
GRIZLI (grism redshift & line analysis software for space-based slitless spectroscopy)11 1 GRIZLI is written and developed by Gabriel Brammer and is publicly available as open-source software (Brammer et al. 2016). github.com/gbrammer/grizli is a reduction and extraction pipeline in Python that allows for end-to-end processing of WFC3 data, starting from a query of the ESA Hubble Science archive to download all of the data associated with an observation ID. It then performs a routine calibration of the data, including image background sky subtraction, alignment and flat-fielding, resulting in the two drizzled mosaic data products shown in Figure 2. The WFC3 camera captures both an infrared 1.05m direct image (F105W) and the spectrum as a dispersed image for each object in the FOV (G102 grism). The 2D spectra are the streaks, which represent the flux of each object as it is spread out over the range (0.7 – 1.1m) of the grism. Several conditions may make a grism spectrum unusable, including contamination from a bright source, low signal-to-noise, or FOV restrictions. All sources included in our analysis are visually inspected for artifacts or poor modeling. While the analysis focuses on galaxies with S/N H 3, those with 3 are presented as down arrows in several figures.
2.5 H Line Extraction & Redshift Prior
The redshifts in GRIZLI are fit using a coarse grid (resolution 0.005) with three line complex templates composed of 1) [OII]+[NeIII], 2) [OIII]+H, and 3) H+[SII] + weaker red lines. Each of the line complexes has fixed line ratios in order to reduce line misidentification and break redshift degeneracies. A minima in the -squared fit on the redshift grid allows for the best fit determination of the redshift.
To reduce the misidentification of other emission lines as H, a redshift prior is utilized during extraction within GRIZLI. Priors are derived from the LDP spectroscopic or the wide-field photometric redshift surveys. To determine the probability distribution (P(z)) in Equation 1,
| (1) |
the prior is multiplied by the GRILZI redshift fit, using either a Gaussian probability (Just et al. 2019) with a = 0.007 or the average of the 68% photometric redshift confidence levels, respectively. Figure 3 is a demonstration of applying the prior to a low S/N H galaxy that changes the determined redshift by 0.2, which is significant when cluster membership is determined within a 0.02 range in z.


.
A full set of data products for a strong H emission line Cl1059 cluster member is shown in Figure 4. This galaxy has a spectroscopic prior applied, but it also had a well-determined redshift based solely on the blind GRIZLI extraction. A comparison between the available redshifts for each galaxy in this sample with and without priors is shown in Figure 5. The general agreement of GRIZLI z extractions without a prior to the wide-field catalog of spectroscopic and photometric redshifts supports the usage of this software in H line identification without previous information, but it is most important for low S/N emission lines or quiescent galaxies where a prominent emission line may not exist. These lower S/N sources are critical for encompassing a range of SFRs in a main sequence analysis and exclusion of these galaxies would introduce a bias towards strong emission line galaxies.
This dataset has three types of redshifts available: GRIZLI, GRIZLI + Gaussian prior from a spectroscopic LDP, and GRIZLI + Gaussian prior from a photometric wide-field, where the prior is described in Equation 1. GRIZLI is first run without any priors, and is then rerun to include a prior with either a spectroscopic LDP or photometric wide-field redshift for each galaxy. When compared for sources with H S/N 3, the blind GRIZLI redshifts do remarkably well, with 85% matching the extracted redshift with an LDP prior and 62% for the photometric prior as shown in Figure 5.
2.6 Stellar Masses and Star-formation Rate Corrections
As described in §2.1.2 and Appendix A, due to the calibration issues with our photometry we cannot derive stellar masses for our sample using SED fitting techniques. However, we have calibrated our rest-frame colors by comparing them to the valid colors from the EDisCS survey. We therefore determine our stellar masses using the relation between rest-frame color and -band stellar mass-to-light ratio that is derived from continuous star formation history (SFH) models with a variety of Calzetti et al. 2000 attenuation laws. This approach is similar to that used by various authors (Bell & de Jong 2001; Vulcani et al. 2010; Taylor et al. 2011, e.g.) and is primarily valid for galaxies with continuous SFHs. The derivation of our specific relation is provided in Mann et al. (in prep.) The relation we adopt is:
| (2) |
where
| (3) |
and is the flux through the redshifted rest-frame V-band filter, DL is the distance luminosity, and LV is the rest-frame luminosity of the sun in V-band. Stellar masses determined from a single color can have systematic errors on the order of 0.3 dex stemming from variations in the dust attenuation, metallicity, and SFH. In addition, we applied systematic corrections of less than 0.2 mag to our colors that may also be uncertain and can result in additional stellar mass errors up to 0.2 dex. We therefore conservatively assume stellar mass uncertainties up to 0.5 dex, with the consideration that the statistical uncertainties on photometric measurements are significantly less than this, especially for the bright galaxies with LDP redshifts, and can be ignored.
The mass-completeness level is independently identified at this value through 1) a comparison of the stellar masses of the 163 HST-observed galaxies to the ULTRAVISTA star-forming subset at a similar redshift range and 2) by the 2 distribution of all star-forming galaxies in the EDisCS sample from Just et al. 2019 within the photometric completeness limit and redshift range. This results in a mass-complete value of 10/.
GRIZLI outputs a line flux, but there are several intrinsic properties that need to be accounted for while calculating a SFR. Following the prescription in Carleton et al. 2020, a series of corrections are applied to achieve a correct H-based SFR. The resolution of the grism is not fine enough to distinguish between the H and [NII] line doublet emission, indicating that measured line fluxes include the contribution of [NII] and therefore need to be reduced to account for the additional flux. Strom et al. 2017 find that the [NII] contribution is uniform across SFR per given stellar mass, so Carleton et al. 2020 calculates this reduction through a mass-dependent metallicity relation. The mass-metallicity relation is derived from Zahid et al. 2014, which is then transformed into an H/[NII] ratio (Kewley & Ellison 2008), resulting in a flux reduction of for our sample. Carleton et al. 2020 required a correction for z 1 galaxies, while 3D-HST (Wuyts et al. 2011) found . There is a secondary dependence of the metallicity on the SFR at a fixed stellar mass known as the Fundamental Metallicity Relation (Mannucci et al. 2010, FMR;). We used the FMR to determine how much the metallicity correction changes over the range of SFRs in our sample. As we discuss in §3.2, our mass-complete galaxies range in (SFR) from -0.5 to 0.5. At ) = 10.0, the FMR predicts that log(O/H) changes from 8.82 to 8.98. In comparison, at = 0, the FMR predicts that log(O/H) changes from 8.8 to 9.07 over the full mass range of our mass-complete sample ) = 9.7 to 11. While the mass dependence of the metallicity dominates over the residual dependence on the SFR, the dependence on the SFR is not negligible. This implies that we may be underestimating the uncertainty in this correction. However, [N ii]/H saturates at high metallicity, which should minimize the effect of this residual SFR dependence on our results.
The H line is also contaminated with emission from post-AGB stars and this is remedied by subtracting erg s-1 M from the line luminosity (Carleton et al. 2020), where the factor of two comes from the 1:1 ratio of [NII]/H lines (Belfiore et al. 2016) and the factor comes from the expected contribution of ionization by the post-AGB stars. When compared to the H line luminosity ( – ), the post-AGB emission is negligible. This correction is equivalent to a reduction in the specific SFR of yr-1.
Dust within each galaxy is responsible for the extinction and scattering of light and thus, contributes towards suppressed H emission lines and SFRs. We correct for H attenuation following the approach from Wuyts et al. 2013, who relate the attentuation at H (AHα) to that in the continuum at 6563Å () using the relation . As demonstrated in Carleton et al. 2020 using Balmer decrements from the LEGA-C survey (van der Wel et al. 2016), the Wuyts et al. 2013 approach yields line attenuations within 0.32 mag of the Balmer-decrement approach, with a 1.2 mag scatter and no dependence of the disagreement on the measured extinction.
Given the limited spectral coverage of the G102 grism and the issues with our SED calibration discussed earlier in the text, we cannot compute A directly for each galaxy. Instead, we develop a method to derive a statistical attenuation correction in which we determine the dependence of A on color for a sample of galaxies from UltraVISTA which have extremely well characterized SEDs and redshifts (Muzzin et al. 2013). We use a subset of ULTRAVISTA galaxies with a similar redshift and stellar mass distribution to our own and fit their SEDs using MAGPHYS (da Cunha et al. 2008), which is a Bayesian SED fitting code that deals with attenuation both from birth clouds and from diffuse dust. Neither of these is a good approximation for the total attenuation used in the Wuyts et al. 2013 formula used above. We therefore derive the effective total continuum extinction by taking the ratio of the attenuated and unattenuated model for each galaxy at 6563Å, where the attenuated model folds in the distinct attenuation sources for the different stellar populations. We then derive the optical depth at 6563Å ), where is the flux of the attenuated SED and logo is the unattenuated SED curve. We compute the attenuation in magnitudes as .
We then compute the median ULTRAVISTA attenuation in 0.2 mag bins of color-space and apply to each EDisCS galaxy the attenuation corresponding to the appropriate color cell (Figure 15). This final correction for AHα is folded into the H SFR, which is calculated from Kennicutt & Evans 2012 as
| (4) |
where
| (5) |
The median H attenuation correction is 0.48 for the mass-complete sample, and is 0.79 and 0.26 for our UVJ star-forming and quiescent galaxies respectively.

3 Results
3.1 Galaxy Sample Properties
From the Just et al. 2019 catalog, there are 581 EDisCS galaxies in the 12 HST pointings FOV. This is further reduced to 326 after limiting the redshift range to 0.4 z 0.7. Adopting a S/N in H cut 3 results in 190 sources in the sample. Finally, removing extractions that are unsatisfactory due to poor contamination modeling, artifacts, or being on the edge of the chip result in a sample of 163 galaxies, of which 67 (30 core, 13 infall, 24 field) are above the mass-complete limit of log10(/M) = 9.75. This mass-complete sample of H-emitter galaxies is dominated by blue, star-forming objects as shown in the UVJ diagram in Figure 6. We discuss corrections to the wide-field photometry in more detail in Section A.
In Figure 7, we present the distributions of the stellar masses and redshift for each environment in the mass-complete sample. While the core and infall have similar median values for M∗ (K-S statistic of 0.12), the field masses average slightly higher. However, they follow a similar distribution with a 2-sample K-S statistic of 0.32 and 0.29 with the core and infall regions, respectively.
In contrast, the redshift distributions have significant differences (K-S statistics: core-infall (0.60), core-field (0.65), infall-field (0.46)), with the field having the highest median value of the three environments. We therefore correct the SFRs of field galaxies to the median redshift of the cluster sample (0.48) using the following relation from Schreiber et al. 2015.
| (6) |
Here, r = log10(1 + z), where z is difference between the median and individual redshift, m0 = 0.5, a0 = 0.15, a1 = 0.3, m1 = 0.6, a2 = 2.5 and m = log10(M∗/109M⊙). For each galaxy in the field we compute the difference in SFR that would be expected from Eq. 6 between the galaxy and median redshift. We apply that difference to correct the SFRs to the median redshift. This allows us to correct for any variation in the SFR that comes from redshift evolution. The lack of an infall sample in Cl1059 at z = 0.4564 is likely driving the variation in the median z’s between the core and infall distributions.


3.2 Stellar Mass – SFR Relations


In Figures 8 and 9, we present the H-derived SFR – M∗ main sequence relation and specific SFR for four EDisCS clusters separated into three environments: core (blue circles), infall (purple triangles) and field (green stars) for 163 galaxies in the left panel. In the right panel, galaxies are divided by their classification from Figure 6, where red triangles are defined as UVJ-quiescent. Both panels include galaxies with S/N in H 3 as down arrows at their 3 upper limit SFR. A scatter of 1 dex is observed across all masses with a lack of flattening of the SFR relation for more massive galaxies in the cluster core as shown with Schreiber et al. 2015. The median (SFR) for the mass-complete sample with S/N 3 in H is 0.25 with a standard deviation of 0.43, while the star-forming sample has a median of 0.46 and standard deviation of 0.37. The infall times of galaxies into the cluster environment can vary and contribute towards this large scatter, which is double the 1 value of 0.25 dex in GLASS clusters from Vulcani et al. 2016. The mean SFRs for the three EDisCS clusters in Finn et al. 2005 at z = 0.75 are shown as orange squares. 2D image cutouts of the stellar and H maps for the UVJ quiescent are available in Figure 14. We also show the SFR – M∗ distribution on a cluster-by-cluster basis in Figure 10. The apparent distribution of galaxies seen in Figure 8 is not dominated by any individual cluster, but rather contains small contributions from each cluster. The distribution of SFRs appears to be similar between the clusters.


There are 21 galaxies identified as quiescent based upon the Just et al. 2019 UVJ rest-frame colors, with five of them being in the core, two in the infall, and nine in the field. These are identified as red triangles in the right panel of Figure 8. As seen in Figure 6, there are galaxies that are quiescent based on their UVJ colors, but which have significant H emission. We will discuss these galaxies in §4. GRIZLI produces a stellar continuum and emission line map for each observed galaxy, which is shown in Figure 14 for select galaxies.
In Figure 11, we compare our H SFRs to those derived from Spitzer MIPS 24m emission (Finn et al. 2010). The observations from Finn et al. 2010 only covered the central regions of the EDisCS clusters. Therefore, our comparison only involves galaxies that are either in the core or are field galaxies in the central projected area of the cluster. Many of the galaxies in our H sample are not detected in 24µm. 15 galaxies (14 core and one field) in our H sample are detected at 24µm and these have SFR(H) that are very well correlated with SFR(24µm) but are lower by 0.2 – 0.3 dex. Given the median attenuation at H of 0.46 mag, it is reasonable to assume that we might have slightly underestimated our attenuation values towards H. It might also be that the 24µm detections are biased towards galaxies with a higher-than-average amount of obscured star formation. To test the robustness of our attenuation correction, we computed an alternate correction from Kennicutt & Evans 2012 in which observed H is corrected for attenuation using a scale applied to the total IR luminosity () such that . was determined in Finn et al. 2010 using Chary & Elbaz 2001 to scale the observed 24µm flux to . The SFR derived from this alternatively corrected H luminosity is very close to our default value, with a median difference of only 0.13 dex and a scatter of 0.17 dex. These comparisons give us confidence that our -derived attenuation is comparable to that derived using IR estimates. As a final note, in Appendix 16, we show a comparison of the main sequence from different authors at the same redshift. These estimates use both H and UVIR SFR indicators and also differ by dex. This underscores the systematic uncertainty inherent when comparing different SFR indicators. As an alternative way of comparing the SFRs across environment, in Figure 12 we show the distribution of the SFR with respect to the cluster-based main sequence from Vulcani et al. 2016 for each of the three environments in the mass-complete sample. The median SFR for each environment is 1 dex below the relation from Vulcani et al. 2016. While this offset may indicate problems with our extinction correction, we showed above that our H based SFR measurements are within 0.2 – 0.3 dex of those based on the IR. We also demonstrate the systematic offsets in SFR estimates among different authors and attribute part of our disagreement with Vulcani et al. 2016 to this difference. We performed 2-sample K-S tests on the mass-complete sample comparing core, infall, and field galaxies for all galaxies, star-forming galaxies, and quiescent galaxies. In all cases the K-S probabilities were significantly larger than 0.05. Therefore, we cannot rule out the null hypothesis that the core, infall, and field galaxies are drawn from the same SFR distribution.
In Figure 13, we plot the SFR result as a function of distance from the cluster center in relation to R200, where the mass-complete cluster sample ( 109.75M) is represented as the blue stars and the field galaxies are shown in green as a median SFR. Cluster galaxies below the mass-complete limit are plotted as grey down arrows at the 3 limit. The median for the mass complete cluster member sample in the core and infall region is shown as a purple triangle with 1 bootstrap resampling error bars. There is no observable difference in the SFRs between the three environments as in Figures 8.
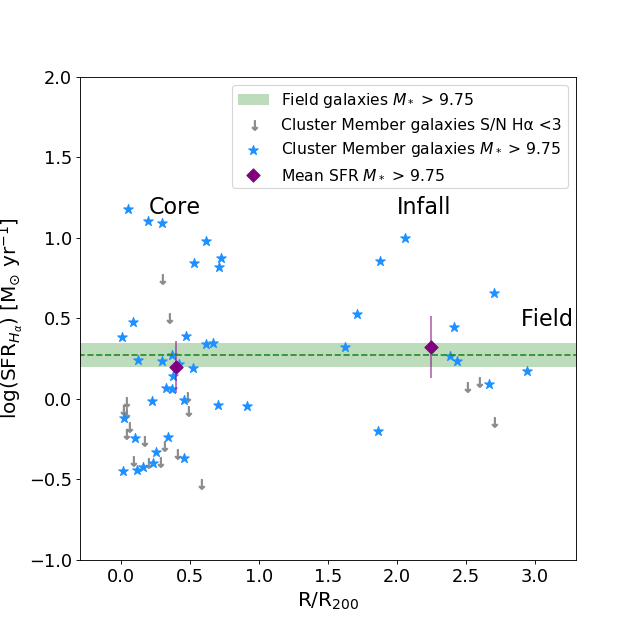
4 Discussion
In this study, there is no significant difference in the distribution of SFRs between environments. The EDisCS cluster galaxies are roughly aligned with the GLASS clusters H-SFRs main sequence relation, which also does not reveal a variation from the field SFRs (Vulcani et al. 2016). Koyama et al. 2013 finds a similar result with H observations of clusters, but the SFR limits are not deep enough to detect significantly suppressed galaxies. However, the lack of an environmental dependence on the SFR that is normally seen across all masses contradicts the notion that dense environments are contributing or directly responsible for gas quenching as evidenced by the buildup of quiescent galaxies (Patel et al. 2009; Vulcani et al. 2010; Paccagnella et al. 2016). Indeed, the cores (Poggianti et al. 2006) and infall regions (Cooper et al. in prep.) of the EDisCS clusters have a higher quenched fraction than the co-eval field, indicating that our clusters and their environments host processes that suppress galaxy star formation.
The lack of a dependence of the SFR on environment that we find here can potentially be explained in the following ways. First, our sensitivity limits are not low enough to detect galaxies with significantly suppressed SFRs. This is evident in Figure 8 in that the majority of the 3 S/N galaxies appear to populate the bottom of the main sequence. Thus, there may be a tail of galaxies to lower SFRs, but we would be unable to detect this population with our data. The importance of highly sensitive SFR limits to interpret the distribution of SFRs in dense environments is illustrated in Vulcani et al. 2010, in which they do find an excess of galaxies in EDisCS clusters with low SFRs compared to those in the field, but only because they probe well below the main sequence.
It is also possible that the galaxies within our sample have not experienced significant quenching and the reasons for this vary by environment. Within the core, galaxies may have been recently accreted and are still within the ‘delay’ period of the quenching process. In the infall region, the local density is lower than that of the core and may not create conditions capable of quenching.
Thirdly, the lack of a difference in field vs. cluster SFRs could mean that the timescale for the truncation of SF is rapid. In this case, galaxies that are undergoing external quenching will fall below our detection limits before we can observe them in their reduced SFR state. Such a rapid decline in SFRs caused by dense environments is consistent with the excess of post-starburst galaxies in dense environments as seen by Poggianti et al. 2008, Muzzin et al. 2012 and Wild et al. 2016. It is not immediately clear why there is a diversity in the distribution of SFRs in different environments among different published works. It may be that much of the ‘action’ is in the tails of the distribution, which requires not only deep observations, but also large sample sizes to characterize the distribution shapes well away from the median. Observations with the James Webb Space Telescope or deep UV+IR observations with WISE in the local universe may satisfy this criteria.
We should also consider that our cluster core and infall samples could likely contain interlopers, which has been estimated to be 15% or more for clusters with historical datasets (Duarte & Mamon 2015; Wojtak et al. 2018). These galaxies may appear to be spectroscopic members by superposition or our redshift determination is incorrect.
Finally, some of our clusters have significant substructure, e.g. Cl1138.2-1133 (De Lucia et al. 2009), which may make clustercentric radius a poor proxy for environment. As a result, a given range in clustercentric radius could contain a large variation in local density, and in fact does for some of our clusters (Just et al. 2019). As locally dense regions host higher quenched fractions (Patel et al. 2009; Just et al. 2019), this variation in local density could translate directly to a variation in the quenching efficiency at a fixed clustercentric radius.
4.1 UVJ-quiescent galaxies with H emission
There are 21 galaxies in the quiescent region that have H emission that is detected with S/N (Figure 6). These galaxies lie systematically closer to the dividing line between quiescent and star-forming galaxies than the rest of quiescent galaxies, however they still exist at red colors consistent with the larger passive population. As can be seen in Figure 8, these -quiescent H emitters also have systematically lower SFRs than -SF galaxies of the same stellar mass, and none have SFR greater than 3 M⊙ yr-1. The extend to SFR as low as 0.3 M⊙ yr-1. Continuum and emission-line postage stamps for all these galaxies are shown in Figure 14. The emission is faint but visible in all 2D stamps and in the 1D spectrum and the spectra are free of artifacts. We entertain four possibilities to explain these sources.
First, we must explore the possibility that our rest-frame colors are uncertain and that these nominally -quiescent galaxies with H emission actually lie in the SF region but were moved into the quiescent region by random and systematic rest-frame color errors. This is a potential concern, especially given the calibration challenges that we experienced with the wide-field data and the additional rest-frame color corrections described in Appendix A. We test for this possibility by comparing the colors as derived from the photometry in this paper with the colors derived from the original EDisCS photometry in the cluster cores. The original EDisCS photometry is well calibrated and results in a very well defined passive clump at the correct color location. We verified that the colors derived from the wide-field data are slightly different from the EDisCS colors on a galaxy-by-galaxy basis, but that the differences are not significant enough to move galaxies in and out of the passive region. Therefore, we conclude that these galaxies are indeed in the -quiescent region and that we should discuss the implication of them having significant amounts of H emission.
Second, it is possible that weak AGN may be contributing to some of the emission. With our data we cannot explicitly rule out the role of an AGN. Martini et al. 2009 found only two X-ray AGN in 17 clusters at . There are some objects that have spatially compact and linearly extended residuals in the emission line maps in Figure 14, e.g. Cl1059-12.2-447, Cl1227-11.2-259. This could be an indicator that the continuum shape is not well modeled by the GRIZLI continuum subtraction, which could occur of the continuum has significant non-stellar contributions from an AGN as such templates are not included in the GRIZLI continuum models. While this is a possibility, the emission lines for these galaxies, which admittedly have low signal-to-noise, do not look broad in the 1D spectra. We examine the position in the SFR – M∗ plane of the 11 objects with such linear residuals and find that they do not occupy any favored place in either stellar mass or SFR, being sparsely spread in both quantities and not preferentially biasing the main sequence in any parameter. If these linear features do indeed correspond to AGN, the lack of bias with respect to the SFR – M∗ plan would indicate that contamination by AGN is a minor contributor to the H flux in this population.
Third, it is possible that the H emission comes from a ‘LIER’-like phenomena (Sarzi et al. 2006; Singh et al. 2013; Belfiore et al. 2016; Rudnick et al. 2017) in which gas from mass loss and accretion in quiescent galaxies is being heated by preexisting stellar populations, mostly post-AGB stars. ‘LIER’ stands for ‘low-ionization emission-line region’, which occurs in passive galaxies that have an emission line, much like the subset of UVJ-passive galaxies with H emission. In a similar emission line study, Rudnick et al. 2017 showed that [OII] emission in EDisCS quiescent galaxies was less common in galaxies in the EDisCS clusters and groups than in the field, where quiescent [OII] emitters comprised of the quiescent population with M in clusters and groups, and in the field. Those authors attributed this suppression of [OII] in clusters to a combination of hydrodynamic stripping and a cutoff of gas accretion in dense environments. We do not have enough galaxies in this EDisCS subsample to make the same comparison but this could be a similar population of red emission line galaxies.
The fourth possibility is that we are catching galaxies as they are in the process of quenching their star formation and moving from the star-forming to quiescent region. In this case the low SFRs and position closer to the boundary of the -quiescent region could indicate that these galaxies are leaving the main sequence and joining the population with much lower SFRs (Cantale et al. 2016; Foltz et al. 2018; Belli et al. 2019; Carnall et al. 2020). Such red emission line galaxies may be similar to those seen in other works (Wolf et al. 2009; Vulcani et al. 2010; Koyama et al. 2011) and could represent a distinct phase in the quenching of galaxies. These results imply that caution must be taken in interpreting the true quiescent nature of galaxies classified by techniques as truly quiescent. To assess if these -quiescent H emitters are truly quenching, it would be beneficial to obtain high signal-to-noise spectra at medium resolution to model the spectra and search for evidence of young stellar populations (Webb et al. 2020). We could also obtain deep molecular gas observations to probe the cold gas reservoirs that would be needed to power the observed star formation.
5 Conclusions & Future Work
In this paper, we explore the environmental dependence of spectroscopically-derived H star-formation in three distinct regimes in the vicinity of four galaxy clusters at : cluster cores, infall regions, and the field. We combine HST/WFC3 G102 grism observations at 1m with photometric and spectroscopic redshift priors to obtain a sample of 67 galaxies with secure redshifts, S/N in H 3 and which are above our mass completeness limit for star-forming galaxies of M∗>.
Our main findings are summarized as the following points:
- 1.
With the combination of grism and redshift priors, we can obtain precise and accurate redshifts for galaxies with a range of stellar masses and intracluster locations.
- 2.
We find no difference in the distribution of SFRs for galaxies in the three environments or as a function of radius from the cluster out to 3R200.
- 3.
We find 21 galaxies that are identified as -quiescent galaxies, but which have significant amounts of H emission. We explore possible explanations for this emission that include star formation in quenching galaxies, AGN, and excitation of the gas by post-AGB stars. We conclude that there may be contributions from all of these scenarios.
- 4.
The similarity of the SFR distributions for our core, infall, and field samples may be attributed to the delayed-then-rapid quenching scenario, where galaxies are unaffected for the first two – four Gyr that they reside in the cluster environment, followed by a rapid quenching event that leaves the distribution of SFRs for star forming galaxies unaffected. We cannot conclusively test this scenario without significantly more galaxies measured to lower SFR sensitivity limits. However, it is possible that our H-detected galaxies have not experienced significant quenching processes. For the infall galaxies, this can be because of the relatively low densities that they inhabit while for the core galaxies it may be that they have recently been accreted by the cluster and are still in the “delay" phase of their eventual quenching. Whichever intrinsic and extrinsic processes that do affect star formation in the infall regions and cores of our clusters must do so in a way that preserves the indistinguishable distribution of SFRs in the different environments, at least at the level constrained by our data.
One possibility for using this dataset to explore the effect of environment on the star formation properties of galaxies would be to analyze the relative size of the stellar (traced by F105W) and H disks. As different processes may result in a different ratio of these sizes, this may provide a new constraint on the quenching process. We will explore this in a future work.
Acknowledgements
GR acknowledges support from the National Science Foundation grants AST-1517815, AST-1716690 and NASA HST grant HST-GO-12945.001. GR also acknowledges the support of an ESO visiting science fellowship. The work in this paper benefited significantly from interaction conducted as part of a team at the International Space Sciences Institute in Bern, Switzerland. JC thanks the Madison & Lila Self Graduate Fellowship at the University of Kansas for financial and professional support. YJ acknowledges financial support from CONICYT PAI (Concurso Nacional de Inserción en la Academia 2017) No. 79170132 and FONDECYT Iniciación 2018 No. 11180558. BV acknowledges financial contribution from the contract ASI-INAF n.2017-14-H.0, from the grant PRIN MIUR 2017 n.20173ML3WW_001 (PI Cimatti) and from the INAF main-stream funding programme (PI Vulcani). We thank Matthew Kirby for his assistance with producing the LDP redshifts that were used in this work.
Data Availability
The raw HST data are available through MAST (Program ID 12945). The ground-based redshift catalog is available in Just et al. 2019 for clusters Cl11138, Cl1227, and Cl1301, while Cl1059 is available in White et al. 2005; DOI - 10.3847/1538-4357/ab44a0. Additional data on derived physical parameters are available in this paper.
References
- Abramson et al. (2018) Abramson L. E., et al., 2018, AJ, 156, 29
- Baade et al. (1999) Baade D., et al., 1999, The Messenger, 95, 15
- Balogh et al. (1997) Balogh M. L., Morris S. L., Yee H. K. C., Carlberg R. G., Ellingson E., 1997, ApJ, 488, L75
- Balogh et al. (2016) Balogh M. L., et al., 2016, MNRAS, 456, 4364
- Barro et al. (2014) Barro G., et al., 2014, ApJ, 791, 52
- Belfiore et al. (2016) Belfiore F., et al., 2016, MNRAS, 461, 3111
- Bell & de Jong (2001) Bell E. F., de Jong R. S., 2001, ApJ, 550, 212
- Bell et al. (2004) Bell E. F., et al., 2004, ApJ, 608, 752
- Belli et al. (2019) Belli S., Newman A. B., Ellis R. S., 2019, ApJ, 874, 17
- Bouché et al. (2010) Bouché N., et al., 2010, ApJ, 718, 1001
- Bouwens et al. (2015) Bouwens R. J., Illingworth G. D., Oesch P. A., Caruana J., Holwerda B., Smit R., Wilkins S., 2015, ApJ, 811, 140
- Brammer et al. (2016) Brammer G., Lundgren B. F., Marchesini D., Momcheva I. G., Pirzkal N., Ryan R. E., Vang A., Wake D. A., 2016, Grizli: The Grism redshift & Line Database for HST WFC3/IR Spectroscopy, HST Proposal
- Brinchmann et al. (2004) Brinchmann J., Charlot S., White S. D. M., Tremonti C., Kauffmann G., Heckman T., Brinkmann J., 2004, MNRAS, 351, 1151
- Calzetti et al. (2000) Calzetti D., Armus L., Bohlin R. C., Kinney A. L., Koornneef J., Storchi-Bergmann T., 2000, ApJ, 533, 682
- Cantale et al. (2016) Cantale N., et al., 2016, A&A, 589, A82
- Carleton et al. (2020) Carleton T., Guo Y., Nayyeri H., Cooper M., Rudnick G., Whitaker K., 2020, MNRAS, 491, 2822
- Carnall et al. (2020) Carnall A. C., et al., 2020, MNRAS, 496, 695
- Chabrier (2003) Chabrier G., 2003, PASP, 115, 763
- Chary & Elbaz (2001) Chary R., Elbaz D., 2001, The Astrophysical Journal, 556, 562
- Clowe et al. (2006) Clowe D., et al., 2006, A&A, 451, 395
- Cucciati et al. (2012) Cucciati O., et al., 2012, A&A, 539, A31
- Daddi et al. (2007) Daddi E., et al., 2007, ApJ, 670, 156
- De Lucia et al. (2004) De Lucia G., et al., 2004, ApJ, 610, L77
- De Lucia et al. (2009) De Lucia G., Poggianti B. M., Halliday C., Milvang-Jensen B., Noll S., Smail I., Zaritsky D., 2009, MNRAS, 400, 68
- De Lucia et al. (2012) De Lucia G., Weinmann S., Poggianti B. M., Aragón-Salamanca A., Zaritsky D., 2012, MNRAS, 423, 1277
- Desai et al. (2007) Desai V., et al., 2007, ApJ, 660, 1151
- Domínguez Sánchez et al. (2014) Domínguez Sánchez H., et al., 2014, MNRAS, 441, 2
- Dressler (1980) Dressler A., 1980, ApJ, 236, 351
- Duarte & Mamon (2015) Duarte M., Mamon G. A., 2015, MNRAS, 453, 3848
- Dutton et al. (2010) Dutton A. A., Conroy C., van den Bosch F. C., Prada F., More S., 2010, MNRAS, 407, 2
- Elbaz et al. (2007) Elbaz D., et al., 2007, A&A, 468, 33
- Erfanianfar et al. (2016) Erfanianfar G., et al., 2016, MNRAS, 455, 2839
- Finn et al. (2005) Finn R. A., et al., 2005, ApJ, 630, 206
- Finn et al. (2010) Finn R. A., et al., 2010, ApJ, 720, 87
- Finn et al. (2018) Finn R. A., et al., 2018, ApJ, 862, 149
- Foltz et al. (2018) Foltz R., et al., 2018, ApJ, 866, 136
- Fossati et al. (2017) Fossati M., et al., 2017, ApJ, 835, 153
- Fumagalli et al. (2012) Fumagalli M., et al., 2012, ApJ, 757, L22
- Fumagalli et al. (2014) Fumagalli M., et al., 2014, ApJ, 796, 35
- Gómez et al. (2003) Gómez P. L., et al., 2003, ApJ, 584, 210
- Gonzalez et al. (2001) Gonzalez A. H., Zaritsky D., Dalcanton J. J., Nelson A., 2001, ApJS, 137, 117
- Grogin et al. (2011) Grogin N. A., et al., 2011, ApJS, 197, 35
- Haines et al. (2015) Haines C. P., et al., 2015, ApJ, 806, 101
- Halliday et al. (2004) Halliday C., et al., 2004, A&A, 427, 397
- Hopkins et al. (2014) Hopkins P. F., Kereš D., Oñorbe J., Faucher-Giguère C.-A., Quataert E., Murray N., Bullock J. S., 2014, MNRAS, 445, 581
- Jaffé et al. (2016) Jaffé Y. L., et al., 2016, MNRAS, 461, 1202
- Just et al. (2019) Just D. W., et al., 2019, The Astrophysical Journal, 885, 6
- Karim et al. (2011) Karim A., et al., 2011, ApJ, 730, 61
- Kauffmann et al. (2004) Kauffmann G., White S. D. M., Heckman T. M., Ménard B., Brinchmann J., Charlot S., Tremonti C., Brinkmann J., 2004, MNRAS, 353, 713
- Kennicutt (1998) Kennicutt Robert C. J., 1998, ARA&A, 36, 189
- Kennicutt & Evans (2012) Kennicutt R. C., Evans N. J., 2012, ARA&A, 50, 531
- Kewley & Ellison (2008) Kewley L. J., Ellison S. L., 2008, ApJ, 681, 1183
- Kodama et al. (2004) Kodama T., Balogh M. L., Smail I., Bower R. G., Nakata F., 2004, MNRAS, 354, 1103
- Koyama et al. (2011) Koyama Y., Kodama T., Nakata F., Shimasaku K., Okamura S., 2011, ApJ, 734, 66
- Koyama et al. (2013) Koyama Y., et al., 2013, MNRAS, 434, 423
- Lang et al. (2014) Lang P., et al., 2014, ApJ, 788, 11
- Larson et al. (1980) Larson R. B., Tinsley B. M., Caldwell C. N., 1980, ApJ, 237, 692
- Lee-Brown et al. (2017) Lee-Brown D. B., et al., 2017, ApJ, 844, 43
- Lewis et al. (2002) Lewis I., et al., 2002, MNRAS, 334, 673
- Lotz et al. (2013) Lotz J. M., et al., 2013, ApJ, 773, 154
- Madau & Dickinson (2014) Madau P., Dickinson M., 2014, ARA&A, 52, 415
- Mannucci et al. (2010) Mannucci F., Cresci G., Maiolino R., Marconi A., Gnerucci A., 2010, MNRAS, 408, 2115
- Martig et al. (2009) Martig M., Bournaud F., Teyssier R., Dekel A., 2009, ApJ, 707, 250
- Martini et al. (2009) Martini P., Sivakoff G. R., Mulchaey J. S., 2009, ApJ, 701, 66
- McGee et al. (2011) McGee S. L., Balogh M. L., Wilman D. J., Bower R. G., Mulchaey J. S., Parker L. C., Oemler A., 2011, MNRAS, 413, 996
- Milvang-Jensen et al. (2008a) Milvang-Jensen B., et al., 2008a, A&A, 482, 419
- Milvang-Jensen et al. (2008b) Milvang-Jensen B., et al., 2008b, A&A, 482, 419
- Momcheva et al. (2016) Momcheva I. G., et al., 2016, ApJS, 225, 27
- Moran et al. (2007) Moran S. M., Ellis R. S., Treu T., Smith G. P., Rich R. M., Smail I., 2007, ApJ, 671, 1503
- Moustakas et al. (2006) Moustakas J., Kennicutt Robert C. J., Tremonti C. A., 2006, ApJ, 642, 775
- Muzzin et al. (2012) Muzzin A., et al., 2012, ApJ, 746, 188
- Muzzin et al. (2013) Muzzin A., et al., 2013, ApJS, 206, 8
- Muzzin et al. (2014) Muzzin A., et al., 2014, ApJ, 796, 65
- Nelson et al. (2012) Nelson E. J., et al., 2012, ApJ, 747, L28
- Newman et al. (2013) Newman A. B., Treu T., Ellis R. S., Sand D. J., Nipoti C., Richard J., Jullo E., 2013, The Astrophysical Journal, 765, 24
- Noeske et al. (2007) Noeske K. G., et al., 2007, ApJ, 660, L43
- Oemler et al. (2013) Oemler Augustus J., Dressler A., Gladders M. G., Fritz J., Poggianti B. M., Vulcani B., Abramson L., 2013, ApJ, 770, 63
- Old et al. (2020) Old L. J., et al., 2020, MNRAS, 493, 5987
- Paccagnella et al. (2016) Paccagnella A., et al., 2016, ApJ, 816, L25
- Patel et al. (2009) Patel S. G., Holden B. P., Kelson D. D., Illingworth G. D., Franx M., 2009, ApJ, 705, L67
- Patel et al. (2011) Patel S. G., Kelson D. D., Holden B. P., Franx M., Illingworth G. D., 2011, ApJ, 735, 53
- Peng et al. (2010) Peng Y.-j., et al., 2010, ApJ, 721, 193
- Planck Collaboration et al. (2016) Planck Collaboration et al., 2016, A&A, 594, A13
- Poggianti et al. (2006) Poggianti B. M., et al., 2006, ApJ, 642, 188
- Poggianti et al. (2008) Poggianti B. M., et al., 2008, ApJ, 684, 888
- Poggianti et al. (2009) Poggianti B. M., et al., 2009, ApJ, 693, 112
- Poggianti et al. (2016) Poggianti B. M., et al., 2016, AJ, 151, 78
- Quilis et al. (2000) Quilis V., Moore B., Bower R., 2000, Science, 288, 1617
- Rudnick et al. (2009) Rudnick G., et al., 2009, ApJ, 700, 1559
- Rudnick et al. (2017) Rudnick G., et al., 2017, ApJ, 850, 181
- Saglia et al. (2010) Saglia R. P., et al., 2010, A&A, 524, A6
- Sarzi et al. (2006) Sarzi M., et al., 2006, MNRAS, 366, 1151
- Schreiber et al. (2015) Schreiber C., et al., 2015, A&A, 575, A74
- Simard et al. (2009) Simard L., et al., 2009, A&A, 508, 1141
- Singh et al. (2013) Singh R., et al., 2013, A&A, 558, A43
- Sobral et al. (2011) Sobral D., Best P. N., Smail I., Geach J. E., Cirasuolo M., Garn T., Dalton G. B., 2011, MNRAS, 411, 675
- Speagle et al. (2014) Speagle J. S., Steinhardt C. L., Capak P. L., Silverman J. D., 2014, ApJS, 214, 15
- Strom et al. (2017) Strom A. L., Steidel C. C., Rudie G. C., Trainor R. F., Pettini M., Reddy N. A., 2017, ApJ, 836, 164
- Tacchella et al. (2016) Tacchella S., Dekel A., Carollo C. M., Ceverino D., DeGraf C., Lapiner S., Mand elker N., Primack Joel R., 2016, MNRAS, 457, 2790
- Taranu et al. (2014) Taranu D. S., Hudson M. J., Balogh M. L., Smith R. J., Power C., Oman K. A., Krane B., 2014, MNRAS, 440, 1934
- Tasca et al. (2015) Tasca L. A. M., et al., 2015, A&A, 581, A54
- Taylor et al. (2011) Taylor E. N., et al., 2011, MNRAS, 418, 1587
- Tiley et al. (2020) Tiley A. L., et al., 2020, MNRAS, 496, 649
- Treu et al. (2015) Treu T., et al., 2015, ApJ, 812, 114
- Vulcani et al. (2010) Vulcani B., Poggianti B. M., Finn R. A., Rudnick G., Desai V., Bamford S., 2010, ApJ, 710, L1
- Vulcani et al. (2011a) Vulcani B., et al., 2011a, MNRAS, 412, 246
- Vulcani et al. (2011b) Vulcani B., et al., 2011b, MNRAS, 413, 921
- Vulcani et al. (2012) Vulcani B., et al., 2012, A&A, 544, A104
- Vulcani et al. (2015) Vulcani B., et al., 2015, ApJ, 814, 161
- Vulcani et al. (2016) Vulcani B., et al., 2016, ApJ, 833, 178
- Vulcani et al. (2017) Vulcani B., et al., 2017, ApJ, 837, 126
- Vulcani et al. (2018) Vulcani B., et al., 2018, ApJ, 866, L25
- Webb et al. (2020) Webb K., et al., 2020, MNRAS, 498, 5317
- Wetzel et al. (2013) Wetzel A. R., Tinker J. L., Conroy C., van den Bosch F. C., 2013, MNRAS, 432, 336
- Whiley et al. (2008) Whiley I. M., et al., 2008, MNRAS, 387, 1253
- Whitaker et al. (2012) Whitaker K. E., van Dokkum P. G., Brammer G., Franx M., 2012, ApJ, 754, L29
- Whitaker et al. (2014) Whitaker K. E., et al., 2014, ApJ, 795, 104
- White & Zaritsky (1992) White S. D. M., Zaritsky D., 1992, ApJ, 394, 1
- White et al. (2005) White S. D. M., et al., 2005, A&A, 444, 365
- Wild et al. (2016) Wild V., Almaini O., Dunlop J., Simpson C., Rowlands K., Bowler R., Maltby D., McLure R., 2016, MNRAS, 463, 832
- Williams et al. (2009) Williams R. J., Quadri R. F., Franx M., van Dokkum P., Labbé I., 2009, ApJ, 691, 1879
- Wojtak et al. (2018) Wojtak R., et al., 2018, MNRAS, 481, 324
- Wolf et al. (2009) Wolf C., et al., 2009, Monthly Notices of the Royal Astronomical Society, 393, 1302
- Wuyts et al. (2007) Wuyts S., et al., 2007, ApJ, 655, 51
- Wuyts et al. (2011) Wuyts S., et al., 2011, ApJ, 738, 106
- Wuyts et al. (2013) Wuyts S., et al., 2013, ApJ, 779, 135
- Zahid et al. (2014) Zahid H. J., Dima G. I., Kudritzki R.-P., Kewley L. J., Geller M. J., Hwang H. S., Silverman J. D., Kashino D., 2014, ApJ, 791, 130
- da Cunha et al. (2008) da Cunha E., Charlot S., Elbaz D., 2008, MNRAS, 388, 1595
- van Dokkum et al. (2011) van Dokkum P. G., et al., 2011, ApJ, 743, L15
- van Dokkum et al. (2013) van Dokkum P. G., et al., 2013, ApJ, 771, L35
- van der Wel et al. (2014) van der Wel A., et al., 2014, ApJ, 788, 28
- van der Wel et al. (2016) van der Wel A., et al., 2016, ApJS, 223, 29
Appendix A Color Corrections
As described in Just et al. 2019, there were multiple calibration challenges with the wide-field photometry that we use in this work, which was not taken under photometric conditions. The WFI photometry in Just et al. 2019 was calibrated to the EDisCS core photometry and a subsequent calibration step was applied to minimize the residuals of photometric vs. spectroscopic redshifts. Despite this, the calibration has produced reasonably good photometric redshifts and it later became apparent that the rest-frame colors had additional calibration issues, likely resulting from a non-trivial by-product of the multiple zeropoint calibration steps that we undertook in Just et al. 2019. While the colors for each cluster had a clear quiescent clump and SF sequence, they were each systematically shifted with respect to each other, and to the quiescent clump as defined from the well-calibrated EDisCS photometry on the cluster cores.
We therefore undertook an additional calibration step in which we used the median colors of quiescent galaxies in the wide-field sample and shifted the and colors such that this clump matched the median colors of the spectroscopically confirmed galaxies from EDisCS that had no emission lines in their spectra. Although calculated for just the quiescent galaxies, These shifts were applied to all galaxies on a cluster-by-cluster basis. These shifts were in color but resulted in all of our fields having well matched sequences. This gives us the ability to robustly separate galaxies in different regions of space. The adjustment to the colors was also important for our use of the color to compute stellar mass to light ratios and stellar masses (§3.1). In practice, the correction was mostly applied to the rest-frame -band magnitude. The rest-frame -band magnitude was derived from well-calibrated -band observations and the -band magnitude was calibrated well to the 2MASS photometry. The magnitude was more tied to the problematic WFI photometry.
Appendix B Visual Inspection of Galaxies with GRIZLI
In Figure 6, 21 galaxies are identified as quiescent based upon the Just et al. 2019 UVJ rest-frame colors, with five of them being in the core, two in the infall, and nine in the field. These are identified on the right hand side of Figure 8 as salmon triangles. GRIZLI produces a stellar continuum and emission line map for each observed galaxy, which is shown in Figure 14. Many of the galaxies appear to have diffuse Hα with little-to-no stellar structure, indicating that these may be early-type galaxies.


Appendix C Derivation for Extinction at H
The narrow spectral range of the HST G102 grism window does not allow us to determine the attenuation at H from the grism data alone, and our SED calibration problems prevent us from using direct SED fits to do so. We therefore run MAGPHYS (da Cunha et al. 2008) on the ULTRAVISTA catalog (Muzzin et al. 2013) to determine the continuum attenuation at 6563Å. We run MAGPHYS without the UV and narrow-band filters as the SED fits were poorer using those filters. Our conclusions are unchanged if we include the UV and narrow-band filters, but the scatter of continuum attenuation increases. As described in the text, we use the ratio of the attenuated and unattenuated stellar continuum to derive the optical depth of the continuum at 6563Å, which we convert to the attenuation in magnitudes at 6563Å using . In Figure 15 we show the median and interquartile range of for the ULTRAVISTA sample. We use this distribution of in space, to infer the of our target galaxies by matching our galaxies to the nearest grid cell in -space. As described in the text, we then use to derive the line attenuation at H.


Appendix D Main Sequence Comparisons
In Figure 16 we show a version of Figure 8, but now with main sequence determinations from Whitaker et al. 2012 and Schreiber et al. 2015 at the median redshift of 0.487 for our sample. These determinations of the main sequence use SFRs determined from UVIR and are systematically below the H determinations of Vulcani et al. 2010. They are consistent with the bulk of our star-forming galaxies, but it is worth noting that our SFRs are systematically below the IR-based SFRs of Finn et al. 2010. Taken together, this illustrates the significant systematic offsets between different SFR indicators and the importance of internal comparisons.

Appendix E HST catalogs
This section contains tables with galaxy-specific information separated by each of the three environments.
| Object ID | R.A. | Dec | z | Distance | Stellar Mass | fluxHα | SFRHα | U – V | V – J | UVJ |
|---|---|---|---|---|---|---|---|---|---|---|
| Deg. | Deg. | Mpc | (M∗/) | 10-16erg s-1cm-2 | yr-1 | AB | AB | Classification | ||
| (1) | (2) | (3) | (4) | (5) | (6) | (7) | (8) | (9) | (10) | (11) |
| Cl1059-12.1-382 | 164.7492 | -12.8713 | 0.4555 | 0.366 | 8.04 | 1.11 | 0.70 | 0.73 | 0.73 | sf |
| Cl1059-12.1-165 | 164.7544 | -12.8858 | 0.4617 | 0.051 | 10.80 | 43.50 | 15.11 | 0.99 | 0.92 | sf |
| Cl1059-12.1-392 | 164.7546 | -12.8709 | 0.4602 | 0.368 | 9.83 | 3.33 | 1.15 | 1.14 | 0.75 | sf |
| Cl1059-12.1-087 | 164.7554 | -12.8909 | 0.4583 | 0.085 | 10.12 | 8.54 | 3.00 | 1.2 | 0.93 | sf |
| Cl1059-12.1-334 | 164.7563 | -12.8743 | 0.4596 | 0.294 | 10.28 | 5.02 | 1.73 | 1.25 | 0.97 | sf |
| Cl1059-12.1-217 | 164.7583 | -12.8821 | 0.4565 | 0.124 | 10.46 | 5.48 | 1.74 | 1.63 | 1.2 | q |
| Cl1059-12.1-431 | 164.7654 | -12.8686 | 0.4601 | 0.407 | 9.65 | 1.02 | 0.35 | 1.22 | 0.74 | sf |
| Cl1059-12.1-461 | 164.7692 | -12.8664 | 0.4595 | 0.453 | 10.91 | 1.13 | 0.43 | 1.95 | 1.23 | q |
| Cl1059-12.2-435* | 164.7708 | -12.8683 | 0.451 | 0.287 | 9.31 | 0.75 | 0.23 | -0.63 | 1.08 | q |
| Cl1059-12.2-320 | 164.7787 | -12.8982 | 0.4615 | 0.227 | 10.71 | 1.03 | 0.40 | 1.88 | 1.09 | q |
| Cl1059-12.2-244 | 164.7819 | -12.9035 | 0.4538 | 0.342 | 11.58 | 1.73 | 0.58 | 2.18 | 1.41 | q |
| Cl1059-12.2-231 | 164.7829 | -12.905 | 0.4554 | 0.374 | 10.96 | 3.72 | 1.39 | 1.97 | 1.38 | q |
| Cl1059-12.2-272* | 164.7835 | -12.9017 | 0.4573 | 0.338 | 10.43 | 1.54 | 0.51 | 2.07 | 1.27 | q |
| Cl1059-12.2-261 | 164.7852 | -12.9025 | 0.4733 | 0.32 | 9.63 | 0.54 | 0.29 | 1.06 | 0.69 | sf |
| Cl1059-12.2-192 | 164.7861 | -12.907 | 0.4609 | 0.416 | 10.60 | 4.79 | 1.66 | 1.43 | 1.07 | sf |
| Cl1059-12.2-364* | 164.7864 | -12.8947 | 0.4544 | 0.331 | 10.55 | 1.69 | 0.55 | 1.97 | 1.15 | q |
| Cl1059-12.2-325 | 164.7884 | -12.8979 | 0.4528 | 0.224 | 9.85 | 2.93 | 0.97 | 1.09 | 0.76 | sf |
| Cl1059-12.2-434 | 164.7897 | -12.8874 | 0.4598 | 0.005 | 10.78 | 5.67 | 2.44 | 1.81 | 1.3 | q |
| Cl1059-12.2-311 | 164.7908 | -12.8992 | 0.4587 | 0.253 | 9.80 | 0.95 | 0.47 | 1.42 | 1.09 | sf |
| Cl1059-12.2-452 | 164.7911 | -12.8849 | 0.4577 | 0.059 | 5.77 | 0.99 | 1.46 | 0.86 | 0.51 | sf |
| Cl1059-12.2-350 | 164.7912 | -12.8954 | 0.4573 | 0.172 | 8.88 | 0.79 | 0.39 | 0.8 | -0.46 | sf |
| Cl1059-12.2-441 | 164.794 | -12.8867 | 0.4505 | 0.021 | 10.44 | 2.35 | 0.77 | 1.62 | 1.19 | sf |
| Cl1059-12.2-460* | 164.7944 | -12.884 | 0.4571 | 0.371 | 10.32 | 1.25 | 0.41 | 2.0 | 1.12 | q |
| Cl1059-12.2-466 | 164.7959 | -12.8802 | 0.4613 | 0.161 | 9.31 | 0.78 | 0.27 | 1.0 | 0.80 | sf |
| Cl1059-12.2-449 | 164.7962 | -12.8853 | 0.4524 | 0.053 | 8.62 | 1.31 | 0.63 | 0.58 | 0.19 | sf |
| Cl1059-12.2-463 | 164.7962 | -12.8828 | 0.4564 | 0.106 | 9.39 | 3.32 | 1.63 | 0.85 | 0.68 | sf |
| Cl1059-12.2-387 | 164.8008 | -12.8917 | 0.4561 | 0.099 | 9.81 | 1.17 | 0.57 | 1.37 | 0.95 | sf |
| Cl1059-12.2-395 | 164.8048 | -12.8905 | 0.455 | 0.079 | 9.35 | 2.96 | 0.99 | 0.94 | 0.83 | sf |
| Cl1059-12.2-157* | 164.8058 | -12.909 | 0.4569 | 2.486 | 10.83 | 2.54 | 0.84 | 2.07 | 1.25 | q |
| Cl1059-12.2-172 | 164.8059 | -12.9082 | 0.4613 | 0.455 | 9.85 | 2.84 | 0.98 | 1.10 | 0.96 | sf |
| Cl1059-12.2-109* | 164.8092 | -12.9133 | 0.4473 | 0.398 | 9.94 | 0.00 | 0.30 | 1.88 | 1.01 | q |
| Cl1138-11.0-1623* | 174.5321 | -11.5609 | 0.4778 | 0.392 | 10.79 | 2.32 | 0.85 | 2.05 | 1.17 | q |
| Cl1138-11.0-1772 | 174.5345 | -11.5584 | 0.4829 | 0.035 | 9.32 | 2.17 | 1.22 | 0.87 | 0.36 | sf |
| Cl1138-11.0-1460 | 174.5358 | -11.5635 | 0.4781 | 0.047 | 8.83 | 3.16 | 1.57 | 0.69 | 0.85 | sf |
| Cl1138-11.0-199 | 174.5399 | -11.5897 | 0.4799 | 0.452 | 9.70 | 3.72 | 1.63 | 1.08 | 0.72 | sf |
| Cl1138-11.0-1203 | 174.5431 | -11.5686 | 0.4785 | 0.124 | 9.11 | 1.60 | 0.87 | 0.76 | 0.34 | sf |
| Cl1138-11.0-1754* | 174.5435 | -11.559 | 0.4994 | 2.79 | 10.40 | 2.33 | 0.96 | 1.99 | 1.25 | sf |
| Cl1138-11.0-1545* | 174.5447 | -11.5621 | 0.4771 | 0.617 | 10.62 | 1.45 | 0.61 | 2.17 | 1.37 | q |
| Cl1138-11.0-1073 | 174.545 | -11.5705 | 0.481 | 0.155 | 10.28 | 1.04 | 0.38 | 1.82 | 0.92 | q |
| Cl1138-11.0-1230 | 174.5452 | -11.5681 | 0.478 | 0.117 | 8.96 | 2.78 | 1.52 | 0.74 | 0.01 | sf |
| Cl1138-11.0-1573 | 174.5459 | -11.5616 | 0.4902 | 0.016 | 10.67 | 0.88 | 0.35 | 2.11 | 1.22 | q |
| Cl1138-11.0-375 | 174.5464 | -11.5843 | 0.4787 | 0.368 | 9.76 | 4.83 | 1.88 | 1.17 | 0.77 | sf |
| Cl1138-11.0-298 | 174.5464 | -11.5867 | 0.4852 | 0.406 | 9.60 | 0.66 | 0.24 | 1.85 | 0.98 | q |
| Cl1138-11.0-1516 | 174.5496 | -11.5626 | 0.4637 | 0.032 | 8.05 | 0.49 | 0.25 | 0.22 | -0.12 | sf |
| Cl1138-11.0-955* | 174.5528 | -11.5727 | 0.4895 | 0.404 | 10.30 | 1.02 | 0.40 | 2.10 | 1.12 | sf |
| Cl1138-11.0-1409 | 174.5531 | -11.5647 | 0.4875 | 0.066 | 9.70 | 6.64 | 3.03 | 0.95 | 0.79 | sf |
| Cl1138-11.0-990* | 174.5531 | -11.5719 | 0.4796 | 0.936 | 8.82 | 0.69 | 0.35 | 0.68 | 0.95 | sf |
| Cl1138-11.0-1897 | 174.5574 | -11.5566 | 0.4822 | 0.064 | 9.34 | 5.56 | 2.14 | 1.02 | 0.48 | sf |
| Cl1138-11.0-668 | 174.5624 | -11.5779 | 0.4988 | 0.275 | 8.69 | 1.09 | 0.66 | 0.29 | -0.38 | sf |
| Cl1138-11.0-979 | 174.5641 | -11.5727 | 0.4851 | 0.195 | 10.12 | 25.10 | 12.65 | 1.17 | 0.99 | sf |
| Cl1138-11.0-1265 | 174.5651 | -11.5673 | 0.4697 | 0.113 | 9.90 | 0.39 | 0.36 | 1.93 | 1.62 | sf |
| Cl1138-11.0-348* | 174.5681 | -11.5848 | 0.4944 | 0.834 | 9.02 | 0.84 | 0.35 | 1.16 | -0.34 | sf |
| Cl1227-11.0-126 | 186.972 | -11.6148 | 0.6375 | 0.709 | 10.10 | 4.65 | 6.61 | 1.37 | 1.41 | sf |
| Cl1227-11.0-244* | 186.9794 | -11.6056 | 0.6375 | 2.328 | 9.88 | 0.73 | 1.03 | 1.42 | 1.53 | sf |
| Cl1227-11.0-332 | 186.9794 | -11.5997 | 0.626 | 0.324 | 10.07 | 0.76 | 1.17 | 1.28 | 1.22 | sf |
| Cl1227-11.0-217 | 186.9838 | -11.6078 | 0.6321 | 0.524 | 10.64 | 1.44 | 1.55 | 1.44 | 0.57 | sf |
| Cl1227-11.0-482* | 186.9877 | -11.5889 | 0.6429 | 0.05 | 10.39 | 0.86 | 0.67 | 2.15 | 1.29 | q |
Core Galaxies Object ID R.A. Dec z Distance Stellar Mass fluxHα SFRHα U – V V – J UVJ Deg. Deg. Mpc (M∗/) 10-16erg s-1cm-2 yr-1 AB AB Classification (1) (2) (3) (4) (5) (6) (7) (8) (9) (10) (11) Cl1227-11.0-348 186.988 11.5988 0.6335 0.298 10.36 9.63 1.09 0.78 1.08 sf Cl1227-11.0-368* 186.9907 -11.5979 0.6277 0.741 10.20 0.56 0.40 1.61 0.37 q Cl1227-11.0-527* 186.9947 -11.586 0.6429 0.688 10.58 0.84 0.82 1.91 1.32 q Cl1301-11.0-134 195.3694 -11.6311 0.5003 0.458 9.44 3.78 2.30 0.87 0.48 sf Cl1301-11.0-304 195.3789 -11.6149 0.4681 0.714 9.21 11.60 0.43 0.49 0.29 sf Cl1301-11.0-159* 195.3722 -11.6286 0.4911 0.094 9.21 11.80 4.74 0.93 0.37 sf Cl1301-11.0-193* 195.3731 -11.6251 0.465 0.065 8.55 6.36 3.25 0.57 0.18 sf Cl1301-11.0-384* 195.3745 -11.6091 0.4655 0.062 9.12 3.86 61.41 1.21 0.82 sf Cl1301-11.0-092* 195.3748 -11.6342 0.493 0.024 10.08 1.10 0.45 2.23 0.93 q Cl1301-11.0-023* 195.3766 -11.6408 0.4896 0.006 10.87 13.80 5.58 2.00 1.04 q Cl1301-11.0-059* 195.3806 -11.6374 0.483 0.033 9.99 8.08 3.17 1.92 0.92 q Cl1301-11.0-408* 195.383 -11.6074 0.4703 0.412 9.51 10.50 4.19 1.46 0.94 q Cl1301-11.0-298* 195.3837 -11.6154 0.488 0.304 8.97 8.02 4.60 0.6 0.44 sf Cl1301-11.0-143* 195.3846 -11.63 0.4631 0.155 8.16 6.36 3.22 0.21 0.64 sf Cl1301-11.0-157 195.386 -11.6292 0.4871 0.468 9.90 4.86 2.48 1.14 0.79 sf Cl1301-11.0-187 195.3861 -11.6258 0.4823 0.524 9.94 13.90 6.94 1.16 0.86 sf Cl1301-11.0-060* 195.3888 -11.6373 0.5015 0.568 9.41 4.18 3.78 1.14 1.19 sf Cl1301-11.1-502 195.3762 -11.6977 0.482 0.715 8.96 2.11 1.18 1.21 0.96 sf Cl1301-11.1-491 195.3847 -11.6989 0.481 0.725 10.23 19.10 7.54 1.16 1.01 sf Cl1301-11.1-525 195.3862 -11.6954 0.4855 0.665 10.1 3.30 2.22 1.08 0.94 sf Cl1301-11.1-560 195.3924 -11.6929 0.4832 0.617 9.78 3.27 2.18 0.93 0.92 sf Cl1301-11.1-324 195.3935 -11.7106 0.4862 0.911 10.35 1.78 0.90 1.28 1.00 sf
Information for core galaxies. 1. Pointing ID - GRIZLI Object ID. IDs ending with * are galaxies with S/NHα 3. 2. Right Ascension 3. Declination 4. Redshift 5. Cluster-centric distance in Mpc. 6. Stellar Mass 7. Uncorrected H flux in cgs units. S/N detections are listed at the 3 upper limit. 8. Star-formation rate. S/N detections are listed at the 3 upper limit. 9. U – V rest-frame color 10. V – J rest-frame color 11. UVJ classification based on Williams et al. 2009 where sf and q represent star-forming and quiescent, respectively.
| Object ID | R.A. | Dec | z | Distance | Stellar Mass | fluxHα | SFRHα | U – V | V =- J | UVJ |
|---|---|---|---|---|---|---|---|---|---|---|
| Deg. | Deg. | Mpc | (M∗/) | 10-16erg s-1cm-2 | yr-1 | AB | AB | Classification | ||
| (1) | (2) | (3) | (4) | (5) | (6) | (7) | (8) | (9) | (10) | (11) |
| Cl1138-11.2-166 | 174.3821 | -11.4293 | 0.4812 | 2.44 | 10.03 | 1.04 | 1.73 | 1.4 | 1.94 | sf |
| Cl1138-11.2-222 | 174.3956 | -11.4266 | 0.4818 | 2.41 | 10.08 | 3.90 | 2.81 | 1.17 | 1.82 | sf |
| Cl1138-11.2-213 | 174.3994 | -11.4272 | 0.4654 | 2.39 | 10.42 | 3.33 | 1.86 | 1.7 | 1.45 | sf |
| Cl1138-11.2-490 | 174.401 | -11.4085 | 0.4735 | 2.67 | 9.77 | 3.37 | 1.24 | 1.08 | 0.67 | sf |
| Cl1138-11.2-434* | 174.4048 | -11.4127 | 0.4878 | 0.387 | 10.48 | 3.41 | 1.27 | 1.85 | 1.04 | q |
| Cl1138-11.1-077 | 174.6872 | -11.5849 | 0.4869 | 0.7 | 9.77 | 2.26 | 0.92 | 1.16 | 0.69 | sf |
| Cl1138-11.1-137 | 174.7016 | -11.5811 | 0.4894 | 0.71 | 9.07 | 2.39 | 1.38 | 0.66 | 0.27 | sf |
| Cl1138-11.1-388 | 174.7105 | -11.5616 | 0.4945 | 0.45 | 9.72 | 6.39 | 3.79 | 0.81 | 0.5 | sf |
| Cl1138-11.1-263 | 174.7122 | -11.5714 | 0.4903 | 0.61 | 11.09 | 5.51 | 9.56 | 1.67 | 2.55 | sf |
| Cl1227-11.1-088 | 186.9564 | -11.6694 | 0.6166 | 2.1 | 9.30 | 1.37 | 1.39 | 0.76 | 0.32 | sf |
| Cl1227-11.1-226 | 186.9569 | -11.6607 | 0.6383 | 1.88 | 10.07 | 5.49 | 7.17 | 0.8 | 1.06 | sf |
| Cl1227-11.1-309 | 186.9807 | -11.6551 | 0.6358 | 1.71 | 10.06 | 3.87 | 3.36 | 1 | 0.87 | sf |
| Cl1227-11.2-225 | 187.0602 | -11.5263 | 0.6246 | 1.62 | 11.22 | 2.32 | 2.09 | 1.98 | 1.37 | q |
| Cl1227-11.2-163 | 187.0621 | -11.5297 | 0.6428 | 1.54 | 9.66 | 3.55 | 3.98 | 0.79 | 0.61 | sf |
| Cl1227-11.2-347 | 187.0682 | -11.5193 | 0.6312 | 1.82 | 9.03 | 1.58 | 1.70 | 0.5 | 0.37 | sf |
| Cl1301-11.3-220 | 195.2301 | -11.5203 | 0.4683 | 2.84 | 8.50 | 1.11 | 0.58 | 0.13 | 0.61 | sf |
| Cl1301-11.3-337 | 195.2334 | -11.513 | 0.4941 | 2.95 | 10.07 | 3.64 | 1.49 | 1.01 | 0.57 | sf |
| Cl1301-11.3-268* | 195.2339 | -11.5175 | 0.4892 | 0.223 | 9.27 | 1.87 | 0.75 | 1.02 | 0.09 | sf |
| Cl1301-11.3-144 | 195.2358 | -11.5266 | 0.4926 | 2.71 | 10.55 | 4.38 | 4.58 | 1.91 | 1.78 | sf |
| Cl1301-11.3-223 | 195.2426 | -11.5201 | 0.4947 | 2.77 | 8.78 | 0.49 | 0.29 | 0.17 | -0.11 | sf |
| Cl1301-11.3-226* | 195.2557 | -11.5202 | 0.4652 | 0.19 | 10.79 | 2.00 | 0.72 | 2.18 | 1.01 | q |
| Cl1301-11.3-106* | 195.2643 | -11.5294 | 0.4957 | 0.175 | 10.35 | 2.29 | 1.18 | 1.97 | 1.42 | q |
| Cl1301-11.1-300 | 195.3445 | -11.5418 | 0.4974 | 1.99 | 9.51 | 1.35 | 0.96 | 0.88 | 1.25 | sf |
| Cl1301-11.1-421 | 195.3487 | -11.5294 | 0.4976 | 2.19 | 9.17 | 0.95 | 0.39 | 0.94 | 0.13 | sf |
| Cl1301-11.1-061 | 195.3502 | -11.5586 | 0.4672 | 1.7 | 9.42 | 5.68 | 2.94 | 0.73 | 0.53 | sf |
| Cl1301-11.1-354 | 195.3503 | -11.5372 | 0.4944 | 2.06 | 10.42 | 18.80 | 9.96 | 1.13 | 0.91 | sf |
| Cl1301-11.1-361 | 195.3542 | -11.5363 | 0.4933 | 2.06 | 8.95 | 0.77 | 0.41 | 0.42 | 1.35 | sf |
| Cl1301-11.1-208 | 195.3585 | -11.5476 | 0.501 | 1.87 | 11.06 | 1.48 | 0.63 | 2.11 | 1.28 | q |
| Object ID | R.A. | Dec | z | Stellar Mass | fluxHα | SFRHα | U-V | V-J | UVJ |
|---|---|---|---|---|---|---|---|---|---|
| Deg. | Deg. | (M∗/) | 10-16erg s-1cm-2 | yr-1 | AB | AB | Classification | ||
| (1) | (2) | (3) | (4) | (5) | (6) | (7) | (8) | (9) | (10) |
| Cl1059-12.1-326 | 164.7441 | -12.8751 | 0.6477 | 10.19 | 1.32 | 4.50 | 1.04 | 1.99 | sf |
| Cl1059-12.1-413 | 164.7442 | -12.8697 | 0.666 | 10.46 | 1.39 | 5.07 | 1.57 | 2.09 | sf |
| Cl1059-12.1-505 | 164.7475 | -12.8625 | 0.6323 | 9.15 | 0.85 | 2.74 | 1.13 | 1.97 | sf |
| Cl1059-12.1-408 | 164.7506 | -12.8697 | 0.6582 | 8.54 | 0.65 | 0.77 | 0.41 | 0.19 | sf |
| Cl1059-12.1-192 | 164.7514 | -12.8837 | 0.6705 | 9.12 | 0.85 | 1.55 | 0.88 | 1.70 | sf |
| Cl1059-12.1-162 | 164.7514 | -12.8859 | 0.6716 | 8.54 | 0.37 | 0.42 | 0.55 | 0.86 | sf |
| Cl1059-12.1-517 | 164.752 | -12.8617 | 0.4064 | 10.05 | 4.08 | 2.23 | 1.19 | 1.35 | sf |
| Cl1059-12.1-496 | 164.7523 | -12.8632 | 0.6979 | 10.99 | 0.9 | 2.19 | 1.98 | 2.24 | sf |
| Cl1059-12.1-486 | 164.7528 | -12.8638 | 0.6544 | 10.32 | 0.22 | 0.20 | 2.22 | 1.58 | sf |
| Cl1059-12.1-086 | 164.7536 | -12.8908 | 0.6076 | 8.45 | 0.47 | 0.41 | 0.23 | 0.74 | sf |
| Cl1059-12.1-183 | 164.758 | -12.8842 | 0.6428 | 9.16 | 0.41 | 0.59 | 1.19 | 1.64 | sf |
| Cl1059-12.1-101 | 164.7626 | -12.8893 | 0.6107 | 8.22 | 1.14 | 1.03 | 0.23 | 1.01 | sf |
| Cl1059-12.1-333 | 164.7639 | -12.874 | 0.5182 | 8.6 | 0.4 | 0.27 | 0.50 | 0.46 | sf |
| Cl1059-12.1-241 | 164.7699 | -12.8805 | 0.4865 | 9.85 | 3.02 | 5.14 | 1.37 | 2.06 | sf |
| Cl1059-12.2-285 | 164.773 | -12.8781 | 0.5736 | 8.63 | 1.86 | 1.44 | 0.44 | 0.70 | sf |
| Cl1059-12.2-220 | 164.778 | -12.9053 | 0.4291 | 9.71 | 0.45 | 0.57 | 1.43 | 1.75 | q |
| Cl1059-12.2-405 | 164.7856 | -12.8899 | 0.5032 | 8.72 | 0.87 | 0.49 | 0.62 | 0.90 | sf |
| Cl1059-12.2-289 | 164.7867 | -12.8999 | 0.4245 | 9.53 | 0.66 | 0.34 | 1.58 | 1.45 | sf |
| Cl1059-12.2-310 | 164.7926 | -12.8992 | 0.4127 | 9.83 | 0.84 | 0.96 | 1.56 | 1.78 | sf |
| Cl1059-12.2-447 | 164.7978 | -12.8854 | 0.545 | 10.13 | 0.99 | 0.51 | 2.37 | 1.15 | sf |
| Cl1059-12.2-396 | 164.7999 | -12.8906 | 0.5936 | 9.46 | 3.29 | 3.92 | 0.88 | 1.92 | sf |
| Cl1059-12.2-399 | 164.8028 | -12.8902 | 0.4168 | 8.64 | 0.64 | 0.30 | 1.00 | 0.92 | sf |
| Cl1059-12.2-390 | 164.805 | -12.8911 | 0.4245 | 9.53 | 0.76 | 0.94 | 1.33 | 1.80 | sf |
| Cl1138-11.2-158 | 174.38 | -11.4304 | 0.4139 | 9.21 | 1.36 | 0.78 | 1.16 | 1.44 | sf |
| Cl1138-11.2-090 | 174.3832 | -11.4337 | 0.4552 | 9.32 | 4.38 | 3.14 | 0.52 | 1.78 | sf |
| Cl1138-11.2-060 | 174.3834 | -11.4351 | 0.6938 | 9.89 | 2.82 | 5.62 | 1.22 | 1.19 | sf |
| Cl1138-11.2-504 | 174.3887 | -11.4074 | 0.6761 | 9.98 | 1.85 | 2.51 | 1.32 | 1.20 | sf |
| Cl1138-11.2-376 | 174.3972 | -11.4166 | 0.6875 | 9.28 | 1.26 | 2.46 | 0.72 | 1.50 | q |
| Cl1138-11.2-246 | 174.3987 | -11.4245 | 0.5759 | 9.02 | 1.1 | 0.86 | 0.80 | 0.76 | sf |
| Cl1138-11.2-079 | 174.4013 | -11.4342 | 0.5195 | 10.34 | 2.4 | 4.78 | 1.31 | 2.03 | sf |
| Cl1138-11.0-1481 | 174.5333 | -11.5634 | 0.641 | 8.82 | 0.99 | 1.10 | 0.63 | -0.27 | sf |
| Cl1138-11.0-1299* | 174.5355 | -11.5666 | 0.6558 | 8.60 | 0.64 | 0.75 | 0.26 | -0.36 | sf |
| Cl1138-11.0-1136* | 174.5373 | -11.5692 | 0.5856 | 9.33 | 0.68 | 0.42 | 1.90 | 0.85 | q |
| Cl1138-11.0-789 | 174.5375 | -11.5756 | 0.5063 | 9.58 | 0.73 | 0.31 | 1.51 | 0.59 | sf |
| Cl1138-11.0-1650* | 174.538 | -11.5602 | 0.5333 | 10.05 | 0.84 | 0.42 | 2.00 | 0.89 | q |
| Cl1138-11.0-1779* | 174.5386 | -11.5584 | 0.6437 | 9.71 | 1.03 | 1.24 | 1.43 | 1.19 | sf |
| Cl1138-11.0-1231* | 174.539 | -11.5681 | 0.5607 | 9.61 | 1.31 | 0.73 | 1.32 | 0.03 | q |
| Cl1138-11.0-558* | 174.5391 | -11.5797 | 0.6363 | 8.56 | 0.83 | 0.9 | 0.75 | -0.05 | sf |
| Cl1138-11.0-1404* | 174.54 | -11.5647 | 0.562 | 10.17 | 0.8 | 0.45 | 2.20 | 0.90 | q |
| Cl1138-11.0-1549 | 174.5401 | -11.562 | 0.5182 | 10.68 | 1.2 | 0.56 | 1.98 | 1.00 | sf |
| Cl1138-11.0-1000* | 174.5411 | -11.5718 | 0.5795 | 8.85 | 0.86 | 0.75 | 0.71 | -0.45 | sf |
| Cl1138-11.0-1645* | 174.5423 | -11.5607 | 0.6136 | 10.92 | 11.80 | 9.43 | 1.60 | 1.14 | q |
| Cl1138-11.0-1403 | 174.5429 | -11.5647 | 0.5186 | 8.23 | 1.01 | 0.67 | 0.68 | 0.26 | sf |
| Cl1138-11.0-1138* | 174.5438 | -11.5694 | 0.6076 | 9.50 | 2.85 | 2.53 | 0.67 | 1.00 | sf |
| Cl1138-11.0-1420* | 174.5453 | -11.5646 | 0.4503 | 9.60 | 1.93 | 0.69 | 1.39 | 1.07 | sf |
| Cl1138-11.0-180 | 174.547 | -11.59 | 0.6205 | 8.86 | 1.7 | 1.21 | 0.91 | 0.30 | q |
| Cl1138-11.0-1308* | 174.5483 | -11.5664 | 0.6046 | 8.74 | 0.45 | 0.3 | 0.91 | 0.24 | sf |
| Cl1138-11.0-590* | 174.5484 | -11.5793 | 0.4568 | 10.51 | 1.53 | 0.52 | 1.90 | 1.06 | q |
| Cl1138-11.0-297* | 174.5487 | -11.5866 | 0.593 | 9.21 | 0.61 | 0.39 | 1.51 | -0.20 | q |
| Cl1138-11.0-1973 | 174.549 | -11.5557 | 0.6994 | 8.38 | 1.12 | 1.54 | 0.21 | 0.59 | sf |
| Cl1138-11.0-1291* | 174.5505 | -11.5668 | 0.5875 | 9.75 | 0.57 | 0.35 | 1.79 | 0.38 | q |
| Cl1138-11.0-824* | 174.5524 | -11.5749 | 0.5214 | 8.24 | 0.93 | 0.74 | 0.65 | 1.34 | sf |
| Cl1138-11.0-264* | 174.553 | -11.588 | 0.5208 | 9.98 | 1.24 | 0.57 | 1.71 | 1.16 | q |
| Cl1138-11.0-1791* | 174.5531 | -11.5581 | 0.4146 | 7.66 | 1.48 | 0.58 | 0.20 | 0.01 | sf |
| Cl1138-11.0-429* | 174.5533 | -11.582 | 0.6441 | 8.78 | 0.96 | 1.08 | 0.51 | 0.05 | sf |
| Cl1138-11.0-2141 | 174.5566 | -11.5758 | 0.4094 | 8.26 | 0.78 | 0.38 | 1.02 | 1.98 | sf |
| Cl1138-11.0-778 | 174.5613 | -11.5758 | 0.6987 | 8.66 | 1.51 | 2.08 | 0.48 | 0.24 | sf |
| Cl1138-11.0-2084* | 174.5631 | -11.5543 | 0.564 | 8.64 | 0.81 | 0.6 | 0.69 | 0.73 | sf |
| Cl1138-11.0-411* | 174.5635 | -11.5825 | 0.5627 | 9.10 | 0.56 | 0.32 | 1.16 | 0.23 | sf |
Field Galaxies Object ID R.A. Dec z Stellar Mass fluxHα SFRHα U – V V – J UVJ Deg. Deg. (M∗/) 10-16erg s-1cm-2 yr-1 AB AB Classification (1) (2) (3) (4) (5) (6) (7) (8) (9) (10) Cl1138-11.0-851* 174.5652 -11.5746 0.4397 9.88 1.6 0.46 1.74 0.97 q Cl1138-11.0-430* 174.5659 -11.5819 0.6222 8.59 0.9 0.84 0.20 0.93 sf Cl1138-11.0-673 174.5676 -11.5779 0.6286 9.4 3.6 5.63 1.17 1.20 q Cl1138-11.1-409* 174.6811 -11.5603 0.502 9.32 1.74 1.45 1.28 1.05 sf Cl1138-11.1-120* 174.6827 -11.5823 0.6227 9.49 2.44 1.74 1.31 0.03 q Cl1138-11.1-047 174.6884 -11.5869 0.5494 9.89 5.12 11.68 1.32 2.73 q Cl1138-11.1-157* 174.6907 -11.5797 0.5831 8.6 2.56 2.26 0.21 0.60 sf Cl1138-11.1-364 174.6985 -11.5631 0.4051 8.75 2.88 1.37 0.64 2.30 sf Cl1138-11.1-411 174.7007 -11.56 0.4531 9 0.6 0.26 0.80 0.98 sf Cl1138-11.1-193 174.703 -11.577 0.6282 10 2.8 4.38 1.23 1.13 sf Cl1138-11.1-273 174.704 -11.5697 0.6198 9.89 1.45 4.44 1.42 1.91 sf Cl1138-11.1-162* 174.7157 -11.5794 0.5771 9.72 8.97 7.73 0.84 0.68 sf Cl1227-11.1-330* 186.9512 -11.6522 0.5491 8.78 1.19 0.91 0.38 -0.69 sf Cl1227-11.0-382 186.959 -11.6475 0.5286 9.14 2.8 1.95 0.72 -0.22 q Cl1227-11.0-402 186.9637 -11.6452 0.5272 8.97 2.59 1.79 0.69 0.56 sf Cl1227-11.1-419* 186.9669 -11.6437 0.443 8.5 0.64 0.29 0.21 0.43 sf Cl1227-11.0-519* 186.9669 -11.5863 0.5679 8.77 1.16 0.96 0.59 0.04 sf Cl1227-11.0-413 186.9706 -11.6444 0.4342 9.48 0.68 0.38 1.36 1.38 q Cl1227-11.0-196 186.971 -11.6092 0.5473 9.17 1.76 1.33 0.82 0.24 q Cl1227-11.0-166 186.9742 -11.6632 0.5755 10.2 1.76 4.50 1.51 1.62 sf Cl1227-11.0-305* 186.9755 -11.6016 0.5086 9.77 1 0.43 1.81 1.22 q Cl1227-11.1-396* 186.9784 -11.6464 0.5519 11.02 2.23 1.16 2.03 1.22 q Cl1227-11.1-138 186.9822 -11.6656 0.4939 10.54 2 0.81 1.71 1.18 sf Cl1227-11.1-162 186.9869 -11.6119 0.5512 10.91 2.67 2.24 1.79 1.32 sf Cl1227-11.1-322 186.989 -11.6003 0.4108 8.85 1.51 0.52 0.73 0.84 sf Cl1227-11.1-113 186.9907 -11.6159 0.5745 11.07 1.97 1.45 2.04 1.46 q Cl1227-11.2-177* 187.052 -11.5288 0.5643 8.94 1.81 1.47 0.54 -0.34 sf Cl1227-11.2-136 187.0564 -11.5315 0.5183 9.37 1.24 0.57 1.13 0.57 sf Cl1227-11.2-362 187.0578 -11.5183 0.4995 9.12 0.27 0.16 0.89 -0.19 sf Cl1227-11.2-279* 187.0604 -11.5238 0.5857 10.13 1.56 4.15 1.63 1.50 sf Cl1227-11.2-411* 187.0614 -11.5141 0.6019 8.79 0.42 0.60 0.21 0.15 sf Cl1227-11.2-035 187.0636 -11.5409 0.5963 9.62 3.47 2.95 0.89 0.81 sf Cl1227-11.2-247 187.0677 -11.5249 0.5311 9.02 1.77 1.25 0.69 0.29 sf Cl1227-11.2-152 187.0722 -11.5304 0.4723 8.63 1.73 0.92 0.62 0.32 sf Cl1227-11.2-208 187.0804 -11.5276 0.5349 9.37 3.25 2.33 0.84 0.41 sf Cl1227-11.2-259 187.0843 -11.5248 0.5124 11.17 4.07 1.77 2.05 1.23 sf Cl1227-11.2-146 187.0855 -11.5309 0.4908 9.34 2.56 1.03 0.96 0.53 sf Cl1227-11.2-204 187.0903 -11.5276 0.5165 10.72 2.73 1.96 1.81 1.31 sf Cl1301-11.3-418* 195.2246 -11.507 0.63 10.19 1.47 1.56 1.48 0.66 q Cl1301-11.3-278* 195.2269 -11.5167 0.4351 9.63 1.80 0.82 1.02 0.60 sf Cl1301-11.3-197* 195.2335 -11.5223 0.4574 9.59 1.93 0.65 1.57 1.08 q Cl1301-11.3-410 195.2339 -11.5075 0.5476 9.16 0.76 0.58 0.77 0.45 q Cl1301-11.3-311 195.2408 -11.5145 0.6833 9.07 2.95 3.84 0.25 0.70 sf Cl1301-11.3-176 195.2446 -11.5234 0.5353 8.85 2.46 1.77 0.97 -0.31 sf Cl1301-11.3-095 195.2452 -11.5302 0.4281 8.89 1.78 0.75 0.83 0.40 sf Cl1301-11.3-091 195.2487 -11.5304 0.5213 8.89 1.33 0.82 0.53 0.80 sf Cl1301-11.3-123 195.2489 -11.5279 0.5358 9.53 2.37 1.70 0.75 0.66 sf Cl1301-11.3-470 195.2491 -11.5031 0.5178 10.15 4.3 2.85 0.89 0.41 sf Cl1301-11.3-446* 195.2521 -11.5054 0.5228 9.57 0.59 0.28 1.15 0.33 sf Cl1301-11.3-344 195.2549 -11.5127 0.5986 9.71 4.32 3.70 0.73 0.84 sf Cl1301-11.3-085* 195.2631 -11.5306 0.5219 8.77 1.09 0.67 0.53 0.83 sf Cl1301-11.1-176 195.3304 -11.549 0.4339 9.06 0.39 0.12 0.29 -0.15 sf Cl1301-11.1-242 195.3365 -11.5452 0.5238 9.07 2.54 1.73 0.50 0.63 sf Cl1301-11.1-441 195.3429 -11.5251 0.5795 9.6 4.43 3.51 0.88 0.74 sf Cl1301-11.3-446* 195.345 -11.5216 0.4046 9.07 1.5 0.55 0.78 0.09 sf Cl1301-11.0-044 195.351 -11.5609 0.4224 8.87 1.98 0.81 0.69 0.28 sf Cl1301-11.1-262 195.3524 -11.5436 0.5149 8.97 0.95 0.62 0.80 0.50 sf
Information for field galaxies. 1. Pointing ID - GRIZLI Object ID. IDs ending with * are galaxies with S/NHα 3. 2. Right Ascension 3. Declination 4. Redshift 5. Stellar Mass 6. Uncorrected H flux in cgs units. S/N detections are listed at the 3 upper limit. 7. Star-formation rate. S/N detections are listed at the 3 upper limit. 8. U – V rest-frame color 9. V – J rest-frame color 10. UVJ classification based on Williams et al. 2009 where sf and q represent star-forming and quiescent, respectively.
Field Galaxies Object ID R.A. Dec z Stellar Mass fluxHα SFRHα U – V V – J UVJ Deg. Deg. (M∗/) 10-16erg s-1cm-2 yr-1 AB AB Classification (1) (2) (3) (4) (5) (6) (7) (8) (9) (10) Cl1301-11.1-356 195.3558 -11.5368 0.451 7.94 2.26 0.98 -0.11 0.91 sf Cl1301-11.2-587* 195.3655 -11.691 0.6237 9.84 1.90 1.57 1.10 0.78 sf Cl1301-11.0-067* 195.3666 -11.6366 0.5524 8.84 2.07 1.60 0.58 0.47 sf Cl1301-11.2-605 195.3697 -11.6895 0.5304 11.23 2.14 1.04 2.13 1.23 q Cl1301-11.0-151* 195.37 -11.6294 0.5449 8.81 8.67 5.91 0.55 1.23 sf Cl1301-11.2-486* 195.3727 -11.699 0.4046 9.68 3.52 0.87 2.01 1.29 q Cl1301-11.0-265* 195.3755 -11.6184 0.6343 9.51 7.66 8.31 0.61 0.53 sf Cl1301-11.2-319* 195.3757 -11.711 0.5816 10.35 2.60 1.54 1.98 1.20 q Cl1301-11.2-641 195.3771 -11.6856 0.5177 9.95 3.77 3.23 1.48 1.35 sf Cl1301-11.0-231* 195.3782 -11.6208 0.5656 10.11 5.89 3.33 1.64 0.94 q Cl1301-11.2-603* 195.3819 -11.6895 0.6242 10.5 0.78 0.57 1.95 1.02 q Cl1301-11.2-514* 195.383 -11.6966 0.6524 9.38 0.32 0.37 0.59 -0.59 sf Cl1301-11.0-096* 195.3865 -11.634 0.4045 9.75 15.00 5.49 1.45 0.72 q Cl1301-11.2-685 195.3878 -11.6797 0.423 9.68 0.50 0.14 1.57 -0.39 sf Cl1301-11.0-099* 195.3879 -11.6337 0.5451 9.55 5.82 3.02 1.08 0.48 sf Cl1301-11.2-262 195.388 -11.6186 0.5329 9.14 5.42 3.85 0.54 0.02 sf
Information for field galaxies. 1. Pointing ID - GRIZLI Object ID. IDs ending with * are galaxies with S/NHα 3. 2. Right Ascension 3. Declination 4. Redshift 5. Stellar Mass 6. Uncorrected H flux in cgs units. S/N detections are listed at the 3 upper limit. 7. Star-formation rate. S/N detections are listed at the 3 upper limit. 8. U – V rest-frame color 9. V – J rest-frame color 10. UVJ classification based on Williams et al. 2009 where sf and q represent star-forming and quiescent, respectively.