V2iFi: in-Vehicle Vital Sign Monitoring via Compact RF SensingJournal: IMWUTVolume: 42706Price: 15.00DOI: 10.1145/3397321CCS: Applied computing Consumer healthCCS: Hardware Sensor applications and deploymentsCCS: Human-centered computing Ubiquitous and mobile computing systems and tools
Abstract.
Given the significant amount of time people spend in vehicles, health issues under driving condition have become a major concern. Such issues may vary from fatigue, asthma, stroke, to even heart attack, yet they can be adequately indicated by vital signs and abnormal activities. Therefore, in-vehicle vital sign monitoring can help us predict and hence prevent these issues. Whereas existing sensor-based (including camera) methods could be used to detect these indicators, privacy concern and system complexity both call for a convenient yet effective and robust alternative. This paper aims to develop V2iFi, an intelligent system performing monitoring tasks using a COTS impulse radio mounted on the windshield. V2iFi is capable of reliably detecting driver’s vital signs under driving condition and with the presence of passengers, thus allowing for potentially inferring corresponding health issues. Compared with prior work based on Wi-Fi CSI, V2iFi is able to distinguish reflected signals from multiple users, and hence provide finer-grained measurements under more realistic settings. We evaluate V2iFi both in lab environments and during real-life road tests; the results demonstrate that respiratory rate, heart rate, and heart rate variability can all be estimated accurately. Based on these estimation results, we further discuss how machine learning models can be applied on top of V2iFi so as to improve both physiological and psychological wellbeing in driving environments.
Keywords:
In-Vehicle Health Monitoring, Vital Signs, Impulse Radio, Ultra Wideband1. Introduction
With the rapid development of artificial intelligence, vehicles are becoming increasingly “smart” nowadays: they not only learn to drive by itself, but also attempt to better understand and interact with the driver and passengers. In particular, health monitoring is one of the essential components of intelligent vehicles; it aims to figure out the health status of people under driving condition, especially after long hours of daily commutes and frustrating traffic jams (Elliott and Coventry 2012). For example, drowsy driving has been reported to have caused fatal vehicle crashes (Flatley et al. 2004), and vital signs such as respiration and heartbeat are important indicators for early detection of drowsiness (Chua et al. 2012; Solaz et al. 2016). Consequently, an in-vehicle health monitoring system that keeps watching these indicators offers both the vehicle and driver better perception and decision-making capabilities, thus leading to a healthy and safe driving experiences.
To enable healthy and safe driving, automotive companies have built various monitoring system, including ATTENTION ASSIST® by Mercedes-Benz (Daimler AG 2019), Driver Alert Control (DAC) by Volvo (Volvo Group 2019) and SmartSenior by BMW (BMW AG 2019). In the meantime, research groups from around the world have also been attracted to this topic (Xu et al. 2019; Huynh et al. 2019; Li et al. 2015; Brookhuis and de Waard 2010; Awais et al. 2017; Cho et al. 2014). By far, two main categories of such systems work on monitoring person (driver in particular) directly, namely camera-based (Volvo Group 2019; Huynh et al. 2019; Cho et al. 2014) and wearable sensor-based (Awais et al. 2017; Li et al. 2015; Brookhuis and de Waard 2010) (e.g., EEG and ECG). Although these approaches work well technically, they may not be exactly practical in real life, because of well-known weaknesses including privacy concern, poor performance in low-light, as well as the use of intrusive sensors (causing uncomfortable user experience).
Fortunately, recent progress in wireless sensing has brought us new hope to overcome the aforementioned weaknesses (Adib et al. 2015; Wang et al. 2018b; Zeng et al. 2018; Li et al. 2017). Such a system always transmits wireless (e.g., radio and acoustic) signals and captures their reflections. As the reflections off persons carry their respective vital signs,11 1 As vital signs are actually micro-scale body activities, the ability to monitor the former implies the same to the latter. Therefore, our technical discussions focus only on vital sign monitoring for the sake of conciseness. one may extract these vital signs from the reflections without intrusive sensors touching human bodies, while respecting the privacy of users and avoiding the interference of ambient light. However, different from the state-of-the-art wireless based vital sign monitoring, in-vehicle monitoring is much more complicated because of the confined and noisy nature of driving environments. To tackle these challenges, there have been a few existing studies on in-vehicle monitoring of either general health or specific vital signs via acoustic (Xu et al. 2019) or Radio Frequency (RF) (Jia et al. 2018) signals. Although acoustic signals can deliver vital sign monitoring ubiquitously via smart devices such as smartphones (Xu et al. 2019), they are prone to be contaminated by background sounds under driving condition. Moreover, babies and pets may feel uncomfortable as they are sensitive to the high frequency acoustic signals used by acoustic sensing.
Compared with acoustic signals, RF signals are even less sensitive to ambient noises such as heat and sounds, hence it poses a more promising solution for in-vehicle monitoring. WiFind (Jia et al. 2018) leverages Channel State Information (CSI) of Wi-Fi devices to detect driver motions and respiratory rate, based on which fatigue state could potentially be inferred. However, it only offers coarse-grained measurements due to its narrow Wi-Fi bandwidth. To make things worse, the system may fail in the presence of multiple persons in the vehicle. In order to better illustrate this latter issue, we use Wi-Fi card Intel 5300 (Halperin et al. 2011) to detect respiratory waveform in a vehicle. Whereas the respiratory waveform of a driver alone can be clearly identified in Fig. 1(a), the periodic feature of this waveform is corrupted and cannot be easily distinguished when multiple passengers are present, as shown in Fig. 1(b). The reason is that the narrow Wi-Fi bandwidth cannot support high temporal resolution in such an extreme multipath environment. Note that differentiating multiple persons via their respective respiratory rates does not help, as identifying the critical monitoring target (e.g., the driver) is still impossible without position information, and the respiratory rates can be similar even for different persons. As a teaser to our work, Fig. 1(c) demonstrates that, when properly used, an impulse radio with ultra-wideband offers a much higher temporal resolution, and hence can readily differentiate multiple persons based on their relative distances,
and then focus on monitoring the driver. Last but not least, using standard Wi-Fi radio for sensing purpose may affect its normal data communication function, and the resulted setting is bistatic (i.e., transmitter and receiver are separated (Raemer 1996)); these all make it difficult to test and deploy a system.
To summarize, in order to further improve the performance of driver vital sign monitoring system based on RF sensing, we face the following challenges that largely confine the capability of existing systems:
- •
Deployment complexity. In-vehicle vital sign monitoring based on Wi-Fi CSI requires an Access Point (AP) and a STAtion (STA) (Jia et al. 2018). Such a bistatic system is too complicated to be adopted as an intelligent component of smart vehicles in practice.
- •
Passenger interference. Previous research works based on Wi-Fi CSI are not robust to the cases where multiple persons are in a vehicle. Respiratory movements caused by other passengers in the cabin can distort the CSI and worsen the performance.
- •
Excessive noise. Previous vital sign monitoring systems are mostly designed for a home setting (Adib et al. 2015; Zeng et al. 2018). Performance of in-vehicle vital sign monitoring can deteriorate with the presence of excessive noise caused by the running vehicle and moving human body parts.
- •
Low sensitivity. Technologies based on Wi-Fi CSI cannot ensure sufficient temporal resolution because of the narrow bandwidth. Therefore, measurements of vital signs using Wi-Fi CSI cannot be very accurate, especially given the vibration background created by engines and road conditions.

To answer these challenges, we propose V2iFi as a compact in-Vehicle Vital sign monitoring system endowed with fine-grained sensitivity. It consists of low-cost Commercial Off-The-Shelf (COTS) components, and is hence readily deployable, as illustrated in Fig. 2. V2iFi can filter the interference from passengers and vibrations caused by moving vehicles while focusing on driver’s vital sign monitoring. The reconstructed RF signals induced by vital signs can then be used to estimate respiratory rate, heart rate, and even finer-grained heart rate variability. As V2iFi offers continuous monitoring on driver’s vital signs, we will be able to perform real-time and comprehensive diagnosis of the health status of the driver. Particularly, we should be able to detect driver drowsiness in its early stage and hence prevent vehicle accidents.
Specifically, V2iFi employs a COTS impulse radio to collect RF reflections from people. The COTS impulse radio is compact and monostatic (i.e., the transmitter and receiver are co-located (Raemer 1996)); it can be readily integrated with embedded devices such as Raspberry Pi (Raspberry Pi Foundation 2019) adopted by us to form an edge computing node, rendering a straightforward in-vehicle deployment shown in Fig. 2 (leftmost). The radio’s ultra-wideband enables us to develop algorithms that accurately sorts out signals reflected from different people under complex multipath conditions. This further allows us to zoom in and inspect the RF reflections from the driver and hence extract his/her vital signs. In addition, the competent sensitivity of V2iFi delivers abundant information for combating other background noises. Leveraging this capability, our new Multi-Sequence Variational Mode Decomposition (MS-VMD) algorithm decomposes a set of related time series into multiple band-separated intrinsic modes. This enables V2iFi to filter out noises such as vibrations of vehicle, reconstruct both respiratory and heartbeat waveforms, and in turn estimate respiratory rate, heart rate, and even heart rate variability accordingly. In summary, our major contributions in this paper are:
- •
Our hardware design for V2iFi innovatively combines a COTS impulse radio with a compact edge computing platform. Leveraging the high temporal resolution offered by an impulse radio, V2iFi is able to distinguish signals reflected from various users and hence focus on monitoring the driver. Moreover, compared with existing wireless solutions (e.g., (Jia et al. 2018)), V2iFi is convenient to deploy thanks to its low system complexity, making it a practical system for complicated driving environments.
- •
We emphasize on the robustness in vital sign monitoring to overcome noise in driving environments. To prepare the signal for vital sign extraction, V2iFi uses a combination of filters to remove noise and improve signal quality, it then detects and discards unstable data frames corrupted by noise. As a result, V2iFi can extract vital sign information from noisy data frames to the largest extent.
- •
We develop a novel MS-VMD algorithm to fully leverage the wide bandwidth of the UWB signal and perform signal separation via optimization techniques. The MS-VMD algorithm allows V2iFi to jointly extract vital signs from multiple sequences of signals. This enables V2iFi to accurately estimate driver’s vital signs carried by reflected signals, including even the subtle heart rate variability, which, to the best of our knowledge, has never been extracted by wireless sensing under driving condition.
- •
We conduct extensive experiments to evaluate the performance of V2iFi under various conditions. All the results demonstrate that V2iFi is robust to various unfavorable factors including bumpy road and heavy clothing of the driver, proving its outstanding effectiveness in practice.
The rest of the paper is organized as follows. Sec. 2 explains the vital signs to be measured by V2iFi. Sec. 3 presents the system design of V2iFi. Sec. 4 reports the evaluation results. Limitations and potentials are discussed in Sec. 5. Sec. 6 gives a brief review of related work. Sec. 7 concludes this paper.
2. Vital Signs as Health Indicators in Driving Environments
Before proceeding to present our system details, we first discuss the measurable vital signs as health indicators in driving environments. The essential idea is to provide a necessary background and strong motivation for the development of V2iFi, in the sense of which vital signs can be quantitatively measured and how they are relevant to personal health status. Basically, we propose adopting the following dimensions: i) respiratory rate: the number of breaths a person takes per minute, ii) heart rate: the number of times a person’s heart contracts and relaxes per minute, and iii) heart rate variability (HRV): the physiological phenomenon of variation in time intervals between heartbeats. All these can be measured by V2iFi’s impulse radio, and they are closely related to personal health status.
2.1. Respiratory Rate and Heart Rate
Respiratory rate is one of the crucial indicators of a person’s health issues. Abnormal respiratory rate under 12 breaths-per-minute (bpm) or over 25 bpm has been shown to be an important predictor of health issues, such as asthma (Catterall et al. 1982), anxiety (Giardino et al. 2007), pneumonia (Strauß et al. 2014), lung disease (Clark and Kruse 1990), heart disease (Cretikos et al. 2008; Fieselmann et al. 1993) and drug overdose. In particular, Solaz et al. (Solaz et al. 2016) observe abnormal change in respiratory rates and use it to infer abnormal health issues like driver drowsiness. Lisper et al. (Lisper et al. 1973) report that, during a long-time continuous driving, respiratory rate of the driver and passengers are found to have slowed down gradually. Similarly, irregular heart rate is also a crucial indicator of serious health issues such as cardiac disease (Cysarz et al. 2007; Nabi et al. 2010). Also, Sharma et al. (Sharma et al. 2011) show that irregular heart rate is a sign of electrolyte imbalance. In terms of driving environments, Jo et al. (Jo et al. 2019) demonstrate that heart rate significantly decreases during sleepy driving. Banning et al. (Banning and Ng 2012) report that people with irregular heartbeat are more likely to cause a traffic accident.
The aforementioned discussions have clearly shown the relevance of both respiratory rate and heart rate as indicators for driving-specific health status (e.g., driver fatigue, drunk driving), so they should be chosen as key vital signs for in-vehicle monitoring, yet we would need to avoid using intrusive sensors that cause uncomfortable user experience. Recently progress in RF sensing provide us with an alternative solution for remotely extracting these vital signs. Zeng et al. (Zeng et al. 2018) design a Wi-Fi based system for respiration detection, and Adib et al. (Adib et al. 2015) demonstrate that respiratory rate and heart rate can both be measured remotely by leveraging an FMCW radio. In particular, for the driving environments, Peng et al. (Jia et al. 2018) has migrated the Wi-Fi based for estimating respiratory rate, while Park et al. (Park et al. 2019) design a special RF sensor for monitoring both respiratory rate and heart rate of the driver. However, it is still not clear if these proposals may effectively handle realistic scenarios with multiple passenger present.
2.2. Heart Rate Variability
It is well known that a healthy heart does not beat at a regular interval (Shaffer et al. 2014). In other words, the rhythms of a healthy heart are not as stable as heart rate; they are instead non-linear and offer a higher-dimensional information. Therefore, it is a more useful indicator of a personal health status than respiratory and heart rates. Variations in heart beat intervals are controlled by the unconscious part of human nervous system, i.e., the Automatic Nervous System (ANS) (Ernst 2017). This part of the nervous system regulates heart beat, respiration, pupillary response, urination, sexual arousal and digestive process. The ANS can be further divided into two sub-systems, i.e., sympathetic and parasympathetic nervous system. Human heart without external input will beat at constant rate of approximately 100 bpm. However, the two nervous subsystems compete with each other, influencing nerves in heart tissues and causing variations in heart beat intervals. Therefore, HRV clearly reflects the general state of the nervous system and thus personal health status.
Specifically, HRV has been used to detect multiple health issues. In (Sessa et al. 2018), Sessa et al. report abnormal HRV precedes sudden cardiac attack. In (Fujiwara et al. 2018), Fujiwara et al. demonstrate that changes in sleep patterns affect nervous system, and HRV changes as a result. In another study, Benichou et al. (Benichou et al. 2018) show that type 2 diabetes cause significant decrease in HRV. HRV is also shown to be linked to asthma (Lutfi 2015), anxiety (Chalmers et al. 2014) and drug overdose (Waring et al. 2008). Similar to respiratory rate and heart rate, HRV can also be obtained from reflected RF signals. Although HRV signal is weak and hard to capture, Zhao et al. (Zhao et al. 2016) demonstrated that ECG-like HRV signal can be extracted from mixed signal of heartbeat and respiration using numerical differentiation. Whereas their findings have confirmed the existence of HRV signal in the reflected RF signal, their method may not be robust to noise and interference under driving conditions, so we require a novel estimation algorithm for V2iFi.
In brief, HRV is particularly useful for indicating health status in any environments, and it can be obtained from RF signals, so we choose it to be one of the key vital signs for V2iFi. However, there are multiple indices that describe HRV, and they can be categorized into categories summarized in Table 1 (Shaffer and Ginsberg 2017).
| Category | Parameters |
|---|---|
| Time Domain | Interbeat Interval (IBI), SDNN, SDRR, SDANN, SDNN index (SDNNI), pNN50, HR Max - HR Min, RMSSD, HRV triangular index |
| Frequency Domain | ULF power, VLF power, LF peak, LF power, HF peak, HF power, LF/HF |
| Non-linear | SD1, SD2, SD1/SD2, ApEn, SampEN, DFA1, DFA2, |
Some of these indices require complex computation and processing (e.g., ECG-like waveform). In our work, as RF signal only carries temporal information about heartbeats. We choose Interbeat Interval (IBI) as the HRV index. In fact, some other indicators, such as SDNN, SDRR and LF/HF, can be derived from IBI.
3. System Design of V2iFi
V2iFi is composed of two hardware components, a single-board computer and an impulse radio, as well as backend algorithms for signal processing. It utilizes RF signals transmitted by the impulse radio for vital sign monitoring. Upon receiving the reflected signals, delicate procedures are taken to distill the targeted vital signs out of them, notably by our novel MS-VMD algorithm. In the following, we first provide a software system overview in Sec. 3.1, while leaving the explanations for hardware components to Sec. 4.1. Then we present the RF channel model in Sec. 3.2 and discuss algorithms for signal prepossessing, signal separation, and vital sign extraction in Sec. 3.3, 3.4, and 3.5, respectively.

3.1. Software System Overview
V2iFi’s software architecture is illustrated in Fig. 3. The whole system consists of three components: signal preprocessing, signal separation, and vital sign processing.
- •
RF signal preprocessing component. This component includes noise reduction and background subtraction. After the reflected signal is received by the radio, the data is forwarded to the embedded computer for processing. Due to low power of the wideband Guassian pulse ( ) (Novelda AS 2017b), we need to improve the SNR of signals. Basically, we employ smooth filter to reduce noise in the signals. Then, we utilize a loopback filter to remove the static reflections from clutters for background subtraction.
- •
Signal separation component. The greatest difficulty of in-vehicle vital sign estimation is how to remove the noise caused by vibrations of vehicle from the reflectors. We perform two steps to eliminate the vibration. First, we locate the driver, and extract driver-specific signals. Second, we propose a novel MS-VMD algorithm to decompose the mixed signals containing vibration noises and vital signs via leveraging the reflections from multiple body parts (i.e., signals from different fast-time bins).
- •
Vital sign processing component. After decomposing the signals, V2iFi identifies respiration and heartbeat signals from them. Next, V2iFi can estimate vital signs like respiratory rate, heart rate, and IBI. Together with all of them can be used to determine health issues of the driver.
We will model RF channel first, and elaborate on all components of V2iFi in the next few sections.
3.2. Modeling RF Channel
In this section, we introduce the theory of RF modeling of the impulse radio. V2iFi utilizes a system-on-chip impulse radio for transmitting and receiving wireless pulses. The system diagram of V2iFi is illustrated in Fig. 4. The transmitted signal is , the modulated signal is , the signal after passing the channel is , and the demodulated signal is . The architecture of the impulse radio is slightly different from traditional architecture (Novelda AS 2017a): it only employs an in-phase single-carrier frequency for upconversion, but In-phase and Quadrature (IQ) sampling ( and ) at the receiver side for downconversion.

The Gaussian pulse transmitted by V2iFi can be expressed by the following equation: where the amplitude of the pulse is , is the duration of the signal, and is the variance corresponding to the -10 dB bandwidth, actually we have . After upconversion, the transmitted signal in time domain is given by:
| (1) |
where is carrier frequency, is duration of frame where is the pulse repetition frequency, denotes the -th frame. Because the impulse radio transmits a sequence of identical pulses, we have . For simplicity, we can denote with , and E.q. (1) can be written as The transmitted signal is illustrated in Fig. 6, and its representation in the frequency domain is shown in Fig. 6. It can be seen that the carrier frequency is , and bandwidth is .
The impulse response of the in-vehicle environment is given by: where is the channel gain of the reflection path signal in the vehicle, is the time delay of the -th path, is the time delay caused by Doppler frequency shift of the -th path. Moreover, for the impulse radio used in V2iFi , and , where is the distance between the target to be detected and the UWB radio, is the speed of light, is the speed of the moving target. The range resolution of V2iFi is given by where is the bandwidth of the impulse radio. Therefore, the time resolution of V2iFi can be calculated as .
In summary, the received signal of the impulse radio is:
| (2) |
where is Gaussian noise with a variance of , and the symbol denotes convolutional operation.
In a radar system, Pulse Repetition Interval (PRI) is the time between two consecutive pulses. We place the reflected signal of the same pulse in the same row, for example, the reflected signal of the first pulse in the first row, the reflected signal of the second pulse in the second row. We define the dimension of the row as the "fast-time" dimension, that is, the dimension of time slots composing a single PRI, and define the dimension of the column as the "slow-time" dimension, which updates every PRI (Björklund et al. 2015).
By transforming the time sequence of the signal into a matrix, the idea of "fast-time" and "slow-time" can be visualized, as shown in Fig. 8, and an example of real received signals from UWB radio are illustrated in Fig. 8. Generally speaking, the fast-time dimension denotes time delays of range distance, and the slow-time axis is used to estimate Doppler effect by observing over a long time span. Hereafter, we abuse the terminology by using sequence to denote the vector of a ranging distance in the fast-time, such as a column vector in Fig. 8.

Received baseband signals are obtained after applying IQ downconversion, we have:
| (3) |
Let represent -th discrete samples obtained from ADC where is the sampling interval. Then the discrete baseband signals can be represented by . E.q. (3) indicated that different minute movements caused by vital signs in the vehicle have different and in . By utilizing the differences, different vital signs can be distinguished.
3.3. RF Signal Preprocessing
Before extracting information from RF signals, the effects from hardware or environment should be removed to guarantee signal quality. The RF signals preprocessing has two main steps: i) noise reduction and ii) background subtraction.
3.3.1. Noise Reduction
The received baseband signals are polluted with noise, as shown in Fig. 10. Noise will prevent the following vital signs extraction modules to work properly. Especially, vital signs will be immersed in noise. Therefore, a cascading filter comprised of a low-pass Finite Impulse Response (FIR) filter and a smoothing filter are utilized to enhance the SNR of the signals. The order of the designed FIR filter is 26 and Hamming window is used. The smooth filter with a window size of 50 points is used to further smooth the output signal of the FIR filter. Fig. 10. illustrates the output of the cascading filter. It can be seen that noise is suppressed.
3.3.2. Background Subtraction
Background subtraction removes all static reflectors in the background. Reflectors includes static and moving objects. Therefore, besides reflected signal from the human body, there are many sources of unwanted static signals reflected in the vehicle shown in Fig. 12. Unwanted signals in a radar are generally described as noise and clutter. Loopback filters can be used to remove clutter from the original signal (Adib et al. 2014). The clutter of the system can be described as: and the background subtracted signal can be represented as . In which is a constant used for weighting, is the value at -th frame. We can see that the signal after background subtraction is illustrated in Fig. 12, where the clutters have been removed. A low value enables the filter to remove background fast, but the filter is not robust to noise. On the other hand, a high value makes background removal slow, but the process is robust to noise. In our work, is set to .


3.4. Signal Separation
3.4.1. User Identification
User identification is the process of identifying the driver’s vital sign signal hidden in the radar data frames. It enables us to focus on the driver’s signal for further vital sign extraction. The diagram of the user identification process is shown in Fig. 13.
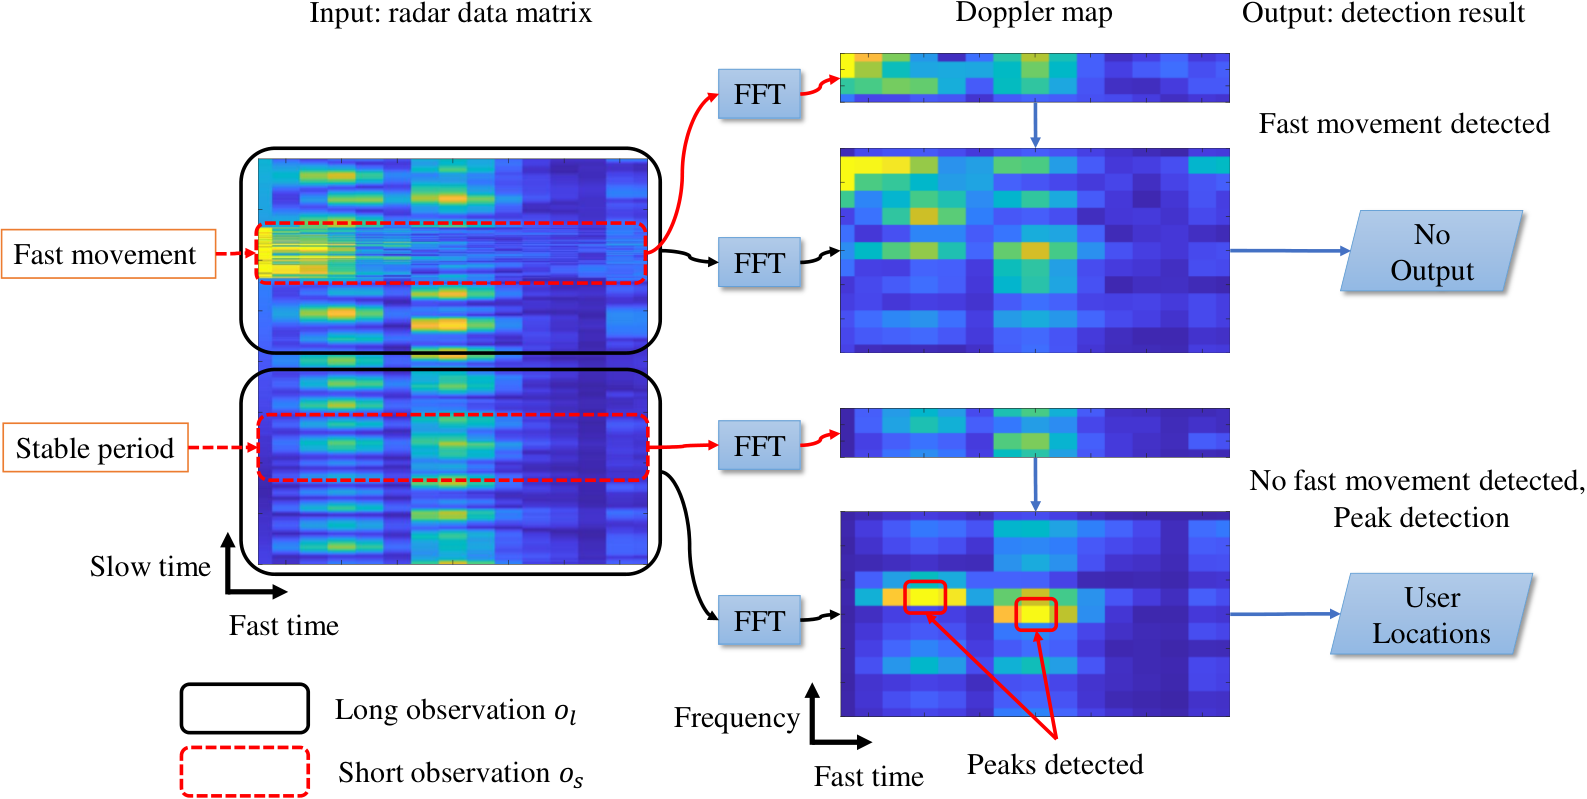
The first step of user identification is to filter out the radar data frames that are unsuitable for user identification and further processing. In the diagram, we can see that fast movements in the driving environments degrade vital sign signals greatly. To combat this, we take out 5 s data and 20 s matrix from the input radar data frames, and these two matrices are called the short observation and long observation . We perform FFT along the slow-time axes of the two matrices to get the Doppler map of the long observation and short observation respectively. The Doppler map of the long observation is used for vital sign extraction, and the Doppler map of the short observation is used to detect fast movement.
By our definition, is the measure of relative signal strength, where denotes the -th fast-time index, denotes the -th frequency index, is the peak amplitude on the Doppler map, and is the amplitude at fast-time index and frequency index , is the total number of fast-time indices, and is the total number of frequency indices, hence (i.e., of the short observation) is a measure of the relative strength of fast movement signal, and (i.e., of the long observation) is a measure of the relative strength of vital sign signal. , where is empirically set to 1.2, is an empirical formula based on our experiments, it indicates that fast movement signal dominates vital sign signal. When this happens, the received signal is not stable and no valid vital signs can be extracted, hence we remove invalid frames. Otherwise, if there is no fast movement, peak detection algorithm is further used to locate the driver on the Doppler map.
The peak detection algorithm uses an adaptive threshold to detect real peaks where humans exist, it determines the best threshold above which any peak can be considered to be from the desired target. A sliding window is used to scan all values and estimate the noise threshold near the fast-time sample indices under test. The window size is set to , where is the width of the human body and is the maximum difference of a specific person’s respiratory rate. For example, if two peak indices are separated by a distance less than 60, we only pick the peak index with higher amplitude. Last, we output the range value of the detected peak, which defines the location of the driver.
That algorithm is illustrated in Fig. 14. It can be seen that the noise floor threshold can be estimated by averaging the values around the fast-time index under test, and the value of the fast-time bin under test is compared with where is a constant coefficient. Empirically, is set to 1.5 in V2iFi . In Fig. 13, we can see that the peaks circled in red represent users occupying a fast-time index (range) and a frequency, hence the peaks can be used to identify different users.
3.4.2. Vibration Decomposition via Variational Mode Decomposition
V2iFi separates breathing and heartbeat signals from noise in driving environments by utilizing the novel MS-VMD algorithm proposed by us, and further estimates respiratory rate, heart rate and fine-grained IBIs. Although we separate each people and identify the driver, vibrations of the vehicle always influences the vital sign estimation. The received signal contain mainly four components (Xu et al. 2019).
- •
Respiration of the driver. The respiration frequency of an adult ranges from 0.16 Hz to 0.6 Hz.
- •
Heartbeat of the driver. The heartbeat frequency of an adult ranges from 1 Hz to 2 Hz.
- •
The vehicle’s vibrations. Frequency of vibrations of a running vehicle, caused by engine, transmission, wheel and bumps on the road ranges from 0.5 Hz to 10 Hz.
- •
Vibrations of driver’s motions. Frequency of human motions such as turning steering wheel may bring interference with ranges from 0.5 Hz to 2 Hz.
We can see that the four components of the received signal are overlapping in frequency, hence a simple band-pass filter with specified frequency range cannot filter out undesired noise caused by vibrations. Although the vibrations of driver’s motions may be separated via distances, there are some cases where the motions and vital signs occur at the same distance.
To separate the vital sign signals from other interference, VMD algorithm is used to decompose the signal into various modes by calculus of variation. Each mode of the signal is assumed to be around a central frequency and have a narrow bandwidth. VMD calculates these central frequencies and the mode functions concurrently, by using an optimization technique called Alternating Direction Method Method of Multipliers (ADMM). However, the VMD only supports single “sequence” decomposition (terminology defined in Sec. 3.2). Due to the complicated in-vehicle environment, a single sequence of signal may not be enough to extract vital signs, so we need to combine multiple sequences to enable accurate vital sign extractions. Therefore, to better refine the vital signs of the driver, we hereby design a Multi-Sequence VMD (MS-VMD) algorithm, an enhanced version of the conventional VMD algorithm.
It is noticed that in the radar data matrix a person does not just occupy a fast-time index, but multiple fast-time indices. Generally speaking, indices occupied by the same person carry similar information of the person’s vital signs. This phenomenon is called time diversity in wireless communication theory. Our MS-VMD algorithm employs time diversity, and jointly optimizes the problem of minimum bandwidth with multiple sequences taken into account, hence better than other algorithms (e.g. Hilbert-Huang transform (Jia et al. 2018), signal fitting (Leem et al. 2017) and traditional VMD algorithm (Dragomiretskiy and Zosso 2013)), where only one data sequence is considered.
We leverage this time diversity to reformulate the objective function of VMD according to (Dragomiretskiy and Zosso 2013). Our modified VMD algorithm decomposes the data into multiple Intrinsic Mode Functions (IMFs). We have where is the -th IMF. However, for data of multiple lags (time delays in V2iFi) where represents the number of lags, we can obtain where . Same as the conventional VMD, to estimate the bandwidth of IMFs, we need to follow the three steps: 1) each uses the Hilbert transform to compute the associated analytic signal, 2) is mixed with a complex exponential of center frequency to baseband, and 3) The bandwidth of can be estimated via the squared -norm of the gradient. In this way, our constrained problem can be formulated as22 2 is the imaginary number unit, not the as we used as frequency index in Section 3.4.1:
| (4) | ||||
| (5) | s.t. |
Different from (Dragomiretskiy and Zosso 2013), the constraints become multiple linear equations corresponding to the number of lags. Therefore, the augmented Lagrangian function is
| (6) |
Similar to (Dragomiretskiy and Zosso 2013), the E.q. (6) is also can be transformed to multiple simpler sub-optimization problems and solved by ADMM algorithm. Next, we divide the problem into two sub-problems: IMF update and center frequency update.
IMF update. We fix the center frequency firstly, and solve the minimization problem with respect to IMF . Then, we can obtain
| (7) |
where is the current iteration.
According to Parseval/Plancherel Fourier isometry under the -norm, the problem E.q. (7) is equal to solving the following problem in frequency domain:
| (8) |
where is the sign function. We can use in the first term:
| (9) |
We can rewrite both terms in E.q. (9) using half-space integrals over the non-negative frequencies, due to the Hermitian symmetry of real signals in the reconstruction term:
| (10) |
Considering the problem E.q. (10) is to find the minimal function , and then, according to the Euler-Lagrange equation (Troutman 2012) of the calculus of variations , we can define
| (11) |
Since is not explicit in , the second term in the Euler-Lagrange equation vanishes. Thus, we let , and the first sub-problem can be solved
| (12) |
Center frequency update. The center frequency is only related to the first term in E.q. (6), hence the second sub-problem is
| (13) |
The optimization problem can also solved in frequency domain efficiently using the Plancherel theorem:
| (14) |
We also give the update expression at -th iteration result as
| (15) |
After that, we can plug the above two IMFs and center frequency updates into AMDD (Boyd et al. 2011) to solve the MS-VMD problem. The complete MS-VMD algorithm is illustrated in Algorithm 1. Line 1 and line 1 are used to update and according to E.q. (12) and E.q. (15), respectively in -th iteration. In line 1, is the update parameter. Line 1 is a condition to check convergence of this algorithm. Fig. 15 illustrates that our MS-VMD decompose the noisy signals into four modes, including respiration, heartbeat and other vehicle vibrations treated as noise components.
; 3
5
; 8
if then 9
3.5. Vital Signs Extraction
So far we have decomposed the RF signal into its components, including respiration signal, heartbeat signal and noise caused by vehicle vibration. In this section, we introduce how we identify the respiratory and heartbeat component and extract vital signs.
3.5.1. Respiratory Rate Estimation
Respiration can be modeled as follows: when the driver or passengers inhales, his diaphragm and other related muscle contracts to create space in the lungs and the lungs expands and let the air flow in. Looking from outside, chest and abdomen of the driver move forward. If the impulse radio is placed at the front of the vehicle, chest and abdomen get closer to the impulse radio. Conversely, if the driver or passengers exhale, diaphragm and related muscles relax, therefore the space in the chest gets smaller and the air inside is squeezed out, his chest and abdomen move backward and further away from the device. Since the distance between human and V2iFi and the signal is linearly related, V2iFi can track the respiration of the driver or the passenger by detecting the amplitude. To determine the respiratory rate of the driver, we apply Fast Fourier Transform (FFT) to the IMFs obtained from MS-VMD. Since the frequency of respiration ranges from 0.16 Hz to 0.6 Hz, the component whose frequency matches the range is the respiratory component. And the peak frequency of this IMF is respiratory rate. Respiration is the blue line shown both in time domain and frequency domain in Fig. 18 and Fig. 18.
3.5.2. Heart Rate Estimation
Similar to respiration, the contraction and relaxation of human heart cause small displacements on the surface of different parts of the person’s body. This phenomenon is called ventricular pump activity (Pinheiro et al. 2010). Ventricular pump activities are found in the head, torso, leg, buttock and etc. The minute movement caused by heartbeat also makes the signal change periodically, so V2iFi can also track heartbeat. To determine the heart rate of the driver, we again apply FFT to the IMFs obtained from MS-VMD (except the breathing-related IMF). Since the frequency of heartbeat ranges from 1 Hz to 2 Hz, the component whose frequency matches the range is the heartbeat component. And the peak frequency of this IMF is heart rate. Heartbeat is the red line shown both in time domain and frequency domain in Fig. 18 and Fig. 18.
3.5.3. Interbeat Interval Segmentation
To estimate interbeat intervals, we look into the heartbeat IMF, as shown in 18. IBIs are determined by the timings of each heartbeat. To obtain the exact timings, we detect peaks in the decomposed heartbeat IMF. However, the heartbeat waveform signal is weak and easily affected by noise and artifacts. Hence there are challenges in detecting peaks: i) heartbeat peak detection should be adaptive, since the strength of the signal is not stable and ii) fake peaks should be removed. To solve these challenges, we design a peak detection algorithm in which peaks are separated by at least samples, that is to say, we find peaks that are the local maxima in a region of . is determined by the heart rate estimated in Sec. 3.5.2. If the heart rate of the driver is , the heartbeat frequency is . Since the sampling rate of V2iFi is , the average number of samples in one interval should be . The relation between the minimum samples in one IBI and the average samples is given by , where is a constant, and set to 0.7 empirically. To summarize, we detect local peaks separated by at least samples. The result of the peak detection algorithm is shown in Fig. 18. It can be seen that the timings of the beats are recovered accurately.
4. Evaluation
In this section, we evaluate V2iFi’s performance by conducting road test. We tested on different road conditions, participants and procedures. As shown in Table 2, V2iFi is able to measure respiratory rate, heart rate and heart rate variability for the driver, but it can only measure respiratory rate for all the other 3 people in the vehicle.
4.1. Experiment Setup
V2iFi adopts a COTS impulse radio XETHRU (Novelda AS 2017a) model X4M05 as its front-end. The radio transmits pulses with a width of . The center frequency of the radio is , the bandwidth is , the sampling frequency is , and we set frame per second as 400. The radio is connected to a Raspberry Pi via Serial Peripheral Interface (SPI). The hardware PCB is rather small with a size of . The whole hardware including power supply, fan, Raspberry Pi, and impulse radio is shown in Fig. 19. We place the whole V2iFi on the windshield of a vehicle. Since the impulse radio is facing the driver (also shown in Fig. 19), it can capture maximum amount of weak signals from multiple body parts (e.g., chest, abdomen, forehead and neck). We implement the software system presented in Sec. 3 using C++; it operates in real-time.

Extensive road tests have been performed while developing V2iFi. The driving route is designed to cover different road conditions and different traffic flows. Different conditions covered in the experiment include: parking, driving on smooth highway, driving on traffic-heavy road, driving in school area, driving at zebra and pedestrian crossing, entering and leaving intersections, driving uphill, driving downhill, driving in roundabouts, changing lanes, turning left, turning right and making U-turns. We have 4 drivers in total; each of them drive 15 miles and 30 minutes, so the total road test takes 60 miles and 2 hours. The vehicle used in the evaluation is a Mazda Axela. While the driver is driving, a copilot is responsible for collecting data. Two more passengers are in the back seats. We also tested effects of different clothing (lightweight T-shirt, heavyweight T-shirt, sweatshirt + lightweight T-shirt and sweatshirt + heavyweight T-shirt) on road tests.
We use a NEULOG respiration monitor belt logger sensor NUL-236 to obtain the ground truth of breathing. For heartbeat ground truth, we use the Heal Force PC-80B portable ECG monitor and extend the electrodes by exterior electrodes with lead wires to record the ECG data. The data is further processed to obtain heart rate and heart rate variability, which are then used as ground truth.
4.2. Overall Performance
4.2.1. Respiratory Rate Estimation Evaluation
Respiratory rate estimation error is used for the evaluation. The error is defined as the absolute value of the difference between the estimated respiratory rate and the actual respiratory rate , i.e., . We evaluate the respiratory rate estimation performance of V2iFi against WiFind* and Leem et al. (Leem et al. 2017). In WiFind*, we port the existing algorithm of WiFind (Jia et al. 2018) to UWB radio, so as to compare algorithms rather than radios. Leem et al. is one of the very few state-of-the-art research proposals leveraging UWB for vital sign detection (Leem et al. 2017). Fig. 20(a) plots the CDF of respiratory rate measurement errors over all experiments. We can see that V2iFi achieves a median error of for the driver. As a comparison, the median error of respiratory rate of WiFind* and Leem et al. are and respectively, and they all have long tails indicating their performance is unstable in extreme conditions.
4.2.2. Heart Rate Estimation Evaluation
We evaluate the heart rate estimation performance of V2iFi against Leem et al. The heart rate estimation error is defined as the absolute value of the difference between the estimated heart rate and the actual heart rate , i.e., . Fig. 20(b) plots the CDF of respiratory rate measurement errors over all experiments. We can see that V2iFi achieves a median error of for the driver. As a comparison, the median error of heart rate of Leem et al. (Leem et al. 2017) is , and has a relatively long tail indicating the performance is unstable in extreme conditions.
4.2.3. Heart Rate Variability Estimation Evaluation
Next, we evaluate V2iFi’s heart rate variability estimation performance against Leem et al.. Since all other indicators, such as SDNN, SDRR, SDANN are all derived from IBI, we evaluate the accuracy of IBI measurement accuracy. Fig. 20(c) plots the CDF of IBI measurement errors over all experiments. We can see that V2iFi achieves a median error of 50 ms for the IBI of the driver. As a comparison, the median error of IBI of Leem et al. (Leem et al. 2017) is , which is almost useless for vital sign monitoring.
4.2.4. Breathing and Heartbeat Transitions Evaluation
One thing to keep in mind is that V2iFi is designed for detecting abnormal human vital signs and alert the user when suspicious signals exist. Therefore it should not only detect normal signals, but also abnormal signals of the driver and passengers. Next we evaluate the performance of V2iFi for detecting abnormal vital signs. We ask the driver in the vehicle to intentionally change their respiratory rate (from to after 2 minutes) and respiration pattern. For heartbeat, we ask the people in the vehicle to do some vigorous exercising to increase heart rate before entering the vehicle, and we observe how heart rate decreases with time. The result is shown in Fig. 21(a) and Fig. 21(b). It can be seen that the detected vital signs of V2iFi follow the same trends as the actual abnormal vital signs for all these respiration heartbeat transitions. During the transitions, the average error of the estimated respiratory rate is , the average error of the estimated heart rate is .
4.3. User and Environment Issue Study
4.3.1. Number of Users
Although V2iFi focuses on monitoring vital signs of the driver, the system can potentially be extended to monitor copilot and passengers in theory. In this section, we study the multi-user vital sign monitoring performance of V2iFi. However, due to the Field of View (FOV) and noise in the vehicle, for the copilot and passengers, V2iFi can measure respiratory rate only. Table 2 summarize the vital signs V2iFi can measure for different users. In Fig. 22, it can be clearly seen that estimation error increases with distance, the respiratory rate estimation error of the driver is the smallest while passengers in the rear seats have the largest respiratory rate estimation error.
| Respiratory Rate | Heart Rate | Heart Rate Variability | |
|---|---|---|---|
| Driver | Yes | Yes | Yes |
| Copilot | Yes | No | No |
| Passenger 1 | Yes | No | No |
| Passenger 2 | Yes | No | No |
4.3.2. Impact of Radio Placement
To get the best performance of V2iFi, we study the impact of different radio placements for V2iFi by placing the radio at three different locations in the vehicle, i.e., at the top of the windshield, at the bottom of the windshield, at the top of the chair and on the door. The estimation errors of the vital signs are shown in Fig. 23. It can be seen that the performance of V2iFi is the best when the radio is placed at the top of the windshield and faces the driver. In addition, when the radio is placed at the top of chair, the estimation errors of heart rate and IBI are relatively low. This is because when the impulse radio is placed at the top of the chair, it faces the driver’s neck, where the carotid artery is located and movements caused by heartbeat is most obvious.
4.3.3. Impact of Clothing
In our experiment, we ask our driver to wear different clothes and observe their respective results. The performance of V2iFi is studied extensively under different clothing conditions. The clothing in our experiment are: (1) lightweight T-shirt (2) heavyweight T-shirt (3) sweatshirt +lightweight T-shirt (4) sweatshirt + heavyweight T-shirt. The result is shown in Fig. 24.
It can be seen for all the different clothing, V2iFi reaches a median estimation error for respiratory rate, a median estimation error for heart rate and estimation error for IBI. Moreover, it can be seen that V2iFi performs better when the driver wear less, e.g., the result when the driver wear lightweight T-shirt is better than that of sweatshirt + heavyweight T-shirt. This is because some signals unable to penetrate heavyweight clothing and reach people’s chest and abdomen and still able to detect minute movements like heartbeat. Moreover, even in the worst case, where the driver or passenger wears sweatshirt + heavy weight T-shirt, the estimation error for respiratory rate and heart rate is still acceptable.
4.3.4. Impact of Road Types and Traffic Conditions
The signal quality of V2iFi can be affect by different road types and traffic conditions, and thus the performance of V2iFi can be impacted. To make sure V2iFi works on different road types and under different traffic conditions. We collect data of different road types (e.g., smooth highway, bumpy road, uphill road, downhill road, intersections, left turns, right turns, roundabouts, U-turns) and analyzed the results respectively. The results are shown in Fig. 25. It can be seen that if the surface of the road is smooth and not many manoeuvres are made, the estimation error of vital signs are low, while bumpy roads and driving manoeuvres increase the estimation error.
4.4. Key Processes Study
4.4.1. Baseband Signal Processing
According to the analysis in Sec. 3, both amplitude and phase of the reflected signal after IQ downconversion contain vital sign information. V2iFi chooses amplitude to estimate breathing and heartbeat. Contrary to common belief that amplitude is more vulnerable to random noises, our evaluation show that estimating vital signs by amplitude gives a better performance. Our explanation for this is as follows: if phase signal is to be used, we have to select a static fast-time bin as reference and do phase correction first. However, in driving environments, it is nearly impossible to find fast-time bin which represents a static reflector. Therefore, in V2iFi, amplitude of the baseband signal is selected for vital sign extraction.
The experiment result is shown in Fig. 26. It can be seen that system using amplitude signal achieves less overall errors than systems using phase signal. For respiratory rate estimation error, the median with amplitude baseband processing is , and the median with phase baseband processing is . For heart rate estimation error, the median with amplitude baseband processing is , and the median with phase baseband processing is . For IBI estimation error, the median with amplitude baseband processing is , and median with phase baseband processing is .
4.4.2. Signal Decomposition
In V2iFi, our novel MS-VMD algorithm is used to decompose the filtered signal into its vital sign components. According to the analysis in Sec. 3.4, our novel MS-VMD algorithm employs time diversity to enhance vital signals. It jointly optimizes the problem of minimum bandwidth with multiple sequences taken into account, hence better than VMD, where only one data sequence is considered. Fig. 27 gives the resulting waveforms of a case where conventional VMD algorithm only obtains a mix of respiration and heartbeat, while MS-VMD separates the two signals successfully.
To evaluate their performance, we test these two algorithms on the same data, and the result is shown in Fig. 28. In the figure, it can be seen that system using MS-VMD algorithm achieves less overall errors than systems using VMD algorithm. For respiratory rate estimation error, the median with MS-VMD algorithm is , and the median with VMD algorithm is . For heart rate estimation error, the median with MS-VMD algorithm is , and the median with VMD algorithm is . For IBI estimation error, the median with MS-VMD algorithm is , and the median with VMD algorithm is .
5. Limitations and Potentials
5.1. Limitation of V2iFi
We designed V2iFi in the hope of bringing well-being to the driving environments. V2iFi is successful in terms of monitoring vital signs. However, monitoring is not the final goal: the vital sign data collected should be used by the vehicle to infer user states and take actions correspondingly. To achieve this, vital signs should be mapped to physiological and psychological states. In previous studies it is shown that the vital signs can indeed reflect physical health (e.g., cadiac health and drowsiness level) (Li et al. 2015; Fieselmann et al. 1993; Cysarz et al. 2007) and mental health (e.g., emotion and mental workload) (Zhao et al. 2016; Brookhuis and de Waard 2010). A commonly used approach for such mapping is supervised learning, e.g., decision tree and SVM (Jia et al. 2018). However, learning algorithms do not work without properly labelled data. Awais et al. (Awais et al. 2017) use subjective measures (i.e., what the participant says) to label both physical and mental states, but subjective measures are unreliable and inaccurate, potentially leading to inconsistent inference results. To measure the person-specific states objectively and accurately, we face many challenges such as infringement of privacy and lack of gauging device. Moreover, medical organizations do not easily provide related data because of potential misuse of information and violation of law. Nevertheless, once we have properly labelled data at hand, we envision that V2iFi can become the foundation of more interesting applications, as we present in the following.
5.2. Application 1: Driver Drowsiness Detection
Driver drowsiness is one of the biggest culprit in car accidents, research shows that driver drowsiness is a contributing factor in of all the crashes (Jackson et al. 2011), and about of all fatalities on road (Flatley et al. 2004). A series of vital sign changes indicate a drowsy driver, e.g., decreased respiratory rate, decreased heart rate and decreased HRV. V2iFi can detect all these changes, and a high-level learning algorithm such as decision tree and SVM can be used to combine the aforementioned change in vital signs to make a binary decision(i.e., drowsy or awake) in a specific time span. An example decision tree is shown in Fig. 29.
5.3. Application 2: Road Rage Prevention
Road rage is violent behaviors perpetrated by drivers and it is extremely dangerous. Being slowed down and blocked by others on overly crowded streets make drivers on the road irritated and road rage arises thereafter. DePasquale et al. (DePasquale et al. 2001) show road rage incidents is on the rise in recent years. To prevent road rage, legal measures, better vehicle design, education in everyday life and infrastructure improvement have been tested. However, because road rage events are sporadic, all these preventive measures cannot handle a real road rage event in time. Since reflected RF signals of V2iFi carry information of the emotion of the driver (Zhao et al. 2016), it is possible to build a road rage detection system on top of V2iFi and the vehicle can respond, take precautions and combat road rage. Similar to driver drowsiness detection, we can use a learning algorithm, such as a decision tree similar to that in Fig. 29 to infer the driver’s road rage level. The vehicle can then sends an alert to the driver in time or brakes if necessary.
5.4. Application 3: Health Monitoring for Children and Seniors in the Vehicle
It has long been known that environments inside vehicle cause significant health harm and hazards. Particularly, seniors and children are more vulnerable and tend to become victims. There are two reasons: i) seniors and children are more physically inactive inside a vehicle and ii) children and seniors are more sensitive to the car exhaust in vehicle. With V2iFi, vital signs of children and seniors inside can be monitored, and common diseases such as childhood asthma and heart failure among the senior people can be infered from abnormal vital signs, hence be prevented. V2iFi is a potential solution to solve the health issues and build a healthy and secure environments for the children and seniors.
6. Related Work
Existing work in health monitoring in driving environments can be roughly categorized into three classes: (1) vision-based method, (2) sensor-based method and (3) RF-based method.
The accuracy of the detection systems depends largely on the invasiveness allowed. The detection systems with direct contact with the driver are the most accurate ones, but they hinder the body movements of the driver and thus cause inconvenience while driving, so they are not accepted very well in the industry. On the other side of the invasiveness spectrum are those "aerial" sensors, they are not in direct contact with the driver. These systems get indirect signals of the driver, such as eye movement to infer other physiological variables, so they cannot be very accurate. Although these systems are more easily accepted in the industry, they need more data and calibration to characterize health states of the people effectively. In the following, we elaborate the subcategories of the systems:
Vision-based methods: Vision-based methods deploy one camera, usually at the front of the vehicle, to capture the activities, various signals and performance of the driver and passengers. Eriksson et al. (Eriksson and Papanikotopoulos 1997) proposed a system to track movements of eyes and eyelids of the driver. Following preprocessing, they locate the driver’s face in the grayscale image, and then eyes are further located and tracked. The states of the eyes, whether open or closed are determined by template matching. However, taking photo of the driver’s face raises privacy concerns, which makes it not good for private room such as driving environments. Meanwhile, vision-based systems are also sensible to external conditions, lighting and weather conditions, different dress and fashion accessories like glasses, winter clothes will decrease the detection accuracy.
Sensor-based methods: Sensor-based methods can be further categorized to two groups: EEG-based and ECG-based method. EEG-based methods use brain physiological changes to detect vital signs. Multiple thin metal wires (electrodes) are placed on the scalp. The waveform obtained by EEG reflects the mental activities of the brain. In (Mardi et al. 2011), nonlinear and chaotic vital signs of drivers are extracted. Another portable low-cost EEG method is proposed in (Ogino and Mitsukura 2018), and SVM is used to classify EEG data as different health states. Similar to EEG-based methods, ECG-based methods provide accurate physiological signals of the driver under test. Heart rate variability is extracted from the ECG signal in (Elsenbruch et al. 1999; Tsunoda et al. 2001). In another work, a smart cushion containing an integrated micro-bending fiber sensor is used to imitate ECG sensors (Deepu et al. 2012). However, EEG and ECG deploy sensors on human skin to detect biological signals. They require conductive paste to reduce skin impedance to build electrical contact, making the methods intrusive, time-consuming and inconsistent when long recording is needed (Sullivan et al. 2007). These methods always make the users aware of its existence and degrade user experience.
Wi-Fi-based methods: Wi-Fi sensing based vital sign estimation has been investigated in recent works such as (Zhang et al. 2017; Zeng et al. 2018; Wang et al. 2018a; Wu et al. 2017). These works focus on static environment but not in-vehicle environment. In (Jia et al. 2018), Jia et al. propose a fatigue detection approach Wi-Find based on Wi-Fi CSI. Channel State Information (CSI) describes the channel properties of a communication link from the transmitter to the receiver. For a Wi-Fi router, CSI information can be obtained at different carrier frequencies and along different paths. The CSI measured by Wi-Fi devices is widely used for localization, occupation sensing, activity recognition and other sensing purposes. Compared to the aforementioned sensor-based systems, the system proposed in (Jia et al. 2018) only requires a wireless STA and AP, thus is device-free.
Despite the existence of several vital signs monitoring systems, few of them are practical in the driving environments. Our work answers challenges such as passenger interference, in-vehicle vibration, human motion, etc., and monitors vital signs in driving environments successfully.
7. Conclusion
In this paper, we present the design and implementation of V2iFi, which a vital sign monitoring system in driving environments leveraging the power of impulse radio. We address several challenges including extracting fine-grained driver’s vital sign from RF signal polluted with vehicle vibration noise and mixed with vital signals from other passengers. V2iFi consists of multiple algorithms for removing noise, including the novel MS-VMD algorithm. The system is evaluated in real road test and demonstrated low respiratory rate, heart rate and heart rate variability estimation error. In the future, we will extend V2iFi to a fully-grown in-vehicle health monitoring system. We believe V2iFi takes a big step toward enabling health monitoring in driving environments, it allows vehicles to “listen” and understand the driver and passengers and thus become more intelligent.
Acknowledgements.
This paper is supported by the Ministry of Education, Singapore, under its AcRF Tier 2 Grant MOE2016-T2-2-022 and AcRF Tier 1 Grant RG17/19. We would also like to extend our thanks to the technicians of WiRUSH.ai (http://www.wirush.ai) for their help in offering us the hardware and technical support.References
- (1)
- Adib et al. (2014) Fadel Adib, Zach Kabelac, Dina Katabi, and Robert C Miller. 2014. 3D Tracking via Body Radio Reflections. In Proc. of the 10th USENIX NSDI. 317–329.
- Adib et al. (2015) Fadel Adib, Hongzi Mao, Zachary Kabelac, Dina Katabi, and Robert C Miller. 2015. Smart Homes That Monitor Breathing and Heart Rate. In Proc. of the 33rd ACM CHI. 837–846.
- Awais et al. (2017) Muhammad Awais, Nasreen Badruddin, and Micheal Drieberg. 2017. A Hybrid Approach to Detect Driver Drowsiness Utilizing Physiological Signals to Improve System Performance and Wearability. Sensors 17, 9 (2017), 1991.
- Banning and Ng (2012) Amerjeet S Banning and G Andre Ng. 2012. Driving and Arrhythmia: A Review of Scientific Basis for International Guidelines. European Heart Journal 34, 3 (2012), 236–244.
- Benichou et al. (2018) Thomas Benichou, Bruno Pereira, Martial Mermillod, Igor Tauveron, Daniela Pfabigan, Salwan Maqdasy, and Frederic Dutheil. 2018. Heart Rate Variability in Type 2 Diabetes Mellitus: A Systematic Review and Meta-Analysis. PLOS One 13, 4 (2018), e0195166.
- Björklund et al. (2015) Svante Björklund, Anders Nelander, and Mats I Pettersson. 2015. Fast-Time and Slow-Time Space-Time Adaptive Processing for Bistatic Radar Interference Suppression. In 2015 IEEE Radar Conference (Radarcon). 0674–0678.
- BMW AG (2019) BMW AG. 2019. Smartsenior: Intelligente Dienste Und Dienstleistungen Für Senioren. http://www1.smart-senior.de/pdf/presse/SmartSenior_CeBIT_Partnerflyer_BMW_DE_EN_2012_final.pdf. Accessed: 2019-10-09.
- Boyd et al. (2011) Stephen Boyd, Neal Parikh, Eric Chu, Borja Peleato, Jonathan Eckstein, et al. 2011. Distributed Optimization and Statistical Learning via the Alternating Direction Method of Multipliers. Foundations and Trends® in Machine learning 3, 1 (2011), 1–122.
- Brookhuis and de Waard (2010) Karel A Brookhuis and Dick de Waard. 2010. Monitoring Drivers’ Mental Workload in Driving Simulators using Physiological Measures. Accident Analysis & Prevention 42, 3 (2010), 898–903.
- Catterall et al. (1982) JR Catterall, PMA Calverley, V Brezinova, NJ Douglas, HM Brash, CM Shapiro, and DC Flenley. 1982. Irregular Breathing and Hypoxaemia During Sleep in Chronic Stable Asthma. The Lancet 319, 8267 (1982), 301–304.
- Chalmers et al. (2014) John A Chalmers, Daniel S Quintana, Maree J Abbott, Andrew H Kemp, et al. 2014. Anxiety Disorders Are Associated with Reduced Heart Rate Variability: A Meta-Analysis. Frontiers in Psychiatry 5 (2014), 80.
- Cho et al. (2014) Hyunggi Cho, Young-Woo Seo, BVK Vijaya Kumar, and Ragunathan Raj Rajkumar. 2014. A Multi-Sensor Fusion System for Moving Object Detection and Tracking in Urban Driving Environments. In IEEE International Conference on Robotics and Automation (ICRA). 1836–1843.
- Chua et al. (2012) Eric Chern-Pin Chua, Wen-Qi Tan, Sing-Chen Yeo, Pauline Lau, Ivan Lee, Ivan Ho Mien, Kathiravelu Puvanendran, and Joshua J. Gooley. 2012. Heart Rate Variability Can Be Used to Estimate Sleepiness-related Decrements in Psychomotor Vigilance during Total Sleep Deprivation. Sleep 35, 3 (03 2012), 325–334.
- Clark and Kruse (1990) Vivian L Clark and James A Kruse. 1990. Clinical Methods: The History, Physical, and Laboratory Examinations. Jama 264, 21 (1990), 2808–2809.
- Cretikos et al. (2008) Michelle A Cretikos, Rinaldo Bellomo, Ken Hillman, Jack Chen, Simon Finfer, and Arthas Flabouris. 2008. Respiratory Rate: The Neglected Vital Sign. Medical Journal of Australia 188, 11 (2008), 657–659.
- Cysarz et al. (2007) Dirk Cysarz, Silke Lange, Peter F Matthiessen, and Peter van Leeuwen. 2007. Regular Heartbeat Dynamics Are Associated with Cardiac Health. Am. J. Physiol 292, 1 (2007), R368–R372.
- Daimler AG (2019) Daimler AG. 2019. Attention Assist: Drowsiness-Detection System Warns Drivers to Prevent Them Falling Asleep Momentarily - Daimler Global Media Site. https://media.daimler.com/marsMediaSite/en/instance/ko/ATTENTION-ASSIST-Drowsiness-detection-system-warns-drivers-to-prevent-them-falling-asleep-momentarily.xhtml?oid=9361586. Accessed: 2019-10-09.
- Deepu et al. (2012) Chacko John Deepu, Zhihao Chen, Ju Teng Teo, Soon Huat Ng, Xiefeng Yang, and Yong Lian. 2012. A Smart Cushion for Real-Time Heart Rate Monitoring. In 2012 IEEE Biomedical Circuits and Systems Conference. 53–56.
- DePasquale et al. (2001) Jason P DePasquale, E Scott Geller, Steven W Clarke, and Lawrence C Littleton. 2001. Measuring Road Rage: Development of The Propensity for Angry Driving Scale. J. Saf. Res. 32, 1 (2001), 1–16.
- Dragomiretskiy and Zosso (2013) Konstantin Dragomiretskiy and Dominique Zosso. 2013. Variational Mode Decomposition. IEEE Transactions on Signal Processing 62, 3 (2013), 531–544.
- Elliott and Coventry (2012) Malcolm Elliott and Alysia Coventry. 2012. Critical Care: the Eight Vital Signs of Patient Monitoring. British Journal of Nursing 21, 10 (2012), 621–625.
- Elsenbruch et al. (1999) Sigrid Elsenbruch, Michael J Harnish, and William C Orr. 1999. Heart Rate Variability During Waking and Sleep in Healthy Males and Females. Sleep 22, 8 (1999), 1067–1071.
- Eriksson and Papanikotopoulos (1997) Martin Eriksson and Nikolaos P Papanikotopoulos. 1997. Eye-Tracking for Detection of Driver Fatigue. In Proc. of Conference on Intelligent Transportation Systems. 314–319.
- Ernst (2017) Gernot Ernst. 2017. Heart-Rate Variability-More than Heart Beats? Frontiers in Public Health 5 (2017), 240.
- Fieselmann et al. (1993) John F Fieselmann, Michael S Hendryx, Charles M Helms, and Douglas S Wakefield. 1993. Respiratory Rate Predicts Cardiopulmonary Arrest for Internal Medicine Inpatients. Journal of General Internal Medicine 8, 7 (1993), 354–360.
- Flatley et al. (2004) Diane Flatley, LA Reyner, and James A Horne. 2004. Sleep-Related Crashes on Sections of Different Road Types in the UK (1995-2001). Road Safety United States Naval School of Aviation Medicine 52 (2004).
- Fujiwara et al. (2018) Koichi Fujiwara, Erika Abe, Keisuke Kamata, Chikao Nakayama, Yoko Suzuki, Toshitaka Yamakawa, Toshihiro Hiraoka, Manabu Kano, Yukiyoshi Sumi, Fumi Masuda, et al. 2018. Heart Rate Variability-Based Driver Drowsiness Detection and its Validation with EEG. IEEE Transactions on Biomedical Engineering 66, 6 (2018), 1769–1778.
- Giardino et al. (2007) Nicholas D Giardino, Seth D Friedman, and Stephen R Dager. 2007. Anxiety, Respiration, and Cerebral Blood Flow: Implications for Functional Brain Imaging. Comprehensive Psychiatry 48, 2 (2007), 103–112.
- Halperin et al. (2011) Daniel Halperin, Wenjun Hu, Anmol Sheth, and David Wetherall. 2011. Tool Release: Gathering 802.11n Traces with Channel State Information. ACM SIGCOMM Computer Communication Review 41, 1 (2011), 53.
- Huynh et al. (2019) Sinh Huynh, Rajesh Krishna Balan, JeongGil Ko, and Youngki Lee. 2019. VitaMon: Measuring Heart Rate Variability Using Smartphone Front Camera. In Proc. of the 17th ACM Sensys. 1–14.
- Jackson et al. (2011) P Jackson, C Hilditch, A Holmes, N Reed, N Merat, and L Smith. 2011. Fatigue and Road Safety: A Critical Analysis of Recent Evidence. Department for Transport, Road Safety Web Publication 21 (2011).
- Jia et al. (2018) Wenjia Jia, Hongjian Peng, Na Ruan, Zhiping Tang, and Wei Zhao. 2018. WiFind: Driver Fatigue Detection with Fine-Grained Wi-Fi Signal Features. IEEE Transactions on Big Data (2018), 1–14.
- Jo et al. (2019) Sang-Ho Jo, Jin-Myung Kim, and Dong Kyoo Kim. 2019. Heart Rate Change While Drowsy Driving. Journal of Korean Medical Science 34, 8 (2019).
- Leem et al. (2017) Seong Kyu Leem, Faheem Khan, and Sung Ho Cho. 2017. Vital Sign Monitoring and Mobile Phone Usage Detection Using IR-UWB Radar for Intended Use in Car Crash Prevention. Sensors (2017).
- Li et al. (2015) Gang Li, Boon-Leng Lee, and Wan-Young Chung. 2015. Smartwatch-based Wearable EEG System for Driver Drowsiness Detection. IEEE Sensors Journal 15, 12 (2015), 7169–7180.
- Li et al. (2017) Xiang Li, Daqing Zhang, Qin Lv, Jie Xiong, Shengjie Li, Yue Zhang, and Hong Mei. 2017. IndoTrack: Device-Free Indoor Human Tracking with Commodity Wi-Fi. Proc. of the 17th ACM UbiComp 1, 3 (2017), 72.
- Lisper et al. (1973) H-O Lisper, Hans Laurell, and G Stening. 1973. Effects of Experience of The Driver on Heart-Rate, Respiration-Rate, and Subsidiary Reaction Time in A Three Hours Continuous Driving Task. Ergonomics 16, 4 (1973), 501–506.
- Lutfi (2015) Mohamed Faisal Lutfi. 2015. Patterns of Heart Rate Variability and Cardiac Autonomic Modulations in Controlled and Uncontrolled Asthmatic Patients. BMC Pulmonary Medicine 15, 1 (2015), 119.
- Mardi et al. (2011) Zahra Mardi, Seyedeh Naghmeh Miri Ashtiani, and Mohammad Mikaili. 2011. EEG-Based Drowsiness Detection for Safe Driving Using Chaotic Features and Statistical Tests. Journal of Medical Signals and Sensors 1, 2 (2011), 130.
- Nabi et al. (2010) Hermann Nabi, Martica Hall, Markku Koskenvuo, Archana Singh-Manoux, Tuula Oksanen, Sakari Suominen, Mika Kivimäki, and Jussi Vahtera. 2010. Psychological and Somatic Symptoms of Anxiety and Risk of Coronary Heart Disease: the Health and Social Support Prospective Cohort Study. Biological Psychiatry 67, 4 (2010), 378–385.
- Novelda AS (2017a) Novelda AS. 2017a. Single-Chip Radar Sensors with Sub-mm Resolution - XETHRU. https://www.xethru.com/. Accessed: 2019-10-03.
- Novelda AS (2017b) Novelda AS. 2017b. XETHRU Sensor Emissions: An In-Depth Look at Radar Safety Regulations. https://www.xethru.com/blog/posts/xethru-radar-emission-comparison. Accessed: 2019-10-03.
- Ogino and Mitsukura (2018) Mikito Ogino and Yasue Mitsukura. 2018. Portable Drowsiness Detection Through Use of A Prefrontal Single-Channel Electroencephalogram. Sensors 18, 12 (2018), 4477.
- Park et al. (2019) Jin-Kwan Park, Yunseog Hong, Hyunjae Lee, Chorom Jang, Gi-Ho Yun, Hee-Jo Lee, and Jong-Gwan Yook. 2019. Noncontact RF Vital Sign Sensor for Continuous Monitoring of Driver Status. IEEE Transactions on Biomedical Circuits and Systems 13, 3 (2019), 493–502.
- Pinheiro et al. (2010) Eduardo Pinheiro, Octavian Postolache, and Pedro Girão. 2010. Theory and Developments in An Unobtrusive Cardiovascular System Representation: Ballistocardiography. The Open Biomedical Engineering Journal 4 (2010), 201.
- Raemer (1996) Harold R Raemer. 1996. Radar Systems Principles. CRC press.
- Raspberry Pi Foundation (2019) Raspberry Pi Foundation. 2019. Teach, Learn and Make with Raspberry Pi - Raspberry Pi. https://https://www.raspberrypi.org/. Accessed: 2019-10-03.
- Sessa et al. (2018) Francesco Sessa, Valenzano Anna, Giovanni Messina, Giuseppe Cibelli, Vincenzo Monda, Gabriella Marsala, Maria Ruberto, Antonio Biondi, Orazio Cascio, Giuseppe Bertozzi, et al. 2018. Heart Rate Variability As Predictive Factor for Sudden Cardiac Death. Aging (Albany NY) 10, 2 (2018), 166.
- Shaffer and Ginsberg (2017) Fred Shaffer and JP Ginsberg. 2017. An Overview of Heart Rate Variability Metrics and Norms. Frontiers in Public Health 5 (2017), 258.
- Shaffer et al. (2014) Fred Shaffer, Rollin McCraty, and Christopher L Zerr. 2014. A Healthy Heart Is Not A Metronome: An Integrative Review of the Heart’s Anatomy and Heart Rate Variability. Frontiers in Psychology 5 (2014), 1040.
- Sharma et al. (2011) Anupriya Sharma, NB Hirulkar, and Payal Ranka. 2011. Effect of Hyperglycemia on Electrolytes Imbalance. Int J Pharm Biol Arch 2 (2011), 526–33.
- Solaz et al. (2016) José Solaz, José Laparra-Hernández, Daniel Bande, Noelia Rodríguez, Sergio Veleff, José Gerpe, and Enrique Medina. 2016. Drowsiness Detection Based on the Analysis of Breathing Rate Obtained from Real-Time Image Recognition. Transportation Research Procedia 14 (2016), 3867–3876.
- Strauß et al. (2014) Richard Strauß, Santiago Ewig, Klaus Richter, Thomas König, Günther Heller, and Torsten T Bauer. 2014. The Prognostic Significance of Respiratory Rate in Patients with Pneumonia: A Retrospective Analysis of Data from 705 928 Hospitalized Patients in Germany from 2010–2012. Deutsches Ärzteblatt International 111, 29-30 (2014), 503.
- Sullivan et al. (2007) Thomas J Sullivan, Stephen R Deiss, and Gert Cauwenberghs. 2007. A Low-Noise, Non-Contact EEG/ECG Sensor. In 2007 IEEE Biomedical Circuits and Systems Conference. 154–157.
- Troutman (2012) John L Troutman. 2012. Variational Calculus and Optimal Control: Optimization with Elementary Convexity. Springer Science & Business Media.
- Tsunoda et al. (2001) Mihoko Tsunoda, Takuro Endo, Satoko Hashimoto, Sato Honma, and Ken-Ichi Honma. 2001. Effects of Light and Sleep Stages on Heart Rate Variability in Humans. Psychiatry and Clinical Neurosciences 55, 3 (2001), 285–286.
- Volvo Group (2019) Volvo Group. 2019. Driver Alert System. https://www.volvocars.com/en-th/support/manuals/s60/2014/driver-support/driver-alert-system/driver-alert-control-dac---operation. Accessed: 2019-10-09.
- Wang et al. (2018a) Chuyu Wang, Lei Xie, Wei Wang, Yingying Chen, Yanling Bu, and Sanglu Lu. 2018a. RF-ECG: Heart Rate Variability Assessment Based on COTS RFID Tag Array. Proc. of the 17th ACM UbiComp 2, 2 (2018), 85.
- Wang et al. (2018b) Tianben Wang, Daqing Zhang, Yuanqing Zheng, Tao Gu, Xingshe Zhou, and Bernadette Dorizzi. 2018b. C-FMCW Based Contactless Respiration Detection Using Acoustic Signal. Proc. of the 17th ACM UbiComp 1, 4 (2018), 170.
- Waring et al. (2008) WS Waring, JY Rhee, DN Bateman, GE Leggett, and H Jamie. 2008. Impaired Heart Rate Variability and Altered Cardiac Sympathovagal Balance After Antidepressant Overdose. European Journal of Clinical Pharmacology 64, 11 (2008), 1037–1041.
- Wu et al. (2017) Dan Wu, Daqing Zhang, Chenren Xu, Hao Wang, and Xiang Li. 2017. Device-Free WiFi Human Sensing: From Pattern-Based to Model-Based Approaches. IEEE Communications Magazine 55, 10 (2017), 91–97.
- Xu et al. (2019) Xiangyu Xu, Jiadi Yu, Yingying Chen, Yanmin Zhu, Linghe Kong, and Minglu Li. 2019. BreathListener: Fine-Grained Breathing Monitoring in Driving Environments Utilizing Acoustic Signals. In Proc. of the 17th ACM MobiSys. 54–66.
- Zeng et al. (2018) Youwei Zeng, Dan Wu, Ruiyang Gao, Tao Gu, and Daqing Zhang. 2018. FullBreathe: Full Human Respiration Detection Exploiting Complementarity of CSI Phase and Amplitude of WiFi Signals. Proc. of the 18th ACM UbiComp 2, 3 (2018), 148.
- Zhang et al. (2017) Jin Zhang, Weitao Xu, Wen Hu, and Salil S Kanhere. 2017. WiCare: Towards In-Situ Breath Monitoring. In Proc. of the 14th ACM MobiQuitous. ACM, 126–135.
- Zhao et al. (2016) Mingmin Zhao, Fadel Adib, and Dina Katabi. 2016. Emotion Recognition Using Wireless Signals. In Proc. of the 22nd ACM MobiCom. 95–108.