Capturing Dynamics of Information Diffusion in SNS: A Survey of Methodology and TechniquesDOI: 10.1145/1122445.1122456Journal: JACMVolume: 3741118CCS: Human-centered computing Social networks
Abstract.
Studying information diffusion in SNS (Social Networks Service) has remarkable significance in both academia and industry. Theoretically, it boosts the development of other subjects such as statistics, sociology, and data mining. Practically, diffusion modeling provides fundamental support for many downstream applications (e.g., public opinion monitoring, rumor source identification, and viral marketing.) Tremendous efforts have been devoted to this area to understand and quantify information diffusion dynamics. This survey investigates and summarizes the emerging distinguished works in diffusion modeling. We first put forward a unified information diffusion concept in terms of three components: information, user decision, and social vectors, followed by a detailed introduction of the methodologies for diffusion modeling. And then, a new taxonomy adopting hybrid philosophy (i.e., granularity and techniques) is proposed, and we made a series of comparative studies on elementary diffusion models under our taxonomy from the aspects of assumptions, methods, and pros and cons. We further summarized representative diffusion modeling in special scenarios and significant downstream tasks based on these elementary models. Finally, open issues in this field following the methodology of diffusion modeling are discussed.
Keywords:
social network, diffusion models, propagation prediction, taxonomy.1. Introduction
The vigorous development of SNS (Social Network Service) has shifted the way humans use the Internet from simple information retrieval to the construction and maintenance of online social relationships, as well as the creation, communication, and sharing of online information. SNS seeps into every aspect of social life and has a profound impact on it. According to the statistical report published by official institutes(Center [n.d.]), the number of SNS users in China reached 762 million in 2020, accounting for 95.6% of Internet users. The number of Facebook’s monthly active users hits 2 billion, doubled in less than five years (Constine [n.d.]). Millions of users make SNS powerful in many fields (e.g., business marketing, social governance). However, the risks of social networks cannot be neglected. Scholars have proven that fake news spread faster and wider than real news in social networks (Vosoughi et al. 2018). If malicious people utilize social networks to spread harmful information such as terrorism and rumors, it will cause a massive menace to social stability, such as Chinese salt scramble in 2011 (Kent [n.d.]), Arab Spring revolution (Khondker 2011), and the manipulation of political elections (Badawy et al. 2018).
Facing the opportunities and challenges brought by SNS, many scientists are devoted to studying the information diffusion in SNS, and information diffusion modeling is the basis of these studies. Information diffusion models aim at capturing the dynamics of information diffusing in social networks. It is of great significance to model the information diffusion process in both academia and practice. Academically, diffusion modeling involves multiple disciplines (e.g., statistics, complex networks, sociology, machine learning). Moreover, diffusion-related data itself is easily accessible, which in turn promotes the development of related disciplines. Practically, they are the basis of many downstream applications such as popularity prediction, influence maximization (IM), source identification, network inference, and social recommendation (see details in Section 4.2). Employing these applications in various social tasks (e.g., marketing, rumor source identification, and trending topics detection) makes society run more efficiently.
Overall, there are two main schools in the information diffusion modeling history: time-series and data-driven. For the former, researchers analyze the data to summarize the diffusion laws, and then use explicit mathematical expressions to model the dynamics of information diffusion over time. They mainly include difference/differential-based and stochastic-based models for volume prediction, progressive and non-progressive for individual adoption prediction, and likelihood maximization models for propagation relationship prediction. Each part of these models, including their input and output, has a clear physical meaning, which is the primary approach of classical diffusion modeling. For the latter, researchers expect that machine learning (ML) algorithms can learn diffusion laws from data to capture diffusion dynamics. Benefiting from the explosion of data resources and computing power, these models have been developed considerably. Especially, with the development of related technologies such as Natural Language Processing (NLP) and Reasoning, content semantics that difficult for traditional model processing can be directly learned from data, which means that a new era for information diffusion modeling is heralding.
Although there are several surveys (Wang et al. 2013a; Jiang et al. 2017; Li et al. 2018; Gao et al. 2019; Guille et al. 2013; Yao et al. 2015; Singh et al. 2018; Li et al. 2017b; Zubiaga et al. 2018; Gao et al. 2019; Zhou et al. 2021) on information diffusion, this survey is distinct in the following aspects. Fisrt, surveys (Wang et al. 2013a; Jiang et al. 2017; Li et al. 2018) focus on the downstream applications of diffusion models (e.g., worm propagation, source identification, IM, and popularity prediction) rather than introducing underlying diffusion models. Surveys (Guille et al. 2013; Yao et al. 2015; Singh et al. 2018; Gao et al. 2019; Zhou et al. 2021; Li et al. 2017b) do not involve relationship inference models (see details in Section 3.3) and non-progressive models (see details in Section 3.2.2) models. Second, the commonly used classification criteria (e.g., predictive/explanatory (Guille et al. 2013), topology-based/non-topology-based (Guille et al. 2013; Li et al. 2018)) are no longer applicable, because emerging models blur the original classification boundary. For instance, an explanatory model (Gao et al. 2017), which embeds information and users into a unified Euclidean semantic space, can predict the future diffusion trajectory based on geometrical relationships among information contents and users. Some classical non-topology-based models (Wang et al. 2012b; He et al. 2016a) that introduce topology factors. Obviously, previous classification criteria may narrow readers’ thoughts. Third, the information diffusion process is driven by users’ social behaviors. Information, social vectors, and users are an interactional and indivisible whole. However, the majority of existing models only focus on information diffusion actions and ignore other parts. With the development of NLP and other related technologies, information diffusion modeling has great academic and practical potentialities. Finally, although data-driven models can automatically learn the diffusion characteristics, they hardly introduce the knowledge of classical (Time-series) modeling techniques. Introducing the knowledge of time-series techniques can help model optimization, such as reducing the search space. Some scholars are already doing this meaningful work (Cao et al. 2017; Chen et al. 2019a; Bourigault et al. 2016; Wu et al. 2019). Therefore, we have summarized the typical extension roadmaps of time-series models, hoping to raise readers’ inspiration.
This survey consists of four main parts. First, we present preliminary and research methodology, including elementary notations, the unified diffusion modeling concept, and basic processes of information diffusion modeling. Second, we propose a new taxonomy of elementary diffusion models and classify them into three categories: Diffusion Volume Models, Individual Adoption Models, and Relationship Inference Models. Besides, comparative studies on assumptions, methods, as well as pros and cons are organized by these categories to help readers acquire comprehensive knowledge of information diffusion models. Third, we summarized representative diffusion modeling in special scenarios as well as downstream applications based on these elementary models. Last, we discuss open issues following the methodology of diffusion modeling.
We summarize our analysis of existing models below:
- •
Information diffusion scenario can be decomposed into three components: information, user, and topology. The information diffusion process is not isolated, as the three layers interact with each other. However, current research does not unify these three components.
- •
Existing diffusion models mainly describe the diffusion process from three levels of granularity: volume, individual, and propagation relationship. Under the granularity-oriented taxonomy, each type of model is classified into two categories: time-series and data-driven.
- •
Time-series individual adoption models (see details in Section 3.2.1 and Section 3.2.2) can not be used for propagation relationship inference directly, because they are the models with many-to-many propagation relationships. They can infer the propagation probabilities between users by likelihood maximization, and select corresponding relationships to construct a propagation network.
- •
Data-driven models avoid the intrinsic process of devising precise mathematical diffusion models, making them easier to utilize new features. However, their difficulties are extracting representative and comprehensive features.
- •
These two approaches should be mutually reinforcing. Time-series models can provide inspiration for the design of deep learning models, and the Data-driven model can explore new diffusion characteristics to improve the mathematical expression of Time-series models.
The rest of the article is organized as follows. Section 2 introduces the methodology and basic knowledge used in this article. We further provide a thorough review of elementary information diffusion models in Section 3. Section 4 summarizes and discusses some scenario-specified diffusion modeling and downstream applications. Section 5 discuss open issues of diffusion modeling. Finally, we present the conclusion in Section 6.

2. Preliminary and Methodology of Information Diffusion
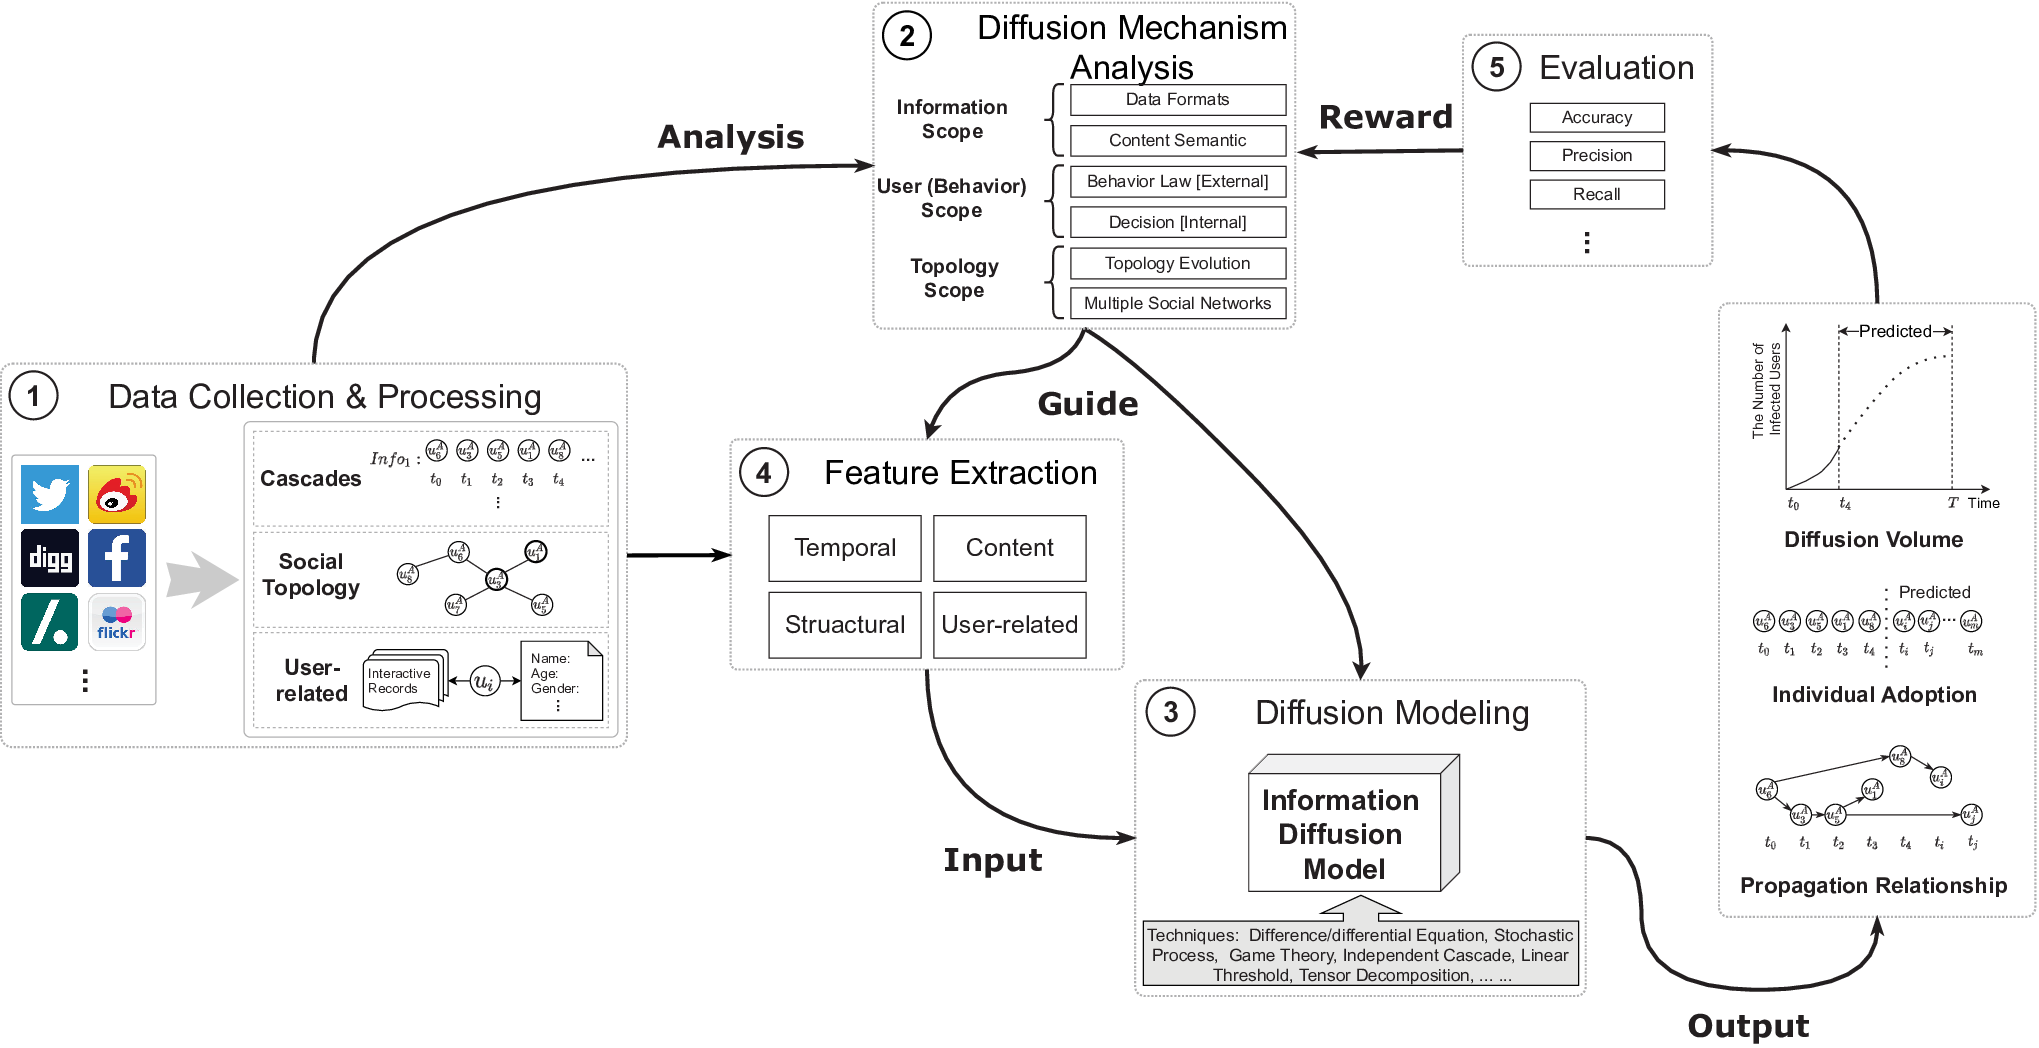
We introduce the notions and methodology of information diffusion modeling to help readers gain a rudimentary knowledge of it. For readability, the skeleton of this section is shown in Fig. 1.

2.1. Notions
2.1.1. Information Diffusion
Fig. 2(a) is an abstract representation of the information diffusion process in social networks, and it has the following facts:
- •
Three components in diffusion process: information, users (or user behavior), and social vectors (i.e., transmission media). Social vectors consist of users with their social friendships.
- •
Diffusion process is unified. Information, users, and social vectors influence each other in the diffusion process. As shown in the right part of Fig. 2(a), users perceive information and others’ opinions from their social neighbors or other channels, and then decide how to interact with it. After that, their social actions drive information propagation (e.g., retweet, comment) and social network evolution (e.g., follow, unfollow).
- •
Information content affects diffusion process. For a particular piece of information, acceptance of different users’ is various. For instance, boys who play basketball are obviously more likely to share NBA-related messages than girls who do not.
- •
Individual user social behaviors are diversified. The dynamics of information diffusion can only be captured by users’ social actions (action 4 and 5 in the right part of Fig. 2(a)), and the interval between social actions are not fixed (timestamps in the left part of Fig. 2(a)). In addition, the information can not only be transmitted via social links in single social networks, but also "jump" across multiple social networks with the help of the physical world friendships (diffusion path in the left part of Fig. 2(a)). Moreover, one user may share the same information to more than one social networks (diffusion path in the left part of Fig. 2(a)).
- •
Social vectors are heterogeneous. One user can possess multiple social accounts, and friends in the physical world may not have social links in SNS-based networks. Furthermore, different SNS-based networks have various communication ways. For example, Twitter users can browse all the public information, while WhatsApp users can only access their friends.
Here we have to distinguish meanings of these words: ‘propagation,’ ‘transmission,’ ‘diffusion,’ and ‘dissemination.’ Propagation and transmission are usually used to describe information transmitted between two users, while diffusion and dissemination refer to the information spreading to other peoples. Therefore, we use propagation probability and transmission rate instead of diffusion probability or diffusion rate to denote the possibility that information is transmitted between two users.
2.1.2. Information Cascades
According to (Guille et al. 2013), all users who share the message constitute the cascade , and their motivation can be either their interests or peer influence. The cascades consists of many single cascade . It records the information contents as well as the user’s interactive behavior and time. As shown in the “Data Collection Processing” of Fig. 2(b), the user is the original poster of at time . Then users , , , and retweet the at time , , , and , respectively. Notable, the interval between two adjacent time ticks may be different.
2.1.3. Diffusion Modeling
For computation convenience, researchers usually regard users as pure nodes, and use “inactive/susceptible” and “active/infected” to distinguish whether a user receives the information. Symbols commonly used in this paper are listed in Table 1.
Given a social network as , with user-set , social link set , and edge weight set , information diffusion model aims at capturing information diffusion dynamics in social networks. For a specific message , only some of users adopt the message initially, denoted as seed users . As time elapses, the message spread out by seed users through social links randomly, and the model captures this process.
| Symbols | Definations |
|---|---|
| social network topology with the user set , the edge set , and the edge weight set | |
| cascade set | |
| a piece of cascade | |
| weight of cascade | |
| last time of observable cascade | |
| infection time of -th forwarding in the cascade | |
| the -th forwarding user in the cascade | |
| count of users at time | |
| count of susceptible (or inactive) users at time | |
| count of infected (or active) users at time | |
| total population of available users in social network at time | |
| susceptible (or inactive) user set at time | |
| infected (or active) user set at time | |
| count of newly infected (or activated) user at time | |
| newly infected (or activated) user set at time | |
| incoming neighbor set of user at time | |
| outcoming neighbor set of user at time | |
| neighbor set of user at time | |
| propagation probability or transmission rate of cascade from user to at time | |
| propagation probability or transmission from user to at time | |
| A | matrix of transmission rate at time |
| in-degree of the user at time | |
| out-degree of the user at time | |
| feature vector of user about the topic/message |
2.2. Research Methodology
As shown in Figure. 2(b), the process of information diffusion modeling is iterative, and it can be divided into five steps: Data Collection Processing, Diffusion Mechanism Analysis, Diffusion Modeling, Feature Extraction, and Model Evaluation. These five steps are described as follows:


2.2.1. Data Collection Processing
The first step of research is to obtain sufficient data. Social data can be processed into three categories: cascades, social topology, and user-related data. Cascades records the diffusion dynamics of mass social information. It is the ground truth of the diffusion process, and we can evaluate the model performance based on it. Social topology consists of users with their social relationships. Evidence shows that it affects the range and speed of information diffusion (Yang and Counts 2010a; Peng et al. 2020). Commonly, they are major elements in predicting the information diffusion process. User-related data includes user-profiles and their interactive social records. These data can be used to infer user preference. Combined with the information content, the user’s interest in the information can be calculated, and the range of candidate users can be further narrowed, thereby improving the prediction accuracy. With the development of Deep Learning and NLP technologies, as well as the growth of computing power and data resources, this type of data has great potential in diffusion modeling. Notably, these three types of data must be time-related, because the time factors in the data can reflect the dynamics of information dissemination.
Datasets can be categorized into either synthetic and real-world data. The synthetic data are generated by programs following social analysis principles (e.g., power-law (Mislove et al. 2007)). This type of data is mainly a variety of network topologies, such as Kronecker (Leskovec et al. 2010), Block Two-Level Erdos-Renyi (Seshadhri et al. 2012), and Uncorrelated Scale-Free Networks (Catanzaro et al. 2005). They are indispensable because researchers can control the complexity of the propagation scenarios (Pastor-Satorras et al. 2015). For example, topics can be set as irrelevant in synthetic networks in terms of topic-related diffusion models, which reduces the modeling difficulty. The real-world data are collected from social platforms (e.g., online social networks, email networks, academic collaboration networks). They contain more detailed information such as comments and user-related data, which provides rich contextual semantics for diffusion modeling. With the thriving of machine learning, this type of data has become the preferred one. Besides crawled by selves, these data also can be downloaded from dataset websites (Leskovec and Krevl 2014; Tang 2006; Vlado 2010). Comparison of real-world and synthetic data is shown in Fig. 3. Some synthetic data are similar to real data in terms of statistical laws.
2.2.2. Diffusion Mechanism Analysis
After collecting and processing data, the second step is to analyze the mechanism of diffusion processes, guiding the diffusion modeling and feature extraction. The mechanism can be analyzed from three aspects in accordance with the individual interaction scenario shown in the right part of the Fig. 2(a): social vector-scope, user (behavior)-scope, and information-scope. The social vector-scope analysis focuses on studying the impact of underlying network structure on information diffusion. First, users in different locations play divergent roles in the propagation process (Bakshy et al. 2012; Lou and Tang 2013; Yang et al. 2015). Second, different platforms may lead to various diffusion dynamics. For example, the same story spread faster on Digg, but spread more widely on Twitter, and the network of Digg is denser (Lerman and Ghosh 2010). Third, the research shows that social actions will promote the evolution of the social networks (Li et al. 2016; Susarla et al. 2012), and social network evolution does impact user’s social behaviors (Althoff et al. 2017). The user (behavior)-scope analysis concentrates on predicting the individual behavior (e.g. like, retweet, and follow) in terms of specific information. What decision the user will make, depends on the match of the user cognition and information semantics. Although the brain’s decision-making process is extremely complicated (Smith and Kosslyn 2008; Anderson 2007), it is definite that analyzing user decision-making processes can promote the accuracy of information diffusion modeling. The information-scope analysis is commonly carried out from two levels: statistical characteristics (e.g. the number of hashtags/pictures (Suh et al. 2010)) and semantics (e.g., topic distribution, sentiment, emotion. ) Generally, researchers usually analyze information content and user behavior together.
As shown in the right part of Fig. 2(a), the above three components affect the diffusion process and shape each other. First, users perceive the social information and others’ attitudes from social vectors (The “Receiving Information" and “Peer Influence” processes). Social vectors determine which information the user can receive, and whose the user can communicate. Second, they decide which kind of social action to take (The “Decision” process). Third, social actions can drive information propagation and social network evolution (The “Information Propagation” and “Network Evolution” processes). Generally, researchers should consider information, users, and network structures as a unification.
2.2.3. Diffusion Modeling
From the perspective of modeling techniques, researchers adopt time-series and data-driven approaches. In the early stage of modeling researches, time-series approaches are meanstreams. Their modeling concepts are using explicit mathematical expressions to model the dynamics of information diffusion over time. Fitting, simulation, and likelihood maximization are the three primary research directions. Fitting models attempt to fit the curve of the diffusion volume over time. Simulation ones try to imitate the information diffusion process based on social network topology. Compared with the above two methods, likelihood maximization ones construct a likelihood function based on the diffusion history and tries to infer the underlying diffusion networks. However, an inevitable defect of these time-series approaches is that the intrinsic diffusion dynamics are difficult to be expressed with formulas. Therefore, many researchers have shifted their focuses to data-driven approaches. Data-driven ones do not need to give specific expressions and use machine learning algorithms to get the prediction result automatically. More intrinsically, data-driven approaches show how to learn diffusion models, rather than give mathematical diffusion models explicitly. Researchers can manually extract diffusion features, or directly learn features from raw diffusion data in “end-to-end” approaches.
To align with various modeling requirements, the outputs of information diffusion models include three levels of granularity: volume, individual, and the propagation relationship between two individuals, as shown in Fig. 2(b) Volume models only capture changes in the diffusion volumes over time, and do not care about who is infected. Individual adoption models attempt to identify every infected user. Relationship inference models aim at inferring the information diffusion track among those infected users. The above three levels of granularity models will be discussed in Section 3.
2.2.4. Feature Extraction
The fourth critical step of the information diffusion research is to extract representative and comprehensive features from the collected data for the established model. Commonly used features can be divided into four categories: structural, temporal, content, and user-related. Researchers found that not all features play an equal role in diffusion prediction. Chen et al. (Cheng et al. 2014) verified that when structural features and temporal features are used in combination, the prediction accuracy can reach more than 70%. Besides, experiments performed in (Barbieri et al. 2013) show that the prediction accuracy of the topic-aware model is 28% higher than that of the topic-blind model. Some representative features are summarized in Appendix 8.
Structural: Network topology is the medium of information diffusion, which affects the trajectory and range of information diffusion. Existing structural features contain two types of categories: network structure, and cascade structure.
- •
Network structure features describe characteristics of social vectors (i.e., network topology), such as degree distribution (Hong et al. 2011), density (Ma et al. 2012), and the fraction of users forming triangles (Ma et al. 2013a).
- •
Cascade structure features refer to the characteristics of diffusion dynamics in social networks, involving retweet tree depth (Cheng et al. 2014), number of diffusion hops (Yang and Counts 2010b), retweet ratio (Tsur and Rappoport 2012), and so on.
Temporal: Temporal features indicate the speed of information diffusion in social networks. They are mainly composed of Sequential features and statistical features.
- •
Sequential features describe numerical changes of some indicators over time during the diffusion process. These indicators can be the number of reposts/comments/views (Yang and Counts 2010b; Cheng et al. 2014; Wu et al. 2018), time elapsed between the current and previous post (Hong et al. 2011; Cheng et al. 2014), and so on.
- •
Statistical features are secondary processing of sequential features, aiming to find some potential diffusion laws. Scholars usually analyze time-series features from macroscopic perspectives, such as the similarity between two time-series (Ahmed et al. 2013), the shape of time series (Kong et al. 2014; Figueiredo et al. 2016), and so on.
Content: Information content can naturally affect the information diffusion process. At present, scholars extract content features from both statistical and semantic aspects.
- •
Statistical features mainly related to message forms, such as the number of hashtags/URLs (Suh et al. 2010), language (Cheng et al. 2014), and terms frequency (Naveed et al. 2011).
- •
Semantic features refer to the deep semantics of a message, including topics (Hong et al. 2011), sentiment (Ferrara and Yang 2015), emotions (Pfitzner et al. 2012), self-disclosure (Yuan et al. 2016), and so on. Most of these features need to be extracted using Natural Language Processing (NLP) and multi-modal techniques.
User-related: Currently, user-related features are mainly composed of two parts: static features and dynamic features.
- •
Static features also can be called user profiles, mainly refer to user’s inherent attributes, such as age, gender, country, and education background.
- •
Dynamic features are mainly extracted from user interaction history, including preference (Zhang et al. 2013), participation engagement (Suh et al. 2010), and the probability of his tweet to be retweeted (Hong et al. 2011).
2.2.5. Model Evaluation
As shown in Fig. 2(b), the diffusion model is either regression or classification model. Commonly used evaluation indicators are also applicable here. Due to space limitations, we will not describe it in detail here.
3. Taxonomy of Elementary Diffusion Techniques
In this section, we thoroughly review techniques for information diffusion modeling and discuss their pros and cons. The existing diffusion models are essentially classified into three categories: diffusion volume models, individual adoption models, and relationship inference models. Diffusion volume models aim at predicting the overall diffusion volume, ignoring whether a specific user will receive the message. Individual adoption models attempt to identify future active users. Relationship inference models hope to clarify the propagation relationship between two active users. These three types of models can be established via time-series and data-driven approaches. The taxonomy is shown in Fig. 4.

3.1. Diffusion Volume Models
Existing diffusion volume models fall into three categories: difference/differential-based, stochastic-process-based, and ML-based models. These three types of models will be discussed as follows.
3.1.1. Difference/differential-based Models
These models are the earliest diffusion models borrowed from Epidemics (Pastor-Satorras et al. 2015). They divide the population into several compartments (or classes, status) such as S (Susceptible), I (Infected), R (Recovered), according to the different user statuses in the diffusion process. Next, difference or differential equations are used to describe the evolution of user proportions among each compartment.
Assumptions: Difference/differential-based models are premised on that the total population is known, and each user connects with others effectively at each time unit.
Methods: The universal idea is to divide users into different compartments, and then build difference/differential equation models based on the user’s social connectivities to describe the evolution of each compartment. Common transition rules of compartments include Susceptible-Infected, Susceptible - Infected - Susceptible (Newman 2003), Susceptible - Infected - Recovered (Newman 2003), Susceptible-Exposed-Infected-Recovered (Li and Muldowney 1995), and Susceptible-Exposed-Infected-Removed (Huo and Ma 2017), etc. There are corresponding transition probabilities between different compartments. For example, SIR can be sketched in Algorithm. 1. All users are divided into different groups according to their social connectivities (e.g., node degree (Pastor-Satorras and Vespignani 2001; Boguá et al. 2003), friendship hops (Wang et al. 2012b), and connectivity (Xu et al. 2015)). and are infectious rate and recovery rate of -th group, respectively. denotes the probability that any given edge is connected to an infected user in -th group. Generally, the form of is related to the network topology, such as degree distribution (Pastor-Satorras and Vespignani 2001; Boguá et al. 2003; Xu et al. 2015), and distribution of friendship hops (Wang et al. 2012b).
Classical Epidemic models assume that all users are homogeneous. Therefore, the transition probability of any user in the same transition schema (i.e., the source compartment and target compartment are the same respectively) is identical. For example, as the elementary Epidemic model, SIR (Newman 2003), the number of newly infected people at time , , equals the infection rate multiply the number of connections among susceptible and infected users. In other words, they are special cases of universal difference/differential-based models, where and is the proportion/number of infected users.
Besides these elementary difference/differential expressions, researchers develop many extended models, as shown in Table 2. Yang et al. (Yang et al. 2017) considered a generalized infection probability in a multi-virus competing scenario because linear infection rates may cause the diffusion volume overestimation. Matsubara et al. (Matsubara et al. 2012) introduces dynamic infection rate and periodicity to describe the six types of “rise and fall” patterns in social networks (Yang and Leskovec 2011). They employed the Sine function to model the periodicity. Stai et al. (Stai et al. 2018) introduced external exposure which makes susceptible users become infected from other platforms (e.g., TV news), accelerating information diffusion process.
Notably, user payoffs models divide users into different groups according to their social strategies. They assume user social strategies are determined by payoffs (e.g., how many fans will be attracted if they forward the message?). The payoff can be computed based on the payoff matrix associated with social links. And then, game theory can be employed to model interactions among different groups. Jiang et al. (Jiang et al. 2014b; Jiang et al. 2014a) believed that the payoff matrix is symmetrical because they held the view that if a user adopting a forwarding strategy meets a user who takes a non-forwarding strategy, each of them will get the same payoff. Also, they modeled the information diffusion process using the evolutionary game-theoretic framework. Users with new information are regarded as mutants, and the diffusion process can be considered as mutant dissemination in the network. Thus the model can predict the final stable state of the network. Cao et al. (Cao et al. 2016) classified user neighbors into two categories: known types, and unknown types. For neighbor users and , if does not know , payoff matrices of have nothing to do with , and vice versa.
|
|
|
| ||||||||
|---|---|---|---|---|---|---|---|---|---|---|---|
|
|
|
| ||||||||
|
|
|
| ||||||||
|
|
|
| ||||||||
|
|
|
|
Pros and Cons: Difference/differential-based models are straightforward, efficient, extendable, and conforming to some real-world physic laws (Pastor-Satorras et al. 2015). They first define the user state transition pattern in diffusion modeling. Especially, since they do not involve specific individuals, they perform well in macroscopic diffusion modeling. For example, PDE (Wang et al. 2012b) reflects that the density of infected users decreases as the friendship distance increase. SpikeM (Matsubara et al. 2012) captures the power-law fall pattern and periodicities, and avoids the divergence to infinity. On the one hand, this abbreviation reduces the modeling complexity and makes these models indispensable. Taking SIS as an example, the epidemic threshold of homogeneous networks is the inverse of the average node degree (Diekmann and Heesterbeek 2000), while the threshold is absent in Scale-Free networks (Pastor-Satorras and Vespignani 2001). On the other hand, they do not consider the heterogeneity of user activity (Iribarren and Moro 2009), which makes them difficult to use for individual-level tasks. In addition, Iribarren et al. (Iribarren and Moro 2009) considered that oversimplified models can not accurately model the information diffusion process because they are difficult to reflect user heterogeneity.
3.1.2. Stochastic-process-based Models
Compared with difference/differential-based models, stochastic-process-based ones estimate the diffusion contribution made by each reshare event or each user.
Assumptions: These models assume that the intensity of social events (e.g., message arrival, or user posting/resharing message) occurring at each time can be characterized by stochastic processes. Suppose there are events that occurred as of time (i.e., there are users reshare the item). The intensity is the conditional probability that an event occurs in the time interval on the condition that it does not happen until time . Moreover, the diffusion volume can be calculated by integrating the intensity at each time . Let the random variable, , denote the waiting time until an expected event occurs. The intensity can be expressed as Eq. 1 based on Survival analysis (Kleinbaum and Klein 2010).
| (1) |
|
|
|
|
| |||||||
|---|---|---|---|---|---|---|---|---|---|---|---|
| Decay |
|
|
|
: bounded term of minimum time difference : model parameters : CDF of the Normal distribution | |||||||
|
|
|
|||||||||
|
|
|
|||||||||
|
|
|
|||||||||
|
|
|
|||||||||
| Exciting |
|
|
|
: -th retweet events : decay function : branch factor (i.e., triggering strength of each forwarding) :model parameter. If , it is Linear exciting function. | |||||||
|
|
|
|||||||||
|
|
|
|
| |||||||
| External Influence |
|
|
|
: strength of periodicity : phase of periodicity : phase shift of periodicity :impulse function :number of observable external influence | |||||||
|
|
|
Methods: Every model can be decomposed into three parts: basic intensity, decay, and exciting. The basic intensity indicates the most basic diffusion intensity, which can be implicitly represented as a part of the model. It can reflect some diffusion phenomena, such as intrinsic infectiousness, periodicity, and external influence. The decay function indicates that the item’s influence decrease with time. It can also be understood as human reaction time (Zhao et al. 2015). The exciting function enables each previous forwarding to have a continuous impact on the following interactive behaviors, shedding light on the “richer-and-richer” phenomena (Crane and Sornette 2008). We summarized the motivations of these models and organized them into Table 3.
For decay functions, the power-law model is often used to indicate the long-tails in social networks (Gomez-Rodriguez et al. 2011). Other models will perform better in some datasets, such as Exponential in microblog (Bao et al. 2015; Bao 2016), Log-Normal in citation network (Shen et al. 2014), and Rayleigh in epidemiology (Wallinga and Teunis 2004). Especially, Yu et al. (Yu et al. 2015) found that the Weibull distribution can preserve the minor and early-stage dominance better.
Commonly used exciting mechanisms are Poisson and Hawkes, as shown in Eq. 2 and 3, respectively. The exciting component of Hawkes-based models implicitly represented by .
| (2) |
| (3) |
For Poisson-process-based models, Shen et al. (Shen et al. 2014) assumed that the excitement of each event is identical, and adopted the number of attentions the message received as the Linear exciting function. Gao et al. (Gao et al. 2015) applied exponential to capture the decay effective of previous retweet. However, these methods stay at the level of activation index, instead of involving specific activation time. Hawkes-based models provide the self-exciting mechanism, and the triggering strength can be calculated based on the activation time interval. SEHP (Self-Excited Hawkes Process) (Bao et al. 2015) uses the exponential expression to compute the base intensity and decay effects. Moreover, ISEHP (Influence-based Self-Excited Hawkes Process) (Bao 2016) incorporates the periodicity using sin function. Zhao et al. (Zhao et al. 2015) models the time-varying infectiousness and the arriving time of each post are modeled by two Hawkes processes, respectively. It is able to identify at each time point whether the cascade will be "explosive" or "tractable" according to whether its infectiousness is above or below a critical threshold. Kobayashi et al. (Kobayashi and Lambiotte 2016) thought that the final cascade size can be achieved by integrating the future retweet rate which is calculated based on the average number of followers and the infectious rate. Mishra et al. (Mishra et al. 2016) used a predictive layer on top of the MHP (marked Hawkes process) to make predictions with the combination of user social influence, social memory, and tweet quality. Marian et al. (Rizoiu et al. 2017) introduced the external influence modeled by impulse function, which allows their model to fit complex situations. They also proved that the intensity is identical to the infection probability after marginalizing out recovery events, and they proposed the HawksN model with finite population (Kong 2019).
Generally, the modeling process of stochastic-process-based models is roughly divided into the following basic steps, as shown in Algorithm 2. First, model the distribution of influence decay with reference to decay functions. Second, devise the intensity based on Survival theory and . In this step, we can add some other features to the model. Third, estimate model parameters via optimization methods such as E-M (Expectation-Maximization). Fourth, compute the influence of each social event by integrating the intensity from start to end. Last, the final diffusion volume can be calculated with the function . (The last step is optional according to model requirements.)
Pros and Cons: Stochastic-process-based models are straightforward and exhibit some natural diffusion phenomenons. These models show multiple decay effects which describe that the influence of one information decreases over time, including Power-Law (Gao et al. 2015; Mishra et al. 2016; Zhao et al. 2015), Exponential (Bao et al. 2015; Bao 2016), Log-Normal (Shen et al. 2014), and Oscillation (Kobayashi and Lambiotte 2016). Furthermore, exciting functions reflect that past events will promote the event occurring in the future. The introduction of time factors makes model performance improve around 30% (Kobayashi and Lambiotte 2016). Moreover, whether the content will be popular is related to exogenous sensitivity, and endogenous response (Crane and Sornette 2008; Rizoiu et al. 2017).
Notably, if the intensity involves every specific user, the next infected user can be predicted with the help of likelihood maximization inference (Iwata et al. 2013). Nevertheless, there are few such models, so that we will not be separately discussed. Besides, these models require sophisticated parameter estimation. Although complex parameter estimation is needed, the time complexity of most models is still close to linear (Zhao et al. 2015; Yu et al. 2015).
|
|
|
| ||||||||||||
|---|---|---|---|---|---|---|---|---|---|---|---|---|---|---|---|
|
|
|
KAIS 2018 (Gou et al. 2018) | ||||||||||||
| Content & User-related |
|
|
WWW 2018 (Zhang et al. 2018) | ||||||||||||
|
|
DASFAA 2018 (Wang et al. 2018) | |||||||||||||
| Structural & Temporal |
|
|
WWW 2018 (Li et al. 2017a) | ||||||||||||
|
|
CIKM 2017 (Cao et al. 2017) | |||||||||||||
|
|
ICDE 2019 (Chen et al. 2019b) | |||||||||||||
|
|
INFOCOM 2020 (Zhou et al. 2020) | |||||||||||||
| Temporal & Content |
|
|
IJCAI 2017 (Wu et al. 2017) | ||||||||||||
|
|
AAAI 2019 (Liao et al. 2019) |
3.1.3. ML-based (Volume) Models
Compared with the first two categories that mainly adopt time-series approaches, data-driven models use learning algorithms to model the diffusion process without any preset model expression. They take a series of features possibly relevant to the diffusion process (see details in Section 2.2.4) as input and output the popularity prediction.
Assumption: As far as we know, ML-based models relax almost all unrealistic assumptions in diffusion scenarios. However, their performance depends on whether the algorithm can effectively learn the propagation characteristics.
Methods: Data-driven models can be divided into two stages: feature-based and deep learning. Feature-based models mainly adopt native machine learning techniques, taking a series of elaborate hand-craft features as input and output cascade prediction results. These models include Generalized Linear Model (Suh et al. 2010), Linear Regression (Yang and Leskovec 2010), Support Vector Machine (Ma et al. 2013b), Decision Tree (Ma et al. 2012; Ma et al. 2013a), Random Forest (Alzahrani et al. 2015; Ding et al. 2018), Neural Networks (Ding et al. 2019), and so on. Some literature (Cui et al. 2013; Cheng et al. 2014; Gao et al. 2019) have shown that features affect prediction performance more than learning algorithms. They also found that temporal and structural features are critical predictors of cascade size. In addition, many researchers have considered features of early diffusion, especially some of the characteristics of the original reposters, which also have great help in the final popularity prediction. Furthermore, in the initial stage, it is diffusion breadth, rather than depth, that has a more significant on large cascades (Cheng et al. 2014).
With the vigorous development of deep learning, researchers have gradually turned to end-to-end models, which can automatically learn sophisticated diffusion features. Representative models are introduced in Table 4. Compared with feature-based models using native methods, deep learning models usually design new frameworks to utilize diffusion features better. The overall model framework is divided into four major steps: embedding data as vectors, using neural network models to learn diffusion features, aggregating features, and prediction. Generally, researchers adopt MLP (Multi Layer Perceptron) to predict diffusion volume. The key lies in the first three components of the framework.
For temporal features, RNN (Recurrent Neural Network)-type technologies can model temporal dependency. Gou et al. (Gou et al. 2018) converted the retweeting time series to different perspectives (e.g., Frequency, Slope) with the help of time windows, then applied LSTM (Hochreiter and Schmidhuber 1997) to learn sequential temporal features, and used Pooling mechanism to extract high-level sequential features.
For content and user-related features, publisher and multi-modal data can be unified representation via deep learning first, and then use the tensor operation technologies to learn correlation among these data. Zhang et al. (Zhang et al. 2018) utilized VGGNet (Simonyan and Zisserman 2015), LSTM (Hochreiter and Schmidhuber 1997), and matrix operation to obtain a unified representation of visual, textual, and personalized information. Then the hierarchical attention mechanism is adopted to learn the features and correlations of multi-modal information. Wang et al. (Wang et al. 2018) adopted the hierarchical attention mechanism to obtain the word-level representation of diffusion context (e.g., organizor, location), and then used tensor factorization to compute the joint influence of different components of diffusion context.
For structural and temporal features, researchers first embed the cascade graphs to learn structural features, and then utilize the RNN -like models to model sequential temporal features. Cheng et at. (Li et al. 2017a) sampled individual cascade graph by Random Walk, and utilized GRU (Hochreiter and Schmidhuber 1997) to encode variable-length diffusion sequences as hidden representations. Finally, the attention mechanism is used to fuse these hidden representations for prediction. Cao et al. (Cao et al. 2017) implemented the decay mechanism via sum pooling, and Islam et al. (Islam et al. 2018) utilized conditional intensity (Du et al. 2016) to predict user activation time. Chen et al. (Chen et al. 2019b) developed CasLaplacian (a variety of spectral GCN (Defferrard et al. 2016)) to embed cascade graphs, and utilized LSTM (Hochreiter and Schmidhuber 1997) to model the temporal dependency. Besides modeling structural and temporal dependency, Zhou et al. (Zhou et al. 2020) introduced VAE (Kingma and Welling 2014) to model the diffusion uncertainty.
For temporal and content features, researchers first embed multi-modal social content and use RNN-like technologies to model temporal features. Then the attention mechanism is used to fuse these representations. Wu et al. (Wu et al. 2017) employed ResNet (He et al. 2016b) and FNN (Feed-forward Neural Network) to generate unified representations of multi-modal social data. And then, they adopted LSTM (Hochreiter and Schmidhuber 1997) to model neighboring and periodic temporal context. Finally, a multiple time-scale temporal attention method is proposed to implement cascade prediction. In addition, Liao et al. (Liao et al. 2019) developed Attentive Convolution Neural Network (CNN) to capture the short-term fluctuation caused by external influence, and added a temporal decay factor to the loss function.
Pros and Cons: Compared with the above time-series models, data-driven ones focus on utilizing representative and comprehensive features rather than devising complex mathematical expressions. They enormously reduce the difficulty of diffusion mechanism analysis and diffusion modeling. In addition, they almost remove any preset assumptions, and they can get more than 95% accuracy in multiple scenarios (Liao et al. 2019; Chen et al. 2019a). Especially, since there are no input restrictions, data-driven methods can discover useful features easier than time-series ones. However, their defects are obvious. First, ML-based models require computational expensive feature engineering or learning representation. Second, their performance is highly dependent on the feature quality and quantity. Thus it is difficult to quantify the performance of these learning techniques with certainty. Third, existing works show that the prediction performance may be more sensitive as time goes on (Kong et al. 2014).
|
|
|
| ||||||||||||
|---|---|---|---|---|---|---|---|---|---|---|---|---|---|---|---|
| Time-series |
|
|
|
|
Rationality of hand-crafted stochastic model | ||||||||||
|
|
|
|
||||||||||||
| ML-based |
|
|
|
|
Features extracted from datasets | ||||||||||
|
|
|
|
||||||||||||
3.1.4. Analysis and Discussion
The summary of diffusion volume models is shown in Table 5. Difference/differential-based models are straightforward, and their calculation efficiency is extremely high. It is noteworthy that their design philosophies (e.g., node state classification, and state transition rules) are widely adopted by other diffusion models. Compared with difference/differential-based models, which rely on the mean-field assumption, stochastic-process-based ones model the intensity of diffusion event occurrence. In other words, they model the influence of each user’s forwarding on subsequent diffusion. Time-series models are interpretable, but it is challenging to devise appropriate mathematical expressions. ML-based approaches extract various features and use machine learning algorithms to predict the diffusion process. This characteristic allows them to mine more potential features. However, their predictive performance heavily depends on the quality of the extracted features, and whether their prediction performance is as stable as time-series models remain to be determined.
3.2. Individual Adoption Models
Individual-level models are essential because predicting the diffusion volume alone is not enough for specific user-involving scenarios such as viral marketing. They aim at predicting who will join the cascades, and all of them belong to classification task models.
3.2.1. Progressive Models
Similar to the SI model, progressive models divide all users into inactive and active groups. Active users will follow the rules specified by the model and infect their neighbors according to the social network topology.
Assumptions: Progressive models believe that messages are propagated through social links from active users to inactive users, and active users will never be inactive again.
Methods: Independent Cascade (IC) (Goldenberg et al. 2001) and Linear Threshold (LT) (Granovetter 1978) are two early and elementary progressive models. They all assume that the network topology is static and propagations only occur at discrete-time synchronously. In addition, the user who is activated at time only has one chance to infect all its neighbors at time . Algorithm 3 the sketch of the basic idea of IC/LT models. .
Model difference is mainly reflected by the activate function . In IC model, if the number of active neighbors of user at time is , the probability of user will be activated at time is
| (4) |
The user will be activated at time with the probability . In the LT model, propagation probability can be thought of as the influence weight. Every user is associated with a threshold . The user will be activated if the Eq. 5 is satisfied.
| (5) |
The IC/LT reflects some crucial characteristics of information diffusion. Typically, users and discuss the information only once, and the user may not agree with the user . If the user adopts , he may forward it to his neighbors. However, the two models neglect many indispensable factors, such as delay time, topic, and network topology evolution. For these deficiencies, there are a large number of extensions of those two models. We briefly summarize the extensions in Table 6 and discuss them in detail in the following context.
|
|
|
| |||||
|---|---|---|---|---|---|---|---|---|
|
|
|
Add delay parameters for each edge. Therefore, user activation is not restricted to consecutive steps | |||||
|
|
|
Define more ’detailed’ probabilities (i.e., reading probability, meeting probability) and modify the form of the activate function. | |||||
|
|
|
Introduce more user classes. Then add the number of users who have switched from other classes to infected, and minus the number of users who have switched from infected to others. | |||||
|
|
|
Assign topic distribution to each user and edge. Only topic-matched information can be propagated through the social link. | |||||
|
|
|
Make the network topology evolves with information diffusion. | |||||
|
|
|
Consider information spread across multiple platforms. |
Delay: Extensions for delay make propagations be no longer restricted to discrete consecutive time ticks. In addition, the user activated at time is modified to . AsIC (Aysnchronous Independent Cascades) and AsLT (Aysnchronous Linear Threshold) (Saito et al. 2011) add delay parameters to each edge . Compared with IC/LT, various delay parameters allow the user’s neighbors to be activated at different time . T-Basic (Time-Based Asynchronous Independent Cascades) (Guille and Hacid 2012) expands fixed delay parameters into time-dependent functions, which can describe the dynamics of diffusion processes more accurately.
Activation Pattern: Extensions of activation patterns aim at devising a more elaborate activation function. Kempe et al. (Kempe et al. 2005) proposed General Threshold (GT) Model which defines a general activation function for each user , instead of using an identical accumulative approach like the LT model. Chen et al. (Chen et al. 2012) introduced the “meet probability” to indicate the possibility of contact between two users. The user will become active with the joint probability of “meet probability” and the activation probability . The activate function is defined as
| (6) |
In addition, there are some other similar improvements (e.g., reading probabilities (Gruhl et al. 2004), message notification, and message-forgetting mechanisms (Wang et al. 2017b; Wang et al. 2017c)) can be seen as the refinement of Eq. 6. The target user will be activated when all these conditions are satisfied.
User Class: User class extensions introduce new user classes based on IC/LT models compatible in some specified scenarios. Such as rumor spreading, since some susceptible users may become anti-rumors after receiving a rumor. Serrano et al. (Serrano et al. 2015) proposed a rumor spreading model and they defined four types of users: neutral (initial state, inactive), infected (believe the rumor, active), vaccinated (believe the anti-rumor before being infected), and cured (believe the anti-rumor after being infected). It assumes that neutral users may become vaccinated with probability , and vaccinated users attempt to cure or vaccinate their neighbors with probability . Jiang et al. (Jiang et al. 2016b) assumed that every susceptible user (S) can be infected (I) by their neighbors with probability , and then be recovered (R) with probability . To more precisely describe user states in rumor spreading, they introduced two sub-state of infected users: ‘contagious’ (Con) and ‘misled’ (Mis). An infected user first becomes contagious and then transits to be misled the next time . This mechanism can reflect the sequence of user infection during the rumor spreading, which is essential for source identification. Therefore, at time tick , the actual number of newly infected users should not include those who switched from infected into other states.
Semantic: Existing semantic extensions primarily consider the impact of topics on the diffusion process. For different topics, the main idea of these models (He et al. 2012; Barbieri et al. 2013; Lu et al. 2015; Li et al. 2017c; Li and Liu 2019) is to assign topic distributions to each user and topic-related propagation probability to each edge. For example, Zhu et al. (Zhu et al. 2016a) assumed that every user adopts each piece of the information with equal probability. He et al. (He et al. 2012) thought that every user has three states, , , and , with two independent threshold, positive and negative threshold . Each edge has two weights, positive and negative weight . For every inactive user , two types of influence are accumulated separately. If is satisfied, the user will switch to , otherwise will switch to . Com-IC (Lu et al. 2015) introduces the reconsideration mechanism in which one user may adopt the opinion if he has adopted the complementary opinion . Li et al. (Li et al. 2017c) utilized the payoff matrices to calculate user’s payoffs, thereby deciding social choice for each piece of information. It should be noted that although these studies focus on the diffusion of multiple pieces of information, the majority of them stipulate that the user will not adopt the opposite information after they have been activated.
Dynamic Topology: It has been confirmed that information diffusion will promote network evolution (Li et al. 2016). Dynamic topology extensions change propagation probability between user-pair from (fixed) to (time-varying). Decreasing Cascades (DC) (Kempe et al. 2005) thinks that the probability between users and diminish as their active neighbor number increases. Zarezade et al. (Zarezade et al. 2017) used Hawkes process to model users’ behavior adoption intensity (probability). The defines the intensity of action taken by the user at time , and it can be expressed as . The represents the intensity of the action taken by the user at time , and represents the intensity that the user takes the action on the premise of time . DynaDiffuse (Xie et al. 2015) models the dynamic characteristics in an ingenious way. If a new connection appears, it assigns a small positive value to the newly created link. When the edge rate exceeds this positive value, the edge (re)emerges, and conversely, the edge disappears. When all edges of a user disappear, the user can be considered as removed. In recent years, scholars introduced user interaction in network evolution. Co-Evolve (Farajtabar et al. 2015) considers two types of events: tweet/retweet events, , and link creation events, as triplets:
The triplet indicates that the event when the source user propagates a message to the target user or establishes a friendship link with the target user at time . Next, researchers designed a multivariate Hawkes process to capture the intensity of user boosted by a previous diffusion process, and modeled the link creation using the survival process. After that, they coupled the intensity of link creation with retweeting events.
Multi-channels: Multi-channels extensions attempt to study information diffusion in multiple social platforms. Because the “closed-world” restriction is far from reality as users can receive information from various channels such as TV and telephone. Myers et al. (Myers et al. 2012) thought that the arrival time of external exposures for each user follows a binomial distribution. Finally, the user activation probability is multiplied by the probability of the user is activated by internal and external influences. Muse (Multi-source Multi-channel Multi-topic diffUsion SElection) model (Zhang et al. 2016b) studies the information diffusion across online Enterprise Social Networks (ESN) and offline organizational structure. Information propagates through online, offline, and hybrid (online and offline) diffusion channels among employees. Different diffusion channels will be weighted based on their importance learned from the social activity log data with optimization techniques. The user will become activated if the intensity he receives from these three channels meets the activation threshold. Sahneh et al. (Sahneh et al. 2013) embeds the diffusion process in multi-layer networks where all networks have the same users but different edges. Moreover, they applied the GEMF (Generalized Epidemic Mean-Field) approximation to reduce the state space. Generally, Muse (Zhang et al. 2016b) can be thought of as a particular LT model applied in multi-channels, because a user will become activated once the total threshold is exceeded. In comparison, Myers et al. (Myers et al. 2012), and GEMF (Sahneh et al. 2013) are the IC model applied in multi-channels, as a user will be activated as long as he is activated at any layer.
Pros and Cons: Progressive models are intuitive to expand. They only need to know the network topology to predict the information diffusion process. Furthermore, their monotonicity and submodularity (Kempe et al. 2003) make them widely used in some downstream application tasks, such as influence maximization and source identification. However, limitations of progressive models are apparent. First, their computational efficiency is very low. Despite progressive models omit many details of diffusion, such as the interaction of multiple pieces of information, the IM problem based on progressive models is NP-hard (Kempe et al. 2003). Second, their performance is highly dependent on the completeness and accuracy of network topology, which is almost impossible to be satisfied in the real world. Finally, the predictive performance of these models depends on the description of user interaction behavior. For example, Correlated Cascades (Zarezade et al. 2017) achieved significant performance improvements on multiple datasets by considering the interaction between users and the propagation process. Myers et al. (Myers et al. 2012) found that found that external links activated at least 29% of users by analyzing the URLs forwarded by users. As more social behavior characteristics are discovered, it means that such models have enormous space for improvement.
3.2.2. Non-progressive Models
Progressive models assume that the user remains active after being activated without regret. However, in the real world, people may change their minds after communicating with friends. Therefore, non-progressive models introduce the re-adoption mechanism, and they are similar to SIS models.
Assumptions: Compared with above progressive models, in non-progressive models, a user can be activated again by another piece of information after he was activated by the .
Methods: Algorithm 4 is the basic idea of non-progressive models. Supposing there are topics, the probability that user adopts topic at time is determined by the user’s payoff:
The payoff refers to the attention, retweeting, reputation, and other things that the user expects to get after re-sharing/rejecting the message.
Voter model (Clifford and Sudbury 1973) is an early typical non-progressive model in which the proportion of neighbors’ opinions determines the user’s payoff. In other words, the user randomly selects one of his neighbor to communicate and turns his point of view into that of the user ’s. Li et al. (Li et al. 2015a) divided user neighbors into positive and negative ones (e.g., enemy, foe). Therefore, at each step, users are more inclined to adopt the opinions of the majority of users. The authors proved that under different network structures, the steady-state (opinion) of distribution is different. Kimura et al. (Kimura et al. 2012) introduced temporal decay into voter models. Specifically, when computing the probability that the user chooses the -th opinion at time , it is necessary to consider the influence of all opinions of the neighbor adopting within a certain time window. And the influence can be modeled via decay functions (e.g., power-law, exponential). In fact, game theory can also be used to calculate user payoffs (Jiang et al. 2014b; Jiang et al. 2014a). However, due to its high complexity, researchers usually assume that a group of users use the same revenue matrix.
Friedkin and Johnsen (F-J) (Friedkin and Johnsen 1999) considered user stubbornness (or self-persistence) into opinion dynamics. Initially, each user is assigned with a opinion . During each round of social interaction, the user may update the opinion from neighbors with probability , or stick to the original opinion with probability . Ghaderi et al. (Ghaderi and Srikant 2014) expressed the user’s opinion as a value between 0 and 1. And they derived that the convergence bound depends on the network structure, the location of stubborn users, and their stubbornness. Tian et al. (Tian and Wang 2018) believed that path-dependent (i.e., repeatedly arising or interdependent) topic might achieve consensus, and the opinion evolution will enhance the network connectivity.
Most of the above models assume that an individual user will only hold a single opinion simultaneously. However, in the real world, vast opinions or topics are not black and white, such as the centrist phenomenon (Rusinowska and Taalaibekova 2019). Researchers considered that users could hold multiple opinions simultaneously to improve model generality. Generally, these opinions have different strengths and satisfy a particular distribution. For example, Nayak et al. (Nayak et al. 2019) utilized the Dirichlet distribution to describe opinion distributions of users, and the Bayesian method was employed to update the opinion distribution after receiving new messages.
|
|
|
| ||||||||||
|---|---|---|---|---|---|---|---|---|---|---|---|---|---|
|
|
|
| ||||||||||
|
|
|
| ||||||||||
|
|
|
| ||||||||||
|
|
|
| ||||||||||
|
|
|
|
Pros and Cons: Compared with progressive models, non-progressive ones introduce the “re-adoption” mechanism, making them more suitable for modeling multiple pieces of information diffusion scenarios. The authenticity is enhanced. However, these models do usually take more time to reach convergence than those progressive ones. Further, due to the introduction of the “re-adoption” mechanism, non-progressive models do not have monotonicity and submodularity, which means that the infected user set’s influence may diminish as its size increases. Roughly, voter models reflect the fact that the majority population influences the user’s opinion, and to some extent, demonstrates the process of user opinion evolution (Sichani and Jalili 2017). In the short term, the signed social vectors will increase the spreading speed by 20% to 40% (Li et al. 2015a). Unlike influence maximization, if the initial infected users are randomly selected, the volume of infection will become smaller as the opinions evolve (Nayak et al. 2019). Non-progressive models are essential to the research of opinion evolution, and have broad prospects.
|
|
|
| |||||||||||
|---|---|---|---|---|---|---|---|---|---|---|---|---|---|---|
|
|
|
CIKM 2016 (Zhang et al. 2016a) | |||||||||||
| Structural & Temporal |
|
|
ICDM 2017 (Wang et al. 2017d) | |||||||||||
|
|
ICDM 2018 (Islam et al. 2018) | ||||||||||||
|
|
KDD 2018 (Qiu et al. 2018) | ||||||||||||
|
|
SIGIR 2019 (Chen et al. 2019a) | ||||||||||||
|
|
IJCAI 2019 (Yang et al. 2019) | ||||||||||||
|
|
WSDM 2020 (Cao et al. 2020) | ||||||||||||
|
|
TKDE 2021 (Yang et al. 2021) | ||||||||||||
|
|
|
WWW 2020 (Xie et al. 2020) | |||||||||||
|
|
|
SIGIR 2019 (Wu et al. 2019) | |||||||||||
|
|
WSDM 2020 (Sankar et al. 2020) |
3.2.3. ML-based (Individual) Models
Compared with ML-based models introduced in Section 3.1.3, models in this section aim at predicting which user will be infected.
Assumption: Similar to models in Section 3.1.3, ML-based (individual) ones relax almost all unrealistic assumptions. Nevertheless, their performance depends on whether the algorithm can effectively learn the propagation characteristics.
Methods: Generally, modeling techniques can be roughly divided into two groups: feature-based and deep learning. For feature-based models, besides the native machine learning algorithms introduced in Section 3.1.3, the collaborative filtering techniques in the recommendation system can also be used to predict individual adoption, such as matrix factorization (Ma et al. 2008; Ma et al. 2011; Jiang et al. 2012; Jiang et al. 2015; Cui et al. 2011), tensor decomposition (Jiang et al. 2014c; Hoang et al. 2017; Hoang and Lim 2016), and transfer learning (Jiang et al. 2016a). In essence, these models try to find out the retweet matrix based on user matrix and message matrix where
Tensor , , and are learned from historical interaction records.
Similar to deep learning (volume) models in Section 3.1.3, the framework of deep learning (individual) ones consists of four major components: embedding data as vectors, using neural network models to learn diffusion features, aggregating features, and prediction, Generally, the differences between these two types of models are summarized as follows. First, volume models use MLP to predict the diffusion volume , while individual ones mostly use the Softmax classifier to get the activation probability of each user . Second, these models must be able to learn individual-level features, while volume ones do not need to meet this requirement. Even if user-related features are required, only the content publishers are needed (Zhang et al. 2018; Wang et al. 2018).
For content and user-related features, Zhang et al. (Zhang et al. 2016a) integrated attention mechanism and CNN to learn relationships among user interests and content, and utilized the similarity matrix to infer future forwarding users. Xie et al. (Xie et al. 2020) employed MLP as VAE (Variational Auto Encoder) (Wu and Goodman 2018) to generate the hidden representations of multi-modal information, and taken cascade sequence and social information hidden representations as input into LSTM (Hochreiter and Schmidhuber 1997) to predict the future active users. Wu et al. (Wu et al. 2019) devised a layer-wise model to track user latent embeddings evolving as the social diffusion process continues, and predicted user adoption probability with the fusion of users and items features. Sankar et al. (Sankar et al. 2020) modeled users’ social homophily and temporal features by VAE and Positional Encoding (Vaswani et al. 2017), respectively. And then, they developed a co-attentive fusion mechanism to fuse the above two types of features.
For structural and temporal features, roadmaps can be roughly classified as follows: NodeEmbedding+RNN, GNN+RNN, NodeEmbedding+GNN, and others. For NodeEmbedding+RNN models, they aim to make forwarding prediction directly through the encoding and decoding of the cascade graph through the Encoder-Decoder architecture. Wang et al. (Wang et al. 2017d) proposed Topo-LSTM, which takes node embedding and cascade graphs as input to learn cascade structural and temporal features. GNN+RNN models extract the structural features of cascade graph or network topology through the GNN model, and then learn the sequential features through the RNN model. Chen et al. (Chen et al. 2019a) embedded cascade graph (structural) and user-level sequential (temporal) features via GAT (Graph Attention Networks) (Velickovic et al. 2018) and Bi-directional LSTM, respectively. The shared-gate mechanism is developed to fuse user importance, cascade-level, and user-level features. Yang et al. (Yang et al. 2019) introduced reinforcement learning, guiding individual prediction through the macro volume prediction. For NodeEmbedding+GNN models, they predict future forwarding through user relevance. Qiu et al. (Qiu et al. 2018) modeled the strengths of neighbor relationships via social influence locality (Zhang et al. 2013). After that, GCN (Kipf and Welling 2017) and GAT (Velickovic et al. 2018) are employed to learn network structural features for user relevance extraction. In this article, temporal features are implicitly encoded in the social influence locality. Cao et al. (Cao et al. 2020) devised StateGNN and InfluenceGNN to model user states and activation influence, respectively. In this way, through the graph neural network propagation and aggregation mechanism, the interplay of the two graphs is realized to "simulate" the information propagation, and temporal features can be captured through iterative interaction. Besides, Yang et al. (Yang et al. 2021) utilized the attention mechanism (Vaswani et al. 2017) to learn user activation relationships, coupling the CNN to capture the decay effect of active users.
Pros and Cons: Similar to the advantages and disadvantages of volume ML-based models, individual ML-based ones do not need to design complex mathematical expressions, while they require computational expensive feature engineering or learning representation to extract features. Compared with the volume models, the individual model needs more fine-grained features. Taking user-related features as an example, volume models only need publisher features (Wang et al. 2018; Zhang et al. 2018), while individual models require features of all potential retweet users. Besides, their model performance is highly dependent on the quality and quantity of features. The model’s prediction performance with whole-structure (friendship networks and cascade structure) input (Qiu et al. 2018; Yang et al. 2019) is an order of magnitude higher than that of the model with partial structure (cascade structure) input (Sankar et al. 2020; Yang et al. 2021).
|
|
|
| ||||||||
|---|---|---|---|---|---|---|---|---|---|---|---|
| Time-series |
|
|
|
|
Model rationality & Network topology | ||||||
|
|
|
|
||||||||
| ML-based |
|
|
|
|
| ||||||
3.2.4. Analysis and Discussion
The summary of individual adoption models is shown in Table 9. There are four main characteristics of progressive and non-progressive models. First, both rely on social topology as they all assume that information is spreading on social networks via social links. Second, progressive models assume infected users remain stable once they were infected without any regrets. On the contrary, any user may shift his grounds multiple times based on his payoffs in non-progressive models. Third, in each activation iteration of progressive models, only those inactive can be selected as a newly active user, whereas every user should be considered under non-progressive models. Finally, non-progressive models’ monotonicity and submodularity are broken because of their re-adoption mechanism. Although the time complexity of non-progressive models is higher, they are more in line with real-world diffusion scenarios, capturing opinion evolution dynamics.
In terms of ML-based models, their advantages and disadvantages are similar to those illustrated in Section 3.1.
3.3. Relationship Inference Models
Generally, researchers can infer the user-to-user propagation relationship by likelihood maximization (Time-series) and diffusion embedding approaches (Data-driven). Representative works are introduced as follows.
3.3.1. Likelihood Maximization Models
These models devise likelihood functions to infer propagation relationships among users based on their interaction history of cascades.
|
|
|
| |||||||||
|---|---|---|---|---|---|---|---|---|---|---|---|---|
|
|
|
| |||||||||
|
|
|
|
Assumptions: To simplify the inference problem, researchers make two basic assumptions: 1) a user gets infected only once, 2) all the infections are conditionally independent.
Methods: As shown in Table 10, these models craft likelihood functions based on the observable cascades via discrete-time and continuous-time approaches, and maximize the likelihood function to infer the underlying diffusion relationships.
NetInf (Gomez-Rodriguez et al. 2012) and MultiTree (Gomez-Rodriguez and Schölkopf 2012) adopt discrete-time approaches to infer the propagation relationship through submodular optimization. They both build a retweet tree for every cascade, and then select -edges network based on these trees. The probability of observing cascade propagating in a particular tree structure can be written as:
| (7) |
The propagation probability can be computed by three well-known models: Exponential, Power-law, and Rayleigh, with the time difference between user infection time as parameters. After building retweet trees for each cascade, NetInf will find one most likely retweet tree and select optimal edges from the tree as the diffusion network. However, if the number of observable cascades is small, we may not find the appropriate retweet tree. Therefore, MultiTree selects optimal edges from all possible retweet trees. Xu et al. (Xu and Smith 2018) regards network structure as a simple log-linear, edge-factored directed spanning tree. After that, an unsupervised, contrastive training procedure is utilized to infer the network structure. Han et al. (Han et al. 2020) devised a mutual-information-based score criterion to find the propagation relationships, inferring the most probable diffusion network.
CONNIE (Convex Network Inference) (Myers and Leskovec 2010) and NetRate (Gomez-Rodriguez et al. 2011) adopt continuous-time approaches, and convert the network inference problem to convex optimization problem. They all build a two-part likelihood function based on cascade records with the help of Survival theory. To expose the complicated concepts, we summarize the skeleton of continuous-time relationship inference models in Algorithm 5. First, for every infected user who was infected at time , they compute the probability that at least one previously infected user has infected him. Second, they compute the probability that none of the infected users activated him for every uninfected user. After that, network structure matrix A can be inferred by maximizing the likelihood function. NetRate utilizes survival theory to build the likelihood function and only considers infected users. As a result, NetRate models diffusion as a spatially discrete network of continuous, conditionally independent temporal processes.
Compared with NetInf and MultiTree, CONNIE and NetRate can infer the link strength in addition to the existence of link. However, the above four models can merely infer static network structures, and only the time factors are considered. Corresponding to the above problems, there are some improvement solutions based on NetRate, including InfoPath (Gomez Rodriguez et al. 2013), MoNet (Wang et al. 2012a), MMRate (Wang et al. 2014). InfoPath makes transmission rate varying over time, and introduces cascades weights based on the time interval to adjust by the cascade influences. These improvements make InfoPath support dynamic network inference problems. MoNet integrates the additional features associated with each user into NetRate. For feature , if users , , join the cascade at time , and , and , then the Eq. 8 is satisfied.
| (8) |
MMRate (Wang et al. 2014) focuses on the information diffusion in multi-aspects(e.g., topics). User links have different strengths under different topics due to the variety of users’ interests (Tang et al. 2012). Hence, the transmission rate and network topology should be different under different topics.
Pros and Cons: MultiTree (Gomez-Rodriguez and Schölkopf 2012) and NetInf (Gomez-Rodriguez et al. 2012) only care about the existence of the propagation relationship, and the edge number is determined by experience. Compared with them, CONNIE (Myers and Leskovec 2010) and NetRate (Gomez-Rodriguez et al. 2011) infer the existence and strength of link. Specifically, they do not need to set the number of edges. If is satisfied, it implies that there is no propagation relationship between user and . But in terms of running time, MultiTree and NetInf are almost orders of magnitude faster than NetRate and CONNIE (Gomez-Rodriguez and Schölkopf 2012). Subsequently, the stochastic-gradient optimization speeds up almost 10-100 times of continuous-time approaches (Gomez Rodriguez et al. 2013). Besides, the introduction of individual characteristics will double the prediction performance (Wang et al. 2012a). Significantly, the greater the propagation probability between users, the higher the inference accuracy (Han et al. 2020). However, these models rely on assumptions of independent and sole activation. Whether these assumptions are reasonable still needs to be verified.
3.3.2. Diffusion Embedding Models
The design philosophy of diffusion embedding models is to map the users and the observable information diffusion records into a unified and continuous semantic space. After that, space geometry knowledge is applicable to infer propagation relationships.
Assumptions: Similar to the above ML-based models, diffusion embedding ones relax almost all unrealistic assumptions. Furthermore, their performance heavily depends on the quality of data and feature representation.
|
|
|
| ||||||||
|---|---|---|---|---|---|---|---|---|---|---|---|
|
|
|
| ||||||||
|
|
|
|
Methods: Existing diffusion embedding models can be classified into either probabilistic inference and vector operation models. For probabilistic inference models, they embed users into a unified semantic space, and the propagation probability of every user pair is computed by non-linear function . After that, the Independent Cascade model simulates the diffusion process, and propagation relationships can be inferred via likelihood maximization. Bourigault et al. (Bourigault et al. 2016) projected users into a continuous latent (euclidean) space, and used the Sigmoid function to calculate propagation probabilities. Finally, EM (Expectation-Maximization) algorithm is applied to infer the propagation relationship. Zhuo et al. (Zhuo et al. 2019) embedded uses via GAN (Generative Adversarial Nets) (Goodfellow et al. 2014), avoiding complicated sampling with the help of generative-discrimination architecture.
For space geometry models, they embed users as well as messages into unified semantic space, and infer propagation relationships based on geometrical vector operations. Bourigault et al. (Bourigault et al. 2014) projected users into a geometric manifold space where the source user is at the center of space, and other users are arranged in space according to their propagation relationships. Denoting embedding vectors’ location of sender, receiver, and information as , and , the propagation relationship can be inferred based on the heat diffusion kernel
. where is dimension. Gao et al. (Gao et al. 2017) introduced TransE (Bordes et al. 2013) approach, which allows the inference can be achieved directly through vector operations as follows, omitting the design of diffusion kernel.
where the information-specific matrices identify the correlation between user and information content . Su et al. (Su et al. 2019) embedded contents and users into heterogeneous information networks, and proposed the meta-path-similarity-based HWalk method to infer the diffusion network. The propagation probability between two nodes can be computed by the softmax function:
where the is the path similarity measurement, and is node type.
Pros and Cons: Compared with probabilistic models, vector operation ones are easier to do end-to-end training. And they make better use of the semantic-related features by embedding users and information into a unified space. However, similar to the ML-based models introduced before, the performance of diffusion embedding models relies on the data quantity and quality. Notably, the model performance decreases with the increment of content variance. According to the synthetic experiments, as the words of content increased from 5 to 50, model performance decreased by nearly 60%. Moreover, this phenomenon cannot be solved simply by increasing the number of dimensions. Many researchers (Zhuo et al. 2019; Bourigault et al. 2014) have confirmed that blindly increasing the dimensionality may cause performance degradation due to overfitting.
| Models | Input | Support Inference | ||||||||||||||||||||
|---|---|---|---|---|---|---|---|---|---|---|---|---|---|---|---|---|---|---|---|---|---|---|
|
|
|
|
|
|
| ||||||||||||||||
| NetInf (Gomez-Rodriguez et al. 2012) |
|
|
||||||||||||||||||||
| MultiTree (Gomez-Rodriguez and Schölkopf 2012) |
|
|
||||||||||||||||||||
| CONNIE (Myers and Leskovec 2010) |
|
|
|
|||||||||||||||||||
| NetRate (Gomez-Rodriguez et al. 2011) |
|
|
|
|||||||||||||||||||
| InfoPath (Gomez Rodriguez et al. 2013) |
|
|
|
|
||||||||||||||||||
| MoNet (Wang et al. 2012a) |
|
|
|
|
||||||||||||||||||
| MMRate (Wang et al. 2014) |
|
|
|
|
|
| ||||||||||||||||
| DSTs (Xu and Smith 2018) |
|
|
|
|
||||||||||||||||||
| CSDK (Bourigault et al. 2014) |
|
|
|
|
| |||||||||||||||||
| ECM (Bourigault et al. 2016) |
|
|
|
|
| |||||||||||||||||
| IDEP (Gao et al. 2017) |
|
|
|
|
| |||||||||||||||||
| DiffusionGAN (Zhuo et al. 2019) |
|
|
|
|
|
| ||||||||||||||||
| HUGE (Zhuo et al. 2019) |
|
|
|
|
| |||||||||||||||||
3.3.3. Analysis and Discussion
Diffusion embedding models excellently integrate semantics of users and information. They can automatically determine the relevance of users and information. Compared with those time-series models that can only infer the past information propagation trajectory, diffusion embedding models can predict future propagation relationships because they mine relationships between users and information semantics. However, the network topology factors have not been introduced into diffusion embedding models. It should be noted that cascade records inputted into diffusion embedding models must include sender and receiver because the diffusion embedding models need to arrange the users’ location in the latent semantic space based on these observable forwarding relationships. In contrast, likelihood maximization models only need receivers. The summary of relationship inference models is shown in Table 12. The more data the model needs, the stronger the model’s inference capacity is.
4. Scenario-Specified Diffusion Modeling and Downstream Applications
As shown in Fig. 5, in this section, we will discuss diffusion modeling in some specific scenarios, and downstream applications based on those universal diffusion models (i.e., they are not highly relevant to diffusion scenarios.) introduced in Section 3.

4.1. Diffusion Modeling in Specified Scenarios
4.1.1. Hetergeneous/Multiplex Networks
In the real world, users have diverse social relationships, and they form multiplex/heterogeneous social networks. For example, users can have Twitter and Facebook accounts, which means that the user is in two relatively isolated social circles at the same time. As shown in Fig. 2(a), there are intersections among different network layers, and information can be propagated across various networks via these intersections. Obviously, the information spread on different networks affects each other. When studying heterogeneous network information diffusion modeling, researchers usually assume that the network is composed of -layer networks with same nodes but different edges, denoted by , . denotes the edges in the -th layer of the network. The diffusion process consists of intra-layer diffusion and inter-layer diffusion.
Universal models can be adapted in the following three manners to capture the diffusion dynamics in heterogeneous networks. One approach is the extended cascade. If the user is infected at -th layer, he will try to infect his corresponding position in other networks with probability . In this way, a user remains susceptible unless he is not infected in all layers. Li et al. (Li et al. 2015b) described the intra-layer and inter-layer diffusion processes by bond percolation and cascading failure. And they proved that the inter-layer interactions could speed up the information diffusion process. Wang et al. (Wang et al. 2017a) introduced the interplayer recovery mechanism, which allows users to be infected and recovered across layers. Experiments on synthetic networks show that the interplayer recovery mechanism can promote the diffusion process, and the optimal recovery rate can be calculated by deriving the diffusion equations. Zheng et al. (Zheng et al. 2018) defined states for each layer of the user. The user’s states at each moment can be expressed as a combination of all layer states, and a global transmission tree can be constructed according to combined user states. However, if there are too many layers, it will cause a state explosion. Sahneh et al. (Sahneh et al. 2013) employed first-order mean-field approximation to reduce state space from exponential to polynomial. Li et al. (Li et al. 2019) studied the diffusion of semantic-related information in multiplex networks. They added an “acceleration” factor to indicate the competition or cooperation relationship among different information. It is shown that if two pieces of information are competitive, they will hinder each other during their diffusion process, and vice versa. Another approach is extended threshold. Zhang et at. (Zhang et al. 2016b) assigned the activation threshold for each user . The user’s activation impact on each network will accumulate, and will be activated if the threshold is exceeded. A third approach is coupling. Nicosia et al. (Nicosia et al. 2017) established connections among different layer diffusion processes through parameters correspondence. Specifically, the changes of user states in the -th layer will lead to adjustments of activation function parameters in other layers. This mechanism can induce some collective phenomena such as spontaneous explosive synchronization and heterogeneous distribution of allocations.
4.1.2. Privacy Constraints
In addition to structural characteristics, privacy settings also affect user diffusion capability. Generally, without forwarding, messages posted by Whatsup/Wechat users can only be browsed by their friends, while messages posted by Twitter users are accessible for almost everyone. Moreover, they can also control some other users’ access by configuring privacy settings (Hu et al. 2011).
The main idea of existing privacy-aware diffusion models is to classify different users according to privacy settings, and define corresponding state transition rules. Zhu et al. (Zhu et al. 2015) separately defined the privacy policy of users and connections. They divide user privacy levels into three categories: public, private, and rigorous, representing access rights for everyone, only friends, and only themselves. And there are three types of relationships: bi-directional, semi-directional, and non-neighbor. Based on these assumptions, they proposed DMPS, an extended SI model. The key to DMPS is that users can choose to propagate information publicly or privately. Simulation results show that the privacy settings slow down the diffusion speed. Livio et al. (Bioglio and Pensa 2017) divides users into multiple different privacy classes, and the probability that a user belongs to level is denoted as . can be understood as the possibility for the user to participate in the diffusion process. In other words, it scales back the propagation capability in a privacy protection environment. Besides, George et al. (Giakkoupis et al. 2015) proposed a distributed algorithm, RIPOSTE, which achieves the social property of plausible deniability. It can infer information popularity and user attitudes through parameterized methods.
4.1.3. False Information Diffusion
False information refers to texts, images, and other contents that are meant to manipulate people in society, such as rumors, false news, hoax, and so on (Meel and Vishwakarma 2020). Their diffusion dynamics is a well-studied researched area, including diffusion dynamic analysis, diffusion modeling, containment, source identification, and detection. In this scenario, infected users can become recovery during the interaction with other users (DALEY and KENDALL 1964). For example, when two false information spreaders meet, they may lose interest in spreading the rumor any further, or stop spreading if fact-checkers debunk them.
Many researchers have comprehensively analyzed the characteristics of false information diffusion, such as user behavior, network structure, and steady-state analysis. Vosoughi et al. (Vosoughi et al. 2018) found that fake news is more attractive due to its novelty, which leads to more forwarding. Even worse, false information can guide public perceptions (Shin and Thorson 2017; Stroud 2010). Wang et al. (Wang et al. 2013b) found that the trust mechanism reduces the maximum rumor influence and its diffusion speed. Jie et al. (Jie et al. 2016) depicted the relationship of promotion, suppression, and independence among multiple rumors by defining interaction factors. Yang et al. (Zhou et al. 2007) discovered that the density of final infected users is related to the network topology, and random networks have higher infection densities than scale-free networks. In addition, researchers studied false information diffusion in many other specific situations, such as time-varying networks (Jiang et al. 2016b), delay (Zhu et al. 2016b), behavior uncertainty (Zhu and Wang 2018), noise interference (Zhu and Wang 2017), message evaluation (Shin et al. 2018).
Generally, the mainstream approaches of diffusion modeling are first to define the states and transition rules, and then adopt analytical or simulation methods to capture false information diffusion dynamics. Similar to Epidemic models, states and transition rules are intend to describe the users behavior patterns in rumor diffusion, for example, SIS (Susceptible - Infected - Susceptible) (Pastor-Satorras and Vespignani 2001), SIR (Susceptible - Infected - Recovered) (May and Lloyd 2001), SEIR (Susceptible-Exposed-Infected-Removed) (Huo and Ma 2017), SHIR (Susceptible - Infected - Hibernator - Removed) (Zhao et al. 2012). Analytical approaches are primarily mean-field difference/differential-based approaches, deriving equations to describe the proportion changes of different classes. Simulation approaches design progressive or non-progressive models according to the transition rules, conducting simulations of diffusion process based on the network topology.
Containment of false information can be addressed by network obstruction or counterbalance. Network obstruction block critical social accounts, and counterbalances locate fact-checkers (i.e., they verify the correctness of information) or deliver correct information at critical locations (Nguyen et al. 2013; Tong et al. 2020). Obviously, counterbalances are more moderate and effective (Yang et al. 2020). Tambuscio et al. (Tambuscio et al. 2015) discovered that the effectiveness of fact-checkers depends on the gullibility and forgetting probability. Further, in case of a low forgetting rate, network segregation can make misinformation speed faster. Otherwise, the effect is not apparent. However, in some cases, such as urban legends, the fact-checker mechanism does not seem to be effective (Tambuscio and Ruffo 2019). Young et al. (Young et al. 2018) verified video is more effective in rectifying public misperceptions. Nekmat et al. (Nekmat 2020) thought that skeleton of mainstream media and fact-checking will promote the diffusion of non-mainstream media.
Source identification refers to inferring the source of rumors based on the results of rumors diffusion. It is a downstream application based on diffusion models, which will be discussed in Section 4.2.3. Current detection mainly adopts machine learning or NLP approaches, which are beyond the scope of this article. Readers can refer to this literature (Zubiaga et al. 2018; Meel and Vishwakarma 2020).
4.1.4. Impact of Lurkers on the Information Diffusion
As shown in Fig. 2(a), the user’s interactive behaviors promote information diffusion. However, 90% of social network users are lurkers, who only browse or reshare contents posted by others and do not contribute to the community (Chiang and Wang 2015). Researchers have conducted research in various fields, including lurker behaviors analysis, ranking of lurkers, and delurking.
For lurker behaviors analysis, most researchers aim to study the impact of lurker behaviors on information diffusion. Tagarelli et al. (Tagarelli and Interdonato 2015; Tagarelli and Interdonato 2018) systematically analyzed the interactive behaviors of lurkers. They found that the temporal trends of lurkers’ time-consuming actions present sharper shifts and more noisy clusters. And the average response period of lurkers seems to be at least twice that of active ones. Taking lurkers’ behaviors into consideration, Fu et al. (Fu et al. 2021) proposed SEAIR (Susceptible - Lurker - Super - Normal - Recovered) model to capture diffusion dynamics of super spreaders and lurkers.
Ranking of lurkers methods are used to mining silent members in social networks. The topology-based analysis is an important method, which identifies lurkers based on the structural characteristics of users, such as the ratio of in/out-degrees (Tagarelli and Interdonato 2014). Subsequently, they proposed varieties of ranking approaches, including time-aware ranking (Tagarelli and Interdonato 2015), learning-to-rank (Perna et al. 2018b), and multiplex network ranking (Perna et al. 2018a).
Delurking methods aim to engage lurkers in contributing via information propagation, which can be considered as the particular case of targeted influence maximization (Interdonato et al. 2016; Interdonato et al. 2015). Further, many researchers have explored some factors that affect the interactive behavior of lurkers, such as the structure of product-review network (Chiang and Wang 2015), and argument quality (Alarifi et al. 2015). These factors are critical to discovering potential users in marketing.
4.2. Downstream Applications
4.2.1. Popularity Prediction
Popularity prediction is of practical significance in many areas. For example, the government can analyze the popularity of some sensitive information (e.g., rumors, terrorism information), and predict whether there will be an outbreak or extinction. As shown in Figure. 5, difference/differential-based, stochastic-process-based, and ML-based (Diffusion Volume and Individual Adoption) models are commonly used in popularity prediction. As these models are either diffusion volume models or data-driven individual adoption models, sophisticated individual interaction behaviors can be ignored. In addition, these models are easier to exhibit some principles of the diffusion process, such as K-SC (Yang and Leskovec 2011), steady rates of change and interrupted by sudden bursts (Myers and Leskovec 2014).
If the other models are to be applied to predict popularity, there are many complicated problems. First, there is plenty of information diffusing in social networks, and the interrelation among these pieces of information should not be ignored. Second, accurate prediction requires a precise understanding of the user’s re-sharing mechanisms (including user’s cognition, herd behavior), which is a challenge of all time. Third, with the enhancement of privacy protection, it is difficult to obtain a complete network topology, and we also need to consider the network evolution during the information diffusion process. Finally, we do not know how the external influence (from other platforms) affects the information diffusion on the observed platform. It means that the diffusion is almost restricted to the closed-world, far from the real world.
4.2.2. Influence Maximization
Given a social network topology and the diffusion model , users are selected from the user set as the seed set , which maximize the expected number of active users at the end of the diffusion process. IM has been a research hotspot since it was proposed because of its wide range of applications, such as marketing and public opinion control.
Currently, solutions to the IM problem are primarily based on the greedy algorithm, as shown in Algorithm 6. The total round number is , and in i-th round, the most influential inactive user is moved to the seed set. Obviously, the accuracy and efficiency of the influence function, , is the deterministic factor of the algorithm’s efficiency. Existing IM algorithms mainly rely on time-series individual adoption models, more precisely, progressive models. Compared to the non-progressive models, their monotonicity and submodularity make them more efficient. However, costs a lot of resources. Kempe (Kempe et al. 2005) proved that based on IC/LT is #P-hard, and IM algorithms based on IC/LT are NP-hard. The computing complexity will be higher if other individual-level models are adopted. Readers can refer to relevant literature (Li et al. 2018) for further understanding.
4.2.3. Source Identification
Source identification tasks attempt to locate the origin of the information. It is different from the IP traceability in computer networks, which usually only identifies one of the many propagation participants. Moreover, it does not mean that the found one is the actual origin of the information. Source identification has very vital practical significance, especially for rumor source identification.
Similar to IM, source identification techniques also rely on time-series individual adoption models. The solution consists of two steps. First, it measures user influence using time-series individual adoption models. Next, it finds the most appropriate users according to the metrics, such as Jordan centrality (Hage and Harary 1995), and Eigenvector centrality (Bonacich 1987). Deterministic factors of source identification are similar to influence maximization ones. Many researchers have done detailed investigations in this field (Jiang et al. 2017; Meel and Vishwakarma 2020), and we will not discuss them in details due to space constraints.
4.2.4. Network Inference
Network inference tasks aim at inferring the propagation relationships in social networks. In addition, they can also be used to complete the network structure. Researchers often assume that information flows through edges between users in a social network. However, it is almost impossible to obtain a complete network topology due to privacy protection and network evolution. Relationship inference models can be used in network inference, and we summarize them in Table 12.
Since other models are “many-to-many” activation relationships, they can hardly be used directly to infer diffusion networks. Diffusion volume models do not involve individual interactions, so that they are not suitable for inferring diffusion networks. Individual adoption models can only determine the propagation relationship among and . For example, in terms of the IC model, we can only know that an active user is activated by at least one of his neighbors, but cannot figure out a particular neighbor user. Regarding the LT model, the propagation relationship is related to the input order. For instance, given user with an activation threshold , if the threshold accumulated until time is 0.4, the activation contributions of the two newly activated neighbors and are 0.1 respectively. Therefore, it is impossible to determine whether or is the actual activator.
4.2.5. Social Recommendation
Social recommendation, or personalized recommendation, intends to recommend items that users may interest in based on their interaction records. Consequently, data-driven models are applicable for the social recommendations. Generally, filtering-based and deep-learning-based are primary approaches used in social recommendation. Filtering-based approaches encode the social context (e.g., user-item interaction records, item attributes, and user attributes) into matrices. And then, they recommend items through filtering algorithms, such as matrix factorization or similarity calculation. Deep-learning-based approaches generate the recommendation results through the end-to-end classifier (Kim et al. 2010). There is enormous commercial potential in this area, and these models are comprehensively reviewed in literature (Kim et al. 2010; Tang et al. 2013; Dhelim et al. 2021).

5. Challenges and Open Issues
In this section, challenges and open issues of diffusion modeling techniques are discussed corresponding to the methodology in Section 2.2. Fig. 6 is an overview of chanlleges and open issues.
1) Data Collection Processing
Challenge :The activity of data collection faces restrictions. Recently, crimes of user privacy (e.g., fraud, harassment, and personal information selling) make people and enterprises attach great concern over privacy protection. The enhancement of privacy protection is a gospel for ordinary users. However, it offers challenges for researchers. For example, the announcement of Twitter (Watters [n.d.]) says that it is not allowed to redistribute or syndicate Twitter datasets if they contain tweets. Facebook prevents access to the ID of users participating in public forums (Schroepfer [n.d.]). Although not many companies have performed relevant policies, it may block some researchers who lack data with the enhancement of privacy protection policy.
Solution: Researchers can choose datasets from similar platforms to substitute, or crawl by themselves following platform policies.
2) Diffusion Mechanism Analysis
Challenge: How information affects user behavior remains unclear. Different users will show various behaviors when facing information. In early times, many classical models (e.g., SI (Kermack and McKendrick 1927), IC (Goldenberg et al. 2001), and LT(Granovetter 1978)) think that all users are homogeneous, which means that the effect of information on each user is indistinguishable. These assumptions are far from the real world. Subsequently, researchers assigned social attributes to each user make users exhibit various responses to the same information. Social attributes can be topological (e.g., friendship hops (Wang et al. 2012b),social connectivity (He et al. 2016a), and social role (Yang et al. 2015)) and user personal characteristics (e.g., user interests (Zhang et al. 2016a; Hoang et al. 2017), user authority (Ma et al. 2012; Ma et al. 2013b), and user identity (Zhang et al. 2013; Zhang et al. 2015; Liu et al. 2018)). These personalized characteristics can be encoded into vectors or numerical values for propagation prediction. However, for a particular piece of information, how does it affect a user’s social behavior? How strong will it affect everyone? How will a user modify the information? User’s social actions depend on the match of their thinking and information semantics. These problems may require further study in combination with human cognition.
Open Issue 1: How to analyze user adoption behavior in combination with human cognition?
3) Diffusion Modeling
Challenge: Information diffusion modeling is usually isolated. As shown in Fig. 2(a), user interactive behaviors are roughly divided into five parts in the information diffusion process, including observable and invisible actions. Current diffusion models almost only focus on the fourth part, information propagation, ignoring other behaviors. However, the information diffusion process is a complex system, and multiple behaviors affect information diffusion together. For example, the news is that a star was arrested for a crime, which may cause his fans to stop paying attention to him. Second, the user re-share behavior may cause him to be more intimate (distant) with a friend, or attract strangers to follow him. Researchers also have proven that information diffusion will drive the network evolution (Weng et al. 2013). Third, users may append their comments to the tweet when forwarding it, which will shift the semantics of the original information. At present, some researchers have published their work in this field, such as the Time-driven model (Kempe et al. 2005) Correlated Cascades (Zarezade et al. 2017), Co-Evolve (Farajtabar et al. 2015), and DynaDiffuse (Xie et al. 2015). However, these works seem only to introduce topological evolution.
Open Issue 2: How to model the information diffusion process in a unified framework?
Challenge: Few data-driven models refer to time-series modeling experience. Time-series models design a series of mathematical expressions for diffusion scenarios. These achievements include user interaction status and transition rules (May and Lloyd 2001; Huo and Ma 2017; Fu et al. 2021), user behavior laws (e.g., delay (Saito et al. 2011; Guille and Hacid 2012), distribution of user behaviors (Yu et al. 2015), opinion adoption (Nayak et al. 2019)), the intensity of social event occurrence (Shen et al. 2014; Zhao et al. 2015), periodicity (Matsubara et al. 2012; Bao 2016; Kobayashi and Lambiotte 2016), etc. The effectiveness of these mathematical models has been verified in multiple scenarios. Some articles involve these mechanisms (Cao et al. 2017; Chen et al. 2019b; Chen et al. 2019a; Wu et al. 2018). Although neural networks have strong approximation capabilities, we believe that introducing the knowledge of time-series techniques can help model optimization, such as reducing the search space. We believe that this knowledge can help improve the module architecture and the aggregation of module outputs.
Open Issue 3: How to introduce prior knowledge in data-driven models?
4) Feature Extraction
Challenge: There are still many features that can be exploited to be discovered. For the moment, hundreds of four types of features are used for diffusion prediction. However, there are still some scopes that are not involved. First, current network structural features are mostly static features (e.g., local features (Zhang et al. 2013; Zhang et al. 2015), global features (Cao et al. 2020), and retweet graph (Cheng et al. 2014)), but do not include dynamic features such as network evolution. Second, user-related features are mainly focused on individual-level features. However, with the in-depth research, researchers have discovered that user behavior becomes gradually similar as the interaction process progresses (Crandall et al. 2008). These all indicate that there are still many features that are worth being extracted. Representative features enable diffusion models to have a better performance.
Open Issue 4: How to extract novel and representative diffusion features?
5) Evaluation
Challenge: Evaluation metrics are imperfect. Generally, the evaluation of these models is from both macroscopic and microscopic perspectives. Researchers use macroscopic metrics (e.g., RMSE, MAE, and MAPE) to verify the correctness of the overall diffusion volume, and use microscopic metrics (e.g., Precision, Recall, and F1-score) to evaluate the individual prediction accuracy. These evaluation indicators are not comprehensive. For example, few people consider the length of the propagation path. Qin et al. (Qin et al. 2017) discovered that the cascade depth predicted using IC models is dozens of times greater than actual situations. From this survey, at least, stability (i.e., multi rounds experiments) and robustness (i.e., across multiple datasets) should be considered.
Open Issue 5: How to devise evaluation systems to cover all diffusion characteristics?
6. Conclusion
In this article, we presented a thorough review of information diffusion modeling. Firstly, we state basic notions and the methodology of diffusion modeling. Secondly, we categorized representative diffusion models into three classes and analyzed them from three perspectives: assumptions, methods, and pros and cons. Thirdly, some scenario-specified diffusion modeling and downstream applications are summarized. Finally, conforming to modeling methodology, challenges and open issues are discussed.
We think that diffusion mechanisms analysis and diffusion modeling deserve more attention. Moreover, both time-series and data-driven models should be valued, and they should promote each other to obtain better predictive capabilities. Besides, it is meaningful to develop more comprehensive evaluation metrics to measure the performance of diffusion models. With the explosion of data resources and computing power, researchers should combine other disciplines such as NLP and neural science to conduct in-depth researches on information diffusion modeling. Hopefully, this survey can be used as a reference and guideline for future research.
7. Acknowledgments
This work was supported by the National Natural Science Foundation of China (Grant No.61902013, No.U1636208, No.61862008.) and the Beihang Youth Top Talent Support Program (Grant No.YWF-20-BJ-J-1038, No.YWF-21-BJ-J-1039.)
References
- (1)
- Ahmed et al. (2013) Mohamed Ahmed, Stella Spagna, Felipe Huici, and Saverio Niccolini. 2013. A peek into the future: Predicting the evolution of popularity in user generated content. In Proceedings of the sixth ACM international conference on Web search and data mining. ACM, 607–616.
- Alarifi et al. (2015) Abdulrahman Hamad E. Alarifi, Darshana Sedera, and Jan Recker. 2015. Posters versus lurkers: Improving participation in enterprise social networks through promotional messages. In Proceedings of the 36th International Conference on Information Systems (ICIS 2015), J. Ross and D. Leidner (Eds.). Association for Information Systems (AIS), http://aisel.aisnet.org/, 1–22. https://eprints.qut.edu.au/87663/
- Althoff et al. (2017) Tim Althoff, Pranav Jindal, and Jure Leskovec. 2017. Online Actions with Offline Impact: How Online Social Networks Influence Online and Offline User Behavior. In Proceedings of the Tenth ACM International Conference on Web Search and Data Mining (Cambridge, United Kingdom) (WSDM ’17). Association for Computing Machinery, New York, NY, USA, 537–546. https://doi.org/10.1145/3018661.3018672
- Alzahrani et al. (2015) Sultan Alzahrani, Saud Alashri, Anvesh Reddy Koppela, Hasan Davulcu, and Ismail Hakki Toroslu. 2015. A Network-Based Model for Predicting Hashtag Breakouts in Twitter. In Social Computing, Behavioral-Cultural Modeling, and Prediction - 8th International Conference, SBP 2015, Washington, DC, USA, March 31-April 3, 2015. Proceedings (Lecture Notes in Computer Science, Vol. 9021), Nitin Agarwal, Kevin Xu, and Nathaniel Osgood (Eds.). Springer, 3–12. https://doi.org/10.1007/978-3-319-16268-3_1
- Anderson (2007) John R. Anderson. 2007. How Can the Human Mind Occur in the Physical Universe? Oup Usa.
- Badawy et al. (2018) Adam Badawy, Emilio Ferrara, and Kristina Lerman. 2018. Analyzing the Digital Traces of Political Manipulation: The 2016 Russian Interference Twitter Campaign. In IEEE/ACM 2018 International Conference on Advances in Social Networks Analysis and Mining, ASONAM 2018, Barcelona, Spain, August 28-31, 2018, Ulrik Brandes, Chandan Reddy, and Andrea Tagarelli (Eds.). IEEE Computer Society, 258–265. https://doi.org/10.1109/ASONAM.2018.8508646
- Bakshy et al. (2012) Eytan Bakshy, Itamar Rosenn, Cameron Marlow, and Lada Adamic. 2012. The Role of Social Networks in Information Diffusion. In Proceedings of the 21st International Conference on World Wide Web (Lyon, France) (WWW ’12). Association for Computing Machinery, New York, NY, USA, 519–528. https://doi.org/10.1145/2187836.2187907
- Bao (2016) Peng Bao. 2016. Modeling and Predicting Popularity Dynamics via an Influence-based Self-Excited Hawkes Process. In Proceedings of the 25th ACM International on Conference on Information and Knowledge Management (Indianapolis, Indiana, USA) (CIKM ’16). ACM, New York, NY, USA, 1897–1900. https://doi.org/10.1145/2983323.2983868
- Bao et al. (2015) Peng Bao, Hua-Wei Shen, Xiaolong Jin, and Xue-Qi Cheng. 2015. Modeling and predicting popularity dynamics of microblogs using self-excited hawkes processes. In Proceedings of the 24th International Conference on World Wide Web. ACM, 9–10.
- Barbieri et al. (2013) Nicola Barbieri, Francesco Bonchi, and Giuseppe Manco. 2013. Topic-aware social influence propagation models. Knowledge and information systems 37, 3 (2013), 555–584.
- Bioglio and Pensa (2017) Livio Bioglio and Ruggero G. Pensa. 2017. Modeling the Impact of Privacy on Information Diffusion in Social Networks. In Complex Networks VIII, Bruno Gonçalves, Ronaldo Menezes, Roberta Sinatra, and Vinko Zlatic (Eds.). Springer International Publishing, Cham, 95–107.
- Boguá et al. (2003) Marián Boguá, Romualdo Pastor-Satorras, and Alessandro Vespignani. 2003. Epidemic Spreading in Complex Networks with Degree Correlations. Springer Berlin Heidelberg, Berlin, Heidelberg, 127–147. https://doi.org/10.1007/978-3-540-44943-0_8
- Bonacich (1987) Phillip Bonacich. 1987. Power and centrality: A family of measures. American journal of sociology 92, 5 (1987), 1170–1182.
- Bordes et al. (2013) Antoine Bordes, Nicolas Usunier, Alberto Garcia-Duran, Jason Weston, and Oksana Yakhnenko. 2013. Translating embeddings for modeling multi-relational data. In Advances in neural information processing systems. 2787–2795.
- Bourigault et al. (2014) Simon Bourigault, Cedric Lagnier, Sylvain Lamprier, Ludovic Denoyer, and Patrick Gallinari. 2014. Learning social network embeddings for predicting information diffusion. In Proceedings of the 7th ACM international conference on Web search and data mining. ACM, 393–402.
- Bourigault et al. (2016) Simon Bourigault, Sylvain Lamprier, and Patrick Gallinari. 2016. Representation learning for information diffusion through social networks: an embedded cascade model. In Proceedings of the Ninth ACM international conference on Web Search and Data Mining. ACM, 573–582.
- Cao et al. (2017) Qi Cao, Huawei Shen, Keting Cen, Wentao Ouyang, and Xueqi Cheng. 2017. Deephawkes: Bridging the gap between prediction and understanding of information cascades. In Proceedings of the 2017 ACM on Conference on Information and Knowledge Management. ACM, 1149–1158.
- Cao et al. (2020) Qi Cao, Huawei Shen, Jinhua Gao, Bingzheng Wei, and Xueqi Cheng. 2020. Popularity Prediction on Social Platforms with Coupled Graph Neural Networks. In Proceedings of the 13th International Conference on Web Search and Data Mining (Houston, TX, USA) (WSDM ’20). Association for Computing Machinery, New York, NY, USA, 70–78. https://doi.org/10.1145/3336191.3371834
- Cao et al. (2016) Xuanyu Cao, Yan Chen, Chunxiao Jiang, and KJ Ray Liu. 2016. Evolutionary information diffusion over heterogeneous social networks. IEEE Transactions on Signal and Information Processing over Networks 2, 4 (2016), 595–610.
- Catanzaro et al. (2005) Michele Catanzaro, Marián Boguñá, and Romualdo Pastor-Satorras. 2005. Generation of uncorrelated random scale-free networks. Phys. Rev. E 71 (Feb 2005), 027103. Issue 2. https://doi.org/10.1103/PhysRevE.71.027103
- Center ([n.d.]) China Internet Network Information Center. [n.d.]. The 43rd China Statistical Report on Internet Development(in Chinese). http://www.cnnic.net.cn/hlwfzyj/hlwxzbg/hlwtjbg/201902/P020190318523029756345.pdf/. Accessed February 1, 2019.
- Chen et al. (2012) Wei Chen, Wei Lu, and Ning Zhang. 2012. Time-critical influence maximization in social networks with time-delayed diffusion process. In Twenty-Sixth AAAI Conference on Artificial Intelligence.
- Chen et al. (2019a) Xueqin Chen, Kunpeng Zhang, Fan Zhou, Goce Trajcevski, Ting Zhong, and Fengli Zhang. 2019a. Information Cascades Modeling via Deep Multi-Task Learning. In Proceedings of the 42nd International ACM SIGIR Conference on Research and Development in Information Retrieval, SIGIR 2019, Paris, France, July 21-25, 2019, Benjamin Piwowarski, Max Chevalier, Éric Gaussier, Yoelle Maarek, Jian-Yun Nie, and Falk Scholer (Eds.). ACM, 885–888. https://doi.org/10.1145/3331184.3331288
- Chen et al. (2019b) Xueqin Chen, Fan Zhou, Kunpeng Zhang, Goce Trajcevski, Ting Zhong, and Fengli Zhang. 2019b. Information Diffusion Prediction via Recurrent Cascades Convolution. In 35th IEEE International Conference on Data Engineering, ICDE 2019, Macao, China, April 8-11, 2019. IEEE, 770–781. https://doi.org/10.1109/ICDE.2019.00074
- Cheng et al. (2014) Justin Cheng, Lada Adamic, P Alex Dow, Jon Michael Kleinberg, and Jure Leskovec. 2014. Can cascades be predicted?. In Proceedings of the 23rd international conference on World wide web. ACM, 925–936.
- Chiang and Wang (2015) C. Chiang and J. Wang. 2015. The Impact of Interaction Networks on Lurkers’ Behavior in Online Community. In 2015 48th Hawaii International Conference on System Sciences. 1645–1656. https://doi.org/10.1109/HICSS.2015.198 ISSN: 1530-1605.
- Clifford and Sudbury (1973) Peter Clifford and Aidan Sudbury. 1973. A model for spatial conflict. Biometrika 60, 3 (1973), 581–588.
- Constine ([n.d.]) Josh Constine. [n.d.]. Facebook now has 2 billion monthly users. https://techcrunch.com/2017/06/27/facebook-2-billion-users/. Accessed June 28, 2017.
- Crandall et al. (2008) David Crandall, Dan Cosley, Daniel Huttenlocher, Jon Kleinberg, and Siddharth Suri. 2008. Feedback effects between similarity and social influence in online communities. In Proceedings of the 14th ACM SIGKDD international conference on Knowledge discovery and data mining. ACM, 160–168.
- Crane and Sornette (2008) Riley Crane and Didier Sornette. 2008. Robust dynamic classes revealed by measuring the response function of a social system. Proceedings of the National Academy of Sciences of the United States of America 105, 41 (2008), 15649–15653.
- Cui et al. (2013) Peng Cui, Shifei Jin, Linyun Yu, Fei Wang, Wenwu Zhu, and Shiqiang Yang. 2013. Cascading outbreak prediction in networks: a data-driven approach. In Proceedings of the 19th ACM SIGKDD international conference on Knowledge discovery and data mining. ACM, 901–909.
- Cui et al. (2011) Peng Cui, Fei Wang, Shaowei Liu, Mingdong Ou, Shiqiang Yang, and Lifeng Sun. 2011. Who should share what?: item-level social influence prediction for users and posts ranking. In Proceedings of the 34th international ACM SIGIR conference on Research and development in Information Retrieval. ACM, 185–194.
- DALEY and KENDALL (1964) D. J. DALEY and D. G. KENDALL. 1964. Epidemics and Rumours. Nature 204, 4963 (1964), 1118–1118. https://doi.org/10.1038/2041118a0
- Defferrard et al. (2016) Michaël Defferrard, Xavier Bresson, and Pierre Vandergheynst. 2016. Convolutional Neural Networks on Graphs with Fast Localized Spectral Filtering. In Advances in Neural Information Processing Systems 29: Annual Conference on Neural Information Processing Systems 2016, December 5-10, 2016, Barcelona, Spain, Daniel D. Lee, Masashi Sugiyama, Ulrike von Luxburg, Isabelle Guyon, and Roman Garnett (Eds.). 3837–3845. https://proceedings.neurips.cc/paper/2016/hash/04df4d434d481c5bb723be1b6df1ee65-Abstract.html
- Dhelim et al. (2021) Sahraoui Dhelim, Nyothiri Aung, Mohammed Amine Bouras, Huansheng Ning, and Erik Cambria. 2021. A Survey on Personality-Aware Recommendation Systems. arXiv preprint arXiv:2101.12153 (2021).
- Diekmann and Heesterbeek (2000) Odo Diekmann and Johan Andre Peter Heesterbeek. 2000. Mathematical epidemiology of infectious diseases: model building, analysis and interpretation. Vol. 5. John Wiley & Sons.
- Ding et al. (2018) Jingtao Ding, Yanghao Li, Yong Li, and Depeng Jin. 2018. Click versus Share: A Feature-driven Study of Micro-Video Popularity and Virality in Social Media. In Proceedings of the 2018 SIAM International Conference on Data Mining, SDM 2018, May 3-5, 2018, San Diego Marriott Mission Valley, San Diego, CA, USA, Martin Ester and Dino Pedreschi (Eds.). SIAM, 198–206. https://doi.org/10.1137/1.9781611975321.23
- Ding et al. (2019) Keyan Ding, Ronggang Wang, and Shiqi Wang. 2019. Social Media Popularity Prediction: A Multiple Feature Fusion Approach with Deep Neural Networks. In Proceedings of the 27th ACM International Conference on Multimedia, MM 2019, Nice, France, October 21-25, 2019, Laurent Amsaleg, Benoit Huet, Martha A. Larson, Guillaume Gravier, Hayley Hung, Chong-Wah Ngo, and Wei Tsang Ooi (Eds.). ACM, 2682–2686. https://doi.org/10.1145/3343031.3356062
- Du et al. (2016) Nan Du, Hanjun Dai, Rakshit Trivedi, Utkarsh Upadhyay, Manuel Gomez-Rodriguez, and Le Song. 2016. Recurrent Marked Temporal Point Processes: Embedding Event History to Vector. In Proceedings of the 22nd ACM SIGKDD International Conference on Knowledge Discovery and Data Mining (San Francisco, California, USA) (KDD ’16). Association for Computing Machinery, New York, NY, USA, 1555–1564. https://doi.org/10.1145/2939672.2939875
- Farajtabar et al. (2015) Mehrdad Farajtabar, Yichen Wang, Manuel Gomez Rodriguez, Shuang Li, Hongyuan Zha, and Le Song. 2015. Coevolve: A joint point process model for information diffusion and network co-evolution. In Advances in Neural Information Processing Systems. 1954–1962.
- Ferrara and Yang (2015) Emilio Ferrara and Zeyao Yang. 2015. Quantifying the effect of sentiment on information diffusion in social media. PeerJ Computer Science 1 (2015), e26.
- Figueiredo et al. (2016) Flavio Figueiredo, Jussara M Almeida, Marcos A Gonçalves, and Fabricio Benevenuto. 2016. Trendlearner: Early prediction of popularity trends of user generated content. Information Sciences 349 (2016), 172–187.
- Friedkin and Johnsen (1999) Noah Friedkin and Eugene Johnsen. 1999. Social Influence Networks and Opinion Change. Advances in Group Processes 16 (01 1999), 1–29.
- Fu et al. (2021) Minglei Fu, Jun Feng, Dmytro Lande, Oleh Dmytrenko, Dmytro Manko, and Ryhor Prakapovich. 2021. Dynamic model with super spreaders and lurker users for preferential information propagation analysis. Physica A: Statistical Mechanics and its Applications 561 (2021), 125266. https://doi.org/10.1016/j.physa.2020.125266
- Gao et al. (2014) Shuai Gao, Jun Ma, and Zhumin Chen. 2014. Effective and effortless features for popularity prediction in microblogging network. In Proceedings of the 23rd International Conference on World Wide Web. ACM, 269–270.
- Gao et al. (2015) Shuai Gao, Jun Ma, and Zhumin Chen. 2015. Modeling and Predicting Retweeting Dynamics on Microblogging Platforms. In Proceedings of the Eighth ACM International Conference on Web Search and Data Mining (Shanghai, China) (WSDM ’15). ACM, New York, NY, USA, 107–116. https://doi.org/10.1145/2684822.2685303
- Gao et al. (2017) Sheng Gao, Huacan Pang, Patrick Gallinari, Jun Guo, and Nei Kato. 2017. A novel embedding method for information diffusion prediction in social network big data. IEEE Transactions on Industrial Informatics 13, 4 (2017), 2097–2105.
- Gao et al. (2019) Xiaofeng Gao, Zhenhao Cao, Sha Li, Bin Yao, Guihai Chen, and Shaojie Tang. 2019. Taxonomy and Evaluation for Microblog Popularity Prediction. ACM Transactions on Knowledge Discovery from Data (TKDD) 13, 2 (2019), 15.
- Ghaderi and Srikant (2014) Javad Ghaderi and R. Srikant. 2014. Opinion dynamics in social networks with stubborn agents: Equilibrium and convergence rate. Automatica 50, 12 (2014), 3209–3215. https://doi.org/10.1016/j.automatica.2014.10.034
- Giakkoupis et al. (2015) George Giakkoupis, Rachid Guerraoui, Arnaud Jégou, Anne-Marie Kermarrec, and Nupur Mittal. 2015. Privacy-Conscious Information Diffusion in Social Networks. In DISC 2015 (29th International Symposium on Distributed Computing, Vol. LNCS 9363), Yoram Moses and Matthieu Roy (Eds.). Toshimitsu Masuzawa and Koichi Wada, Springer-Verlag Berlin Heidelberg, Tokyo, Japan. https://doi.org/10.1007/978-3-662-48653-5_32
- Goldenberg et al. (2001) Jacob Goldenberg, Barak Libai, and Eitan Muller. 2001. Talk of the network: A complex systems look at the underlying process of word-of-mouth. Marketing letters 12, 3 (2001), 211–223.
- Gomez-Rodriguez et al. (2011) Manuel Gomez-Rodriguez, David Balduzzi, and Bernhard Schölkopf. 2011. Uncovering the Temporal Dynamics of Diffusion Networks. (2011), 561–568. https://icml.cc/2011/papers/354_icmlpaper.pdf
- Gomez-Rodriguez et al. (2012) Manuel Gomez-Rodriguez, Jure Leskovec, and Andreas Krause. 2012. Inferring networks of diffusion and influence. ACM Transactions on Knowledge Discovery from Data (TKDD) 5, 4 (2012), 21.
- Gomez Rodriguez et al. (2013) Manuel Gomez Rodriguez, Jure Leskovec, and Bernhard Schölkopf. 2013. Structure and dynamics of information pathways in online media. In Proceedings of the sixth ACM international conference on Web search and data mining. ACM, 23–32.
- Gomez-Rodriguez and Schölkopf (2012) Manuel Gomez-Rodriguez and Bernhard Schölkopf. 2012. Submodular inference of diffusion networks from multiple trees. In Proceedings of the 29th International Coference on International Conference on Machine Learning. 1587–1594.
- Goodfellow et al. (2014) Ian J. Goodfellow, Jean Pouget-Abadie, Mehdi Mirza, Bing Xu, David Warde-Farley, Sherjil Ozair, Aaron C. Courville, and Yoshua Bengio. 2014. Generative Adversarial Nets. In Advances in Neural Information Processing Systems 27: Annual Conference on Neural Information Processing Systems 2014, December 8-13 2014, Montreal, Quebec, Canada, Zoubin Ghahramani, Max Welling, Corinna Cortes, Neil D. Lawrence, and Kilian Q. Weinberger (Eds.). 2672–2680. https://proceedings.neurips.cc/paper/2014/hash/5ca3e9b122f61f8f06494c97b1afccf3-Abstract.html
- Gou et al. (2018) Chengcheng Gou, Huawei Shen, Pan Du, Dayong Wu, Yue Liu, and Xueqi Cheng. 2018. Learning sequential features for cascade outbreak prediction. Knowl. Inf. Syst. 57, 3 (2018), 721–739. https://doi.org/10.1007/s10115-017-1143-0
- Granovetter (1978) Mark Granovetter. 1978. Threshold models of collective behavior. American journal of sociology 83, 6 (1978), 1420–1443.
- Gruhl et al. (2004) Daniel Gruhl, Ramanathan Guha, David Liben-Nowell, and Andrew Tomkins. 2004. Information diffusion through blogspace. In Proceedings of the 13th international conference on World Wide Web. ACM, 491–501.
- Guille and Hacid (2012) Adrien Guille and Hakim Hacid. 2012. A predictive model for the temporal dynamics of information diffusion in online social networks. In Proceedings of the 21st international conference on World Wide Web. ACM, 1145–1152.
- Guille et al. (2013) Adrien Guille, Hakim Hacid, Cecile Favre, and Djamel A Zighed. 2013. Information diffusion in online social networks: A survey. ACM Sigmod Record 42, 2 (2013), 17–28.
- Hage and Harary (1995) Per Hage and Frank Harary. 1995. Eccentricity and centrality in networks. Social networks 17, 1 (1995), 57–63.
- Han et al. (2020) Keqi Han, Yuan Tian, Yunjia Zhang, Ling Han, Hao Huang, and Yunjun Gao. 2020. Statistical Estimation of Diffusion Network Topologies. In 36th IEEE International Conference on Data Engineering, ICDE 2020, Dallas, TX, USA, April 20-24, 2020. IEEE, 625–636. https://doi.org/10.1109/ICDE48307.2020.00060
- He et al. (2016b) Kaiming He, Xiangyu Zhang, Shaoqing Ren, and Jian Sun. 2016b. Deep Residual Learning for Image Recognition. In 2016 IEEE Conference on Computer Vision and Pattern Recognition, CVPR 2016, Las Vegas, NV, USA, June 27-30, 2016. IEEE Computer Society, 770–778. https://doi.org/10.1109/CVPR.2016.90
- He et al. (2012) Xinran He, Guojie Song, Wei Chen, and Qingye Jiang. 2012. Influence blocking maximization in social networks under the competitive linear threshold model. In Proceedings of the 2012 siam international conference on data mining. SIAM, 463–474.
- He et al. (2016a) Zaobo He, Zhipeng Cai, Jiguo Yu, Xiaoming Wang, Yunchuan Sun, and Yingshu Li. 2016a. Cost-efficient strategies for restraining rumor spreading in mobile social networks. IEEE Transactions on Vehicular Technology 66, 3 (2016), 2789–2800.
- Hoang et al. (2017) Minh X Hoang, Xuan-Hong Dang, Xiang Wu, Zhenyu Yan, and Ambuj K Singh. 2017. GPOP: Scalable group-level popularity prediction for online content in social networks. In Proceedings of the 26th International Conference on World Wide Web. International World Wide Web Conferences Steering Committee, 725–733.
- Hoang and Lim (2016) Tuan-Anh Hoang and Ee-Peng Lim. 2016. Microblogging content propagation modeling using topic-specific behavioral factors. IEEE Transactions on Knowledge and Data Engineering 28, 9 (2016), 2407–2422.
- Hochreiter and Schmidhuber (1997) Sepp Hochreiter and Jürgen Schmidhuber. 1997. Long Short-Term Memory. Neural Comput. 9, 8 (1997), 1735–1780. https://doi.org/10.1162/neco.1997.9.8.1735
- Hong et al. (2011) Liangjie Hong, Ovidiu Dan, and Brian D Davison. 2011. Predicting popular messages in twitter. In Proceedings of the 20th international conference companion on World wide web. ACM, 57–58.
- Hu et al. (2011) Hongxin Hu, Gail-Joon Ahn, and Jan Jorgensen. 2011. Detecting and resolving privacy conflicts for collaborative data sharing in online social networks. In Twenty-Seventh Annual Computer Security Applications Conference, ACSAC 2011, Orlando, FL, USA, 5-9 December 2011, Robert H’obbes’ Zakon, John P. McDermott, and Michael E. Locasto (Eds.). ACM, 103–112. https://doi.org/10.1145/2076732.2076747
- Huo and Ma (2017) Liang’an Huo and Chenyang Ma. 2017. Dynamical analysis of rumor spreading model with impulse vaccination and time delay. Physica A: Statistical Mechanics and its Applications 471 (2017), 653–665.
- Interdonato et al. (2015) Roberto Interdonato, Chiara Pulice, and Andrea Tagarelli. 2015. "Got to Have Faith!": The DEvOTION Algorithm for Delurking in Social Networks. In Proceedings of the 2015 IEEE/ACM International Conference on Advances in Social Networks Analysis and Mining 2015 (Paris, France) (ASONAM ’15). Association for Computing Machinery, New York, NY, USA, 314–319. https://doi.org/10.1145/2808797.2809394
- Interdonato et al. (2016) R. Interdonato, C. Pulice, and A. Tagarelli. 2016. Community-based delurking in social networks. In 2016 IEEE/ACM International Conference on Advances in Social Networks Analysis and Mining (ASONAM). 263–270. https://doi.org/10.1109/ASONAM.2016.7752244
- Iribarren and Moro (2009) José Luis Iribarren and Esteban Moro. 2009. Impact of Human Activity Patterns on the Dynamics of Information Diffusion. Phys. Rev. Lett. 103 (Jul 2009), 038702. Issue 3. https://doi.org/10.1103/PhysRevLett.103.038702
- Islam et al. (2018) Mohammad Raihanul Islam, Sathappan Muthiah, Bijaya Adhikari, B. Aditya Prakash, and Naren Ramakrishnan. 2018. DeepDiffuse: Predicting the ’Who’ and ’When’ in Cascades. In IEEE International Conference on Data Mining, ICDM 2018, Singapore, November 17-20, 2018. IEEE Computer Society, 1055–1060. https://doi.org/10.1109/ICDM.2018.00134
- Iwata et al. (2013) Tomoharu Iwata, Amar Shah, and Zoubin Ghahramani. 2013. Discovering Latent Influence in Online Social Activities via Shared Cascade Poisson Processes. In Proceedings of the 19th ACM SIGKDD International Conference on Knowledge Discovery and Data Mining (Chicago, Illinois, USA) (KDD ’13). ACM, New York, NY, USA, 266–274. https://doi.org/10.1145/2487575.2487624
- Jiang et al. (2015) Bo Jiang, Jiguang Liang, Ying Sha, and Lihong Wang. 2015. Message clustering based matrix factorization model for retweeting behavior prediction. In Proceedings of the 24th ACM International on Conference on Information and Knowledge Management. ACM, 1843–1846.
- Jiang et al. (2014a) Chunxiao Jiang, Yan Chen, and KJ Ray Liu. 2014a. Evolutionary dynamics of information diffusion over social networks. IEEE Transactions on Signal Processing 62, 17 (2014), 4573–4586.
- Jiang et al. (2014b) Chunxiao Jiang, Yan Chen, and KJ Ray Liu. 2014b. Graphical evolutionary game for information diffusion over social networks. IEEE Journal of Selected Topics in Signal Processing 8, 4 (2014), 524–536.
- Jiang et al. (2016b) Jiaojiao Jiang, Sheng Wen, Shui Yu, Yang Xiang, and Wanlei Zhou. 2016b. Rumor source identification in social networks with time-varying topology. IEEE Transactions on Dependable and Secure Computing 15, 1 (2016), 166–179.
- Jiang et al. (2017) Jiaojiao Jiang, Sheng Wen, Shui Yu, Yang Xiang, and Wanlei Zhou. 2017. Identifying Propagation Sources in Networks: State-of-the-Art and Comparative Studies. IEEE Communications Surveys and Tutorials 19, 1 (2017), 465–481.
- Jiang et al. (2012) Meng Jiang, Peng Cui, Rui Liu, Qiang Yang, Fei Wang, Wenwu Zhu, and Shiqiang Yang. 2012. Social contextual recommendation. In Proceedings of the 21st ACM international conference on Information and knowledge management. ACM, 45–54.
- Jiang et al. (2014c) Meng Jiang, Peng Cui, Fei Wang, Xinran Xu, Wenwu Zhu, and Shiqiang Yang. 2014c. Fema: flexible evolutionary multi-faceted analysis for dynamic behavioral pattern discovery. In Proceedings of the 20th ACM SIGKDD international conference on Knowledge discovery and data mining. ACM, 1186–1195.
- Jiang et al. (2016a) Meng Jiang, Peng Cui, Nicholas Jing Yuan, Xing Xie, and Shiqiang Yang. 2016a. Little is much: Bridging cross-platform behaviors through overlapped crowds. In Thirtieth AAAI Conference on Artificial Intelligence.
- Jie et al. (2016) Renlong Jie, Jian Qiao, Genjiu Xu, and Yingying Meng. 2016. A study on the interaction between two rumors in homogeneous complex networks under symmetric conditions. Physica A: Statistical Mechanics and its Applications 454 (2016), 129–142. https://doi.org/10.1016/j.physa.2016.02.048
- Kempe et al. (2003) David Kempe, Jon Kleinberg, and Éva Tardos. 2003. Maximizing the spread of influence through a social network. In Proceedings of the ninth ACM SIGKDD international conference on Knowledge discovery and data mining (Proceedings of the ninth ACM SIGKDD international conference on Knowledge discovery and data mining). ACM, 137–146.
- Kempe et al. (2005) David Kempe, Jon Kleinberg, and Éva Tardos. 2005. Influential nodes in a diffusion model for social networks. In International Colloquium on Automata, Languages, and Programming. Springer, 1127–1138.
- Kent ([n.d.]) Jo Ling Kent. [n.d.]. Chinese scramble to buy salt as radiation fears grow. http://www.cnn.com/2011/WORLD/asiapcf/03/17/china.salt.scramble/index.html/. Accessed March 18, 2011.
- Kermack and McKendrick (1927) William Ogilvy Kermack and Anderson G McKendrick. 1927. A contribution to the mathematical theory of epidemics. Proceedings of the royal society of london. Series A, Containing papers of a mathematical and physical character 115, 772 (1927), 700–721.
- Khondker (2011) Habibul Haque Khondker. 2011. Role of the New Media in the Arab Spring. Globalizations 8, 5 (2011), 675–679.
- Kim et al. (2010) Jae Kyeong Kim, Hyea Kyeong Kim, Hee Young Oh, and Young U. Ryu. 2010. A group recommendation system for online communities. International Journal of Information Management 30, 3 (2010), 212–219. https://doi.org/10.1016/j.ijinfomgt.2009.09.006
- Kimura et al. (2012) Masahiro Kimura, Kazumi Saito, Kouzou Ohara, and Hiroshi Motoda. 2012. Opinion Formation by Voter Model with Temporal Decay Dynamics. In Machine Learning and Knowledge Discovery in Databases, Peter A. Flach, Tijl De Bie, and Nello Cristianini (Eds.). Springer Berlin Heidelberg, Berlin, Heidelberg, 565–580.
- Kingma and Welling (2014) Diederik P. Kingma and Max Welling. 2014. Auto-Encoding Variational Bayes. In 2nd International Conference on Learning Representations, ICLR 2014, Banff, AB, Canada, April 14-16, 2014, Conference Track Proceedings, Yoshua Bengio and Yann LeCun (Eds.). http://arxiv.org/abs/1312.6114
- Kipf and Welling (2017) Thomas N. Kipf and Max Welling. 2017. Semi-Supervised Classification with Graph Convolutional Networks. In 5th International Conference on Learning Representations, ICLR 2017, Toulon, France, April 24-26, 2017, Conference Track Proceedings. OpenReview.net. https://openreview.net/forum?id=SJU4ayYgl
- Kleinbaum and Klein (2010) David G Kleinbaum and Mitchel Klein. 2010. Survival analysis. Vol. 3. Springer.
- Kobayashi and Lambiotte (2016) Ryota Kobayashi and Renaud Lambiotte. 2016. Tideh: Time-dependent hawkes process for predicting retweet dynamics. In Tenth International AAAI Conference on Web and Social Media.
- Kolda et al. (2014a) Tamara G Kolda, Ali Pinar, et al. 2014a. FEASTPACK v1. 2. Sandia National Laboratories, Albuquerque, NM, USA (2014). https://old-www.sandia.gov/˜tgkolda/feastpack/
- Kolda et al. (2014b) Tamara G. Kolda, Ali Pinar, Todd Plantenga, and C. Seshadhri. 2014b. A Scalable Generative Graph Model with Community Structure. SIAM Journal on Scientific Computing 36, 5 (2014), C424–C452. https://doi.org/10.1137/130914218 arXiv:https://doi.org/10.1137/130914218
- Kong (2019) Quyu Kong. 2019. Linking Epidemic Models and Hawkes Point Processes for Modeling Information Diffusion. In Proceedings of the Twelfth ACM International Conference on Web Search and Data Mining (Melbourne VIC, Australia) (WSDM ’19). Association for Computing Machinery, New York, NY, USA, 818–819. https://doi.org/10.1145/3289600.3291601
- Kong et al. (2014) Shoubin Kong, Qiaozhu Mei, Ling Feng, Fei Ye, and Zhe Zhao. 2014. Predicting bursts and popularity of hashtags in real-time. In Proceedings of the 37th international ACM SIGIR conference on Research & development in information retrieval. ACM, 927–930.
- Kupavskii et al. (2012) Andrey Kupavskii, Liudmila Ostroumova, Alexey Umnov, Svyatoslav Usachev, Pavel Serdyukov, Gleb Gusev, and Andrey Kustarev. 2012. Prediction of Retweet Cascade Size over Time. In Proceedings of the 21st ACM International Conference on Information and Knowledge Management (Maui, Hawaii, USA) (CIKM ’12). Association for Computing Machinery, New York, NY, USA, 2335–2338. https://doi.org/10.1145/2396761.2398634
- Lerman and Ghosh (2010) Kristina Lerman and Rumi Ghosh. 2010. Information Contagion: An Empirical Study of the Spread of News on Digg and Twitter Social Networks. In Proceedings of the Fourth International Conference on Weblogs and Social Media, ICWSM 2010, Washington, DC, USA, May 23-26, 2010, William W. Cohen and Samuel Gosling (Eds.). The AAAI Press. http://www.aaai.org/ocs/index.php/ICWSM/ICWSM10/paper/view/1509
- Leskovec et al. (2010) Jure Leskovec, Deepayan Chakrabarti, Jon Kleinberg, Christos Faloutsos, and Zoubin Ghahramani. 2010. Kronecker Graphs: An Approach to Modeling Networks. J. Mach. Learn. Res. 11 (March 2010), 985–1042.
- Leskovec et al. (2007) Jure Leskovec, Jon Kleinberg, and Christos Faloutsos. 2007. Graph Evolution: Densification and Shrinking Diameters. ACM Trans. Knowl. Discov. Data 1, 1 (March 2007), 2–es. https://doi.org/10.1145/1217299.1217301
- Leskovec and Krevl (2014) Jure Leskovec and Andrej Krevl. 2014. SNAP Datasets: Stanford Large Network Dataset Collection. http://snap.stanford.edu/data.
- Li et al. (2017a) Cheng Li, Jiaqi Ma, Xiaoxiao Guo, and Qiaozhu Mei. 2017a. DeepCas: An End-to-End Predictor of Information Cascades. In Proceedings of the 26th International Conference on World Wide Web (Perth, Australia) (WWW ’17). International World Wide Web Conferences Steering Committee, Republic and Canton of Geneva, CHE, 577–586. https://doi.org/10.1145/3038912.3052643
- Li and Liu (2019) Dong Li and Jiming Liu. 2019. Modeling Influence Diffusion over Signed Social Networks. IEEE Transactions on Knowledge and Data Engineering (2019), 1–1.
- Li et al. (2017c) Dong Li, Shengping Zhang, Xin Sun, Huiyu Zhou, Sheng Li, and Xuelong Li. 2017c. Modeling information diffusion over social networks for temporal dynamic prediction. IEEE Transactions on Knowledge and Data Engineering 29, 9 (2017), 1985–1997.
- Li et al. (2016) Dong Li, Yongchao Zhang, Zhiming Xu, Dianhui Chu, and Sheng Li. 2016. Exploiting information diffusion feature for link prediction in sina weibo. Scientific reports 6 (2016), 20058.
- Li et al. (2017b) Mei Li, Xiang Wang, Kai Gao, and Shanshan Zhang. 2017b. A survey on information diffusion in online social networks: Models and methods. Information 8, 4 (2017), 118.
- Li and Muldowney (1995) Michael Y. Li and James S. Muldowney. 1995. Global stability for the SEIR model in epidemiology. Mathematical Biosciences 125, 2 (1995), 155 – 164. https://doi.org/10.1016/0025-5564(95)92756-5
- Li et al. (2019) Qian Li, Zheng Wang, Bin Wu, and Yunpeng Xiao. 2019. Competition and Cooperation: Dynamical Interplay Diffusion Between Social Topic Multiple Messages in Multiplex Networks. IEEE Trans. Comput. Soc. Syst. 6, 3 (2019), 467–478. https://doi.org/10.1109/TCSS.2019.2909269
- Li et al. (2015b) Weihua Li, Shaoting Tang, Wenyi Fang, Quantong Guo, Xiao Zhang, and Zhiming Zheng. 2015b. How multiple social networks affect user awareness: The information diffusion process in multiplex networks. Phys. Rev. E 92 (Oct 2015), 042810. Issue 4. https://doi.org/10.1103/PhysRevE.92.042810
- Li et al. (2015a) Yanhua Li, Wei Chen, Yajun Wang, and Zhi-Li Zhang. 2015a. Voter Model on Signed Social Networks. Internet Mathematics 11, 2 (2015), 93–133. https://doi.org/10.1080/15427951.2013.862884 arXiv:https://doi.org/10.1080/15427951.2013.862884
- Li et al. (2018) Yuchen Li, Ju Fan, Yanhao Wang, and Kian-Lee Tan. 2018. Influence maximization on social graphs: A survey. IEEE Transactions on Knowledge and Data Engineering 30, 10 (2018), 1852–1872.
- Liao et al. (2019) Dongliang Liao, Jin Xu, Gongfu Li, Weijie Huang, Weiqing Liu, and Jing Li. 2019. Popularity Prediction on Online Articles with Deep Fusion of Temporal Process and Content Features. In The Thirty-Third AAAI Conference on Artificial Intelligence, AAAI 2019, The Thirty-First Innovative Applications of Artificial Intelligence Conference, IAAI 2019, The Ninth AAAI Symposium on Educational Advances in Artificial Intelligence, EAAI 2019, Honolulu, Hawaii, USA, January 27 - February 1, 2019. AAAI Press, 200–207. https://doi.org/10.1609/aaai.v33i01.3301200
- Liu et al. (2018) Yanbing Liu, Jinzhe Zhao, and Yunpeng Xiao. 2018. C-RBFNN: A user retweet behavior prediction method for hotspot topics based on improved RBF neural network. Neurocomputing 275 (2018), 733–746.
- Lou and Tang (2013) Tiancheng Lou and Jie Tang. 2013. Mining structural hole spanners through information diffusion in social networks. In Proceedings of the 22nd international conference on World Wide Web. ACM, 825–836.
- Lu et al. (2015) Wei Lu, Wei Chen, and Laks VS Lakshmanan. 2015. From competition to complementarity: comparative influence diffusion and maximization. Proceedings of the VLDB Endowment 9, 2 (2015), 60–71.
- Ma et al. (2008) Hao Ma, Haixuan Yang, Michael R Lyu, and Irwin King. 2008. Sorec: social recommendation using probabilistic matrix factorization. In Proceedings of the 17th ACM conference on Information and knowledge management. ACM, 931–940.
- Ma et al. (2011) Hao Ma, Dengyong Zhou, Chao Liu, Michael R Lyu, and Irwin King. 2011. Recommender systems with social regularization. In Proceedings of the fourth ACM international conference on Web search and data mining. ACM, 287–296.
- Ma et al. (2012) Zongyang Ma, Aixin Sun, and Gao Cong. 2012. Will this# hashtag be popular tomorrow?. In Proceedings of the 35th international ACM SIGIR conference on Research and development in information retrieval. ACM, 1173–1174.
- Ma et al. (2013a) Zongyang Ma, Aixin Sun, and Gao Cong. 2013a. On predicting the popularity of newly emerging hashtags in Twitter. Journal of the American Society for Information Science and Technology 64, 7 (2013), 1399–1410.
- Ma et al. (2013b) Zongyang Ma, Aixin Sun, and Gao Cong. 2013b. On Predicting the Popularity of Newly Emerging Hashtags in Twitter. Journal of the Association for Information Science and Technology 64, 7 (2013), 1399–1410.
- Matsubara et al. (2012) Yasuko Matsubara, Yasushi Sakurai, B Aditya Prakash, Lei Li, and Christos Faloutsos. 2012. Rise and fall patterns of information diffusion: model and implications. In Proceedings of the 18th ACM SIGKDD international conference on Knowledge discovery and data mining. ACM, 6–14.
- May and Lloyd (2001) Robert M. May and Alun L. Lloyd. 2001. Infection dynamics on scale-free networks. Phys. Rev. E 64 (Nov 2001), 066112. Issue 6. https://doi.org/10.1103/PhysRevE.64.066112
- McAuley and Leskovec (2012) Julian McAuley and Jure Leskovec. 2012. Learning to Discover Social Circles in Ego Networks. In Proceedings of the 25th International Conference on Neural Information Processing Systems - Volume 1 (Lake Tahoe, Nevada) (NIPS’12). Curran Associates Inc., Red Hook, NY, USA, 539–547.
- Meel and Vishwakarma (2020) Priyanka Meel and Dinesh Kumar Vishwakarma. 2020. Fake news, rumor, information pollution in social media and web: A contemporary survey of state-of-the-arts, challenges and opportunities. Expert Systems with Applications 153 (2020), 112986. https://doi.org/10.1016/j.eswa.2019.112986
- Mishra et al. (2016) Swapnil Mishra, Marian-Andrei Rizoiu, and Lexing Xie. 2016. Feature driven and point process approaches for popularity prediction. In Proceedings of the 25th ACM International on Conference on Information and Knowledge Management. ACM, 1069–1078.
- Mislove et al. (2007) Alan Mislove, Massimiliano Marcon, Krishna P Gummadi, Peter Druschel, and Bobby Bhattacharjee. 2007. Measurement and analysis of online social networks. In Proceedings of the 7th ACM SIGCOMM conference on Internet measurement. ACM, 29–42.
- Myers and Leskovec (2010) Seth Myers and Jure Leskovec. 2010. On the convexity of latent social network inference. In Advances in neural information processing systems. 1741–1749.
- Myers and Leskovec (2014) Seth A Myers and Jure Leskovec. 2014. The bursty dynamics of the twitter information network. In Proceedings of the 23rd international conference on World wide web. ACM, 913–924.
- Myers et al. (2012) Seth A Myers, Chenguang Zhu, and Jure Leskovec. 2012. Information diffusion and external influence in networks. In Proceedings of the 18th ACM SIGKDD international conference on Knowledge discovery and data mining. ACM, 33–41.
- Naveed et al. (2011) Nasir Naveed, Thomas Gottron, Jérôme Kunegis, and Arifah Che Alhadi. 2011. Bad news travel fast: A content-based analysis of interestingness on twitter. In Proceedings of the 3rd international web science conference. ACM, 8.
- Nayak et al. (2019) Anuj Nayak, Seyyedali Hosseinalipour, and Huaiyu Dai. 2019. Smart information spreading for opinion maximization in social networks. In IEEE INFOCOM 2019-IEEE Conference on Computer Communications. IEEE, 2251–2259.
- Nekmat (2020) Elmie Nekmat. 2020. Nudge Effect of Fact-Check Alerts: Source Influence and Media Skepticism on Sharing of News Misinformation in Social Media. Social Media + Society 6, 1 (2020), 2056305119897322. https://doi.org/10.1177/2056305119897322 arXiv:https://doi.org/10.1177/2056305119897322
- Newman (2003) Mark EJ Newman. 2003. The structure and function of complex networks. SIAM review 45, 2 (2003), 167–256.
- Nguyen et al. (2013) Nam P. Nguyen, Guanhua Yan, and My T. Thai. 2013. Analysis of misinformation containment in online social networks. Computer Networks 57, 10 (2013), 2133–2146. https://doi.org/10.1016/j.comnet.2013.04.002 Towards a Science of Cyber Security Security and Identity Architecture for the Future Internet.
- Nicosia et al. (2017) Vincenzo Nicosia, Per Sebastian Skardal, Alex Arenas, and Vito Latora. 2017. Collective Phenomena Emerging from the Interactions between Dynamical Processes in Multiplex Networks. Phys. Rev. Lett. 118 (Mar 2017), 138302. Issue 13. https://doi.org/10.1103/PhysRevLett.118.138302
- Pastor-Satorras et al. (2015) Romualdo Pastor-Satorras, Claudio Castellano, Piet Van Mieghem, and Alessandro Vespignani. 2015. Epidemic processes in complex networks. Rev. Mod. Phys. 87 (Aug 2015), 925–979. Issue 3. https://doi.org/10.1103/RevModPhys.87.925
- Pastor-Satorras and Vespignani (2001) Romualdo Pastor-Satorras and Alessandro Vespignani. 2001. Epidemic Spreading in Scale-Free Networks. Phys. Rev. Lett. 86 (Apr 2001), 3200–3203. Issue 14. https://doi.org/10.1103/PhysRevLett.86.3200
- Peng et al. (2020) Hao Peng, Azadeh Nematzadeh, Daniel M. Romero, and Emilio Ferrara. 2020. Network modularity controls the speed of information diffusion. Phys. Rev. E 102 (Nov 2020), 052316. Issue 5. https://doi.org/10.1103/PhysRevE.102.052316
- Perna et al. (2018a) D. Perna, R. Interdonato, and A. Tagarelli. 2018a. Identifying Users With Alternate Behaviors of Lurking and Active Participation in Multilayer Social Networks. IEEE Transactions on Computational Social Systems 5, 1 (March 2018), 46–63. https://doi.org/10.1109/TCSS.2017.2762730
- Perna et al. (2018b) Diego Perna, Roberto Interdonato, and Andrea Tagarelli. 2018b. Learning to lurker rank: an evaluation of learning-to-rank methods for lurking behavior analysis. Social Network Analysis and Mining 8, 1 (2018), 39. https://doi.org/10.1007/s13278-018-0516-z
- Pfitzner et al. (2012) René Pfitzner, Antonios Garas, and Frank Schweitzer. 2012. Emotional divergence influences information spreading in twitter. In Sixth international AAAI conference on weblogs and social media.
- Qin et al. (2017) Yadong Qin, Jun Ma, and Shuai Gao. 2017. Efficient influence maximization under TSCM: a suitable diffusion model in online social networks. Soft Computing 21, 4 (2017), 827–838.
- Qiu et al. (2018) Jiezhong Qiu, Jian Tang, Hao Ma, Yuxiao Dong, Kuansan Wang, and Jie Tang. 2018. Deepinf: Social influence prediction with deep learning. In Proceedings of the 24th ACM SIGKDD International Conference on Knowledge Discovery & Data Mining. 2110–2119.
- Rizoiu et al. (2017) Marian-Andrei Rizoiu, Lexing Xie, Scott Sanner, Manuel Cebrián, Honglin Yu, and Pascal Van Hentenryck. 2017. Expecting to be HIP: Hawkes Intensity Processes for Social Media Popularity. In Proceedings of the 26th International Conference on World Wide Web, WWW 2017, Perth, Australia, April 3-7, 2017, Rick Barrett, Rick Cummings, Eugene Agichtein, and Evgeniy Gabrilovich (Eds.). ACM, 735–744. https://doi.org/10.1145/3038912.3052650
- Rusinowska and Taalaibekova (2019) Agnieszka Rusinowska and Akylai Taalaibekova. 2019. Opinion formation and targeting when persuaders have extreme and centrist opinions. Journal of Mathematical Economics 84 (2019), 9–27. https://doi.org/10.1016/j.jmateco.2019.05.003
- Sahneh et al. (2013) Faryad Darabi Sahneh, Caterina M Scoglio, and Piet Van Mieghem. 2013. Generalized epidemic mean-field model for spreading processes over multilayer complex networks. IEEE ACM Transactions on Networking 21, 5 (2013), 1609–1620.
- Saito et al. (2011) Kazumi Saito, Kouzou Ohara, Yuki Yamagishi, Masahiro Kimura, and Hiroshi Motoda. 2011. Learning diffusion probability based on node attributes in social networks. In International Symposium on Methodologies for Intelligent Systems. Springer, 153–162.
- Sankar et al. (2020) Aravind Sankar, Xinyang Zhang, Adit Krishnan, and Jiawei Han. 2020. Inf-VAE: A Variational Autoencoder Framework to Integrate Homophily and Influence in Diffusion Prediction. In Proceedings of the 13th International Conference on Web Search and Data Mining (Houston, TX, USA) (WSDM ’20). Association for Computing Machinery, New York, NY, USA, 510–518. https://doi.org/10.1145/3336191.3371811
- Schroepfer ([n.d.]) Mike Schroepfer. [n.d.]. An Update on Our Plans to Restrict Data Access on Facebook. https://about.fb.com/news/2018/04/restricting-data-access/. Accessed April 4, 2018.
- Serrano et al. (2015) Emilio Serrano, Carlos Ángel Iglesias, and Mercedes Garijo. 2015. A novel agent-based rumor spreading model in twitter. In Proceedings of the 24th International Conference on World Wide Web. ACM, 811–814.
- Seshadhri et al. (2012) C. Seshadhri, Tamara G. Kolda, and Ali Pinar. 2012. Community structure and scale-free collections of Erdős-Rényi graphs. Phys. Rev. E 85 (May 2012), 056109. Issue 5. https://doi.org/10.1103/PhysRevE.85.056109
- Seshadhri et al. ([n.d.]) C. Seshadhri, Ali Pinar, and Tamara G. Kolda. [n.d.]. Triadic Measures on Graphs: The Power of Wedge Sampling. 10–18. https://doi.org/10.1137/1.9781611972832.2 arXiv:https://epubs.siam.org/doi/pdf/10.1137/1.9781611972832.2
- Shen et al. (2014) Huawei Shen, Dashun Wang, Chaoming Song, and Albert-László Barabási. 2014. Modeling and predicting popularity dynamics via reinforced poisson processes. In Twenty-eighth AAAI conference on artificial intelligence.
- Shin et al. (2018) Jieun Shin, Lian Jian, Kevin Driscoll, and François Bar. 2018. The diffusion of misinformation on social media: Temporal pattern, message, and source. Computers in Human Behavior 83 (2018), 278–287. https://doi.org/10.1016/j.chb.2018.02.008
- Shin and Thorson (2017) Jieun Shin and Kjerstin Thorson. 2017. Partisan Selective Sharing: The Biased Diffusion of Fact-Checking Messages on Social Media. Journal of Communication 67, 2 (02 2017), 233–255. https://doi.org/10.1111/jcom.12284 arXiv:https://academic.oup.com/joc/article-pdf/67/2/233/22321279/jjnlcom0233.pdf
- Sichani and Jalili (2017) Omid Askari Sichani and Mahdi Jalili. 2017. Inference of hidden social power through opinion formation in complex networks. IEEE Transactions on Network Science and Engineering 4, 3 (2017), 154–164.
- Simonyan and Zisserman (2015) Karen Simonyan and Andrew Zisserman. 2015. Very Deep Convolutional Networks for Large-Scale Image Recognition. In 3rd International Conference on Learning Representations, ICLR 2015, San Diego, CA, USA, May 7-9, 2015, Conference Track Proceedings, Yoshua Bengio and Yann LeCun (Eds.). http://arxiv.org/abs/1409.1556
- Singh et al. (2018) Shashank Sheshar Singh, Kuldeep Singh, Ajay Kumar, Harish Kumar Shakya, and Bhaskar Biswas. 2018. A Survey on Information Diffusion Models in Social Networks. In International Conference on Advanced Informatics for Computing Research. Springer, 426–439.
- Smith and Kosslyn (2008) E.E. Smith and S.M. Kosslyn. 2008. Cognitive Psychology: Mind and Brain. Pearson Prentice Hall. https://books.google.com.tw/books?id=YIPSNwAACAAJ
- Stai et al. (2018) Eleni Stai, Eirini Milaiou, Vasileios Karyotis, and Symeon Papavassiliou. 2018. Temporal dynamics of information diffusion in twitter: Modeling and experimentation. IEEE Transactions on Computational Social Systems 5, 1 (2018), 256–264.
- Stroud (2010) Natalie Jomini Stroud. 2010. Polarization and Partisan Selective Exposure. Journal of Communication 60, 3 (08 2010), 556–576. https://doi.org/10.1111/j.1460-2466.2010.01497.x arXiv:https://academic.oup.com/joc/article-pdf/60/3/556/22324536/jjnlcom0556.pdf
- Su et al. (2019) Yuan Su, Xi Zhang, Senzhang Wang, Binxing Fang, Tianle Zhang, and Philip S. Yu. 2019. Understanding Information Diffusion via Heterogeneous Information Network Embeddings. In Database Systems for Advanced Applications - 24th International Conference, DASFAA 2019, Chiang Mai, Thailand, April 22-25, 2019, Proceedings, Part I (Lecture Notes in Computer Science, Vol. 11446), Guoliang Li, Jun Yang, João Gama, Juggapong Natwichai, and Yongxin Tong (Eds.). Springer, 501–516. https://doi.org/10.1007/978-3-030-18576-3_30
- Suh et al. (2010) Bongwon Suh, Lichan Hong, Peter Pirolli, and Ed H Chi. 2010. Want to be retweeted? large scale analytics on factors impacting retweet in twitter network. In 2010 IEEE Second International Conference on Social Computing. IEEE, 177–184.
- Susarla et al. (2012) Anjana Susarla, Jeong-Ha Oh, and Yong Tan. 2012. Social Networks and the Diffusion of User-Generated Content: Evidence from YouTube. Information Systems Research 23, 1 (2012), 23–41. https://doi.org/10.1287/isre.1100.0339 _eprint: https://pubsonline.informs.org/doi/pdf/10.1287/isre.1100.0339.
- Tagarelli and Interdonato (2014) Andrea Tagarelli and Roberto Interdonato. 2014. Lurking in social networks: topology-based analysis and ranking methods. Social Network Analysis and Mining 4, 1 (2014), 230. https://doi.org/10.1007/s13278-014-0230-4
- Tagarelli and Interdonato (2015) Andrea Tagarelli and Roberto Interdonato. 2015. Time-aware analysis and ranking of lurkers in social networks. Social Network Analysis and Mining 5, 1 (2015), 46. https://doi.org/10.1007/s13278-015-0276-y
- Tagarelli and Interdonato (2018) Andrea Tagarelli and Roberto Interdonato. 2018. Lurking Behavior Analysis. In Mining Lurkers in Online Social Networks: Principles, Models, and Computational Methods. Springer International Publishing, Cham, 29–38. https://doi.org/10.1007/978-3-030-00229-9_4
- Tambuscio and Ruffo (2019) Marcella Tambuscio and Giancarlo Ruffo. 2019. Fact-checking strategies to limit urban legends spreading in a segregated society. Applied Network Science 4, 1 (2019), 116. https://doi.org/10.1007/s41109-019-0233-1
- Tambuscio et al. (2015) Marcella Tambuscio, Giancarlo Ruffo, Alessandro Flammini, and Filippo Menczer. 2015. Fact-Checking Effect on Viral Hoaxes: A Model of Misinformation Spread in Social Networks. In Proceedings of the 24th International Conference on World Wide Web (Florence, Italy) (WWW ’15 Companion). Association for Computing Machinery, New York, NY, USA, 977–982. https://doi.org/10.1145/2740908.2742572
- Tang (2006) Jie Tang. 2006. Datasets for Social Network Analysis. https://www.aminer.cn/data-sna.
- Tang et al. (2012) Jiliang Tang, Huiji Gao, and Huan Liu. 2012. mTrust: discerning multi-faceted trust in a connected world. In Proceedings of the fifth ACM international conference on Web search and data mining. ACM, 93–102.
- Tang et al. (2013) Jiliang Tang, Xia Hu, and Huan Liu. 2013. Social recommendation: a review. Social Network Analysis and Mining 3, 4 (1 Jan. 2013), 1113–1133. https://doi.org/10.1007/s13278-013-0141-9
- Tian and Wang (2018) Ye Tian and Long Wang. 2018. Opinion dynamics in social networks with stubborn agents: An issue-based perspective. Automatica 96 (2018), 213–223. https://doi.org/10.1016/j.automatica.2018.06.041
- Tong et al. (2020) G. Tong, W. Wu, L. Guo, D. Li, C. Liu, B. Liu, and D. Du. 2020. An Efficient Randomized Algorithm for Rumor Blocking in Online Social Networks. IEEE Transactions on Network Science and Engineering 7, 2 (2020), 845–854. https://doi.org/10.1109/TNSE.2017.2783190
- Tsur and Rappoport (2012) Oren Tsur and Ari Rappoport. 2012. What’s in a hashtag?: content based prediction of the spread of ideas in microblogging communities. In Proceedings of the fifth ACM international conference on Web search and data mining. ACM, 643–652.
- Vaswani et al. (2017) Ashish Vaswani, Noam Shazeer, Niki Parmar, Jakob Uszkoreit, Llion Jones, Aidan N. Gomez, undefinedukasz Kaiser, and Illia Polosukhin. 2017. Attention is All You Need. In Proceedings of the 31st International Conference on Neural Information Processing Systems (Long Beach, California, USA) (NIPS’17). Curran Associates Inc., Red Hook, NY, USA, 6000–6010.
- Velickovic et al. (2018) Petar Velickovic, Guillem Cucurull, Arantxa Casanova, Adriana Romero, Pietro Liò, and Yoshua Bengio. 2018. Graph Attention Networks. In 6th International Conference on Learning Representations, ICLR 2018, Vancouver, BC, Canada, April 30 - May 3, 2018, Conference Track Proceedings. OpenReview.net. https://openreview.net/forum?id=rJXMpikCZ
- Vlado (2010) Vlado. 2010. Network Data Sources. http://vladowiki.fmf.uni-lj.si/doku.php?id=pajek:data:urls:index.
- Vosoughi et al. (2018) Soroush Vosoughi, Deb Roy, and Sinan Aral. 2018. The spread of true and false news online. Science 359, 6380 (2018), 1146–1151.
- Vu et al. (2011) Duy Q. Vu, Arthur U. Asuncion, David R. Hunter, and Padhraic Smyth. 2011. Dynamic Egocentric Models for Citation Networks. In Proceedings of the 28th International Conference on International Conference on Machine Learning (Bellevue, Washington, USA) (ICML’11). Omnipress, USA, 857–864. http://dl.acm.org/citation.cfm?id=3104482.3104590
- Wallinga and Teunis (2004) Jacco Wallinga and Peter Teunis. 2004. Different Epidemic Curves for Severe Acute Respiratory Syndrome Reveal Similar Impacts of Control Measures. American Journal of Epidemiology 160, 6 (09 2004), 509–516. https://doi.org/10.1093/aje/kwh255 arXiv:https://academic.oup.com/aje/article-pdf/160/6/509/179728/kwh255.pdf
- Wang et al. (2012b) Feng Wang, Haiyan Wang, and Kuai Xu. 2012b. Diffusive logistic model towards predicting information diffusion in online social networks. In 2012 32nd International Conference on Distributed Computing Systems Workshops. IEEE, 133–139.
- Wang et al. (2017d) Jia Wang, Vincent W. Zheng, Zemin Liu, and Kevin Chen-Chuan Chang. 2017d. Topological Recurrent Neural Network for Diffusion Prediction. In 2017 IEEE International Conference on Data Mining, ICDM 2017, New Orleans, LA, USA, November 18-21, 2017, Vijay Raghavan, Srinivas Aluru, George Karypis, Lucio Miele, and Xindong Wu (Eds.). IEEE Computer Society, 475–484. https://doi.org/10.1109/ICDM.2017.57
- Wang et al. (2012a) Liaoruo Wang, Stefano Ermon, and John E Hopcroft. 2012a. Feature-enhanced probabilistic models for diffusion network inference. In Joint European Conference on Machine Learning and Knowledge Discovery in Databases. Springer, 499–514.
- Wang et al. (2014) Senzhang Wang, Xia Hu, Philip S Yu, and Zhoujun Li. 2014. MMRate: inferring multi-aspect diffusion networks with multi-pattern cascades. In Proceedings of the 20th ACM SIGKDD international conference on Knowledge discovery and data mining. ACM, 1246–1255.
- Wang et al. (2017b) Tianbo Wang, Chunhe Xia, Zhong Li, Xiaochen Liu, and Yang Xiang. 2017b. The Spatial–Temporal Perspective: The Study of the Propagation of Modern Social Worms. IEEE Transactions on Information Forensics and Security 12, 11 (2017), 2558–2573.
- Wang et al. (2017c) Tianbo Wang, Chunhe Xia, Sheng Wen, Hui Xue, Yang Xiang, and Shouzhong Tu. 2017c. Sadi: A novel model to study the propagation of social worms in hierarchical networks. IEEE Transactions on Dependable and Secure Computing 16, 1 (2017), 142–155.
- Wang et al. (2018) Wen Wang, Wei Zhang, and Jun Wang. 2018. Factorization Meets Memory Network: Learning to Predict Activity Popularity. In Database Systems for Advanced Applications - 23rd International Conference, DASFAA 2018, Gold Coast, QLD, Australia, May 21-24, 2018, Proceedings, Part II (Lecture Notes in Computer Science, Vol. 10828), Jian Pei, Yannis Manolopoulos, Shazia W. Sadiq, and Jianxin Li (Eds.). Springer, 509–525. https://doi.org/10.1007/978-3-319-91458-9_31
- Wang et al. (2017a) Xin Wang, Weihua Li, Longzhao Liu, Sen Pei, Shaoting Tang, and Zhiming Zheng. 2017a. Promoting information diffusion through interlayer recovery processes in multiplex networks. Phys. Rev. E 96 (Sep 2017), 032304. Issue 3. https://doi.org/10.1103/PhysRevE.96.032304
- Wang et al. (2013a) Yini Wang, Sheng Wen, Yang Xiang, and Wanlei Zhou. 2013a. Modeling the propagation of worms in networks: A survey. IEEE Communications Surveys & Tutorials 16, 2 (2013), 942–960.
- Wang et al. (2013b) Ya-Qi Wang, Xiao-Yuan Yang, Yi-Liang Han, and Xu-An Wang. 2013b. Rumor Spreading Model with Trust Mechanism in Complex Social Networks. Communications in Theoretical Physics 59, 4 (apr 2013), 510–516. https://doi.org/10.1088/0253-6102/59/4/21
- Watters ([n.d.]) Audrey Watters. [n.d.]. How Recent Changes to Twitter’s Terms of Service Might Hurt Academic Research. https://readwrite.com/2011/03/03/how_recent_changes_to_twitters_terms_of_service_mi/. Accessed March 3, 2011.
- Weng et al. (2013) Lilian Weng, Jacob Ratkiewicz, Nicola Perra, Bruno Gonçalves, Carlos Castillo, Francesco Bonchi, Rossano Schifanella, Filippo Menczer, and Alessandro Flammini. 2013. The Role of Information Diffusion in the Evolution of Social Networks. In Proceedings of the 19th ACM SIGKDD International Conference on Knowledge Discovery and Data Mining (Chicago, Illinois, USA) (KDD ’13). ACM, New York, NY, USA, 356–364. https://doi.org/10.1145/2487575.2487607
- Wu et al. (2017) Bo Wu, Wen-Huang Cheng, Yongdong Zhang, Qiushi Huang, Jintao Li, and Tao Mei. 2017. Sequential Prediction of Social Media Popularity with Deep Temporal Context Networks. In Proceedings of the Twenty-Sixth International Joint Conference on Artificial Intelligence, IJCAI 2017, Melbourne, Australia, August 19-25, 2017, Carles Sierra (Ed.). ijcai.org, 3062–3068. https://doi.org/10.24963/ijcai.2017/427
- Wu et al. (2019) Le Wu, Peijie Sun, Yanjie Fu, Richang Hong, Xiting Wang, and Meng Wang. 2019. A Neural Influence Diffusion Model for Social Recommendation. In Proceedings of the 42nd International ACM SIGIR Conference on Research and Development in Information Retrieval (Paris, France) (SIGIR’19). Association for Computing Machinery, New York, NY, USA, 235–244. https://doi.org/10.1145/3331184.3331214
- Wu and Goodman (2018) Mike Wu and Noah Goodman. 2018. Multimodal Generative Models for Scalable Weakly-Supervised Learning. In Proceedings of the 32nd International Conference on Neural Information Processing Systems (Montréal, Canada) (NIPS’18). Curran Associates Inc., Red Hook, NY, USA, 5580–5590.
- Wu et al. (2018) Qitian Wu, Chaoqi Yang, Hengrui Zhang, Xiaofeng Gao, Paul Weng, and Guihai Chen. 2018. Adversarial training model unifying feature driven and point process perspectives for event popularity prediction. In Proceedings of the 27th ACM International Conference on Information and Knowledge Management. ACM, 517–526.
- Xie et al. (2020) Jiayi Xie, Yaochen Zhu, Zhibin Zhang, Jian Peng, Jing Yi, Yaosi Hu, Hongyi Liu, and Zhenzhong Chen. 2020. A Multimodal Variational Encoder-Decoder Framework for Micro-video Popularity Prediction. In WWW ’20: The Web Conference 2020, Taipei, Taiwan, April 20-24, 2020, Yennun Huang, Irwin King, Tie-Yan Liu, and Maarten van Steen (Eds.). ACM / IW3C2, 2542–2548. https://doi.org/10.1145/3366423.3380004
- Xie et al. (2015) Miao Xie, Qiusong Yang, Qing Wang, Gao Cong, and Gerard De Melo. 2015. Dynadiffuse: A dynamic diffusion model for continuous time constrained influence maximization. In Twenty-Ninth AAAI Conference on Artificial Intelligence.
- Xu et al. (2015) Qichao Xu, Zhou Su, Kuan Zhang, Pinyi Ren, and Xuemin Sherman Shen. 2015. Epidemic information dissemination in mobile social networks with opportunistic links. IEEE Transactions on Emerging Topics in Computing 3, 3 (2015), 399–409.
- Xu and Smith (2018) Shaobin Xu and David A Smith. 2018. Contrastive Training for Models of Information Cascades. In Thirty-Second AAAI Conference on Artificial Intelligence.
- Yang et al. (2021) Cheng Yang, Maosong Sun, Haoran Liu, Shiyi Han, Zhiyuan Liu, and Huanbo Luan. 2021. Neural Diffusion Model for Microscopic Cascade Study. IEEE Trans. Knowl. Data Eng. 33, 3 (2021), 1128–1139. https://doi.org/10.1109/TKDE.2019.2939796
- Yang et al. (2019) Cheng Yang, Jian Tang, Maosong Sun, Ganqu Cui, and Zhiyuan Liu. 2019. Multi-scale Information Diffusion Prediction with Reinforced Recurrent Networks. In Proceedings of the Twenty-Eighth International Joint Conference on Artificial Intelligence, IJCAI 2019, Macao, China, August 10-16, 2019, Sarit Kraus (Ed.). ijcai.org, 4033–4039. https://doi.org/10.24963/ijcai.2019/560
- Yang and Counts (2010a) Jiang Yang and Scott Counts. 2010a. Comparing Information Diffusion Structure in Weblogs and Microblogs. In Proceedings of the Fourth International Conference on Weblogs and Social Media, ICWSM 2010, Washington, DC, USA, May 23-26, 2010, William W. Cohen and Samuel Gosling (Eds.). The AAAI Press. http://www.aaai.org/ocs/index.php/ICWSM/ICWSM10/paper/view/1467
- Yang and Counts (2010b) Jiang Yang and Scott Counts. 2010b. Predicting the speed, scale, and range of information diffusion in twitter. In Fourth International AAAI Conference on Weblogs and Social Media.
- Yang and Leskovec (2010) Jaewon Yang and Jure Leskovec. 2010. Modeling information diffusion in implicit networks. In 2010 IEEE International Conference on Data Mining. IEEE, 599–608.
- Yang and Leskovec (2011) Jaewon Yang and Jure Leskovec. 2011. Patterns of temporal variation in online media. In Proceedings of the fourth ACM international conference on Web search and data mining. ACM, 177–186.
- Yang et al. (2020) Lan Yang, Zhiwu Li, and Alessandro Giua. 2020. Containment of rumor spread in complex social networks. Information Sciences 506 (2020), 113–130. https://doi.org/10.1016/j.ins.2019.07.055
- Yang et al. (2017) Lu-Xing Yang, Xiaofan Yang, and Yuan Yan Tang. 2017. A bi-virus competing spreading model with generic infection rates. IEEE Transactions on Network Science and Engineering 5, 1 (2017), 2–13.
- Yang et al. (2015) Yang Yang, Jie Tang, Cane Wing-ki Leung, Yizhou Sun, Qicong Chen, Juanzi Li, and Qiang Yang. 2015. RAIN: Social Role-Aware Information Diffusion.. In AAAI, Vol. 15. 367–373.
- Yang et al. (2010) Zi Yang, Jingyi Guo, Keke Cai, Jie Tang, Juanzi Li, Li Zhang, and Zhong Su. 2010. Understanding Retweeting Behaviors in Social Networks. In Proceedings of the 19th ACM International Conference on Information and Knowledge Management (Toronto, ON, Canada) (CIKM ’10). Association for Computing Machinery, New York, NY, USA, 1633–1636. https://doi.org/10.1145/1871437.1871691
- Yao et al. (2015) Qipeng Yao, Xu Wu, and Xi Zhang. 2015. Diffusion of information in mobile social networks: A brief survey. In 2015 IEEE International Conference on Mobile Services. IEEE, 254–260.
- Young et al. (2018) Dannagal G. Young, Kathleen Hall Jamieson, Shannon Poulsen, and Abigail Goldring. 2018. Fact-Checking Effectiveness as a Function of Format and Tone: Evaluating FactCheck.org and FlackCheck.org. Journalism & Mass Communication Quarterly 95, 1 (2018), 49–75. https://doi.org/10.1177/1077699017710453 arXiv:https://doi.org/10.1177/1077699017710453
- Yu et al. (2015) Linyun Yu, Peng Cui, Fei Wang, Chaoming Song, and Shiqiang Yang. 2015. From micro to macro: Uncovering and predicting information cascading process with behavioral dynamics. In 2015 IEEE International Conference on Data Mining. IEEE, 559–568.
- Yuan et al. (2016) Nicholas Jing Yuan, Yuan Zhong, Fuzheng Zhang, Xing Xie, Chin-Yew Lin, and Yong Rui. 2016. Who will reply to/retweet this tweet?: The dynamics of intimacy from online social interactions. In Proceedings of the ninth ACM international conference on web search and data mining. ACM, 3–12.
- Zarezade et al. (2017) Ali Zarezade, Ali Khodadadi, Mehrdad Farajtabar, Hamid R Rabiee, and Hongyuan Zha. 2017. Correlated cascades: Compete or cooperate. In Thirty-First AAAI Conference on Artificial Intelligence.
- Zhang et al. (2013) Jing Zhang, Biao Liu, Jie Tang, Ting Chen, and Juanzi Li. 2013. Social influence locality for modeling retweeting behaviors. In Twenty-Third International Joint Conference on Artificial Intelligence.
- Zhang et al. (2015) Jing Zhang, Jie Tang, Juanzi Li, Yang Liu, and Chunxiao Xing. 2015. Who influenced you? predicting retweet via social influence locality. ACM Transactions on Knowledge Discovery from Data (TKDD) 9, 3 (2015), 25.
- Zhang et al. (2016b) Jiawei Zhang, Philip S Yu, Yuanhua Lv, and Qianyi Zhan. 2016b. Information diffusion at workplace. In Proceedings of the 25th ACM International on Conference on Information and Knowledge Management. ACM, 1673–1682.
- Zhang et al. (2016a) Qi Zhang, Yeyun Gong, Jindou Wu, Haoran Huang, and Xuanjing Huang. 2016a. Retweet prediction with attention-based deep neural network. In Proceedings of the 25th ACM international on conference on information and knowledge management. ACM, 75–84.
- Zhang et al. (2018) Wei Zhang, Wen Wang, Jun Wang, and Hongyuan Zha. 2018. User-guided Hierarchical Attention Network for Multi-modal Social Image Popularity Prediction. In Proceedings of the 2018 World Wide Web Conference on World Wide Web, WWW 2018, Lyon, France, April 23-27, 2018, Pierre-Antoine Champin, Fabien L. Gandon, Mounia Lalmas, and Panagiotis G. Ipeirotis (Eds.). ACM, 1277–1286. https://doi.org/10.1145/3178876.3186026
- Zhao et al. (2012) Laijun Zhao, Jiajia Wang, Yucheng Chen, Qin Wang, Jingjing Cheng, and Hongxin Cui. 2012. SIHR rumor spreading model in social networks. Physica A: Statistical Mechanics and its Applications 391, 7 (2012), 2444–2453. https://doi.org/10.1016/j.physa.2011.12.008
- Zhao et al. (2015) Qingyuan Zhao, Murat A Erdogdu, Hera Y He, Anand Rajaraman, and Jure Leskovec. 2015. Seismic: A self-exciting point process model for predicting tweet popularity. In Proceedings of the 21th ACM SIGKDD International Conference on Knowledge Discovery and Data Mining. ACM, 1513–1522.
- Zheng et al. (2018) Chunyuan Zheng, Chengyi Xia, Quantong Guo, and Matthias Dehmer. 2018. Interplay between SIR-based disease spreading and awareness diffusion on multiplex networks. J. Parallel Distributed Comput. 115 (2018), 20–28. https://doi.org/10.1016/j.jpdc.2018.01.001
- Zhou et al. (2021) Fan Zhou, Xovee Xu, Goce Trajcevski, and Kunpeng Zhang. 2021. A Survey of Information Cascade Analysis: Models, Predictions, and Recent Advances. ACM Comput. Surv. 54, 2, Article 27 (March 2021), 36 pages. https://doi.org/10.1145/3433000
- Zhou et al. (2020) Fan Zhou, Xovee Xu, Kunpeng Zhang, Goce Trajcevski, and Ting Zhong. 2020. Variational Information Diffusion for Probabilistic Cascades Prediction. In 39th IEEE Conference on Computer Communications, INFOCOM 2020, Toronto, ON, Canada, July 6-9, 2020. IEEE, 1618–1627. https://doi.org/10.1109/INFOCOM41043.2020.9155349
- Zhou et al. (2007) Jie Zhou, Zonghua Liu, and Baowen Li. 2007. Influence of network structure on rumor propagation. Physics Letters A 368, 6 (2007), 458–463. https://doi.org/10.1016/j.physleta.2007.01.094
- Zhu et al. (2015) Hui Zhu, Cheng Huang, and Hui Li. 2015. Information Diffusion Model Based on Privacy Setting in Online Social Networking Services. Comput. J. 58, 4 (2015), 536–548. https://doi.org/10.1093/comjnl/bxu062
- Zhu and Wang (2017) Liang Zhu and Youguo Wang. 2017. Rumor spreading model with noise interference in complex social networks. Physica A: Statistical Mechanics and its Applications 469 (2017), 750–760. https://doi.org/10.1016/j.physa.2016.11.119
- Zhu and Wang (2018) Liang Zhu and Youguo Wang. 2018. Rumor diffusion model with spatio-temporal diffusion and uncertainty of behavior decision in complex social networks. Physica A: Statistical Mechanics and its Applications 502 (2018), 29–39. https://doi.org/10.1016/j.physa.2018.02.060
- Zhu et al. (2016b) Linhe Zhu, Hongyong Zhao, and Haiyan Wang. 2016b. Complex dynamic behavior of a rumor propagation model with spatial-temporal diffusion terms. Information Sciences 349-350 (2016), 119–136. https://doi.org/10.1016/j.ins.2016.02.031
- Zhu et al. (2016a) Yuqing Zhu, Deying Li, and Zhao Zhang. 2016a. Minimum cost seed set for competitive social influence. In IEEE INFOCOM 2016-The 35th Annual IEEE International Conference on Computer Communications. IEEE, 1–9.
- Zhuo et al. (2019) Wei Zhuo, Yanan Zhao, Qianyi Zhan, and Yuan Liu. 2019. DiffusionGAN: Network Embedding for Information Diffusion Prediction with Generative Adversarial Nets. In 2019 IEEE Intl Conf on Parallel & Distributed Processing with Applications, Big Data & Cloud Computing, Sustainable Computing & Communications, Social Computing & Networking, ISPA/BDCloud/SocialCom/SustainCom 2019, Xiamen, China, December 16-18, 2019. IEEE, 808–816. https://doi.org/10.1109/ISPA-BDCloud-SustainCom-SocialCom48970.2019.00120
- Zubiaga et al. (2018) Arkaitz Zubiaga, Ahmet Aker, Kalina Bontcheva, Maria Liakata, and Rob Procter. 2018. Detection and Resolution of Rumours in Social Media: A Survey. ACM Comput. Surv. 51, 2, Article 32 (Feb. 2018), 36 pages. https://doi.org/10.1145/3161603
8. APPENDIX I
| Types | Features | Definations |
|---|---|---|
| Network | Node degree (Cheng et al. 2014; Ding et al. 2018; Kong et al. 2014; Gao et al. 2014) | |
| Network | Graph density (Ma et al. 2012; Ma et al. 2013b; Kong et al. 2014; Gao et al. 2014) | |
| Network | Edge weight (Ma et al. 2012; Ma et al. 2013b) | |
| Network | The number of border users (Ma et al. 2012; Ma et al. 2013b; Gao et al. 2014) | |
| Network | User connectivity (e.g., ratio between the number of connected components and the number of nodes) (Ma et al. 2012; Ma et al. 2013b) | |
| Network | Network clustering (Hoang et al. 2017; Gao et al. 2014) | |
| Network | Benefit and investment between users (Yuan et al. 2016; Gao et al. 2014) | |
| Network | Node authority (Ma et al. 2012) | |
| Network | Users form triangles (Vu et al. 2011; Ma et al. 2012) | |
| Cascade | Structural features of the original user (e.g., degree) (Cheng et al. 2014; Ding et al. 2018) | |
| Cascade | Structural features of early adopters (e.g., degree) (Cheng et al. 2014; Ding et al. 2018) | |
| Cascade | Connections between active users (i.e., ) (Cheng et al. 2014) | |
| Cascade | The depth of the retweet tree (Cheng et al. 2014) | |
| Cascade | Retweet path of cascades (Cao et al. 2017) | |
| Cascade | Number of hops in diffusion process (Yang and Counts 2010b) | |
| Cascade | Diffusion cascade graph (Wang et al. 2017d; Chen et al. 2019b) |
| Types | Features | Definations |
|---|---|---|
| Sequential | Time ticks of social interactions (Jiang et al. 2014c; Hoang et al. 2017; Yang et al. 2010) | |
| Sequential | Tweet frequency (Suh et al. 2010) | |
| Sequential | Time elapsed between the -th and -th reshare (Cheng et al. 2014; Ding et al. 2019; Gao et al. 2014; Hong et al. 2011) | |
| Sequential | Number of users who saw the tweet per unit time (Cheng et al. 2014) | |
| Sequential | Number of users who reshare the tweet per unit time (Cheng et al. 2014; Ma et al. 2012; Ma et al. 2013b) | |
| Statiscical | Change ratio of forwarding number in consecutive time windows (Tsur and Rappoport 2012) | |
| Statiscical | Distribution of active time (Cheng et al. 2014; Hong et al. 2011) | |
| Statiscical | Shape of time series (Kong et al. 2014) | |
| Statiscical | Time decay effect (Cao et al. 2017; Yang et al. 2010) | |
| Statiscical | Time taken for first retweet to arrive (Gao et al. 2014) |
| Types | Features | Definations |
|---|---|---|
| Statistical | Whether the posted media with a caption (Cheng et al. 2014; Ding et al. 2018) | |
| Statistical | The language of the tweet (Cheng et al. 2014) | |
| Statistical | The type of the origin post (e.g., web page) (Cheng et al. 2014) | |
| Statistical | The length of the text or caption (Cheng et al. 2014; Ding et al. 2019; Tsur and Rappoport 2012) | |
| Statistical | The count of hashtags (Ding et al. 2019; Suh et al. 2010; Jiang et al. 2015) | |
| Statistical | The count of URLs (Suh et al. 2010; Ma et al. 2012; Ma et al. 2013b) | |
| Statistical | The ratio of views and reposts of the tweets posted by early reshare users (Cheng et al. 2014; Ding et al. 2018) | |
| Statiscical | Number of specified users in the tweet (Suh et al. 2010; Ma et al. 2012; Ma et al. 2013b; Jiang et al. 2015) | |
| Semantic | The possibility that the posted video or image having a specific topic (Cheng et al. 2014; Ding et al. 2018; Ding et al. 2019) | |
| Semantic | Emotion or sentiment of the tweet (Cheng et al. 2014; Tsur and Rappoport 2012; Kong et al. 2014) | |
| Semantic | Virality (popularity) of topic or tweet (Hoang and Lim 2016) | |
| Semantic | Topic distribution of tweet content (Hong et al. 2011) | |
| Semantic | Deep text features extracted by deep learning models (Ding et al. 2019) | |
| Semantic | Multi media features extracted by deep learning models (Xie et al. 2020; Ding et al. 2019) | |
| Semantic | Content similarity (Jiang et al. 2014c; Zhang et al. 2016a) | |
| Semantic | Level of self-disclosure of tweet content (Yuan et al. 2016) | |
| Semantic | Hashtag content (Tsur and Rappoport 2012; Ma et al. 2012; Ma et al. 2013b; Kong et al. 2014) | |
| Semantic | Location hashtag (Tsur and Rappoport 2012) |
| Types | Features | Definations |
|---|---|---|
| Static | Attributes of the original user (e.g., age, gender) (Cheng et al. 2014) | |
| Static | Attributes of early adopters (e.g., age, gender) (Cheng et al. 2014; Ding et al. 2018) | |
| Static | Users who follows the original user (Cheng et al. 2014; Tsur and Rappoport 2012; Kong et al. 2014) | |
| Static | Users that the original user is following (Cheng et al. 2014; Tsur and Rappoport 2012) | |
| Static | User influence (e.g., the number of fans, interest) (Cao et al. 2017) | |
| Static | User similarity (Jiang et al. 2014c; Zhang et al. 2016a; Yang et al. 2010) | |
| Static | User preference (Yang et al. 2010) | |
| Static | User authority (Ma et al. 2012) | |
| Dynamic | Susceptibility of users to be infected (Hoang and Lim 2016) | |
| Dynamic | User social activity (i.e. tweets published by the user) (Suh et al. 2010; Kong et al. 2014) | |
| Dynamic | The ratio of views and reposts of the tweets posted by the original user (Cheng et al. 2014; Tsur and Rappoport 2012; Hong et al. 2011; Kupavskii et al. 2012) | |
| Dynamic | The ratio of views and reposts of the tweets posted by early adopters (Cheng et al. 2014; Ding et al. 2018; Kupavskii et al. 2012) | |
| Dynamic | Responsiveness of the user to tweets (Yuan et al. 2016) |