Supplementary Material for
Direct imaging of antiferromagnetic domains and anomalous layer-dependent mirror symmetry breaking in atomically thin MnPS3
Note S1. Symmetry information of the polarization-resolved SHG intensity
In this study, we mainly focus on two second-harmonic contributions in MnPS3: the spin-induced electric dipole (ED) term () and electric quadruple (EQ) term (). The rank 3 tensor and rank 4 tensor follow the symmetry of the MnPS3 crystal. Here, we only consider the case that the mirror symmetry of MnPS3 is present.
1.1
Above Néel temperature, the point group of MnPS3 crystal is 2/m. The is zero because of the presence of the inversion symmetry. Under normal incidence, we can simplify the EQ term as . According to the mirror symmetry perpendicular to the b-axis we have . In conclusion, the SHG intensity for parallel and crossed configuration should be
| (S1) |
and
| (S2) |
where is the incident power and is the angle between a-axis and polarization of incident light. When , , and when , , indicating no SHG output is from the b-axis.
1.2
When the long-range antiferromagnetic order forms, the MnPS3 breaks inversion symmetry, so the is non-zero. According to its magnetic point group 2’/m, we have . Then the second-harmonic electric field for the parallel and crossed configurations from ED term are,
| (S3) |
and
| (S4) |
The symmetry of the tensor is identical to the case of , so
| (S5) |
and
| (S6) |
Finally, the SHG intensity below is
| (S7) |
and
| (S8) |
where corresponds to two different domains.

Note S2. SHG measurements on NiPS3
Here we measure a centrosymmetric van der Waals antiferromagnetic material NiPS3. The NiPS3 crystal has the same space and point group in the paramagnetic phase as MnPS3, but it is in a so-called “zigzag” AFM state under the transition temperature around 153 K. The zigzag AFM does not break inversion, so the spin-induced c-type SHG is not allowed in this compound. However, the i-type electric quadrupole SHG is allowed and influenced by the magneto-elastic coupling with the formation of the antiferromagnetic order. The temperature dependence of a NiPS3 crystal with a thickness around 10 m is shown in Figure S2(a). Power of 5 mW and a beam spot diameter of 10 m are used. Note that a clear transition happens at the Néel temperature. We also measure a 100-nm thick NiPS3 flake exfoliated on the SiO2/Si wafer, and see a similar transition at around 153 K (Fig. S2(b)). Consecutive thermal cycles are performed to confirm that only one possible SHG signal exists below the Néel temperature, which is consistent with the absence of the spin-induced c-type SHG contribution. Note that SHG was reported without a change across the the Néel temperature in NiPS3 Chu et al. 2020. The observation of the phase transition due to magneto-elastic coupling also shows the higher sensitivity of our setup.

Note S3. Crossover of the exponent component in MnPS3 bulk

Near the Néel temperature, the electric-dipole second-order susceptibility is proportional to . In Fig.1 in the main text, we report a change of slope around 76 K in the temperature-dependent SHG in a bulk MnPS3 crystal. To study the crossover-like feature, we plot the square root of SHG signal of domain 1 (the nonzero value at is subtracted) as a function of in the log-log plot (Fig. S3). The slope of the curve is then representing the critical exponent . A clear crossover of the slope is observed in the plot with and . A neutron scattering measurement in MnPS3 also shows a crossover feature on the exponent coefficients at a similar temperature but with different values of Wildes et al. 2006, where the critical exponents are more accurate as it measures the staggered magnetization. Note that Muthukumar et al. 1995. If the EQ SHG does not depend on temperature below , then we will see similar critical exponents as neutrom scattering. Therefore, we conclude that electric-quadruple contribution is also dependent on temperature and can show a phase-transition-like behavior (See NiPS3 data in Note S2). In this regard, the and in Fig. S3 are not purely related with as it also include the EQ SHG that is also dependent on the temperature below .
Note S4. Layer characterization of few-layer MnPS3
Typical optical images of different layers are shown in Fig. S4(a). We use two methods to distinguish the number of layers, including atomic force microscopy and optical contrast. For the atomic force microscopy measurement, the height information of the contact mode is used. A single-layer step of around 0.73 nm can be seen from Fig. S4(e). The height of the monolayer is measured to be around 1.3 nm, which is larger than a single-layer step. It is possible because of the existence of an air layer on the sample surface. Layer-dependent sample thickness is shown in Fig. S4(a) by open red circles, and a linear fit is marked by the black line. We also use optical contrast to determine the layer numbers. We extract the red channel of optical image and calculate the optical contrast for different samples by . The layer-dependent optical contrast is plotted in Fig. S4(b) by open red circles with a linear fit marked by a black line.

Note S5. Extra data for the bilayer MnPS3 sample.
Here we show some extra data of the bilayer sample in the main text. The optical image, atomic force microscopy mapping, and SHG intensity mapping at 5 K and 65 K are shown in Fig. S5. Clearly, the SHG signal exists at 5 K while almost disappears at 65 K for the left-side bilayer area. The data shown in the main text was measured at the same spot in the middle of the left-side bilayer area.
To exclude the possibility of degradation of the bilayer sample during the sample preparation process, we also measured a bilayer sample S2 exfoliated in a glove box with the O2 and water level less than 1 ppm. The data are shown in Fig. S6. The transition temperature extracted from Fig. S6 (b) is 61 K, and the SHG intensity is around 1.5 c.p.s.. These values are consistent with those from the bilayer sample exfoliated in air shown in the main text.


Note S6. Characterization of monolayer MnPS3 samples.
We measured the data from three different monolayer MnPS3 samples, and did not observe a temperature-dependent SHG within the sensitivity of our setup. The data of the monolayer shown in the main text were measured under the laser power of 2.0 mW. The monolayer sample was exfoliated in air, and the optical images are shown in Fig.S4(c). A second sample prepared and measured under the same condition shows the same temperature-independent signal. We also tried one monolayer sample exfoliated in the glove box to avoid any possible degradation during the sample preparation process, though the MnPS3 monolayer is reported to be stable in air Lee et al. 2016. The details of this sample are shown in Fig. S7. In this sample, we used a relatively high laser power of 5.0 mW, which generates enough photons to measure polarization-dependent SHG patterns. We observed a small SHG signal on top of the signal from the substrate, but we did not observe any temperature-dependent signals between 5 K and 80 K.
The long-range order in bulk MnPS3 is believed to result from the anisotropy and the weak interplanar coupling Rønnow et al. 2000; Wildes et al. 2006. Except for the ordering near the 3D Néel temperature, the spin dynamics of a bulk sample are best described by the 2D Heisenberg Hamiltonian with weak XY anisotropy and interlayer coupling Wildes et al. 2006. If atomically thin samples have the same Hamiltonian as the bulk, the absence of the long-rage order in the monolayer is either consistent with the 2D Heisenberg model without interlayer coupling or in the same universality class as the 2D XY model, which we do not have direct evidences for. Nevertheless, as we wrote in the main text, both the lattice and the spin structure of samples thinner than 10L are found to be different from the bulk, so we actually do not know the spin Hamiltonian and anisotropy in atomically thin samples. Note that the suppression of is also most prominent below 10L. It is possible that the anisotropy is strongly reduced in atomically thin limit, especially in the monolayer Gong et al. 2017; Deng et al. 2018. Also, we can not rule out the possibility of disorder effect even though we do not see buckling from atomic force microscopy measurements. We hope our work will motivate more works on atomically thin MnPS3 especially the monolayer in the future.

Note S7. Strain-tuning measurement of few-layer MnPS3 samples
From the SHG measurement, we have confirmed that the mirror symmetry was broken below and above the Néel temperature in few-layer samples with thickless less than 11L. It is reported previously in a 7L MnPS3 sample below Néel temperature by a similar SHG measurement, which they attribute to the substrate-induced strainChu et al. 2020. According to our measurement, we argue that the substrate-induced strain is not the key reason for the mirror-symmetry breaking. First, strain modification on SHG patterns is usually quite small. The polarization-dependent SHG patterns of the few-layer samples shown in the main text are quite different from the six-fold patterns in the thicker samples. While the previous study on strain-dependent SHG of other 2D materials never shows such a large modification even by adding a large strain deliberatelyMennel et al. 2018; Mennel et al. 2019.
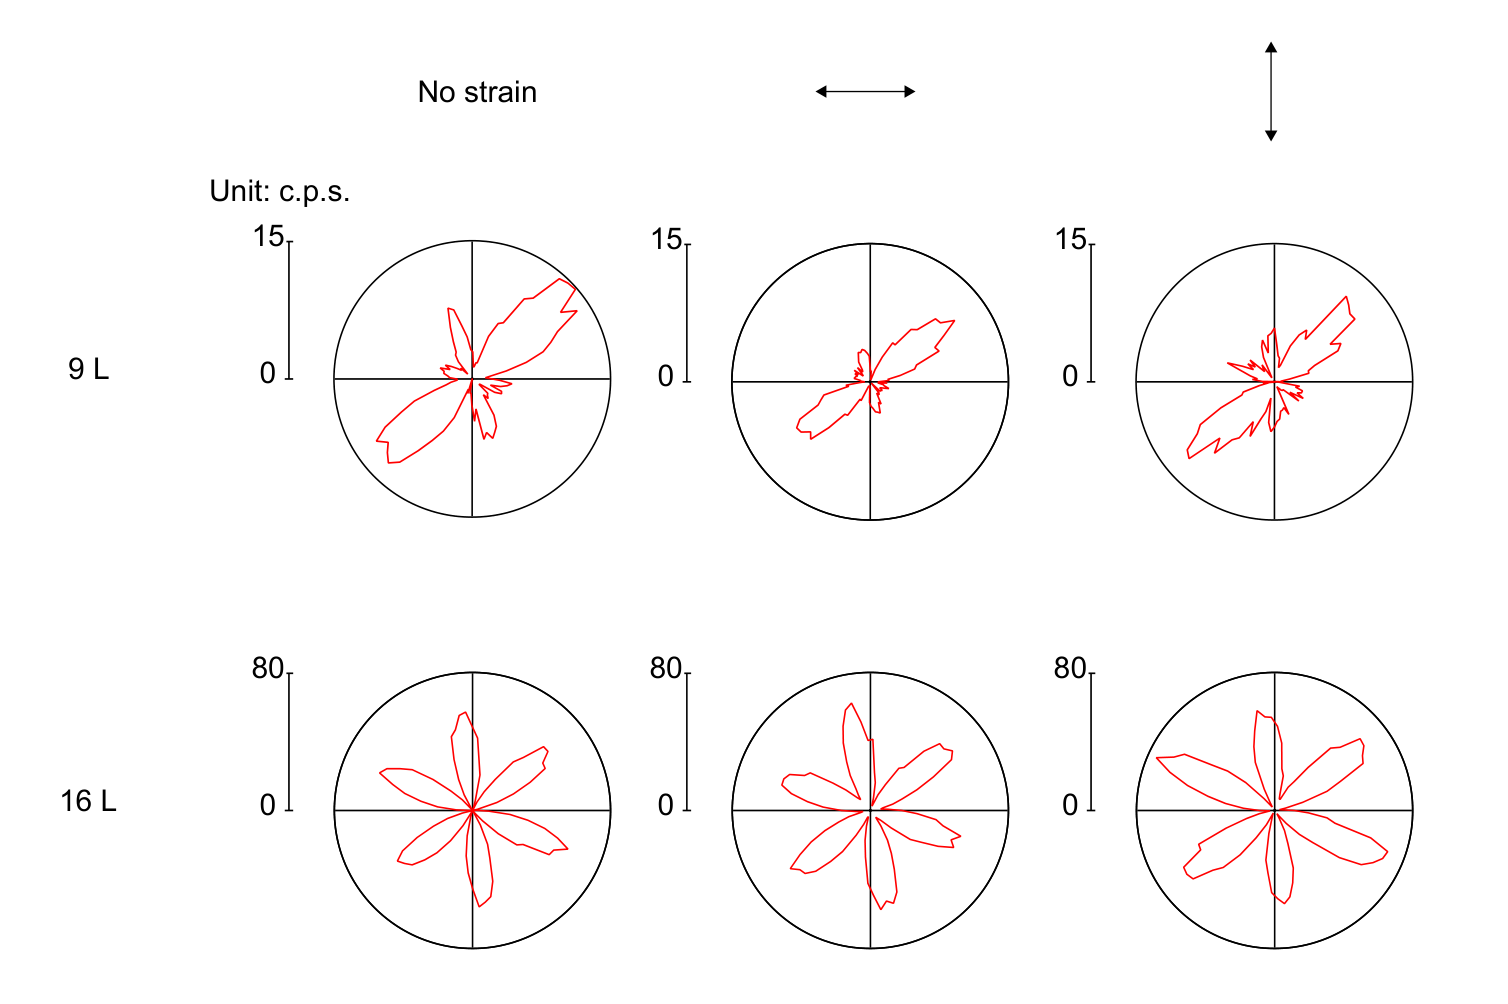
To further justify our statement, we did a strain-tuning experiment on both thick and thin MnPS3 samples. MnPS3 were exfoliated on a polydimethylsiloxane (PDMS) substrate. The flexibility of the PDMS film enabled us to add strains on the samples in any directionLiu et al. 2014; Zhang et al. 2016; Ni et al. 2021. We used a micro-mechanical stage to apply around 5% uniaxial strain on the PDMS, which is then attached to a gold-coated wafer. The transfer ratio of the strain is reported to be around 13-15% Liu et al. 2014; Zhang et al. 2016; Ni et al. 2021. The adherence between the gold coating and PDMS was strong enough to sustain the strain at 5 K. Fig.S8 shows the results of a 9L sample and a 16L sample measured at 5 K and under different strains applied on the substrates. We did not observe a clear difference between different strains in both samples. Specifically, no obvious mirror symmetry breaking was induced in the 16 L sample.
References
- Chu et al. (2020) Hao Chu, Chang Jae Roh, Joshua O. Island, Chen Li, Sungmin Lee, Jingjing Chen, Je-Geun Park, Andrea F. Young, Jong Seok Lee, and David Hsieh, “Linear Magnetoelectric Phase in Ultrathin Probed by Optical Second Harmonic Generation,” Phys. Rev. Lett. 124, 027601 (2020).
- Wildes et al. (2006) AR Wildes, HM Rønnow, B Roessli, MJ Harris, and KW Godfrey, “Static and dynamic critical properties of the quasi-two-dimensional antiferromagnet MnPS3,” Phys. Rev. B 74, 094422 (2006).
- Muthukumar et al. (1995) V. N. Muthukumar, R. Valentí, and C. Gros, “Microscopic model of nonreciprocal optical effects in Cr2O3,” Phys. Rev. Lett. 75, 2766–2769 (1995).
- Lee et al. (2016) Sungmin Lee, Ki-Young Choi, Sangik Lee, Bae Ho Park, and Je-Geun Park, “Tunneling transport of mono- and few-layers magnetic van der Waals MnPS3,” APL Mater. 4, 086108 (2016).
- Rønnow et al. (2000) HM Rønnow, AR Wildes, and ST Bramwell, “Magnetic correlations in the 2D S= 52 honeycomb antiferromagnet MnPS3,” Physica B: Condens. Matter 276, 676–677 (2000).
- Gong et al. (2017) Cheng Gong, Lin Li, Zhenglu Li, Huiwen Ji, Alex Stern, Yang Xia, Ting Cao, Wei Bao, Chenzhe Wang, and Yuan Wang, “Discovery of intrinsic ferromagnetism in two-dimensional van der Waals crystals,” Nature 546, 265–269 (2017).
- Deng et al. (2018) Yujun Deng, Yijun Yu, Yichen Song, Jingzhao Zhang, Nai Zhou Wang, Zeyuan Sun, Yangfan Yi, Yi Zheng Wu, Shiwei Wu, Junyi Zhu, Jing Wang, Xian Hui Chen, and Yuanbo Zhang, “Gate-tunable room-temperature ferromagnetism in two-dimensional Fe3GeTe2,” Nature 563, 94–99 (2018).
- Mennel et al. (2018) Lukas Mennel, Marco Furchi, Stefan Wachter, Matthias Paur, Dmitry Polyushkin, and Thomas Mueller, “Optical imaging of strain in two-dimensional crystals,” Nat. Commun. 9, 516 (2018).
- Mennel et al. (2019) Lukas Mennel, Matthias Paur, and Thomas Mueller, “Second harmonic generation in strained transition metal dichalcogenide monolayers: MoS2, MoSe2, WS2, and WSe2,” APL Photonics 4, 034404 (2019).
- Liu et al. (2014) Zheng Liu, Matin Amani, Sina Najmaei, Quan Xu, Xiaolong Zou, Wu Zhou, Ting Yu, Caiyu Qiu, A Glen Birdwell, Frank J Crowne, Robert Vajtai, Boris I Yakobson, Zhenhai Xia, Madan Dubey, Ajayan Pulickel M, and Jun Lou, “Strain and structure heterogeneity in MoS2 atomic layers grown by chemical vapour deposition,” Nat. Commun. 5, 5246 (2014).
- Zhang et al. (2016) Qianhui Zhang, Zhenyue Chang, Guanzhong Xu, Ziyu Wang, Yupeng Zhang, Zai-Quan Xu, Shujian Chen, Qiaoliang Bao, Jefferson Zhe Liu, Yui-Wing Mai, Wenhui Duan, Michael S. Fuhrer, and Changxi Zheng, “Strain relaxation of monolayer WS2 on plastic substrate,” Adv. Funct. Mater. 26, 8707–8714 (2016).
- Ni et al. (2021) Zhuoliang Ni, AV Haglund, H Wang, B Xu, C Bernhard, DG Mandrus, X Qian, EJ Mele, CL Kane, and Liang Wu, “Imaging the Néel vector switching in the monolayer antiferromagnet MnPSe3 with strain-controlled Ising order,” Nat. Nanotechnol. 16, 782–787 (2021).