C/2014 UN271 (Bernardinelli-Bernstein): the nearly spherical cow of comets
Abstract
C/2014 UN271 (Bernardinelli-Bernstein) is a comet incoming from the Oort cloud which is remarkable in having the brightest (and presumably largest) nucleus of any well-measured comet, and having been discovered at heliocentric distance farther than any Oort-cloud member. We describe in this work the discovery process and observations, and the properties that can be inferred from images recorded until the first reports of activity in June 2021. The orbit has with perihelion of 10.97 au to be reached in 2031, and previous aphelion at Backwards integration of the orbit under a standard Galactic tidal model and known stellar encounters suggests this is a pristine new comet, with a perihelion of on its previous perihelion passage 3.5 Myr ago. The photometric data show an unresolved nucleus with absolute magnitude colors that are typical of comet nuclei or Damocloids, and no secular trend as it traversed the range 34–23 au. For -band geometric albedo this implies a diameter of km. There is strong evidence of brightness fluctuations at mag level, but no rotation period can be discerned. A coma, nominally consistent with a “stationary” surface-brightness distribution, grew in scattering cross-section at an exponential rate from m to m as the comet approached from 28 to 20 au. The activity rate is consistent with a very simple model of sublimation of a surface species in radiative equilibrium with the Sun. The inferred enthalpy of sublimation matches those of and . More-volatile species such as and must be far less abundant on the sublimating surfaces.
For submission to ApJ Letters \reportnumFERMILAB-PUB-21-449-AE
I Introduction
Our knowledge of the content of the Oort cloud is highly fragmentary—all inferences are based upon the small subset of its members that are torqued into orbits with perihelia and until recently only the subset of these which develop comae bright enough to be noticed as comets. The cometary activity makes the objects easier to find and makes it easier to identify the composition of the surface volatiles, but it can also obscure the properties of the nuclear body. The diversity of Oort cloud bodies has only recently begun to be explored, with the discovery of objects having varying levels of activity beyond the water frost line at (Meech et al. 2009; Sárneczky et al. 2016; Jewitt et al. 2017; Jewitt et al. 2021; Meech et al. 2017; Hui et al. 2018; Hui et al. 2019). The discovery of C/2014 UN271 (Bernardinelli-Bernstein) (BB hereafter, for brevity) has expanded this known diversity substantially: as we will elaborate below, it is probably the largest Oort body ever found (indeed the largest of any kind of comet), and the first high-quality observations were taken when BB was at heliocentric distance in 2014, well before the first announced detection of coma in June 2021 at In this work we will summarize the observations in which BB was discovered, and the inferences about its composition and history that can be made from these and other images taken until the recent first announcement of detectable activity.
BB was discovered as part of the search for trans-Neptunian objects (TNOs) in the 80,000 exposures taken by the Dark Energy Survey (DES) in the period 2013–2019 described fully in Bernardinelli et al. 2021. We refer to this paper for details of how million single-night transient detections were identified and potential TNOs linked from amongst them. The discovery of BB was somewhat fortuitous because the search algorithms targeted objects at while BB was closer than this for all but its first DES exposures. The DES search should therefore not be used to estimate the density of Oort-cloud members like BB, though we can say that any object having and for years of DES observing would have a high probability of detection.
BB appears in 42 DES survey images in the filters on 25 distinct nights spanning 10 Oct 2014 to 26 Nov 2018. Some of these images have artifacts that preclude precision photometry and/or astrometry, leaving 32 useful astrometric measures on 21 distinct nights, and 40 useful flux measures. The Solar System Object Image Search service (Gwyn et al. 2012) finds additional archival imaging of BB from WISE, CFHT, VST, VISTA and PanSTARRS observatories. One VISTA -band “pawprint” from 20 October 2010 contains a measurable image of BB, extending the arc and photometric record to We measure positions and fluxes of BB in a series of 4 CFHT exposures taken just before the first DES exposures, but do not attempt to measure the contemporaneous -band exposure, which has only a marginal detection. The object is not detectable in WISE images taken during its primary mission in 2010 (E. Wright, private communication). We did not attempt to recover BB from the VST images, even though some are previous to the DES epoch, since these have shorter exposures on a smaller telescope. We also extract magnitudes from the TESS spacecraft imaging of the comet as it traversed Sector 3 in Sep–Oct 2018 and Sectors 29/30 in Aug–Oct 2020. Circumstances, positions, fluxes, and uncertainties for BB in these exposures are listed in Table 2, with the TESS series each combined to a single mean flux.
Within 24 hours of publication of the DES discovery in MPEC 2021-M53 (Bernardinelli & Bernstein 2021) on 19 June 2021, images were taken showing visible coma (Demetz et al. 2021; Kokotanekova et al. 2021; Buzzi & Lister 2021). Analysis of TESS data of BB indicated a large coma in 2018 (Farnham 2021) and no detectable rotation period (Ridden-Harper et al. 2021). In the next section we examine the recent dynamics of BB. Section III examines the properties of the comet nucleus, and Section IV examines the onset of activity before 2021.
II Astrometric properties
II.1 Measurements
The DES astrometry is mapped to Gaia DR2 (Gaia Collaboration et al. 2018), using the astrometric model presented in Bernstein et al. 2017. All distortions due to the telescope, instrument and detections are known to mas RMS, and the color-dependent effects (differential chromatic refraction in the atmosphere and lateral color distortions) are corrected using the object’s mean color. The position uncertainties for the DES exposures (2014–2018) include the shot noise from each detection as well as an anisotropic contribution from the atmospheric turbulence (Bernardinelli et al. 2020). For the VISTA (2010) and CFHT (2014) images, we retrieve detrended images from the archives, remeasure the positions using SExtractor windowed centroiding, and produce a polynomial astrometric solution in the vicinity of BB by referencing nearby stars from the Gaia DR2 catalog. Astrometry for the PanSTARRS1 (2014–2019) exposures is extracted using Gaussian fits to the comet and to field stars, with the latter referenced to DR2. One PS1 exposure is a outlier from the orbit fit and is excluded from further consideration.
II.2 Orbital properties and previous perihelion
We determine the object’s orbit using the method of Bernstein & Khushalani 2000, and we do not include non-gravitational forces in the orbit fit, as these have not been detected for BB yet. The orbital elements and derived uncertainties are presented in Table 1, and yield . Considering only DES observations yields a consistent orbit with larger uncertainties and The semi-major axis and inclination of the incoming orbit are 20,200 au and 955, respectively, fully characteristic of Oort-cloud membership. Perihelion of 10.95 au will be reached on 21 Jan 2031. The semi-major axis will be increased by 40% after this perihelion.
| Epoch | (au) | (JD) | ||||
|---|---|---|---|---|---|---|
| 1950 | 0.999458(4) | 954663 | 1900029 | 3262793(3) | 2462887.94(4) | |
| 2100 | 0.999610(2) | 954606 | 1900093 | 3262438(4) | 2462887.87(9) |
assuming only gravitational forces. Uncertainties in the last digit are given in parentheses where they are sufficiently large.
Note. — Elements are given at epochs before and after the current passage through the realm of the giant planets,
It is of substantial interest to determine whether BB has been appreciably warmed on previous perihelion passages. We study the past dynamics of BB using a numerical procedure similar procedure to that of Królikowska & Dybczyński 2018, and also by analytic approximations. We will consider perturbations by the Galactic tidal tensor , assumed (Heisler & Tremaine 1986, as in) to be diagonal in the Galactic frame rotating with the Sun where points to the Galactic center and points to the North Galactic pole. This translates to a contribution to the Hamiltonian of the system in the form (Fouchard 2004)
| (1) |
We adopt the nominal Oort constants (Oort 1927) , from Li et al. 2019 and a local stellar density from Vokrouhlický et al. 2019, so we have , and . The angular velocity of the Sun is .
The numerical approach is to integrate, backwards in time, clones of the orbit solution sampled from the state vector covariance matrix. We use the WHFast (Wisdom & Holman 1991; Rein & Tamayo 2015) integrator of REBOUND (Rein & Liu 2012), and include the giant planets as active perturbers as well as the effects of the Galactic tide using REBOUNDx (Tamayo et al. 2020). Figures 1 show the histogram of previous-orbit perihelion distance and time from numerical integration of the sampled orbits, which are near and 3.41 Myr, respectively.
Analytically, we calculate the change in angular momentum imparted by the tidal torque over a full orbit in the limit where the orbit is fully radial, Near this limit, where is the barycentric gravitational constant and is the perihelion. We define as the unit vector toward perihelion (inverse of aphelion direction). The Born approximation then yields This yields a previous perihelion of 18.3 au for the nominal orbit, in agreement with the numerical integration. The ascending node of the previous passage has in the numerical integrations, leaving a chance of an encounter within 2 au of Uranus. In the absence of such a perturbation, the perihelia of preceding orbits would have been increasingly higher.
We may also use the impulse approximation to assess the angular momentum imparted by passages of stars close to the Sun during the previous orbit. For a star with mass with closest approach to the Sun at point and velocity , while the comet is at position , the angular momentum imparted is
| (2) | ||||
| (3) |
We use the list of reliable close stellar encounters ( pc) derived from the Gaia DR2 catalog by Bailer-Jones et al. 2018, restricted to those with perihelion times relative to present. We updated the stellar parameters for each star to the values and uncertainties given in Gaia EDR3 (Gaia Collaboration et al. 2021). This removes a very strong perturber from this list (DR2 955098506408767360) and some others, leaving 8 potential encounters over BB’s previous orbit (Bobylev & Bajkova 2020, see also). We assume linear motion for the perturbing stars and sample from the Gaia uncertainties. The net effect of these encounters is to slightly decrease , i.e. to raise the previous perihelion by an amount that is well below the effect of the Galactic tide. The left-hand panel of Figure 1 shows the histograms of previous perihelion distance derived from the analytic approximations for the Galactic tide alone (in orange, sampling from BB’s orbital uncertainties) and for the Galactic tide plus stellar encounters (in green).
The conclusion, which is robust to the details of the tidal model or these 8 stars’ dynamics, is that the previous passage of BB was further from the Sun than the current one. Indeed, under the tidal model the perihelion has been getting smaller with each successive passage for many orbits into the past. We conclude that BB is a “new” comet in the sense that there is no evidence for previous approach closer than 18 au to the Sun since ejection into the Oort cloud. Indeed, this may be the most pristine comet ever observed, in that we have detected it before it comes within Uranus’s orbit, and it may never have done so on any previous orbit. It remains true, however, that our knowledge of stellar encounters is incomplete, and it is possible that some yet-unknown star’s passage could have lifted BB’s perihelion from a lower value to its present one.
III Nuclear properties
III.1 Measurements
We measure the flux in each DES image using scene-modeling photometry, similar to Brout et al. 2019. We define a target region around each detection of pixels (at 0264/pix), and simultaneously fit a model for the object’s flux and the background sources to all DES images from the same filter in this region of the sky. The background is modeled as a grid of point sources that is present in all images, while the object is modeled as a point source present in only the detection image. Each point source is convolved with the point-spread function (PSF, see Jarvis et al. 2020 for a detailed description of the DES PSF model) of each pixel location in each exposure. This procedure also allows us to measure fluxes in exposures in which there is no detection of the object, but the orbit indicates its presence. Thus as seen in Table 2 there are DES images having photometry but no useful astrometric data. The resultant fluxes and errors are rigorously correct for an unresolved image, essentially using the central few arcseconds’ signal, and thus insensitive to any coma that does not have a central concentration. The measures of diffuse flux in Section IV confirm that potential contamination of these point-source fluxes by coma flux will be small for the DES data. The same is not true for any of the images taken after 2018—we will not use these in attempts to characterize the nucleus, but will return to them when characterizing the coma. Flux calibration for all DES exposures is determined to mmag precision as described in The Dark Energy Survey Collaboration 2021.
For the VISTA and CFHT detections, we acquire detrended images from their respective archives,11 1 http://archive.eso.org/wdb/wdb/adp/phase3_vircam/form and https://www.cadc-ccda.hia-iha.nrc-cnrc.gc.ca/en/cfht/ and use MAG_AUTO measurements from SExtractor (Bertin & Arnouts 1996). Each exposure is placed on the DES magnitude system by choosing a zeropoint to match the magnitudes found in the DES coadd catalogs in the corresponding filter for matching objects in field. Bandpass differences between the VISTA and CFHT filters and their DES counterparts lead to color corrections that are well below the measurement errors on these points, and are ignored.
The PS1 photometry given in Table 2 is derived by fitting Gaussians to the comet images and to stars of known magnitude (the -band images use -band magnitudes of the standards), and scaling the Gaussian fits. This photometry is less reliable and has lower than DES data, so we will not make use of it in characterizing the nucleus. The PS1 measurements taken in 2019 are, however, valuable for characterizing the development of coma between the end of DES in 2018 and the 2021 recoveries. We extract aperture photometry for these images around the predicted positions of BB to form the curves of growth shown in Section IV. The magnitude zeropoints of the and images are determined by comparison of 6″-diameter aperture photometry of bright stars to their - and -band magnitudes in the DES catalogs. The color terms between PS1 and DES bands are again well below the measurement errors (The Dark Energy Survey Collaboration 2021, Eq. B6 of).
TESS observations consist of “sectors,” degree regions of the sky observed nearly continuously for approximately four weeks (Ricker et al. 2015). In its survey of the southern sky, TESS observed BB in three sectors, one in late 2018 and two in late 2020. For all three sectors, we identify and cut out an approximately degree region of the TESS full-frame images (FFIs) along the path of the comet with the tesscut tool (Brasseur et al. 2019). We then apply a difference imaging scheme aimed towards removing background stars by, for each frame and each pixel, subtracting the mean flux observed in that pixel in all cadences observed between 5 and 10 hours from the time of the frame of interest.
At each frame, we then measure the flux of the target in an aperture of of TESS’s 21″ pixels. We apply the same method to nearby stars on the detector with low () levels of photometric variability and well-characterized TESS magnitudes to transform our measured fluxes to magnitudes. The scatter of the residuals for stars on this scale is 0.15 magnitudes, likely due to crowding of faint stars and intrapixel sensitivity variations on the TESS detector (Vorobiev et al. 2019). These issues should be less dramatic for BB due to its motion across the detector, nonetheless we apply this 0.15 magnitude uncertainty conservatively on the individual magnitudes. The brightening of mag between the two TESS epochs is more reliably determined than the magnitude at either epoch. For an object of solar color, we should find mag (Willmer 2018; Stassun et al. 2018).
III.2 Color, variability, and size
We fit all of the valid photometry from VISTA, CFHT, and DES to a model in which there is a fixed absolute magnitude in each band , and an achromatic light curve fluctuation These data are plotted in Figure 2. The illumination phase is between 14 and 25 for all observations here, so we ignore phase terms in converting observed magnitudes to . We have insufficient data to determine the light-curve phases for each exposure, so we consider each observation to have a random, independent The posterior probability of the light curve amplitude and the “true” , given observations of in band with uncertainty for each observation , is
| (4) |
Figure 3 (left) plots the posterior probability for the light-curve semi-amplitude All of the bands are consistent and combine to yield mag. This is a strong detection of variability in excess of the measurement errors. From Figure 2 it is clear that most of this variability is in short-term variation, not a long-term trend, consistent with a nuclear body with 10–20% departures from sphericity. Ridden-Harper et al. 2021 report a non-detection of variation in the TESS photometric time series, though no upper limit is reported. The TESS photometry has the majority of its flux coming from the coma, which will suppress the amplitude of any nuclear light curve.
The fitting process yields estimates of the mean absolute magnitude of the comet of in the bands, respectively. Figure 3 (right) plots the implied reflectivity in each band, normalized to unity in the band, showing a color only slightly redder than neutral, perhaps even slightly blue in . An alternative method of deriving colors for BB is to find pairs of exposures taken in different bands within 5–10 minutes of each other, so that light-curve variations are unimportant. This results in color estimates of ; ; ; and These agree with the mean- method, except that the pair-based color is significantly redder.
Jewitt 2015 presents colors for various outer-solar-system bodies, quantified by a fit to a model of linear reflectance vs wavelength with slope of per 100 nm when normalized to unit reflectivity at 550 nm (-band). The solid line in the right panel of Figure 3 shows that approximates the data for BB, though with a potential absorptive feature in the -band. Jewitt 2015 reports that potential relatives of BB, namely long-period comet (LPC) nuclei and Damocloids, have typical values of 10 and 15, respectively. These Oort bodies are significantly bluer than the TNO populations. Comet BB shares this deviation from the TNO colors, in fact appearing a bit more neutral than the few other well-measured Oort-cloud migrants.
If the flux measurements in these exposures were significantly contaminated with coma rather than being predominately nuclear, we might expect the measured to increase as the comet approaches the Sun. In Figure 4, we present the averaged over all photometric observations from a given season. Exposures from band are shifted to band using the from the posterior maximization above. An RMS error of mag is added in quadrature to each measurement error to include noise from random sampling of a sinusoidal light curve. While the year-to-year means of the DES observations are formally inconsistent with a constant magnitude, the potential year-scale variation is small ( mag) and shows no long term trend. Indeed the 2010 VISTA observation is consistent with a constant magnitude as well, so there is no evidence for a brightening of BB’s absolute magnitude as it moves from to 23.7 au for apertures of size.
Under the assumption that the derived above is entirely from a spherical nucleus with geometric albedo in the band of and density the diameter, mass, and escape velocity of BB are
| (5) | ||||
| (6) | ||||
| (7) |
At the nominal assumed albedo, this makes BB a factor of 2.5 larger in diameter than C/1995 O1 (Hale-Bopp) (Fernández 2002), another LPC that is the largest of any comet in the past century (Lamy et al. 2004), and had at incoming (Szabó et al. 2012).
IV Coma development
The TESS photometry, plotted as stars in the left-hand panel of Figure 4, shows a definitive 1.5 mag increase in during the two-year journey from to 21.2 au, after the DES observations end, from which we infer an increase in activity before the June 2021 discovery of the coma at More surprisingly, the TESS images from 2018 show a substantially brighter than the DES photometry at the same time period, by mag. Furthermore, Farnham 2021 reports that the 2018 TESS images are resolved, with a Gaussian fit yielding of the 21″ pixels, while unresolved sources are pix. A simple quadrature subtraction suggests that the intrinsic comet angular size is at least 2.06 pix e.g. a Gaussian with A coma of this size would have gone undetected in the DES scene-modelling photometry if the coma did not have a strong central concentration in the inner 1–2″.
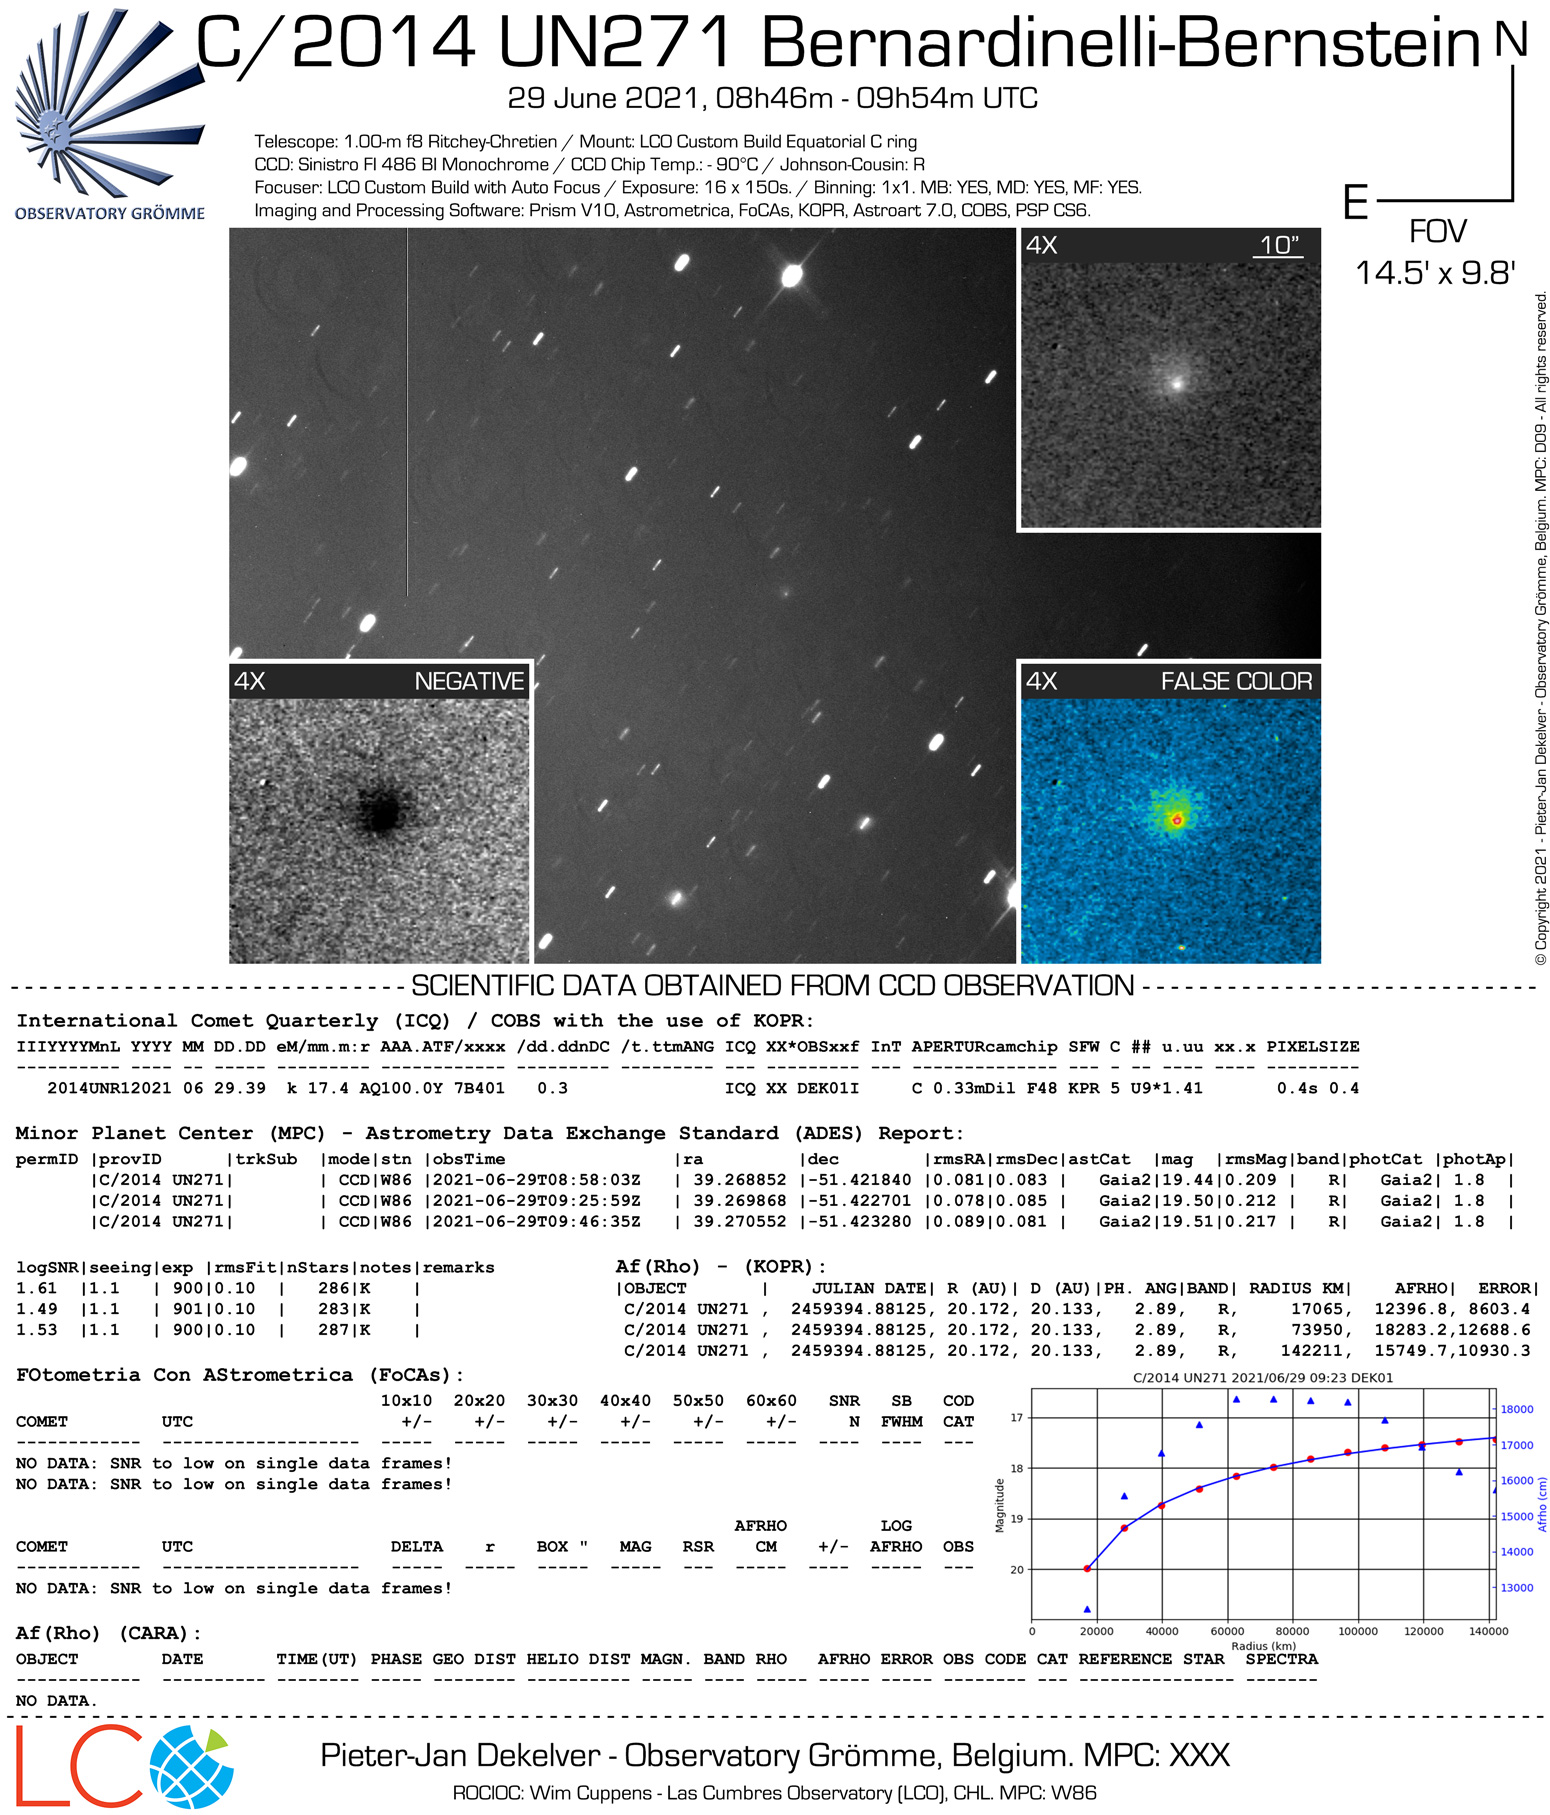
With this in mind we re-analyze the DES images and the PS1 images from 2019 for signs of 10″-scale emission. Figure 4 (right) shows the curves of growth derived from aperture photometry of these images, as well as June 2021 observations reported by Kokotanekova et al. 2021 and Dekelver 2021. It is apparent that the coma was already present in the PS1 images at indeed also for most of the DES observations, albeit not at a level that precludes our attribution of the PSF-fitting fluxes to the nucleus.

The curve of growth from the DES 2018 season is plausibly consistent with the measured TESS magnitude made in its square aperture during the same season. Post-DES imaging clearly shows exponential increase in coma brightness, which we will quantify below.
We take a closer look at the structure and history of the coma during the DES epochs using the residual images produced by the scene-modeling photometry after subtraction of the static sky background and the best-fit central point source. Each image is scaled to -band assuming solar colors—unfortunately we have insufficient to meaningfully constrain the coma color. Residual artifacts from defects, cosmic rays, and misregistration are masked. Figure 5 shows the inverse-variance-weighted average of these, split between the first three seasons () and the last two ( Growth of a tail or asymmetric coma during this epoch is apparent. An anti-solar tail would point downwards in this image stack; the observed diffuse light is away from anti-solar.
More quantitative measures of the growth of coma are plotted in Figures 6. The left panel shows the results in the observational space of surface brightness in annular bins of radius. The surface brightness scaling with radius is consistent either a “stationary” coma, as expected if dust particles move ballistically at fixed from the nucleus; or with as is suggested by models of radiation-pressure-dominated escape (Jewitt & Meech 1987). We are pleased to see that the coma is well measured even at surface brightness below 30 mag arcsec-2, which generates /sec/pixel in the images, a tribute to the quality of the image calibration and the background subtraction in the scene-modelling method.
The standard measure of coma surface brightness is , where is the geometric albedo and is the filling factor of the reflecting particles, conventionally measured as the average interior to radius For a stationary coma, this quantity is invariant with the distances from the source, the sun, and the observer (A’Hearn et al. 1984; Fink & Rubin 2012). We transform the surface brightness into via
| (8) | ||||
| (9) |
where is the absolute magnitude of the sun, and is the observed surface brightness per arcsec The right panel of Figure 6 plots the inferred from fitting a stationary coma model to each DES exposure at radii from the nucleus, and averaging over each season’s averaged observations. This is plotted vs , and we include values taken from later observations. From Dekelver 2021, we take the uncertainty to be the span of values determined at different radii. For the PS1 observations, we apply a generous standard error. The data exhibit an exponential increase in the dust content of the coma, growing with each au reduction in The TESS data even exhibit this rate of brightening within the duration of its 2020 observing (8% per month). At the uncertainties are large enough to admit a wide variety of behavior, e.g. even a constant coma surface brightness as might occur if BB entered the inner solar system with a gravitationally bound “dirtmosphere” of particles accumulated through impacts over millions of years.
V Discussion
BB has uniquely high quality photometric data through the initial growth period of its coma, with direct detections of coma out to We expect future work to produce detailed thermal and dynamical modeling of the comet, but here we show that a very simple model fits the observations well.
V.1 Sublimating species
For a single species with molecular mass sublimating into vacuum from a surface, the mass loss rate per unit area is
| (10) | ||||
| (11) | ||||
| (12) |
where is the saturation vapor pressure, and we use the Clausius-Clapeyron formula to express its dependence on temperature in (11). is the enthalpy of sublimation (which we assume varies little with ) and is the ideal gas constant.
Under radiative equilibrium with negligible heat conduction with the cometary interior and negligible heat loss to sublimation, a section of the surface attains temperature with
| (13) | ||||
| (14) | ||||
| (15) |
In these equations, is the Stefan-Boltzmann constant, is the Bond albedo of the surface (nominally 0.04), and is the infrared emissivity (nominally 0.9). With as the angle between illumination and the normal, the average over the thermal time scale for the warmest part of the comet (which will dominate the sublimation rate at low ) will be between 1 (at the subsolar point for short thermal time constant, or for a pole-on rotator) and for the equator of a orthogonal rotator with long time constant. We bundle all of these physical/geometric constants in the first term of (14 into a factor which is nominally close to unity but could be as low as
The third part of the simple model is to relate the coma brightness to the sublimation rate. If the scattering is dominated by solid particles with albedo , radius and near-spherical, geometric cross-section, density , production rate , and velocity , then
| (16) |
If we assume that and the dust-to-gas ratio are independent of heliocentric distance over the 20–30 au range, we obtain a scaling
| (17) |
Note that this proportionality does not require the geometric-scattering limit to hold, only that scattering per unit mass of dust is time-invariant. Combining this with Eq. (12) yields
| (18) |
One working assumption for is that it will scale with the thermal velocity, i.e. A stronger dependence would be expected if the dust velocity is driven by radiation pressure:
The left panel of Figure 7 plots on the (logarithmic) axis, vs on the axis, assuming radiative equilibrium for and As per Eq. 18, the data should follow a line with slope on this plot for sublimation of a single species. The data are seen to be consistent with this model, with a value of that depends on whether we take the fast- or slow-rotator limit for in the radiative equilibrium formula.
The right panel of Figure 7 plots the result of a quantitative fit of Eq. 18 to the measurements as function of , marginalizing over the unknown constant. In the nominal (red) case, the inferred enthalpy of sublimation is fully consistent with the lab-measured values for and/or and clearly inconsistent with the more volatile species and . As is well known, is ruled out as a volatile at these distances as well. The values of are taken from Luna et al. 2014; Feistel & Wagner 2007. The green dashed curve changes the scaling of vs from thermal to radiation-pressure laws, and does not change the conclusion. Moving to the fast-rotator value yields proportionately lower values, still better associated with and
The coma growth rate is thus strongly suggestive of activity powered by and/or sublimation at , with slow and/or pole-on rotation somewhat favored to yield higher peak surface temperatures. Across the range of potential surface temperatures, the mass loss rate per square meter from pure is larger than that from a pure ice surface, so the former is more likely to drive activity.
At the coma is too weak to be well measured in the data. It is possible that more volatile species ( or ) could have dominated sublimation at these times. These latter species, however, have orders of magnitude higher vapor pressure (and specific sublimation rates) than and do at K, the subsolar temperature for Any surface abundance in their pure ice forms on the surface of BB must be very low relative to the / that appear to dominate sublimation at Perhaps these more-volatile species were heavily sublimated from BB during its previous perihelion passage to , leaving behind a crust that is largely depleted in these most volatile species. Or perhaps this depletion is a remnant of the thermal environment at the original location of formation of BB.
We have not investigated activity powered by phase changes or annealing of ices.
V.2 Dust production
The dynamics of dust production on BB are made more interesting by the fact that the escape velocity of m/s is above or comparable to the dust velocities estimated for other comets, e.g. m/s for Comet Boattini (Hui et al. 2019) or m/s for C/2017 K2 (Jewitt et al. 2019). The low sublimation rates and pressures for BB at may limit the size of particles that can be raised and attain escape by the gas, and/or the coma may be dominated by small grains that are driven to escape by radiation pressure. The coma is observed to be asymmetric in its 2021 observations, in the 2018 DES data (Figure 5), and potentially in the TESS observations (Farnham 2021), implicating radiation pressure or tidal escape mechanisms for the dust. High-quality imaging of the coma as soon as possible would be of great interest in constraining the dust size and dynamics.
If a fraction of the surface of BB is sublimating at the rates described in Eq. 10, then the gas mass loss rate from BB rises from to kg/s when closing from 26 to 20 au. This assumes (slow rotator), and the vapor pressure cited by Fray & Schmitt 2009. A non-porous, pure- ice patch at the subsolar point would be eroded by 0.1 mm/yr at 26 au, increasing to 2 cm/yr at its current
Adopting the simplistic model of Eq. 16 and a uniform streaming velocity where is the RMS 1d thermal velocity of a molecule, then we can solve for the dust particle radius as
| (19) | ||||
| (20) |
We take as the nominal radius of the comet, is the mass of a molecule, and albedos of for both comet and its debris, and the observed values of to obtain (20). The nominal values of and are ill-supported order-of-magnitude estimates. The implied dust particle radius may even be over-estimated as the assumption of of the surface being ice near the subsolar temperature may be an over-estimate. It nonetheless suggests that the coma has small particles, indeed small enough that the assumption of geometric scattering cross-section needs to be relaxed. Small dust particles might be expected because of the anemic gas flow density and the importance of radiation pressure in overcoming BB’s gravity. Clearly a more detailed model of the dust dynamics would be of interest.
V.3 Comparison to other distant LPCs
Opportunities to study incoming comets at have been rare enough that there is no definition of “typical” behavior. It is already clear that the behavior is diverse. It is good to keep in mind that selection biases will favor the discovery at large distances of comets that are unusually active or, like BB, unusually large.
Comet C/2017 K2 (PanSTARRS), (hereafter “K2”) has similar aphelion and inclination to BB, but Królikowska & Dybczyński 2018 report it to have a 97% chance of having passed within on its previous passage. It was discovered at but precovery images at also display coma (Hui et al. 2018).
K2 is much smaller than BB, with estimated nuclear radius km (Jewitt et al. 2017). These authors infer K2’s coma to be comprised of mm-scale particles moving at speeds of m/s—which would probably not escape BB—and estimate that K2 has been expelling such particles at a relatively steady and isotropic rate since This is in stark contrast to BB’s exponentially growing scattering cross-section in the 20–30 au range.
Comet C/2010 U3 (Boattini) was discovered inbound at and precovered on earlier images at and 24.6 au, with visible coma (Hui et al. 2019). Like K2, Boattini is thought to have had its previous perihelion at , yet its coma behavior is quite distinct from K2’s, showing intermittent outbursts and a tail inferred to be composed of much smaller particles than K2’s.
K2, Boattini, and BB display very diverse activity patterns at . K2 has a steady, large-particle coma, Boattini exhibits outbursts and a tail, while BB undergoes exponential growth in cross-section over this period that is consistent with simple sublimation thermodynamics of carbon dioxide and/or ammonia. No generalized pattern is apparent yet, aside from the existence of activity in some form out to and even this ubiquity can be favored by selection effects.
VI Summary
C/2014 UN271 (Bernardinelli-Bernstein) is arguably the largest and most pristine comet ever discovered. Assuming a typical albedo, its diameter of km implies a mass larger than Hale-Bopp, and capable of gravitationally binding many of the larger particles ejected from other comets. The object is at present from the sun, and its previous perihelion was likely at so this may be the only comet ever measured before any approach to Its nucleus has nearly gray reflectivity, in common with (or slightly bluer than) previously observed objects with Oort-cloud origins.
Variation in the absolute magnitude of the nucleus is strongly detected, and consistent with a mag sinusoidal light curve. The data are too sparse to actually derive a light curve.
We are able to detect the presence of activity in DES images starting with the 2017 season, at which grows exponentially with approach to The rate of growth is consistent with sublimation of a species with enthalpy of sublimation near the 26 kJ/mol of (or ). The coma measurements at have too low to characterize the behavior, so these earlier phases of activity could e.g. be dominated by other species’ sublimation. BB is thus an outlier among the (notoriously unpredictable) population of comets in that its onset of activity follows simple sublimation thermodynamics to date, i.e. it is (so far) a “spherical cow.” Perhaps this behavior is related to the fact that it is also an outlier in size and in its relatively uneventful past thermal history.
It is usually a losing proposition to speculate on the future behavior of comets, even one such as BB whose activity has followed a simple model to date. Ignoring this warning, we can make an estimate of BB’s brightening if its scattering cross-section continues to grow in proportion to the sublimation rate in radiative equilibrium as it reaches its 11 au perihelion in a decade. The sublimation rate will grow to a level at which most of the incident solar flux is turned to sublimation enthalpy. The mass loss rate then scales with the fraction of the surface material composed of ice near the subsolar point. If this is 10%, then the sublimation rate will be above its value in June 2021. Combined with the brightening, BB would be 8.5 mag brighter in apparent magnitude at perihelion than the magnitude currently report in large apertures (Dekelver 2021)—i.e. a bit fainter than Titan. If a water-ice crust forms and blocks sublimation, the coma would be suppressed. If the sublimation spreads across more of the comet’s surface, it could be substantially brighter. It will be an impressive telescopic target, and its large surface area may generate a substantial -powered coma and tail despite remaining far outside the water-ice line.
The catalog of distant incoming Oort comets is likely to grow rapidly in the next decade, as the Vera C. Rubin Observatory Legacy Survey of Space and Time will easily detect and track any object of half BB’s size that comes within in the next decade, even those with no activity, obtaining hundreds of exposures in multiple bands for each.
| UTC | RA | Dec | Error | Source | Mag | Band | Helio. dist. | Geo. dist. |
|---|---|---|---|---|---|---|---|---|
| (au) | (au) | |||||||
| 2010-11-15.238223 | 01:19:36.7532 | -30:42:27.260 | 0105 | VISTA | 22.470.26 | z | 34.07 | 33.52 |
| 2014-08-14.599780 | 01:42:23.9960 | -35:36:37.600 | 0078 | PS1 | 23.100.20 | i | 29.28 | 28.74 |
| 2014-08-28.601410 | 01:41:25.1473 | -36:02:11.803 | 004 | CFHT | 22.390.09 | r | 29.23 | 28.59 |
| 2014-08-28.606693 | 01:41:25.1180 | -36:02:12.397 | 009 | CFHT | 23.050.08 | g | 29.23 | 28.59 |
| 2014-08-28.609338 | 01:41:25.1015 | -36:02:12.632 | 006 | CFHT | 22.140.17 | i | 29.23 | 28.59 |
| 2014-08-28.612016 | 01:41:25.0891 | -36:02:13.023 | 004 | CFHT | 22.690.12 | r | 29.23 | 28.59 |
| 2014-10-20.294348 | 01:34:35.0187 | -37:14:46.144 | 0068 | DES | 22.620.10 | r | 29.05 | 28.36 |
| 2014-11-04.122035 | 01:32:21.0290 | -37:23:21.138 | 0050 | DES | 22.090.12 | z | 28.99 | 28.41 |
| 2014-11-14.258286 | DES | 21.930.46 | Y | 28.96 | 28.46 | |||
| 2014-11-15.251906 | 01:30:47.0392 | -37:25:39.196 | 0047 | DES | 22.320.16 | z | 28.95 | 28.47 |
| 2014-11-18.235595 | 01:30:23.4255 | -37:25:40.010 | 0040 | DES | 22.520.05 | r | 28.94 | 28.49 |
| 2014-11-18.238347 | 01:30:23.4067 | -37:25:39.984 | 0041 | DES | 22.220.07 | i | 28.94 | 28.49 |
| 2014-11-27.221480 | 01:29:17.5832 | -37:24:12.514 | 0113 | DES | g | 28.91 | 28.55 | |
| 2014-12-11.115676 | 01:27:54.8295 | -37:17:49.638 | 0084 | DES | 22.430.09 | i | 28.86 | 28.67 |
| 2014-12-11.144452 | DES | 22.570.62 | Y | 28.86 | 28.67 | |||
| 2015-01-09.107010 | 01:26:35.3245 | -36:51:38.750 | 0130 | DES | 22.650.30 | z | 28.76 | 28.94 |
| 2015-08-11.612980 | 01:47:05.4300 | -37:26:12.860 | 0102 | PS1 | 23.330.22 | i | 27.99 | 27.49 |
| 2015-08-17.357470 | 01:46:47.5049 | -37:37:39.814 | 0053 | DES | 22.640.08 | r | 27.97 | 27.42 |
| 2015-08-17.358826 | 01:46:47.5170 | -37:37:39.886 | 0080 | DES | 22.990.09 | g | 27.97 | 27.42 |
| 2015-08-24.344520 | 01:46:18.6053 | -37:51:28.614 | 0060 | DES | 23.120.09 | g | 27.94 | 27.35 |
| 2015-08-24.347311 | DES | 22.530.07 | r | 27.94 | 27.35 | |||
| 2015-08-24.348700 | DES | 22.380.08 | i | 27.94 | 27.35 | |||
| 2015-09-01.306625 | DES | 22.460.54 | Y | 27.92 | 27.27 | |||
| 2015-09-02.377866 | 01:45:30.1964 | -38:08:52.304 | 0085 | DES | 21.940.28 | Y | 27.91 | 27.26 |
| 2015-09-13.390509 | 01:44:15.8625 | -38:28:51.622 | 0073 | DES | 22.470.10 | i | 27.87 | 27.17 |
| 2015-10-06.274354 | 01:40:59.7742 | -39:03:19.836 | 0147 | DES | 22.180.17 | z | 27.79 | 27.08 |
| 2015-11-20.228513 | 01:33:55.0781 | -39:29:32.567 | 0067 | DES | 22.180.14 | z | 27.63 | 27.21 |
| 2015-11-20.235561 | 01:33:55.0098 | -39:29:32.478 | 0058 | DES | 22.500.11 | i | 27.63 | 27.21 |
| 2016-01-11.093863 | 01:29:57.7382 | -38:50:26.056 | 0044 | DES | 22.450.06 | r | 27.44 | 27.64 |
| 2016-01-11.095236 | 01:29:57.7285 | -38:50:25.964 | 0055 | DES | 23.080.09 | g | 27.44 | 27.64 |
| 2016-08-09.585360 | 01:52:24.3560 | -39:29:37.720 | 0090 | PS1 | 23.530.18 | w | 26.68 | 26.21 |
| 2016-08-09.595282 | 01:52:24.3230 | -39:29:39.130 | 0129 | PS1 | 23.450.22 | w | 26.68 | 26.21 |
| 2016-10-01.297615 | DES | 22.100.07 | i | 26.49 | 25.80 | |||
| 2016-10-01.298994 | 01:46:40.1803 | -41:11:31.779 | 0043 | DES | 22.160.05 | r | 26.49 | 25.80 |
| 2016-10-01.300363 | 01:46:40.1727 | -41:11:32.002 | 0069 | DES | 22.630.05 | g | 26.49 | 25.80 |
| 2016-10-03.314076 | DES | 22.430.10 | i | 26.48 | 25.80 | |||
| 2016-10-03.315455 | 01:46:20.1770 | -41:14:24.527 | 0038 | DES | 22.360.05 | r | 26.48 | 25.80 |
| 2016-10-03.316819 | 01:46:20.1667 | -41:14:24.592 | 0050 | DES | 22.810.07 | g | 26.48 | 25.80 |
| 2017-08-13.571449 | 01:58:27.6990 | -41:56:20.770 | 0114 | PS1 | 22.520.18 | i | 25.34 | 24.86 |
| 2017-08-14.585122 | 01:58:24.7020 | -41:58:43.760 | 0054 | PS1 | 21.700.09 | i | 25.34 | 24.85 |
| 2017-09-08.554246 | 01:56:09.8760 | -42:55:16.230 | 0102 | PS1 | 22.000.20 | i | 25.24 | 24.62 |
| 2017-09-30.421878 | 01:52:49.6350 | -43:36:32.720 | 0112 | PS1 | 21.960.15 | i | 25.16 | 24.51 |
| 2017-10-15.272083 | 01:50:05.7460 | -43:57:07.295 | 0056 | DES | 22.290.05 | g | 25.11 | 24.49 |
| 2017-10-15.337769 | 01:50:04.9880 | -43:57:11.797 | 0063 | DES | 21.420.08 | z | 25.11 | 24.49 |
| 2017-10-15.339148 | 01:50:04.9697 | -43:57:11.890 | 0031 | DES | 21.690.04 | r | 25.11 | 24.49 |
| 2017-10-29.358251 | 01:47:22.7320 | -44:09:45.240 | 0145 | PS1 | 21.540.20 | i | 25.06 | 24.52 |
| 2017-11-06.330497 | 01:45:51.8610 | -44:13:42.320 | 0131 | PS1 | 22.080.21 | i | 25.03 | 24.54 |
| 2017-12-11.250030 | 01:40:25.1950 | -44:04:24.940 | 0127 | PS1 | 22.010.15 | w | 24.90 | 24.76 |
| 2017-12-15.180418 | 01:39:59.8371 | -44:00:56.398 | 0029 | DES | 22.050.04 | r | 24.89 | 24.79 |
| 2017-12-15.181814 | 01:39:59.8244 | -44:00:56.379 | 0049 | DES | 22.580.06 | g | 24.89 | 24.79 |
| 2017-12-25.149228 | DES | 21.870.29 | Y | 24.85 | 24.87 | |||
| 2018-09-10.355826 | DES | 22.060.03 | g | 23.90 | 23.31 | |||
| 2018-10-04 | TESS | 20.290.15 | T | 23.82 | 23.21 | |||
| 2018-10-21.243368 | 01:55:54.0391 | -46:47:14.935 | 0075 | DES | 21.600.17 | Y | 23.75 | 23.20 |
| 2018-10-27.178589 | 01:54:38.2037 | -46:52:42.842 | 0041 | DES | 21.590.07 | z | 23.73 | 23.21 |
| 2018-11-08.235135 | 01:52:05.9144 | -46:59:29.069 | 0022 | DES | 21.710.03 | r | 23.69 | 23.25 |
| 2018-11-08.236509 | 01:52:05.8988 | -46:59:29.102 | 0026 | DES | 21.510.04 | i | 23.69 | 23.25 |
| 2018-11-08.237892 | 01:52:05.8841 | -46:59:29.051 | 0032 | DES | 22.230.04 | g | 23.69 | 23.25 |
| 2019-08-19.598297 | 02:14:55.2390 | -47:31:52.370 | 0109 | PS1 | i | 22.64 | 22.18 | |
| 2019-08-29.569869 | 02:14:08.3560 | -47:59:21.660 | 0188 | PS1 | w | 22.61 | 22.10 | |
| 2019-08-29.585234 | 02:14:08.2450 | -47:59:24.350 | 0149 | PS1 | w | 22.61 | 22.10 | |
| 2019-08-29.592922 | 02:14:08.2250 | -47:59:25.260 | 0144 | PS1 | w | 22.61 | 22.10 | |
| 2020-09-21 | TESS | 18.240.15 | T | 21.18 | 20.67 |
Note. — Data marked with are considered unreliable and not used in the analyses. Magnitudes for 2019 PS1 observations are aperture-dependent, so not tabulated here.
References
- A’Hearn et al. (1984) A’Hearn, M. F., Schleicher, D. G., Millis, R. L., Feldman, P. D., & Thompson, D. T. 1984, AJ, 89, 579, doi: 10.1086/113552
- Bailer-Jones et al. (2018) Bailer-Jones, C. A. L., Rybizki, J., Andrae, R., & Fouesneau, M. 2018, Astronomy & Astrophysics, 616, A37, doi: 10.1051/0004-6361/201833456
- Bernardinelli & Bernstein (2021) Bernardinelli, P., & Bernstein, G. 2021, Minor Planet Electronic Circulars, 2021-M53
- Bernardinelli et al. (2020) Bernardinelli, P. H., Bernstein, G. M., Sako, M., et al. 2020, The Astrophysical Journal Supplement Series, 247, 32, doi: 10.3847/1538-4365/ab6bd8
- Bernardinelli et al. (2021) —. 2021, arXiv:2109.03758 [astro-ph]
- Bernstein & Khushalani (2000) Bernstein, G., & Khushalani, B. 2000, The Astronomical Journal, 120, 3323, doi: 10.1086/316868
- Bernstein et al. (2017) Bernstein, G. M., Armstrong, R., Plazas, A. A., et al. 2017, Publications of the Astronomical Society of the Pacific, 129, 074503, doi: 10.1088/1538-3873/aa6c55
- Bertin & Arnouts (1996) Bertin, E., & Arnouts, S. 1996, Astron. Astrophys. Suppl. Ser., 117, 393, doi: 10.1051/aas:1996164
- Bobylev & Bajkova (2020) Bobylev, V. V., & Bajkova, A. T. 2020, Astronomy Letters, 46, 245, doi: 10.1134/S1063773720040039
- Brasseur et al. (2019) Brasseur, C. E., Phillip, C., Fleming, S. W., Mullally, S. E., & White, R. L. 2019, Astrocut: Tools for creating cutouts of TESS images. http://ascl.net/1905.007
- Brout et al. (2019) Brout, D., Sako, M., Scolnic, D., et al. 2019, The Astrophysical Journal, 874, 106, doi: 10.3847/1538-4357/ab06c1
- Buzzi & Lister (2021) Buzzi, L., & Lister, T. 2021, Minor Planet Electronic Circulars, 2021-M83
- Dekelver (2021) Dekelver, P.-J. 2021, C/2014 UN271 Bernardinelli-Bernstein. http://www.astronomie.be/pieterjan.dekelver/Observations/20210629_C2014UN271_Bernardinelli-Bernstein_W86_FULL.jpg
- Demetz et al. (2021) Demetz, L., Buzzi, L., Aletti, A., & Lister, T. 2021, Central Bureau Astronomical Telegrams, CBET-4989
- Farnham (2021) Farnham, T. 2021, The Astronomer’s Telegram, 14759, 1
- Feistel & Wagner (2007) Feistel, R., & Wagner, W. 2007, Geochim. Cosmochim. Acta, 71, 36, doi: 10.1016/j.gca.2006.08.034
- Fernández (2002) Fernández, Y. R. 2002, Earth Moon and Planets, 89, 3, doi: 10.1023/A:1021545031431
- Fink & Rubin (2012) Fink, U., & Rubin, M. 2012, Icarus, 221, 721, doi: 10.1016/j.icarus.2012.09.001
- Fouchard (2004) Fouchard, M. 2004, Monthly Notices of the Royal Astronomical Society, 349, 347, doi: 10.1111/j.1365-2966.2004.07507.x
- Fray & Schmitt (2009) Fray, N., & Schmitt, B. 2009, Planet. Space Sci., 57, 2053, doi: 10.1016/j.pss.2009.09.011
- Gaia Collaboration et al. (2018) Gaia Collaboration, Brown, A. G. A., Vallenari, A., et al. 2018, A&A, 616, A1, doi: 10.1051/0004-6361/201833051
- Gaia Collaboration et al. (2021) Gaia Collaboration, Brown, A. G. A., Vallenari, A., et al. 2021, Astronomy & Astrophysics, 649, A1, doi: 10.1051/0004-6361/202039657
- Gwyn et al. (2012) Gwyn, S. D. J., Hill, N., & Kavelaars, J. J. 2012, PASP, 124, 579, doi: 10.1086/666462
- Heisler & Tremaine (1986) Heisler, J., & Tremaine, S. 1986, Icarus, 65, 13, doi: 10.1016/0019-1035(86)90060-6
- Hui et al. (2019) Hui, M.-T., Farnocchia, D., & Micheli, M. 2019, AJ, 157, 162, doi: 10.3847/1538-3881/ab0e09
- Hui et al. (2018) Hui, M.-T., Jewitt, D., & Clark, D. 2018, AJ, 155, 25, doi: 10.3847/1538-3881/aa9be1
- Jarvis et al. (2020) Jarvis, M., Bernstein, G. M., Amon, A., et al. 2020, 13, 43
- Jewitt (2015) Jewitt, D. 2015, The Astronomical Journal, 150, 201, doi: 10.1088/0004-6256/150/6/201
- Jewitt et al. (2019) Jewitt, D., Agarwal, J., Hui, M.-T., et al. 2019, AJ, 157, 65, doi: 10.3847/1538-3881/aaf38c
- Jewitt et al. (2017) Jewitt, D., Hui, M.-T., Mutchler, M., et al. 2017, ApJ, 847, L19, doi: 10.3847/2041-8213/aa88b4
- Jewitt et al. (2021) Jewitt, D., Kim, Y., Mutchler, M., et al. 2021, AJ, 161, 188, doi: 10.3847/1538-3881/abe4cf
- Jewitt & Meech (1987) Jewitt, D. C., & Meech, K. J. 1987, ApJ, 317, 992, doi: 10.1086/165347
- Kokotanekova et al. (2021) Kokotanekova, R., Lister, T., Bannister, M., et al. 2021, The Astronomer’s Telegram, 14733, 1
- Królikowska & Dybczyński (2018) Królikowska, M., & Dybczyński, P. A. 2018, Astronomy & Astrophysics, 615, A170, doi: 10.1051/0004-6361/201832917
- Lamy et al. (2004) Lamy, P. L., Toth, I., Fernandez, Y. R., & Weaver, H. A. 2004, The sizes, shapes, albedos, and colors of cometary nuclei, ed. M. C. Festou, H. U. Keller, & H. A. Weaver, 223
- Li et al. (2019) Li, C., Zhao, G., & Yang, C. 2019, The Astrophysical Journal, 872, 205, doi: 10.3847/1538-4357/ab0104
- Luna et al. (2014) Luna, R., Satorre, M. Á., Santonja, C., & Domingo, M. 2014, A&A, 566, A27, doi: 10.1051/0004-6361/201323249
- Meech et al. (2009) Meech, K. J., Pittichová, J., Bar-Nun, A., et al. 2009, Icarus, 201, 719, doi: 10.1016/j.icarus.2008.12.045
- Meech et al. (2017) Meech, K. J., Kleyna, J. T., Hainaut, O., et al. 2017, The Astrophysical Journal, 849, L8, doi: 10.3847/2041-8213/aa921f
- Oort (1927) Oort, J. H. 1927, Bulletin of the Astronomical Institutes of the Netherlands, 3, 275
- Rein & Liu (2012) Rein, H., & Liu, S. F. 2012, Astronomy and Astrophysics, 537, A128, doi: 10.1051/0004-6361/201118085
- Rein & Tamayo (2015) Rein, H., & Tamayo, D. 2015, Monthly Notices of the Royal Astronomical Society, 452, 376, doi: 10.1093/mnras/stv1257
- Ricker et al. (2015) Ricker, G. R., Winn, J. N., Vanderspek, R., et al. 2015, Journal of Astronomical Telescopes, Instruments, and Systems, 1, 014003, doi: 10.1117/1.JATIS.1.1.014003
- Ridden-Harper et al. (2021) Ridden-Harper, R., Bannister, M. T., & Kokotanekova, R. 2021, Research Notes of the AAS, 5, 161, doi: 10.3847/2515-5172/ac1512
- Ridden-Harper et al. (2021) Ridden-Harper, R., Bannister, M. T., & Kokotanekova, R. 2021, Research Notes of the American Astronomical Society, 5, 161, doi: 10.3847/2515-5172/ac1512
- Sárneczky et al. (2016) Sárneczky, K., Szabó, G. M., Csák, B., et al. 2016, AJ, 152, 220, doi: 10.3847/0004-6256/152/6/220
- Stassun et al. (2018) Stassun, K. G., Oelkers, R. J., Pepper, J., et al. 2018, AJ, 156, 102, doi: 10.3847/1538-3881/aad050
- Szabó et al. (2012) Szabó, G. M., Kiss, L. L., Pál, A., et al. 2012, ApJ, 761, 8, doi: 10.1088/0004-637X/761/1/8
- Tamayo et al. (2020) Tamayo, D., Rein, H., Shi, P., & Hernandez, D. M. 2020, Monthly Notices of the Royal Astronomical Society, 491, 2885, doi: 10.1093/mnras/stz2870
- The Dark Energy Survey Collaboration (2021) The Dark Energy Survey Collaboration. 2021, arXiv e-prints, arXiv:2101.05765. https://arxiv.org/abs/2101.05765
- Vokrouhlický et al. (2019) Vokrouhlický, D., Nesvorný, D., & Dones, L. 2019, The Astronomical Journal, 157, 181, doi: 10.3847/1538-3881/ab13aa
- Vorobiev et al. (2019) Vorobiev, D., Irwin, A., Ninkov, Z., et al. 2019, Journal of Astronomical Telescopes, Instruments, and Systems, 5, 041507, doi: 10.1117/1.JATIS.5.4.041507
- Willmer (2018) Willmer, C. N. A. 2018, ApJS, 236, 47, doi: 10.3847/1538-4365/aabfdf
- Wisdom & Holman (1991) Wisdom, J., & Holman, M. 1991, The Astronomical Journal, 102, 1528, doi: 10.1086/115978