Large magnetocaloric effect in
Abstract
We report the magnetocaloric effect (MCE) in a polycrystalline plumbide sample of . Arc-melted crystallizes in type of tetragonal crystal structure and shows an antiferromagnetic behavior with Néel temperature of 4.5 K. The Arrott plots indicate that undergoes a second order antiferromagnetic phase transition. The calculated isothermal magnetic entropy change (), and relative power cooling (refrigeration capacity) for a change of field 0-8 T are 17.8 J.kg-1.K-1, and 680(497) J.kg-1 respectively. The obtained results revealed that belongs to a family of large MCE magnetic materials.
Keywords:
Antiferromagnet; Tetragonal; Second order; Entropy change, , , and
1 INTRODUCTION
The magnetocaloric effect (MCE) is an intrinsic property of magnetic materials that manifests itself by an adiabatic variation of temperature () or the isothermal variation of magnetic entropy () when subjected to a magnetic field. This effect is maximal around the magnetic phase transition temperature. At this point, the temperature rate of change of the magnetization of the material undergoing the magnetic ordering is maximum and results in a strong variation of magnetic entropy, which due to the magneto-thermal coupling induces a variation of temperature of the material. Based on the magnetocaloric effect, magnetic refrigeration is a less polluting technology compared to conventional refrigeration (absence of harmful gases, better energy efficiency). The higher energy efficiency and environmentally friendly nature of this technique has motivated the search for magnetic materials that exhibit large MCE and are suitable for potential applications. The large/giant MCE materials can be classified from the values of , and refrigeration capacity (RC)/relative power cooling (RCP) [1, 2, 3, 4, 5].
The series of compounds (R = rare-earth elements, T= transition metal, X = general elements) have attracted much attention to their crystal structure, and related physical properties. Relatively large MCE values have already been found in some compounds [6]. The crystal structures of tetragonal type systems together with exploratory magnetic characterizations have already been reported for compounds [7, 8]. In this paper, the large MCE found in an arc-melted polycrystalline compound of is reported.
2 EXPERIMENTAL DETAILS
A polycrystalline sample of was prepared on a watercooled copper hearth by high purity Argon arcmelting method with a tungsten electrode. To promote homogeneity the ingot was turned over and remelted several times. Powder X-ray diffraction (XRD) at room temperature was carried out using a Cu-K radiation ( = 1.5405 Å) on a Rigaku diffractometer (SmartLab). The phase purity and crystal structure analysis were performed by refining the powder XRD patterns using Rietveld refinement with FullProf software [9, 10]. The temperature and field dependence of the dc-magnetization measurements were carried out using a Dynacool Physical Property Measurement system (PPMS) (made by Quantum Design, San Diego, USA) with a Vibrating Sample Magnetometer (VSM) option, in the temperature range of 2-300 K, with the dc-magnetic field () from 0 to 9 T. Temperature dependence of magnetization () was measured under zero field cooled (ZFC) and field cooled (FC) protocol [11]. The magnetic entropy change was calculated from the isothermal fielddependent magnetization curves using the Maxwell relation [4]:
| (1) |
where is the initial magnetic field and is the final field.
3 RESULTS AND DISCUSSIONS
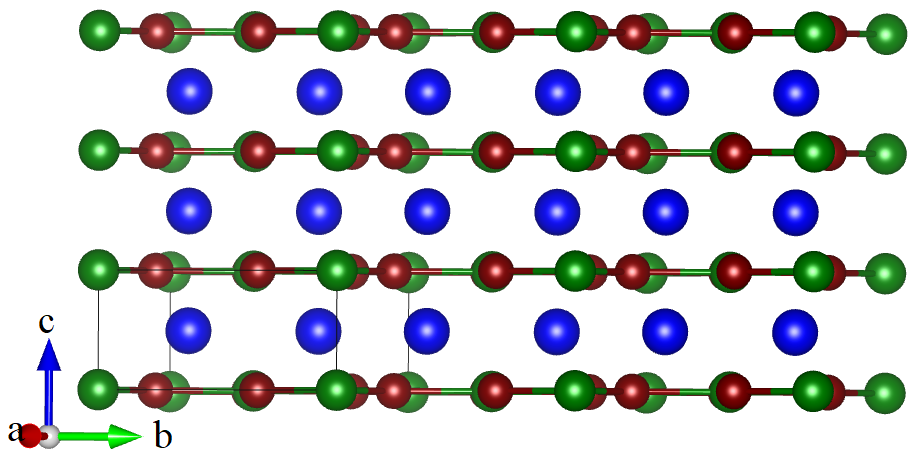
Fig. 1 shows the Rietveld refinement of recorded room temperature XRD patterns reveals that crystallizes in a type of tetragonal structure with space group . The yielded lattice parameters from the refinement are a = b = 7.7282(2)Å and c = 3.6327(1) Å. These values are in good agreement with the previously reported values [7]. The full description of crystal structure and interatomic distance is refereed to the published paper [7]. Here, Fig 2 displays the arrangement of atoms in layers in the b-c plane of tetragonal structure for . One layer contains the rare-earth element Ho, and other layer contains both Pd and Pb elements.

The temperature dependence of ZFC and FC dcmagnetic susceptibility ( = ) (left scale) and the inverse magnetic susceptibility of FC curve (right scale) under a magnetic field = 0.05 T for are shown in Fig. 3. results proved that undergoes an antiferromagnetic to paramagnetic transition with Néel temperature = 4.5 K, which was estimated from the maximum values in ZFC and FC of curves and shown in the inset of Fig. 3. It is observed that the FC and ZFC curves almost completely overlap, indicating no thermomagnetic irreversibility in . The linear paramagnetic region above 10 K of the follows Curie–Weiss-type behaviour; given by the relation , with the Avogadro number and the Boltzmann constant. The least-squares fit yields the effective magnetic moment = 10.62 /Ho. This obtained is very close to the theoretical value of a free ion, = 10.61 for J = 8, and g = 5/4. This result indicates that the 4fshell electrons of ions are the predominant magnetic species in . The negative Weiss paramagnetic temperature K suggests the predominance of antiferromagnetic interactions in the compound. The results are in good agreement with the previous report [8].

To evaluate the MCE of , magnetic isothermal is measured in a wide temperature range from 4 to 20 K under applied magnetic field up to 8 T and is shown in Fig. 4. To avoid field cycling effect between consecutive isothermal magnetization measurements, the sample was heated to 50 K between each magnetization isotherm. Hysteresis loop is not seen in below . In order to determine the order of the magnetic phase transition of , 2 plots are made for various temperatures from and is shown in Fig. 5. According to the Banerjee criterion [12], the positive slopes of Arrott plots represent a second order magnetic transition and negative slopes at some point represent firstorder transitions. As seen in Fig. 5, the positive slopes in Arrott plots across the entire range are characteristic of the secondorder magnetic phase transition in .


Magnetic entropy changes were derived from , using Maxwell’s thermodynamic relation given in equation 1. Fig. 6 shows the temperature dependence of at different magnetic fields changing up to 9 T. It is observed that exhibits a broad peak around the transition temperature. The maximum values of the magnetic entropy change () for are found to be 6.2 , 14.1, 16.8 and 17.8 for the change of magnetic field 0-2 T, 0-5 T, 0-7 T and 0-8 T, respectively.

The RCP and RC are also considered as important figures of merit to quantify the heat transfer between the hot and cold reservoirs in an ideal refrigeration cycle. The RCP is defined as the product of the maximum magnetic entropy change and the full width at half maximum ( of curves; RCP [4, 5, 13, 14]. The RC is determined by the formula: . Here, and are the temperatures below and above , respectively, at the half maximum of the peak in an ideal thermodynamic cycle. The RC and RCP values obtained using the above formulas gradually increase with applied magnetic fields. The RCP(RC) values are 61(43), 270(190), 470(340) and 605(435) J/kg for the change of field 02, 05, 07 and 08 T respectively. A table is made to compare the MCE performance of with other MCE materials. As seen from the table, the value of is comparable with the reported values of other Hobased 2:2:1 compounds. However, RCP value is smaller than the reported ferromagnetic compounds and larger than the antiferromagnetic magnetic compounds. This comparison suggests that the belong to a class of large MCE material.
| Compound | RCP | Ref | ||
| (K) | (J/kg-K) | (J kg-1) | ||
| 30/15* | 20.3 | 481 | [15] | |
| 30* | 17.4 | 416 | [16] | |
| 21/8* | 12.9 | 345 | [16] | |
| 38.5* | 11.7 | 271 | [17] | |
| 27/9* | 11.5 | 580 | [18] | |
| 12.5 | 5.4 | 121 | [19] | |
| 10.5/5.5 | 11.5 | 210 | [20] | |
| 12/6 | 6 | 151 | [18] | |
| 4.5 | 14.1 | 270 | PW | |
| PW: Present Work |
4 SUMMARY
In summary, a singlephase compound with -type tetragonal structure was successfully synthesized by arc-melting technique. exhibits a second order antiferromagnetic phase transition with a Néel temperature of 4.5 K. The estimated maximum values of and RCP (RC) around the transition temperature of are 17.8 and 605(435) J.kg-1, respectively for a change of magnetic field 0-8 T. These results may provide some interest to search for new series of MCE materials.
ACKNOWLEDGEMENT
This work is supported by Global Excellence and Stature (UJ-GES) fellowship, University of Johannesburg, South Africa. DFR thanks OWSD and SIDA for the fellowship towards PhD studies. BMS thanks the URC (283153) of UJ for financial support. AMS thanks the URC/FRC of UJ and SA NRF (93549) for financial assistance.
Data availability
The data that support the findings of this study are available from the corresponding author upon reasonable request.
Author contributions
This manuscript has been written through the contributions of all authors. All authors have given approval to the final version of the manuscript.
Conflict of interest
All authors declare that there is no conflict of financial interests or personal relationships.
References
- [1] V. K. Pecharsky, and K. A. Gschneidner Jr, ”Magnetocaloric effect and magnetic refrigeration.” Journal of Magnetism and Magnetic Materials 200 (1999) 4456.
- [2] L. Caron, ”Magnetocaloric effect in transition metal-based compounds.” Handbook of Magnetic Materials 29 (2020) 111.
- [3] L. Li, ”Review of magnetic properties and magnetocaloric effect in the intermetallic compounds of rare earth with low boiling point metals.” Chinese Physics B 25 (2016) 037502.
- [4] A. M. Tishin and Y. I. Spichkin,” The Magnetocaloric effect and its applications.” ed J M D Coey et al (Bristol: Institute of Physics Publishing), (2003).
- [5] L. Li, and M. Yan, ”Recent progresses in exploring the rare earth based intermetallic compounds for cryogenic magnetic refrigeration.” Journal of Alloys and Compounds 823 (2020) 153810.
- [6] Y. Zhang, ”Review of the structural, magnetic and magnetocaloric properties in ternary rare earth type intermetallic compounds.” Journal of Alloys and Compounds 787 (2019) 11731186.
- [7] G. Melnyk, H. C. Kandpal, L. D. Gulay, and W. Tremel, ”Crystal structures of (R= Y, La, Ce, Pr, Nd, Sm, Gd, Tb, Dy, Ho, Er, Tm, and Lu) compounds.” Journal of Alloys and Compounds 370 (2004) 217222.
- [8] D. Kaczorowski, D., and L. D. Gulay. ”Magnetic and electrical properties of (RE= Y, La–Sm, Gd–Tm) compounds.” Journal of Alloys and Compounds 442 (2007) 169171.
- [9] H. M. Rietveld, ”A profile refinement method for nuclear and magnetic structures.” Journal of Applied Crystallography 2 (1969) 6571.
- [10] Rodriguez-Carvajal J., Fullprof Suite http://www. ill. eu/sites/fullprof/ (2021).
- [11] B. Sahu, J. Y. Law, A. M. Strydom, V. Franco, and H. S. Nair, ”Magnetic phase transitions and magnetocaloric effect in ternary rhombohedral Laves phases of and .” Journal of Magnetism and Magnetic Materials 514 (2020) 166988.
- [12] B. K. Banerjee, ”On a generalised approach to first and second order magnetic transitions.” Physics Letters 12 (1964) 1617.
- [13] K. A. Gschneidner Jr., and V. K. Pecharsky, ”Magnetocaloric materials.” Annual Review of Materials Science 30 (2000) 387429.
- [14] L. Li, O. Niehaus, M. Kersting, and R. Pöttgen, ”Reversible table-like magnetocaloric effect in Eu4PdMg over a very large temperature span.” Applied Physics Letters 104, (2014) 092416.
- [15] Y. Yi, L. Li, K. Su, Y. Qi, and D. Huo, ”Large magnetocaloric effect in a wide temperature range induced by two successive magnetic phase transitions in compound.” Intermetallics 80 (2017) 22-25.
- [16] L. Li, Y. Yi, K. Su, Y. Qi, D. Huo, and R. Pöttgen. ”Magnetic properties and large magnetocaloric effect in and compounds.” Journal of Materials Science 51 (2016) 5421-5426.
- [17] Y.K. Zhang, D. Guo, S.H. Geng, X.G. Lu, G. Wilde, ”Structure, magnetic and cryogenic magneto-caloric properties in intermetallic gallium compounds (RE = Dy, Ho, Er, and Tm).” Journal of Applied Physics 124 (2018) 043903.
- [18] X.S. Dong, J. Feng, Y.L. Yi, L.W. Li, ”Investigation of the crystal structure and cryogenic magnetic properties of (RE = Dy, Ho, Er, and Tm; T = Co and Ni) compounds.” Journal of Applied Physics 124 (2018) 093901.
- [19] Y. Zhang, Y. Yang, C. Hou, D. Guo, X. Li, Z. Ren, and G. Wilde, ”Metamagnetic transition and magnetocaloric properties in antiferromagnetic and compounds.” Intermetallics 94 (2018) 17-21.
- [20] Z. Zhang, P. Wang, H. Rong, and L. Li, ”Structural and cryogenic magnetic properties of (RE= Pr, Nd, Dy and Ho) compounds.” Dalton Transactions 48 (2019) 17792-17799.