Investigating Crowdsourcing Protocols for Evaluating
the Factual Consistency of Summaries
Abstract
Current pre-trained models applied for summarization are prone to factual inconsistencies that misrepresent the source text. Evaluating the factual consistency of summaries is thus necessary to develop better models. However, the human evaluation setup for evaluating factual consistency has not been standardized. To determine the factors that affect the reliability of the human evaluation, we crowdsource evaluations for factual consistency across state-of-the-art models on two news summarization datasets using the rating-based Likert Scale and ranking-based Best-Worst Scaling. Our analysis reveals that the ranking-based Best-Worst Scaling offers a more reliable measure of summary quality across datasets and that the reliability of Likert ratings highly depends on the target dataset and the evaluation design. To improve crowdsourcing reliability, we extend the scale of the Likert rating and present a scoring algorithm for Best-Worst Scaling that we call value learning. Our crowdsourcing guidelines will be publicly available to facilitate future work on factual consistency in summarization.
1 Introduction
Pre-trained language models have achieved promising results in abstractive text summarization Edunov et al. 2019; Dong et al. 2019; Song et al. 2019; Zhang et al. 2019; Zhang et al. 2020. A serious limitation of these models, however, is their tendency to produce text that is factually inconsistent with the input. Thus, evaluating the factual consistency of the generated summaries with respect to the source is an important task Falke et al. 2019; Cao et al. 2020; Gabriel et al. 2021; Durmus et al. 2020; Huang et al. 2021; Pagnoni et al. 2021.
Recently, metrics have been proposed for evaluating factual consistency, including applying natural language inference Falke et al. 2019; Kryscinski et al. 2020 and question-answering models Eyal et al. 2019; Scialom et al. 2019; Durmus et al. 2020; Wang et al. 2020. However, current metrics still do not correlate highly with human judgments on factual consistency Koto et al. 2020; Pagnoni et al. 2021. To overcome the inherent limitation of automatic metrics, researchers typically crowdsource human evaluations using platforms such as Amazon’s Mechanical Turk (MTurk) Gillick and Liu 2010; Sabou et al. 2012; Lloret et al. 2013. However, papers often differ in their preferred evaluation protocols Louis and Nenkova 2013; Hardy et al. 2019. These differences in the evaluation task design affect the quality of the resulting human judgments and system comparisons Santhanam and Shaikh 2019.
Two of the primary paradigms of crowdsourced evaluations are ranking-based and rating-based. Best-Worst Scaling Louviere and Woodworth 1991 is a ranking-based method by which the annotator selects the best and worst example out of a set of examples. Prior research has claimed that Best-Worst Scaling produces higher-quality evaluations than rating scales such as the Likert Scale for tasks such as sentiment analysis Kiritchenko and Mohammad 2017. In the context of summarization, Steen and Markert 2021 find that, compared to the Likert Scale, ranking-based protocols are more reliable for measuring summary coherence but less so for repetition. However, previous studies have not analyzed annotation reliability in the context of factual consistency for summarization.
Our contributions are the following: 1) We are, to the best of our knowledge, the first to study the reliability of human evaluation for summarization factual consistency. 2) We study rating and ranking-based protocols across two summarization datasets and four state-of-the-art abstractive models. We determine the factors affecting human evaluation reliability and present a novel ranking-based protocol with the highest reliability. 3) We will release our evaluation guidelines and annotations to promote future work on factual consistency evaluation.
2 Study Design
Each study consists of 100 input documents randomly sampled from each dataset, and four associated model-generated summaries.
| CNN/DM | XSum | |||||
| Models | R-1 | R-2 | R-L | R-1 | R-2 | R-L |
| PEGASUS | ||||||
| ProphetNet | ||||||
| BART | ||||||
| BERTSUM | ||||||
2.1 Datasets and Models
Datasets: We conduct our study on two benchmark summarization datasets. CNN/DailyMail Hermann et al. 2015; Nallapati et al. 2016 consists of 311,672 pairs of online articles and bullet-point summaries, typically three sentences. XSum Narayan et al. 2018 consists of 227K online articles and single-sentence summaries.
Models: The following abstractive summarization models are chosen due to their strong cross-dataset performance: BART Lewis et al. 2020, a denoising autoencoder for pretraining sequence to sequence and natural language understanding tasks; ProphetNet Qi et al. 2020, a pre-trained encoder-decoder model that performs n-gram language modeling; PEGASUS Zhang et al. 2020, a model pre-trained with a summarization-specific objective function; and BERTSUM Liu and Lapata 2019, a two-stage fine-tuning approach. Table 1 shows the models’ ROUGE scores Lin 2004.
2.2 Reliability
We follow Steen and Markert 2021 and report Krippendorff’s alpha and Split-Half Reliability as measures of the reliability of crowdsourced annotations. Krippendorff’s alpha () is a reliability coefficient developed to measure the agreement among multiple annotators Krippendorff 2011. This measures instance-level reliability, especially how reliable judgments are over individual summary instances. For system-level rankings, to measure the reliability of the rankings of summarization models, we compute Split-Half Reliability (SHR). To compute SHR, annotations are split into two independent groups, and Pearson correlations are calculated between the groups.
We follow a similar block-design described in Steen and Markert 2021. We note that we include the input document as the context of the summaries as opposed to the coherence and repetition dimensions studied in that work, which do not require reading the input article. We divided our corpus into 20 blocks of 5 documents. We include all 4 generated summaries for each document in the same block, resulting in 5 × 4 = 20 summaries per block. We require 3 annotators per block as in Steen and Markert 2021, and each annotator is limited to annotating at most two blocks total across all tasks. A further study of the effect of the number of annotators or block design is left for future work. Crowdsourcing is done via MTurk.
2.3 Protocols
The Likert Scale (LS) is a common rating-based evaluation protocol Asghar et al. 2018.
| CNN/DM | XSum | |||
| Models | LS | LS | ||
| PEGASUS | ||||
| ProphetNet | ||||
| BART | ||||
| BERTSUM | ||||
Likert Scales applied to summarization typically range from 1-5 Steen and Markert 2021. Best-Worst Scaling (BWS) is a type of ranking-oriented evaluation that requires annotators to specify only the best and the worst example in a set of summaries Hollis and Westbury 2018; Kiritchenko and Mohammad 2017. For BWS, the annotator labels the most factually consistent summary and the least factually consistent summary. Another type of ranking-based protocol is pairwise comparison, where each example is compared to every other example. However, this protocol is very expensive; given items to annotate, total annotations must be collected as opposed to BWS which requires a constant factor of total annotators. Due to this exorbitant cost as any reasonable scale, we restrict our study of ranking-based protocols to BWS, and we refer the reader to Kiritchenko and Mohammad 2017 for an in-depth discussion of the cost comparison for the task of sentiment analysis.
2.4 Research Questions
We study three three main research questions (RQ):
RQ1: Ranking (BWS) vs. LS?
We aim to determine the more reliable evaluation protocol.
RQ2: What affects reliability?
We aim to determine the factors that affect the reliability of the human evaluation.
RQ3: What are the protocols’ limitations and how to improve them?
Based on the analysis, we propose two protocols to improve the reliability.
| CNN/DM | XSum | |||
| Scale | SHR | SHR | ||
| Protocols | ||||
| LS | 92.77 | |||
| BWS | 15.82 | 87.65 | 24.77 | |
| Ours | ||||
| 94.85 | ||||
| 29.31 | 92.48 | 30.62 | ||
3 Analysis
We show the average ratings across LS scales, including a modified LS scale we will later introduce, in Table 2. Despite the consistently higher ROUGE scores, Pegasus was not always ranked highest, which aligns with previous work suggesting that ROUGE score does not correlate with factual consistency Durmus et al. 2020. The primary results for reliability evaluation are found in Table 3.
RQ1: BWS outperforms LS on CNN/DM.
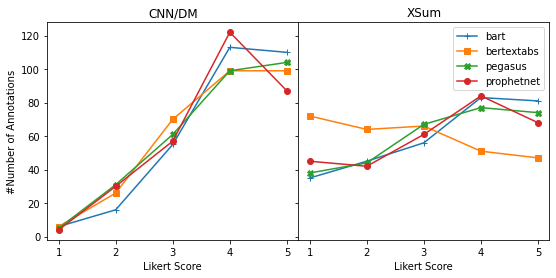
We see on the left-hand side of the first two rows of Table 3 that BWS outperforms LS by a large margin on both instance-level () and system-level (SHR) reliability. As seen in the distribution of the LS ratings in Figures 1, many models are rated as factually consistent with scores of 4 or 5. This coincides with previous investigations on CNN/DM which conclude that recent summarization systems produce fluent texts with relatively few factual errors Fabbri et al. 2021. We hypothesize that the greater reliability of BWS on CNN/DM data may result from the ranking task forcing the annotator to choose the best summary and distinguish these close summaries rather than allowing e.g. the annotator to give both a score of 5. This result suggests that BWS is preferable in cases where the summaries analyzed have similar factual consistency, such as CNN/DM.
Though agreement on individual summaries () is relatively low for all annotation methods, these numbers are comparable to those obtained in Steen and Markert 2021. Furthermore, we look at the relative difference between () of BWS and LS, and we find that studies still arrive at consistent system scores as demonstrated by the SHR. This reflects similar observations made by Gillick and Liu 2010. System-level ranks such as SHR, are also more important for evaluation purposes as the goal is generally to rank models to determine the best performing (or most factually consistent) system as opposed to examining individual examples as Krippendorff’s alpha measures.
RQ2: Dataset Characteristics Affect Reliability.
We extend our experiments to the XSum dataset to see whether the reliability of the protocols changes as the characteristics of the dataset change. XSum-trained models are known to suffer from factual inconsistencies because of the high compression ratio and high level of abstraction of the reference summaries Maynez et al. 2020. As seen on the right-hand side of the first two rows of Table 3, BWS and LS both perform well, with LS slightly outperforming BWS according to SHR. As seen in Figure 1, the model scores are more spread out along the scale. This coincides with the large range of ROUGE scores and larger differences between models, as seen in Table 1, which likely explains why annotators can differentiate the model outputs better. Thus, we believe that LS is a viable option when the corpus contains a diverse quality of summaries, like XSum.
RQ3: Improvements and Current Limitations.
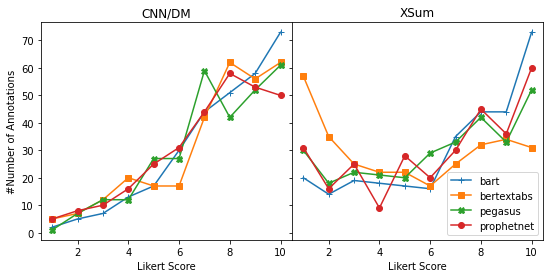
We propose two modified protocols to improve reliability and then study the presence of common limitations for evaluation protocols. Prior work has noted the effect of scale granularity Kiritchenko and Mohammad 2017, so for LS, we extend the scale from for 5 to 10 and call it LS-10. Table 3 shows that that LS-10 is more reliable than LS A finer-grained scale may capture more nuanced differences in data points with more choices. Scores tend to move towards the extremes when we use a finer-grained scale (10 vs 5), as seen in the difference in distributions in Figures 1 and 2. Thus, for LS-10, a larger range and being less biased towards a specific region, promoting better reliability. Previous work suggests that Best-Worst Scaling fails to yield an unbiased estimate of the true quality value Hollis 2018. Thus, for BWS, we incorporate information about the quality of competing examples or value learning into a protocol. The annotator is asked to give a score (3-point scale) for the difference between the best and the worst summary. The final ranking uses a weighted sum. The results at the bottom of Table 3 also confirm the effectiveness of this protocol.
To verify the limitations of evaluation protocols noted by Kiritchenko and Mohammad 2017, we conduct the following studies. We first analyze (a) the inconsistencies in annotations by different annotators, measured by the percentage of summaries that receive different ratings or rankings from different annotators, which we call change rate. As shown in Table 4, annotators are more likely to agree on the same ranking in BWS as opposed to the same rating for LS. We further test (b) inconsistencies by the same annotator, in particular whether annotations done by the same worker are consistent over time. We ask workers who have previously annotated XSum and CNN/DM samples to re-do their annotations one week after their initial annotations. We notified the workers to re-annotate only one week after they finished, instead of at the beginning, as we do not want to introduce design bias. In total, 43 workers redid 860 annotations. For LS, the average change in the rating of the two annotations one week apart by the same worker was 0.92.
Additionally, we examine whether LS suffers from (c) scale region bias, where different annotators are often biased towards different parts of the rating scale. For a given block and two annotators, we calculate the rating range given by each annotator. We then calculate the overlap length between those two ranges divided by the length of the overall range from both annotators. We call this the percentage scale overlap and average over all pairs of annotators and blocks. For LS, the percentage scale overlap is (0.67, 0.88) for (CNN/DM, XSum), respectively, and (0.61, 0.82) for LS-10. The difference in scale region bias between LS and LS-10 is small, but the bias difference between CNN/DM and XSum is notable. Greater diversity in summary quality as in XSum may force the annotators to expand their use of the scale and mitigate region bias, which may explain why LS is better than BWS on XSum as opposed to CNN/DM. Future work may investigate further what exactly constitutes too wide of a scaling range.
| CNN/DM | XSum | |||||
| BWS | LS | BWS | LS | |||
| Change Rate (%) | 74.71 | 87.75 | 96.00 | 70.25 | 92.25 | 96.25 |
| Scale Overlap | - | 0.67 | 0.61 | - | 0.88 | 0.82 |
4 Conclusion
In this paper, we conduct studies to understand and improve the reliability of ranking and rating-based human evaluations of summarization factual consistency. We find that Best-Worst Scaling is largely reliable, and the Likert scale also has merits, but the proper scaling and dataset characteristics must be carefully studied to ensure its reliability. We improve these two protocols based on our findings and believe that our studies advance the understanding of both models and metrics as we aim to facilitate factually consistent text generation.
5 Ethical Considerations
Intellectual Properties and Privacy Rights
All of the datasets (CNN/DM and XSum) used in our study are publicly available. Regarding privacy rights, the authors of the paper completed IRB human subject protection training for conducting this study. We will release the annotations, but rather than releasing the MTurk ID of the worker, we will completely anonymize this ID.
Compensation for Annotators
Workers were compensated $5 per block, calibrated to equal a $15/hour payrate. We first annotated examples in-house to determine the required annotation speed. A summary block usually takes around 20 minutes.
Steps Taken to Avoid Potential Problems
Annotations were completed in the form of a survey on a Google Form. We provided space for the Turkers to provide feedback. We manually uploaded the data points (articles and summaries) used in this study to avoid any offensive content.
The Number of Examples
We sampled 100 examples from each dataset that did not contain exactly matching summaries. Both Likert and BWS follow the same block design, which includes the same number of examples per block. With the exception that the BWS annotation asks for the most and least factually consistent summary and the Likert asks for ratings for each individual summary. Due to space requirements, we included further details, images of the interface, in the supplementary material. We pay the same amount per block of annotations.
Qualifications of MTurk workers
We use the following qualifications to recruit in total 350 MTurk workers with good track records: HIT approval rate greater than or equal to 98%, number of HITs approved greater than or equal to 500, and located in one of the following English native-speaking countries: Australia, Canada, New Zealand, United Kingdom, United States.
References
- Asghar et al. (2018) Nabiha Asghar, Pascal Poupart, Jesse Hoey, Xin Jiang, and Lili Mou. 2018. Affective neural response generation. In Advances in Information Retrieval - 40th European Conference on IR Research, ECIR 2018, Grenoble, France, March 26-29, 2018, Proceedings, volume 10772 of Lecture Notes in Computer Science, pages 154–166. Springer.
- Cao et al. (2020) Meng Cao, Yue Dong, Jiapeng Wu, and Jackie Chi Kit Cheung. 2020. Factual error correction for abstractive summarization models. In Proceedings of the 2020 Conference on Empirical Methods in Natural Language Processing (EMNLP), pages 6251–6258, Online. Association for Computational Linguistics.
- Dong et al. (2019) Li Dong, Nan Yang, Wenhui Wang, Furu Wei, Xiaodong Liu, Yu Wang, Jianfeng Gao, Ming Zhou, and Hsiao-Wuen Hon. 2019. Unified language model pre-training for natural language understanding and generation. In Advances in Neural Information Processing Systems 32: Annual Conference on Neural Information Processing Systems 2019, NeurIPS 2019, December 8-14, 2019, Vancouver, BC, Canada, pages 13042–13054.
- Durmus et al. (2020) Esin Durmus, He He, and Mona Diab. 2020. FEQA: A question answering evaluation framework for faithfulness assessment in abstractive summarization. In Proceedings of the 58th Annual Meeting of the Association for Computational Linguistics, pages 5055–5070, Online. Association for Computational Linguistics.
- Edunov et al. (2019) Sergey Edunov, Alexei Baevski, and Michael Auli. 2019. Pre-trained language model representations for language generation. In Proceedings of the 2019 Conference of the North American Chapter of the Association for Computational Linguistics: Human Language Technologies, Volume 1 (Long and Short Papers), pages 4052–4059, Minneapolis, Minnesota. Association for Computational Linguistics.
- Eyal et al. (2019) Matan Eyal, Tal Baumel, and Michael Elhadad. 2019. Question answering as an automatic evaluation metric for news article summarization. In Proceedings of the 2019 Conference of the North American Chapter of the Association for Computational Linguistics: Human Language Technologies, Volume 1 (Long and Short Papers), pages 3938–3948, Minneapolis, Minnesota. Association for Computational Linguistics.
- Fabbri et al. (2021) Alexander R Fabbri, Wojciech Kryściński, Bryan McCann, Caiming Xiong, Richard Socher, and Dragomir Radev. 2021. Summeval: Re-evaluating summarization evaluation. Transactions of the Association for Computational Linguistics, 9:391–409.
- Falke et al. (2019) Tobias Falke, Leonardo F. R. Ribeiro, Prasetya Ajie Utama, Ido Dagan, and Iryna Gurevych. 2019. Ranking generated summaries by correctness: An interesting but challenging application for natural language inference. In Proceedings of the 57th Annual Meeting of the Association for Computational Linguistics, pages 2214–2220, Florence, Italy. Association for Computational Linguistics.
- Gabriel et al. (2021) Saadia Gabriel, Asli Celikyilmaz, Rahul Jha, Yejin Choi, and Jianfeng Gao. 2021. GO FIGURE: A meta evaluation of factuality in summarization. In Findings of the Association for Computational Linguistics: ACL-IJCNLP 2021, pages 478–487, Online. Association for Computational Linguistics.
- Gillick and Liu (2010) Dan Gillick and Yang Liu. 2010. Non-expert evaluation of summarization systems is risky. In Proceedings of the NAACL HLT 2010 Workshop on Creating Speech and Language Data with Amazon’s Mechanical Turk, pages 148–151, Los Angeles. Association for Computational Linguistics.
- Hardy et al. (2019) Hardy Hardy, Shashi Narayan, and Andreas Vlachos. 2019. HighRES: Highlight-based reference-less evaluation of summarization. In Proceedings of the 57th Annual Meeting of the Association for Computational Linguistics, pages 3381–3392, Florence, Italy. Association for Computational Linguistics.
- Hermann et al. (2015) Karl Moritz Hermann, Tomás Kociský, Edward Grefenstette, Lasse Espeholt, Will Kay, Mustafa Suleyman, and Phil Blunsom. 2015. Teaching machines to read and comprehend. In Advances in Neural Information Processing Systems 28: Annual Conference on Neural Information Processing Systems 2015, December 7-12, 2015, Montreal, Quebec, Canada, pages 1693–1701.
- Hollis (2018) Geoff Hollis. 2018. Scoring best-worst data in unbalanced many-item designs, with applications to crowdsourcing semantic judgments. Behavior research methods, 50(2):711–729.
- Hollis and Westbury (2018) Geoff Hollis and Chris Westbury. 2018. When is best-worst best? a comparison of best-worst scaling, numeric estimation, and rating scales for collection of semantic norms. Behavior research methods, 50(1):115–133.
- Huang et al. (2021) Yichong Huang, Xiachong Feng, Xiaocheng Feng, and Bing Qin. 2021. The factual inconsistency problem in abstractive text summarization: A survey.
- Kiritchenko and Mohammad (2017) Svetlana Kiritchenko and Saif Mohammad. 2017. Best-worst scaling more reliable than rating scales: A case study on sentiment intensity annotation. In Proceedings of the 55th Annual Meeting of the Association for Computational Linguistics (Volume 2: Short Papers), pages 465–470, Vancouver, Canada. Association for Computational Linguistics.
- Koto et al. (2020) Fajri Koto, Jey Han Lau, and Timothy Baldwin. 2020. Ffci: A framework for interpretable automatic evaluation of summarization. ArXiv preprint, abs/2011.13662.
- Krippendorff (2011) Klaus Krippendorff. 2011. Computing krippendorff’s alpha-reliability.
- Kryscinski et al. (2020) Wojciech Kryscinski, Bryan McCann, Caiming Xiong, and Richard Socher. 2020. Evaluating the factual consistency of abstractive text summarization. In Proceedings of the 2020 Conference on Empirical Methods in Natural Language Processing (EMNLP), pages 9332–9346, Online. Association for Computational Linguistics.
- Lewis et al. (2020) Mike Lewis, Yinhan Liu, Naman Goyal, Marjan Ghazvininejad, Abdelrahman Mohamed, Omer Levy, Veselin Stoyanov, and Luke Zettlemoyer. 2020. BART: Denoising sequence-to-sequence pre-training for natural language generation, translation, and comprehension. In Proceedings of the 58th Annual Meeting of the Association for Computational Linguistics, pages 7871–7880, Online. Association for Computational Linguistics.
- Lin (2004) Chin-Yew Lin. 2004. ROUGE: A package for automatic evaluation of summaries. In Text Summarization Branches Out, pages 74–81, Barcelona, Spain. Association for Computational Linguistics.
- Liu and Lapata (2019) Yang Liu and Mirella Lapata. 2019. Text summarization with pretrained encoders. In Proceedings of the 2019 Conference on Empirical Methods in Natural Language Processing and the 9th International Joint Conference on Natural Language Processing (EMNLP-IJCNLP), pages 3730–3740, Hong Kong, China. Association for Computational Linguistics.
- Lloret et al. (2013) Elena Lloret, Laura Plaza, and Ahmet Aker. 2013. Analyzing the capabilities of crowdsourcing services for text summarization. Language resources and evaluation, 47(2):337–369.
- Louis and Nenkova (2013) Annie Louis and Ani Nenkova. 2013. Automatically assessing machine summary content without a gold standard. Computational Linguistics, 39(2):267–300.
- Louviere and Woodworth (1991) Jordan J Louviere and George G Woodworth. 1991. Best-worst scaling: A model for the largest difference judgments. Technical report, Working paper.
- Maynez et al. (2020) Joshua Maynez, Shashi Narayan, Bernd Bohnet, and Ryan McDonald. 2020. On faithfulness and factuality in abstractive summarization. In Proceedings of the 58th Annual Meeting of the Association for Computational Linguistics, pages 1906–1919, Online. Association for Computational Linguistics.
- Nallapati et al. (2016) Ramesh Nallapati, Bowen Zhou, Cicero dos Santos, Caglar Gulcehre, and Bing Xiang. 2016. Abstractive text summarization using sequence-to-sequence RNNs and beyond. In Proceedings of The 20th SIGNLL Conference on Computational Natural Language Learning, pages 280–290, Berlin, Germany. Association for Computational Linguistics.
- Narayan et al. (2018) Shashi Narayan, Shay B. Cohen, and Mirella Lapata. 2018. Don’t give me the details, just the summary! topic-aware convolutional neural networks for extreme summarization. In Proceedings of the 2018 Conference on Empirical Methods in Natural Language Processing, pages 1797–1807, Brussels, Belgium. Association for Computational Linguistics.
- Pagnoni et al. (2021) Artidoro Pagnoni, Vidhisha Balachandran, and Yulia Tsvetkov. 2021. Understanding factuality in abstractive summarization with FRANK: A benchmark for factuality metrics. In Proceedings of the 2021 Conference of the North American Chapter of the Association for Computational Linguistics: Human Language Technologies, pages 4812–4829, Online. Association for Computational Linguistics.
- Qi et al. (2020) Weizhen Qi, Yu Yan, Yeyun Gong, Dayiheng Liu, Nan Duan, Jiusheng Chen, Ruofei Zhang, and Ming Zhou. 2020. ProphetNet: Predicting future n-gram for sequence-to-SequencePre-training. In Findings of the Association for Computational Linguistics: EMNLP 2020, pages 2401–2410, Online. Association for Computational Linguistics.
- Sabou et al. (2012) Marta Sabou, Kalina Bontcheva, and Arno Scharl. 2012. Crowdsourcing research opportunities: lessons from natural language processing. In Proceedings of the 12th International Conference on Knowledge Management and Knowledge Technologies, pages 1–8.
- Santhanam and Shaikh (2019) Sashank Santhanam and Samira Shaikh. 2019. Towards best experiment design for evaluating dialogue system output. In Proceedings of the 12th International Conference on Natural Language Generation, pages 88–94, Tokyo, Japan. Association for Computational Linguistics.
- Scialom et al. (2019) Thomas Scialom, Sylvain Lamprier, Benjamin Piwowarski, and Jacopo Staiano. 2019. Answers unite! unsupervised metrics for reinforced summarization models. In Proceedings of the 2019 Conference on Empirical Methods in Natural Language Processing and the 9th International Joint Conference on Natural Language Processing (EMNLP-IJCNLP), pages 3246–3256, Hong Kong, China. Association for Computational Linguistics.
- Song et al. (2019) Kaitao Song, Xu Tan, Tao Qin, Jianfeng Lu, and Tie-Yan Liu. 2019. MASS: masked sequence to sequence pre-training for language generation. In Proceedings of the 36th International Conference on Machine Learning, ICML 2019, 9-15 June 2019, Long Beach, California, USA, volume 97 of Proceedings of Machine Learning Research, pages 5926–5936. PMLR.
- Steen and Markert (2021) Julius Steen and Katja Markert. 2021. How to evaluate a summarizer: Study design and statistical analysis for manual linguistic quality evaluation. In Proceedings of the 16th Conference of the European Chapter of the Association for Computational Linguistics: Main Volume, pages 1861–1875, Online. Association for Computational Linguistics.
- Wang et al. (2020) Alex Wang, Kyunghyun Cho, and Mike Lewis. 2020. Asking and answering questions to evaluate the factual consistency of summaries. In Proceedings of the 58th Annual Meeting of the Association for Computational Linguistics, pages 5008–5020, Online. Association for Computational Linguistics.
- Zhang et al. (2020) Jingqing Zhang, Yao Zhao, Mohammad Saleh, and Peter J. Liu. 2020. PEGASUS: pre-training with extracted gap-sentences for abstractive summarization. In Proceedings of the 37th International Conference on Machine Learning, ICML 2020, 13-18 July 2020, Virtual Event, volume 119 of Proceedings of Machine Learning Research, pages 11328–11339. PMLR.
- Zhang et al. (2019) Xingxing Zhang, Furu Wei, and Ming Zhou. 2019. HIBERT: Document level pre-training of hierarchical bidirectional transformers for document summarization. In Proceedings of the 57th Annual Meeting of the Association for Computational Linguistics, pages 5059–5069, Florence, Italy. Association for Computational Linguistics.
Appendix A Appendix
Besides the average model rank and average rating scores across BWS, LS-5, and LS-10 evaluations, we also provide standard deviations in Table 5.
| CNN/DM | XSum | |||||
| Models | BWS | LS | LS-10 | BWS | LS | LS-10 |
| PEGASUS | ||||||
| ProphetNet | ||||||
| BART | ||||||
| BERTSUM | ||||||
To demonstrate our annotation template and facilitate future research, we show the interface for BWS annotations in Figures 3 and 4 and the interface for Likert annotations in Figures 5 and 6. We made use of the survey feature in Amazon Mechanical Turk (MTurk) to link to these Google Forms in Figure 7.


