Evaluating Policy Implications on the Restrictiveness of Flow-based Market Coupling with High Shares of Intermittent Generation: A Case Study for Central Western Europe
Abstract
The current stage in the evolution of the European internal energy market for electricity is defined by the transformation towards a renewable energy system. The Clean Energy Package aims to ensure that methods for capacity allocation and congestion management, that are at the center of the European internal market for electricity, align with this transformation.
Flow-based market coupling, the preferred method for capacity allocation, is first and foremost a formal process to allocate exchange capacities to the markets. However, the process also allows for many considerations of the involved parties that impact the resulting capacities. As part of the Clear Energy Package, the regulatory body enacted their ambition to increase exchange capacities by enforcing transmission system operators to allocate a minimum margin of physical line capacity with the goal of providing a higher level of competition and better integration of renewable energy sources. This study investigates this and other policy relevant consideration of flow-based market coupling.
The model results quantify the trade-off between permissive capacity allocation and increased congestion management. For high shares of intermittent renewable generation, less constrained exchange capacities are favorable, however also highlight the importance of the markets ability to integrate high shares of intermittent generation.
Keywords:
Flow-Based Market Coupling, FBMC, Economic Dispatch Problem, Transmission System, Optimal Power Flow, Security Constrained Optimal Power Flow1 Introduction
Europe’s commitment to become climate neutral by 2050 (Directorate General for Energy 2019) draws a clear path towards a fully decarbonized electricity sector. This transformation is characterized by a large increase of intermittent renewable generation as well as decommissioning of conventional and nuclear generation capacities. The current understanding of the European internal energy market (IEM) for electricity aims to efficiently achieve climate targets while providing generators and consumers with non-discriminatory market access and ensuring affordable and secure provision of electricity (European Commission 2019a, Art. 1). Its central mechanism of capacity allocation and congestion management aims to efficiently use transmission infrastructure, ensures operational security and transparency (European Commission 2015). Capacity allocation summarizes methods and regulations that dimension electricity trading volumes that market participants can use based on the physical transmission capacity and operational considerations. Congestion management describes actions and protocols taken by the responsible transmission system operator (TSO) if network congestion occurs (European Commission 1997).
Previously, capacity allocation was implemented using static, bilateral net transfer capacitys (NTCs) which are based on non-public network models and assessments of historic network loads (ETSO 2001). NTCs do not account for restricting transmission assets within market zones, resulting in potentially too conservative capacity allocation and increased congestion management (Amprion et al. 2011). From 2015 flow-based market coupling (FBMC) replaced NTC as the preferred method for capacity allocation and is used in the Central Western Europes (CWEs) region11 1 The CWE region consists of Belgium, France, Germany, Luxembourg and the Netherlands.. Its main advantages are increased transparency from a clear methodology that describes capacity allocation and, more importantly, the fact that capacity is allocated towards the net-position of each bidding-zone based on individual network elements rather than bilaterally. Thus FBMC ultimately better aligns with the goal to utilize the network infrastructure more efficiently and accommodate the transformation towards a decarbonized electricity system.
Since its inauguration, FBMC has proven to be the more efficient capacity allocation compared to NTCs while providing at least the same level of security (Rte et al. 2015). However, the regulation seeks to achieve high levels of price convergence between market areas leading to overall lower prices, unrestricted access to the internal European electricity market and thereby successful integration of renewable generation (ACER and CEER 2020). As a result, Regulation (European Commission 2019a) makes clear that capacity allocation has priority over congestion management and that TSOs should not restrict commercial exchange to solve internal congestion, as previously observed by ACER 2016, and explicitly requires that at least 70% of physical capacity is allocated to the market. This directly alters the method to derive trading volumes and makes clear that the formal process of deriving trading volumes using the flow-based methodology, which originally made the appearance to be a purely formal process, leaves room to implement policy decisions. While the canon of academic literature explains and depicts the formal side of the process and explores the effects of different parametrizations very well, policy decisions that define which outcome aligns with political targets are rarely discussed or numerically modeled.
Capacity allocation within FBMC is defined by the two objectives of market integration, meaning the provision of commercial exchange capacity, and secure operation whose outcome results in very different trading volumes. This paper aims to highlight this presumed trade-off and investigate how the policy decision to prioritize capacity allocation over congestion management affects the efficiency of FBMC and its ability to accommodate the transformation in the European electricity system.
2 Background on FBMC and Literature Review
FBMC is a multistage process coordinated by the TSOs which aims to allocate commercial exchange capacities to the markets. Specifically, this three step process, as depicted in Figure 1, consists of a D-2 capacity forecast, also called basecase, which represents the best estimate of the system state at delivery (50Hertz et al. 2020). The basecase is a result from forecasts on load and renewable energy sources (RES) feed-in and already allocated capacities e.g. long term nominations in conjunction with network models. Based on this forecast so called flow-based parameters are calculated and used to constrain the commercial exchange in the day-ahead market coupling stage. In the European IEM the central market clearing algorithm Pan-European Hybrid Electricity Market Integration Algorithm (EUPHEMIA) matches demand and supply bids subject to the flow-based parameters and maximizing welfare. Lastly, D-0 stage consists of intraday adjustments and congestion management, meaning the physical delivery.
Of particular interest are the so called flow-based parameters, which constitute the capacity allocation in FBMC and are generated, exchanged and published following specific rules requested by regulation (European Commission 2015). Details on how the parameters are obtained is laid out in the documentation of the flow-based process (50Hertz et al. 2020). Their composition is defined by the remaining available commercial exchange capacity, denoted as remaining available margin (RAM), in the expected market outcome (basecase) which are allocated towards the markets, i.e. to changes in net-position between the forecasted basecase () and day-ahead market coupling stage (). Net-position changes are mapped to power flows in line elements by a so-called zonal power transmission distribution factor (PTDF) matrix and bounded by line capacities
Equations (1) formalise this intuition, i.e. remaining capacities on network elements are available changes in net-positions between day-ahead and basecase. Reformulation yields Equation (1c) that defines the flow-based parameters in terms of net-positions in the day-ahead market stage, the zonal PTDF matrix and RAMs and align with the formulation in (50Hertz et al. 2020, p.55).
| (1a) | ||||
| (1b) | ||||
| (1c) | ||||
A PTDF matrix expresses the physical relation between nodal power injections and power flows in the transmission network in a linear manner (Weinhold and Mieth 2020a). The PTDF is composed of a selection of network elements and contingencies and is thereby part of the parametrization. Commonly, critical network elements (CNEs) are selected based on their importance to commercial exchange. For each CNE a set of contingencies (C) can be considered if its outage significant impacts the respective CNE. The resulting set of critical network element and contingencys (CNECs) comprises the PTDF matrix. Given that the net-position delta between basecase and day-ahead is small, the set of generators that will serve this delta by “shifting” their output can be anticipated. The resulting participation factor is called generation shift key (GSK) and is used as a mapping to transform the nodal to zonal .
The resulting flow-based parameters define a feasible region for net-positions within the day-ahead market stage.
| (2) |
The resulting feasible region (2) has to be at least non-empty, which is not necessarily given, and either requires specific parametrization of the basecase, e.g. enforcing margins on CNE or processing of the PTDF and RAM. This can be done by selecting specific networks elements that compose the PTDF, enforce minimum RAM values.
Therefore, the resulting flow-based parameters do not only reflect formal context but also methods to account for uncertainty or imperfections, e.g. from the zonal projections which allow or explicitly are used for the consideration of policy decisions towards the restrictiveness of commercial exchange. Generally, differences in parametrization can be explained by three reasons:
- 1.
To ensure secure operation and reduce congestion management. This could be done through the addition of security margins on RAM or by selecting a larger set of CNECs, including internal network elements.
- 2.
To enlarge the trading domain and provide increased capacity to the market. This is more in line with regulation, and aims to achieve a higher level of price convergence. This is done through minimum values for RAM, formally knows as the minimum remaining available margin (minRAM) criterion.
- 3.
To be more accurate, for example reducing inaccuracies of the zonal projection via GSKs, by more precisely derived security margins based on historic data.
Academic publications on modeling FBMC and its parametrizations are still scarce. Early publications such as Van den Bergh et al. 2016 and Boury 2015 formally describe the process and are extended recently by Schönheit et al. 2021; Felten et al. 2021; Byers and Hug 2020 that discuss input parameters and their effects, illustrated by stylized examples. Generally, most academic publications adhere to a similar methodology that is depicted in Figure 1 and utilize an economic dispatch problem for each of the three steps.
Applications based around the status-quo in the CWE region exist and usually compare a result metric based on scenarios or different parametrizations. Matthes et al. 2019 explores how minRAMs affect exchange and the number of contingencies, Marjanovic et al. 2018 analyses prices and redispatch quantity for the planned expansion of the flow-based region from CWE to the CORE region22 2 The CORE region extends CWE by Austria, the Czech Republic, Hungary, Poland, Romania, Slovakia and Slovenia., Wyrwoll et al. 2018 quantifies the effect of security margins on net-positions and generation schedules and Schönheit et al. 2020 the impact of GSKs on CNECs.
All papers provide valuable contributions to the field in illustrating the impact of parametrization, but focus on the formal composition of the parameters and do not attribute the dimension of the parametrization that allows to decide on the effect of the parametrization, namely the trade-off between capacity allocation and congestion management. A notable exception is Schönheit et al. 2020 that not only provides transparency by an open modelling approach but explicitly provides insight in the effect of a policy decision influencing an otherwise formal method. The authors also point out differences in how minRAMs can be included in the modelling process.
Extending on exiting research, this paper contributes to academic studies on FBMC in different ways:
- 1.
It numerically shows the impact of prioritizing capacity allocation over congestion management in FBMC.
- 2.
The case-study covers full CWE for the target year, explicitly covering the medium term influx of intermittent generation and its effect on the efficiency of FBMC.
- 3.
All data and methods are provided open (under open licence) and accessible (tested and documented) as part of the Power Market Tool (POMATO) described in Weinhold and Mieth 2020b and dedicated data processing in PomatoData (Weinhold 2021).
3 Model and Case Study
The numerical experiments are conducted using the electricity market model POMATO proposed in Weinhold and Mieth 2020b which was created to model zonal electricity markets and explicitly synthesize the FBMC process. The used formulation follows the description in Weinhold and Mieth 2021 and aligns with the process shown in Figure 1. Therefore, the model description in this section is limited to a brief description, the full formal description can be found in B.
Equations (3) represent a high level description of the economic dispatch problem that that is used in this study:
| (3a) | ||||
| s.t. | ||||
| Cost Definition | (3b) | |||
| Generation Constraints | (3c) | |||
| Storage Constraints | (3d) | |||
| Energy Balances | (3e) | |||
| (3f) | ||||
Each step, the D-2 capacity forecast (basecase), D-1 day-ahead market clearing and D-0 congestion management utilize the same economic dispatch problem (3) that finds the most cost effective allocation of generation capacities, defined by generation cost COST GEN and cost for curtailment of intermittent generation COST CURT, to satisfy demand subject to generation capacity (3c) and storage (3d) constraints. Electricity is balanced for each network node in nodal net-injections and each market area in zonal net-positions (3e), which can be constrained by transport constraints (3f) that depend on the step in the flow-based process.
Specifically, the basecase is calculated with linear power flow constraints on nodal net-injections to ensure feasibility on all lines in the network. The day-ahead stage is modeled with transport constraints on net-positions as described in Section 2 and Equation (2) for the zones participating in FBMC, other zones are constraint with bilateral NTCs. Transmission on high-voltage direct-current (HVDC) lines is always included as a decision variable, as HVDC lines are considered active network elements.
Congestion management, similarly to the basecase, solves a nodal market however with additional cost for congestion management COST CM, i.e. redispatch – deviations from generation schedules of the day-ahead market stage and only conventional, non-storage plants within the flow-based region are considered for redispatch. Curtailment from the market stage persists in congestion management, but can be further increased to maintain feasible power flows as part of the congestion management.
The resulting total cost reflect cost for generation as well as cost to ensure feasibility in the network. While cost based redispatch is desired, the D-0 congestion management should prioritize network feasibility. Therefore the cost parameters for curtailment and redispatch are imposed, that are additive to the generation cost. Both are chosen based on average cost for Germany (Bundesnetzagentur and Bundeskartellamt 2019), with around 25€ per MWh redispatch and 100€ per MWh curtailment.
3.1 Input Data
The model application covers the CWE region, as depicted in Figure 2, for the years 2020 and 2030. Zones part of the CWE are modeled with transmission network and neighboring countries are modeled as single nodes.

The required data is extensive and collected as well as processed using different contributions by the open-data community and the ENTSO-E Transparency Platform. It uses the Open Data Portal of Forschungsstelle für Energie (FfE) (Ebner et al. 2019) for geo-information and regionalized RES potentials. Geo-information is collected based on the standardised Nomenclature of Territorial Units for Statistics (NUTS) data of the European Union, that divides countries in standardised regions and sub-regions and allows for geo-referenced data collection. NUTS-level 0 defines countries and higher values indicate higher resolution. The atlite package for availability timeseries on NUTS-3 level (Hofmann et al. 2021) and hydro storage inflows (Liu et al. 2019) using the HydroBASINS database (Lehner and Grill 2013). Dispatchable generation capacities come from the JRC Hydro-power plants database (Felice et al. 2021) for hydro generation capacities and the Open Power System Data Project (Weibezahn et al. 2018) for conventional and nuclear power plants.
The underlying network data originates from the updated fork of the GridKit ENTSO-E gridmap extract (Wiegmans 2016) part of well as few specific expansions that were not included in the data, like the already online ‘‘Redwitz-Altenfeld’’ and ‘‘Vieselbach-Lauchstädt’’ connections. The process of estimating specific line parameters is part of the model documentation33 3 See: pomato.readthedocs.io/en/latest/line_parameters.html.
Nodal demand is derived from zonal load published on the ENTSO-E Transparency Platform44 4 See: transparency.entsoe.eu using sector specific standard load profiles and NUTS-3 data on energy consumption, and gross value added (Kunz et al. 2017). Additional data from ENTSO-E Transparency Platform that is used are scheduled commercial exchanges to derive NTCs for non-CWE bidding zones and weekly storage levels. The first are used to derive NTCs for zones neighboring the flow-based region and the latter for rolling horizon model execution that limits the model’s foresight.
Installed capacities of wind and solar in 2030 are obtained from pathway optimization of the European energy system using AnyMOD (Göke 2021). In contrast to the values part of publications Göke et al. 2021; Hainsch et al. 2020 that depict a 2040 fully decarbonized system, the values in this study are obtained for 2030 with the latest ENTSO-E “sustainable transition” scenario as a lower bound for renewable capacity and an upper bound for thermal capacities (ENTSOG and ENTSO-E 2020). The wind and photovoltaik (PV) capacities are distributed based on the FfE potentials. Decommissioning of conventional and fissile generation capacities is based on plant lifetime and national energy and climate plans. However, plant specific commissioning and decommissioning of individual plants proves challenging and therefore the used data-set includes modest changes to the conventional and nuclear capacity and the two target years are mostly defined by the regionalized increase in wind and PV capacities. Table 1 shows the decommissioning of lignite, hard coal and nuclear generation capacities between the 2020 and 2030 scenario.
| BE | CH | DE | ES | FR | NL | PL | SE | UK | |
|---|---|---|---|---|---|---|---|---|---|
| lignite | 0 | 0 | 20.6 | 0.92 | 0 | 0 | 2.78 | 0 | 0 |
| hard coal | 0 | 0 | 8.47 | 1.96 | 0.88 | 1.54 | 4.58 | 0.04 | 3.53 |
| uran | 1.78 | 1.03 | 10.8 | 2.27 | 18.94 | 0 | 0 | 2.86 | 2.68 |
The weather year for both 2020 and 2030 was chosen to be 2019. Therefore, 2019 timeseries for load and availability of intermittent generation are used as well as 2019 commercial exchanges used to derive static NTCs and weekly storage levels.
The final data-set is compiled using the complementary PomatoData tool of POMATO (Weinhold 2021) that includes all data processing and documents data origin, thereby provides the required accessibility and compatibility to the data and are published supplementary to the paper.
3.2 Parametrization of the flow-based parameters
The aim of this study is to quantify the effect of less restrictive capacity allocation on the resulting congestion management. Therefore the parametrization of the flow-based parameters remains very close to the official documentation (50Hertz et al. 2020) for GSK, CNEC selection and the implementation of the minRAM criterion.
For all scenarios a Pro-Rata GSK is used. This GSK weights nodal participation factors based on the scheduled power output of dispatchable generation capacities and is the basis for most GSKs currently in use (50Hertz et al. 2020) and has proven to be effective (Schönheit et al. 2020). For the construction of the zonal PTDF, CNEs are selected based on a 5% threshold in the zone-to-zone PTDF, with the exception of one scenario where only cross-border lines are considered critical. Contingencies are selected based on a 20% sensitivity threshold of a contingency towards the CNE, i.e. contingencies are considered if in case of an outage more than 20% of the load is diverted to the respective CNE.
The minRAM criterion is enforced by setting the RAM to in Equation (2) and the model is run for different minRAM values of 20%, 40% and 70%. In addition the 70% is also run with only cross-border lines as CNE indicated as 70% (only CB) in the following result tables. The effect on the day-ahead capacity allocation is visualized in a flow-based domain for the exchange between Germany-France and Germany-Netherlands in Figure 4.
The four configurations differ in the permissiveness of commercial exchange and we can expect higher trading volumes with higher minRAM requirements. Additionally, in order to further limit the impact of internal congestions on cross-border exchange (European Commission 2019a) the fourth scenario only considers cross-border lines as CNEs, thus further relaxing the commercial exchange domains.
The final 2030 data-set is composed of 5458 generators, that includes 2236 wind/PV plants and 953 storages. The network is made up of 1663 nodes, 3276 lines and 100 HVDC lines. The model size is substantial and to alleviate the computational effort, the model is solved for every 7th week of the year, 8 weeks in total, with the electricity market model POMATO (Weinhold and Mieth 2020b). Therefore the model remains tractable on standard pc hardware, all results are obtained using a AMD Ryzen 7 CPU, 32GB of memory and the Gurobi solver (Gurobi Optimization LLC 2018).
4 Model Results
As described in Section 3 FBMC is modeled in three dedicated steps. From a basecase the day-ahead market result is obtained using flow-based parameters following the four configurations regarding the permissiveness of the day-ahead trading domain and subsequent congestion management. The model results are evaluated after congestion management and therefore include generation cost from the market- and congestion management stage, as well as additional cost for redispatch and curtailment. Figure 5 presents the resulting dispatch for the 70% minRAM configuration in 2020 and 2030 and illustrates the overall system states with a renewable share of 43% in 2020 and 66% in 2030 as well as the volumes and composition of congestion management.
As the primary result metric, the system cost indicate the efficiency of the market design and when decomposed into cost for generation, curtailment and redispatch show the relation between capacity allocation and congestion management. Table 2 shows lower system cost in 2030 due to an increased share of intermittent renewable generation and decreasing generation cost with more permissive commercial exchange domains. Cost for congestion management are the highest for the 20% minRAM configuration, indicating overly conservative trading domain and in combination with the least effective use of generation capacities, results in highest total cost. With higher commercial exchange capacities curtailment increases and redispatch quantities decrease. The lowest total cost align with the lowest congestion management volume, depicted in Table 3, in the 70% minRAM configuration for 2020 and the less constraint 70% minRAM (only CB) configuration in 2030.
| minRAM configuration | |||||
| 20% | 40% | 70% | 70% (only CB) | ||
| 2020 | Generation | 9,837 | 9,758 | 9,718 | 9,704 |
| Curtailment | 104 | 108 | 111 | 117 | |
| Redispatch | 129 | 94 | 84 | 98 | |
| Total | 10,070 | 9,960 | 9,913 | 9,919 | |
| 2030 | Generation | 6,926 | 6,905 | 6,888 | 6,864 |
| Curtailment | 559 | 560 | 567 | 588 | |
| Redispatch | 180 | 160 | 155 | 146 | |
| Total | 7,665 | 7,625 | 7,610 | 7,598 | |
Overall, the best configuration in 2020 represents a 1.56% cost reduction and 27.84% reduction in congestion management in comparison to the 20% minRAM configuration. In 2030 the total cost reduction is 0.87% and congestion management is reduced by 8.34%.
| minRAM configuration | |||||
|---|---|---|---|---|---|
| 20% | 40% | 70% | 70% (only CB) | ||
| 2020 | Curtailment | 1.05 | 1.09 | 1.11 | 1.17 |
| Redispatch | 5.2 | 3.77 | 3.4 | 3.94 | |
| Total | 6.25 | 4.86 | 4.51 | 5.11 | |
| 2030 | Curtailment | 5.6 | 5.6 | 5.68 | 5.89 |
| Redispatch | 7.23 | 6.43 | 6.22 | 5.87 | |
| Total | 12.83 | 12.03 | 11.9 | 11.76 | |
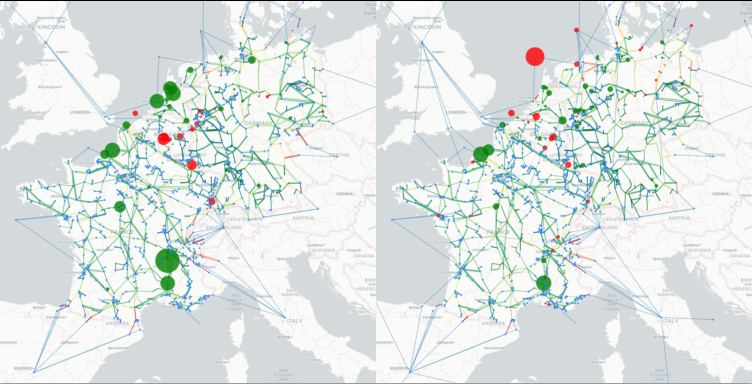
In order to evaluate the impact on congestion management Figure 6 shows the difference in congestion management between the 20% minRAM and 70% minRAM configurations for 2020 and 2030. For both years less restricted commercial exchange causes more congestion management along the CWE border region, which is out-weight by less congestion management generally more within the bidding zones. The impact of the substantial increases in offshore wind capacities in the north sea is also clearly visible.
A core metric of the European IEM is price convergence, as it quantifies increased market efficiency and competition that should result in lower prices (European Commission 2019b). Table 4 shows different compositions of the model endogenous electricity prices resulting from the dual variable of the energy balances. For the day-ahead (D-1) stage is the average zonal price for the CWE bidding zones and the average difference in zonal price between the CWE bidding zones. For congestion management (D-0), with nodal restrictions present, nodal marginal prices in congestion management are averaged. The marginal in congestion management indicates the additional nodal cost after congestion management, meaning after network feasibility is achieved.
| 20% | 40% | 70% | 70% (only CB) | ||||||
|---|---|---|---|---|---|---|---|---|---|
| 2020 | D-1 | 50.02 | 24.41 | 44.68 | 22.4 | 41.61 | 21.23 | 39.08 | 17.06 |
| D-0 | 47.18 | 48.13 | 48.46 | 47.88 | |||||
| 2030 | D-1 | 43.47 | 31.73 | 42.02 | 24.62 | 41.3 | 22.49 | 37.58 | 19.46 |
| D-0 | 54.39 | 55.48 | 56.32 | 57.67 | |||||
Similar to the system cost results in Table 2, average prices decrease between 2020 and 2030 due to the influx of low cost generation. For both 2020 and 2030 the average prices decrease with less restricted commercial exchange domains. Additionally, price differences decrease with more exchange capacities with 2030 showing, on average, price differences at lower average prices.
Results of the average marginal cost for electricity after congestion management show generally higher values in 2030, reflecting the increased congestion management volumes. This is visualized in Figure 7, that shows the average nodal prices after congestion management by the dual on the energy balances as a contour plot for the modeled region for the 70% minRAM configuration.

The plot verifies the overall increased congestion management effort in 2030. Also, given the distribution of RES capacities by potential, 2030 shows fairly even contour in the CWE region.
Interestingly, between the FBMC configurations, the values negatively correlate to the congestion management volumes, with higher prices for lower overall volumes. Thereby, higher average price after congestion management indicates that additional nodal load is more often subject to network constraints, or indicate higher average network utility.
5 Conclusions
The presented results show the effect of FBMC configurations that, in line with the regulators perspective, provide higher commercial exchange capacities to the market. The modeled configurations are chosen to represent the status-quo and the proposed target by 2030, modeled through different minRAM requirements and choice of critical network elements.
More permissive configurations provide lower generation cost, as the markets are less constrained. For 2020, the trade-off between capacity allocation and congestion management is visible. Here both, too constrained as well as too permissive flow-based parameter configurations lead to higher overall cost. The least cost solution is provided by the 70% minRAM configuration. For 2030 the most permissive configuration 70% minRAM (only CB) provided the least over cost and congestion management.
In terms of price convergence, the results show that indeed more permissive exchange capacities lead to higher levels of price convergence in both 2020 and 2030. However, 2030 shows an overall lower price convergence than 2020 at lower overall price level, indicating higher price volatility in 2030. Analysis of marginal cost in congestion management also reflect the overall higher volumes of congestion management. Additionally, the comparison between the FBMC configurations leads to the conclusion that more permissive flow-based domains lead to a higher network utilization.
This paper provides comprehensive insights into the effect of policy relevant considerations as part of FBMC. This includes the status-quo as well as the mid-term future. Indeed, enforcing larger commercial exchange capacities lead to increased price convergence, however potentially with increased congestion management. The results also indicate that larger commercial exchange domains are favourable in high shares of intermittent renewable generation. However, the 2030 scenario also shows high levels of congestion management, that indicate the systems inability to adequately make use or transport excess intermittent renewable generation. The extensive use of curtailment as part of congestion management, despite the high cost, also indicates that the homogeneous distribution makes curtailment very effective tool for congestion management. The 2030 scenario in this study differs from the status-quo mainly in terms of the renewable capacities and the HVDC projects of the immediate future. Thereby the effect of higher shares of intermittent renewable generation becomes visible.
The methods and data that are used in this research are open and accessible and aim to provide transparency and sustainability to the research and results of this study as well prove useful for future work. The proposed data-set that accompanies the used electricity market model POMATO (Weinhold and Mieth 2020b) allows for detailed and in-depth analysis of large-scale electricity system in respect to market design and the involved policy decisions.
For future studies, the impact of means to reduce excess generation, flatten load and increase system flexibility via sector coupling, prosumage or demand response would provide relevant avenues for extensions. The expected decrease in congestion management as well as additional flexibility in terms of network operation would represent valuable insights.
Aknowledements
The author gratefully acknowledges the support by the German Federal Ministry for Economic Affairs and Energy (BMWi) in the project “Modellierung (De-)Zentraler Energiewenden: Wechselwirkungen, Koordination und Lösungsansätze aus systemorientierter Perspektive” (MODEZEEN, 03EI1019B)
Appendix A Nomenclature
| A. Sets | |
| Set of time steps within the model horizon. | |
| Set of generators. | |
| Subset of intermittent generators. | |
| Set of network nodes. | |
| CNEC | Set of critical network elements and contingencies. |
| Set of bidding zones. | |
| B. Variables | |
| Active power generation at indexed by | |
| Curtailment . | |
| Active nodal power injection at . | |
| Zonal net-positions at . | |
| Flow on HVDC lines at . | |
| Bilateral exchange at indexed by | |
| Storage level at indexed by | |
| Storage demand/charging at indexed by | |
| Active power redispatch at . | |
| C. Parameters | |
| Nodal load at . | |
| Available intermittent generation at | |
| Mapping of generators/load (subscript) to nodes/zones (superscript). | |
| Upper generation limit. | |
| Upper storage charging limit indexed by | |
| Storage charging efficiency indexed by | |
| Upper storage capacity indexed by | |
| Maximum line flow. | |
| Maximum dc-line flow. | |
| Net-transfer capacity indexed by | |
| Day-ahead scheduled generation at . | |
| Day-ahead scheduled curtailment at . | |
Appendix B Model Formulation
Equations 4 formulate the economic dispatch problem that finds the least cost dispatch to satisfy demand for each timestep .
| (4a) | ||||||
| s.t. | (4b) | |||||
| (4c) | ||||||
| (4d) | ||||||
| (4e) | ||||||
| (4f) | ||||||
| (4g) | ||||||
| (4h) | ||||||
| (4i) | ||||||
| (4j) | ||||||
| (4k) | ||||||
The objective function (4a) minimizes generation cost, given by a cost function and the vector of hourly generation levels and curtailment . Equations (4b) and (4c) provide bounds to generation and curtailment based on the installed capacity and available capacity .
Storages are modeled using a storage balance (4d) and bounds on storage charging (4e) and storage level (4f). Note, the storage balance requires parametrization of start- and end levels for feasibility. In the application in this study, weekly historic storage levels are used for this purpose.
Generation and load are balanced in nodal injections for each node in (4h) and zonal net-positions for each zones in (4i). The net-position can be expressed as the sum of bilateral exchanges for each zone as per (4j). The positive variable captures bilateral exchange but requires physical connection between zones, otherwise it is fixed to zero.
HVDC lines, as active network elements are always part of the economic dispatch problem. Flow on HVDC lines is bounds by line’s capacity in (4g) and included in the nodal energy balance with an incidence matrix that maps flows to start- and end nodes.
The entire system is balanced with constraint (4k).
B.1 Network Constraints
As discussed in Section 3, problem (4) can be subject to transport constraints to model the different FBMC steps.
| (5) | ||||||
| (6) | ||||||
| (7) |
B.2 Congestion management
Congestion management finds the least cost deviation from day-ahead generation schedule and that are the decisions on and from the previous market clearing stage while creating network feasibility as per (5).
| (8a) | ||||||
| (8b) | ||||||
| (8c) | ||||||
Equation (8a) captures the additional cost that occur for changing the day-ahead generation schedule. Constraints (8b) and (8c) bound the allowed deviation from day-ahead schedule for generation and curtailment.
The dispatch problem for congestion management is therefore:
| (9) | ||||
| s.t. | (10) | |||
| (11) |
References
- 50Hertz et al. (2020) 50Hertz, Amprion, APG, Creos, Elia, Rte, TenneT, TransnetBW, 2020. Documentation of the CWE FB MC Solution - Version 5.0. Technical Report.
- ACER (2016) ACER, 2016. Decision of the Agency for the Cooperation of Energy Regulators No 06/2016 of 17 November 2016: On the Electricity Transmission System Operators’ Proposal for the Determination of Capacity Calculation Regions. Technical Report.
- ACER and CEER (2020) ACER, CEER, 2020. Annual Report on the Results of Monitoring the Internal Electricity and Natural Gas Markets in 2019. Report.
- Amprion (2019) Amprion, 2019. Amprion Market Report 2019 - Flow Based Market Coupling: Development of the Market and Grid Situation 2015-2018. Report.
- Amprion et al. (2011) Amprion, APX-ENDEX, Belpex, Creos, Elia, EnBW, EPEX SPOT, RTE, TenneT, 2011. CWE Enhanced Flow-Based MC feasibility report.
- Boury (2015) Boury, J., 2015. Methods for the Determination of Flow-Based Capacity Parameters: Description, Evaluation and Improvements. Master’s Thesis. KU Leuven.
- Bundesnetzagentur and Bundeskartellamt (2019) Bundesnetzagentur, Bundeskartellamt, 2019. Monitoring Report 2019. Report.
- Byers and Hug (2020) Byers, C., Hug, G., 2020. Modeling flow-based market coupling: Base case, redispatch, and unit commitment matter, in: 2020 17th International Conference on the European Energy Market, pp. 1–6.
- Directorate General for Energy (2019) Directorate General for Energy, 2019. Clean Energy for All Europeans. White Paper. European Commision.
- Ebner et al. (2019) Ebner, M., Fiedler, C., Jetter, F., Schmid, T., 2019. Regionalized Potential Assessment of Variable Renewable Energy Sources in Europe, in: 2019 16th International Conference on the European Energy Market, pp. 1–5.
- ENTSOG and ENTSO-E (2020) ENTSOG, ENTSO-E, 2020. TYNDP 2020: Scenario Report. Report.
- ETSO (2001) ETSO, 2001. Procedures for Cross-Border Transmission Capacity Assessments. Technical Report.
- European Commission (1997) European Commission, 1997. Directive 96/92/EC concerning common rules for the internal market in electricity.
- European Commission (2015) European Commission, 2015. Commission Regulation (EU) 2015/1222: Establishing a guideline on capacity allocation and congestion management.
- European Commission (2019a) European Commission, 2019a. Commission Regulation (EU) 2019/943 on the internal market for electricity.
- European Commission (2019b) European Commission, 2019b. Directive (EU) 2019/944 on common rules for the internal market for electricity.
- Felice et al. (2021) Felice, M.D., Peronato, G., Kavvadias, K., 2021. JRC Hydro-Power Database. Dataset Release v8.
- Felten et al. (2021) Felten, B., Osinski, P., Felling, T., Weber, C., 2021. The flow-based market coupling domain - Why we can’t get it right. Utilities Policy 70, 101136.
- Gurobi Optimization LLC (2018) Gurobi Optimization LLC, 2018. Gurobi Optimizer Reference Manual.
- Göke (2021) Göke, L., 2021. A graph-based formulation for modeling macro-energy systems. Applied Energy 301, 117377.
- Göke et al. (2021) Göke, L., Kendziorski, M., Kemfert, C., von Hirschhausen, C., 2021. Accounting for Spatiality of Renewables and Storage in Transmission Planning. arXiv Preprint 2108.04863.
- Hainsch et al. (2020) Hainsch, K., Brauers, H., Burandt, T., Göke, L., von Hirschhausen, C.R., Kemfert, C., Kendziorski, M., Löffler, K., Oei, P.Y., Präger, F., Wealer, B., 2020. Make the European Green Deal Real: Combining Climate Neutrality and Economic Recovery. Politikberatung Kompakt 153. DIW Berlin.
- Hofmann et al. (2021) Hofmann, F., Hampp, J., Neumann, F., Brown, T., Hörsch, J., 2021. Atlite: A Lightweight Python Package for Calculating Renewable Power Potentials and Time Series. Journal of Open Source Software 6, 3294.
- Kunz et al. (2017) Kunz, F., Kendziorski, M., Schill, W.P., Weibezahn, J., Zepter, J., von Hirschhausen, C., Hauser, P., Zech, M., Möst, D., Heidari, S., Felten, J., Weber, C., 2017. Electricity, Heat and Gas Sector Data for Modelling the German System. Data Documentation 92. DIW Berlin.
- Lehner and Grill (2013) Lehner, B., Grill, G., 2013. Global river hydrography and network routing: Baseline data and new approaches to study the world’s large river systems. Hydrological Processes 27, 2171–2186.
- Liu et al. (2019) Liu, H., Andresen, G.B., Brown, T., Greiner, M., 2019. A high-resolution hydro power time-series model for energy systems analysis: Validated with Chinese hydro reservoirs. MethodsX 6, 1370–1378.
- Marjanovic et al. (2018) Marjanovic, I., vom Stein, D., van Bracht, N., Moser, A., 2018. Impact of an Enlargement of the Flow Based Region in Continental Europe, in: 2018 15th International Conference on the European Energy Market, pp. 1–5.
- Matthes et al. (2019) Matthes, B., Spieker, C., Klein, D., Rehtanz, C., 2019. Impact of a Minimum Remaining Available Margin Adjustment in Flow-Based Market Coupling, in: 2019 IEEE Milan PowerTech, pp. 1–6.
- Rte et al. (2015) Rte, Amprion, Creos, Elia, TenneT, TransnetBW, 2015. CWE Flow Based Market Coupling project: Parallel Run performance report.
- Schönheit et al. (2021) Schönheit, D., Kenis, M., Lorenz, L., Möst, D., Delarue, E., Bruninx, K., 2021. Toward a fundamental understanding of flow-based market coupling for cross-border electricity trading. Advances in Applied Energy 2, 100027.
- Schönheit et al. (2020) Schönheit, D., Weinhold, R., Dierstein, C., 2020. The impact of different strategies for generation shift keys (GSKs) on the flow-based market coupling domain: A model-based analysis of Central Western Europe. Applied Energy 258, 114067.
- Van den Bergh et al. (2016) Van den Bergh, K., Boury, J., Delarue, E., 2016. The Flow-Based Market Coupling in Central Western Europe: Concepts and definitions. The Electricity Journal 29, 24–29.
- Weibezahn et al. (2018) Weibezahn, J., Weinhold, R., Gerbaulet, C., Kunz, F., 2018. OPSD Data Package: Conventional Power Plants. Dataset Version: 2018-12-20.
- Weinhold (2021) Weinhold, R., 2021. PomatoData - GitHub Repository. www.github.com/richard-weinhold/pomato_data.
- Weinhold and Mieth (2020a) Weinhold, R., Mieth, R., 2020a. Fast Security-Constrained Optimal Power Flow Through Low-Impact and Redundancy Screening. IEEE Transactions on Power Systems 35, 4574–4584.
- Weinhold and Mieth (2020b) Weinhold, R., Mieth, R., 2020b. Power Market Tool (POMATO) for the Analysis of Zonal Electricity Markets. arXiv Preprint 2011.11594v1.
- Weinhold and Mieth (2021) Weinhold, R., Mieth, R., 2021. Uncertainty-Aware Capacity Allocation in Flow-Based Market Coupling. arXiv Preprint.
- Wiegmans (2016) Wiegmans, B., 2016. Gridkit Extract Of Entso-E Interactive Map. Dataset. Zenodo.
- Wyrwoll et al. (2018) Wyrwoll, L., Kollenda, K., Müller, C., Schnettler, A., 2018. Impact of Flow-Based Market Coupling Parameters on European Electricity Markets, in: 53rd International Universities Power Engineering Conference, pp. 1–6.