Characterising the extended morphologies of BL Lacs at 144 MHz with LOFARJournal: The Astrophysical Journal Supplement SeriesFacilities: LOFAR, Haleakala Observatory (Pan-STARRS), and VLA.DDFacet (Tasse et al. 2018), KillMS (Tasse 2014; Smirnov & Tasse 2015), Python (van Rossum 1995), NDPPP (van Diepen et al. 2018), NumPy (van der Walt et al. 2011), Astropy (Astropy Collaboration et al. 2013), TOPCAT (Taylor 2013), PyBDSF (Mohan & Rafferty 2015), and Matplotlib (Hunter 2007).
Abstract
We present a morphological and spectral study of a sample of BL Lacs using the LOFAR Two-Metre Sky Survey Second Data Release (LDR2). Extended emission has been identified at frequencies around BL Lacs, but with LDR2 it is now possible to systematically study their morphologies at , where more diffuse emission is expected. LDR2 reveals the presence of extended radio structures around of the BL Lac nuclei, with angular extents ranging up to , corresponding to spatial extents of . The extended emission is likely to be both unbeamed diffuse emission and beamed emission associated with relativistic bulk motion in jets. The spatial extents and luminosities of the extended emission are consistent with the AGN unification scheme where BL Lacs correspond to low-excitation radio galaxies with the jet axis aligned along the line-of-sight. While extended emission is detected around the majority of BL Lacs, the median spectral index and core dominance at indicate that the core component contributes on average to the total low-frequency flux density. A stronger correlation was found between the core flux density and the -ray photon flux () compared to the extended flux density and the -ray photon flux (). This suggests that the radio-to--ray connection weakens at low radio frequencies because the population of particles that give rise to the -ray flux are distinct from the electrons producing the diffuse synchrotron emission associated with spatially-extended features.
Keywords:
BL Lacertae objects: general — catalogs — surveysI Introduction
Blazars, interpreted to be radio-loud active galactic nuclei (AGN) with relativistic jets oriented at small angles along the line of sight, are the largest known population of sources in the extragalactic -ray sky. The small inclination angles result in strong Doppler beaming effects that significantly boost the observed flux of the jet moving towards the Earth and deboost the flux of the counter jet. The jets eventually dissipate by either decollimation or by depositing their kinetic energy in a terminal shock. These processes produce spatially-extended diffuse unbeamed emission which is potentially observable at low frequencies in addition to the beamed emission (Hardcastle & Krause 2014; Massaglia et al. 2016, as indicated by simulations in, e.g.,).
Blazars are classified as either BL Lacs, which typically exhibit narrow emission or absorption lines in their optical spectra, or flat-spectrum radio quasars, which have broad emission lines typical of quasars (Landt et al. 2001). Hereinafter we adopt the nomenclature of the blazar catalogue Roma-BZCAT (Massaro et al. 2015), labelling the former class of BL Lacs as BZBs and the latter as BZQs. BZBs are the focus of this study their emission is more dominated by non-thermal components when compared to BZQs, which can have features such as a dusty torus and a big blue bump in their broad-band spectral energy distribution (Wilkes 2004).
According to the unification scheme of radio-loud AGN (Urry & Padovani 1995), source orientation with respect to the line-of-sight is key to explaining observational differences between blazars and radio galaxies, with low-excitation and high-excitation radio galaxies (Hine & Longair 1979, LERGs and HERGs;) believed to be the parent populations of BZBs and BZQs, respectively. A strong prediction of the unification theory is that at low frequencies the morphologies of BZBs should conform with LERGs viewed at small angles to the jet (Best & Heckman 2012, see the review by). For highly aligned sources the low-frequency radio emission is expected to consist of an unresolved beamed core surrounded by extended diffuse emission related to the jet terminus, while for jets with non-zero inclination angles, in addition to the core, there may be emission associated with the large-scale jet and potentially the counterjet including both termination regions.
While there have been GHz studies that detected extended emission (Ulvestad et al. 1983; Antonucci & Ulvestad 1985; Laurent-Muehleisen et al. 1993, e.g), to date, the BZBs morphologies at have not been systematically explored because no wide-field survey has had the spatial resolution, dynamic range, and sensitivity required to resolve all the components of the sources. Information about the beamed and extended emission has been inferred from spectral studies, where the beamed emission is expected to follow a power law with a flat spectral index (i.e. , where throughout) and the diffuse emission is believed to have a power law spectral index more typical of optically-thin synchrotron emission (). The flat-spectrum beamed component dominates the radio spectrum above (Healey et al. 2007, e.g.) and in the last decade it has been shown that the spectral indices of blazars are generally flat below as well (Massaro et al. 2013b). Indeed, this characteristic flat spectrum at low frequencies has been successfully leveraged in identifying -ray sources (Massaro et al. 2014).
Blazars tend to be core-dominated in the GHz regime, where the core dominance is a proxy for the beaming factor and hence the inclination angle (Antonucci & Ulvestad 1985; Perlman & Stocke 1993). In the regime, it has been inferred that blazars are core-dominated, on the basis of the flat spectral indices (Massaro et al. 2014), but a direct measurement of the core dominances for a sample of blazars has yet to be ascertained. Giroletti et al. 2016 and d’Antonio et al. 2019 estimated the low frequency core dominances of blazars using a spectral decomposition technique, relying on assumptions about the spectral indices of the core and extended components respectively.
Given the broadband nature of blazar spectral energy distributions, a comprehensive understanding of their low frequency spectra is paramount to obtain a complete view of blazars. This is highlighted by the radio-to--ray connection, where there is a well-established link between the flux and the -ray flux, spanning decades of energy (Ackermann et al. 2011, e.g.). From this, it is inferred that the radio and -ray emission are produced by the same population of relativistic electrons. The relationship between the flux density at hundreds of MHz and the -ray flux is less clear however (Giroletti et al. 2016; Mooney et al. 2019), possibly because the -ray-emitting particles are distinct from the electrons that give rise to the large-scale diffuse emission that is expected to be prevalent at low frequencies.
LOFAR is conducting a high angular resolution, highly-sensitive survey of the northern hemisphere sky at (Shimwell et al. 2017, LoTSS; the LOFAR Two-Metre Sky Survey;), with more than of the sky observed to date. The LoTSS Second Data Release (LDR2) presents a unique opportunity to make improved low-frequency radio measurements of blazars and, for the first time, investigate the morphology of blazars at . We present LDR2 data for a sample of BZBs and measure the spatial extents, core dominances, and spectral indices to characterise the diffuse emission. The radio-to--ray connection is investigated for the low frequency core and extended components separately in order to understand why this trend, which is clear at GHz frequencies, tends not to be significant at .
This paper is organised as follows: In § II the sample selection is outlined, in § III the analysis is detailed, in § IV the results are presented, in § V the findings are discussed, and in § VI a summary is provided. A CDM cosmological model is used in this paper with (The LIGO Scientific Collaboration et al. 2017), , and , where is the Hubble constant.
II Datasets and sample selection
II.1 LOFAR dataset
The Low Frequency Array (van Haarlem et al. 2013, LOFAR;) is a radio interferometer with stations located throughout Europe. One goal of the LOFAR Surveys Key Science Project (SKSP) is to map the northern hemisphere sky at ; this is known as the LOFAR Two Metre Sky Survey (Shimwell et al. 2017, LoTSS;). In this paper we use data from a subset of LoTSS Second Data Release (LDR2).
LDR2 data were processed with the SKSP pipeline11 1 https://github.com/mhardcastle/ddf-pipeline version as described by Shimwell et al. 2019. In the pipeline, direction-dependent calibration was carried out using killMS (Tasse 2014; Smirnov & Tasse 2015) and imaging was done using DDFacet (Tasse et al. 2018), where a novel self-calibration strategy was employed (Shimwell et al. 2019; Tasse et al. 2020, § 5 of). With this strategy, extended emission that is undetected in early cycles of self-calibration is less likely to modelled out, and more attention is paid to properly deconvolving that emission. This more complex self-calibration process improved the sensitivity to extended emission with respect to LoTSS DR1 (Tasse et al. in prep.). Source catalogues were extracted by the pipeline using PyBDSF (Mohan & Rafferty 2015).
LDR2 observations are in progress. We use the LDR2 data that were available as of 2020 February 01, amounting to of sky coverage, which is of the northern hemisphere sky (Fig. 1). This LDR2 subset encompasses the publicly-available LDR1 and the catalogue contains sources. The resolution is with a pixel size of and the median RMS noise level is .

II.2 Ancillary datasets
The Faint Images of the Radio Sky at Twenty-cm (Becker et al. 1995, FIRST;)22 2 http://sundog.stsci.edu/ survey was used, where available, to visually check for the presence of extended emission at . FIRST data were only unavailable for BL Lacs lying outside its footprint. These data have a comparable resolution to LDR2 ().
The spectral indices are computed using the NRAO VLA Sky Survey (Condon et al. 1998, NVSS;)33 3 https://www.cv.nrao.edu/nvss with LDR2. NVSS is preferred to FIRST because for extended sources there can be a deficit in the FIRST total flux densities compared to NVSS, particularly for sources with total fluxes in the range. This is due to extended flux being undetectable given the lack of short baselines in the FIRST UV coverage (Helfand et al. 2015). However, the FIRST resolution is more favourable than the resolution offered by NVSS, so FIRST was used over NVSS to look for large-scale jets at .
The difference between the spatial resolutions of NVSS and LoTSS are not likely to be problematic (de Gasperin et al. 2018). All BL Lacs are mainly point-like in FIRST and NVSS (i.e. consistent with the beam size) and flux densities were computed by integrating over the beam. We also checked the flux densities against those reported in Giroletti et al. 2016 and Massaro et al. 2013a to verify that no flux was missing (where NVSS had similar beam sizes to these surveys).
We used -band data from the Panoramic Survey Telescope and Rapid Response System Data Release 1 (Chambers et al. 2016, Pan-STARRS1;)44 4 https://panstarrs.stsci.edu to check that, for each BZB, the emission at detected MHz frequencies is likely associated with its optical counterpart corresponding to the coordinates reported in Roma-BZCAT. Both FIRST and Pan-STARRS1 images for the sample can be accessed through the online appendices.
II.3 BZB sample selection
We started with the Roma-BZCAT 5th edition (Massaro et al. 2015) blazar catalogue and took the following steps to identify the BZBs that are in LDR2.
- •
We first considered all blazars in Roma-BZCAT. We added to this newly identified blazars from a recent optical spectroscopic campaign that will feature in the next release of Roma-BZCAT (Landoni et al. 2015; Ricci et al. 2015; Álvarez Crespo et al. 2016; Massaro et al. 2016).
- •
We selected only the BZBs from this enhanced version of Roma-BZCAT that have a counterpart in LDR2 within a few arcseconds, where the criterion depended on the spatial extent of the source. The Roma-BZCAT position, which refers to the central engine, and the LDR2 position, which relates to the centroid of the radio emission, are not necessarily aligned. The majority () of BZBs had a crossmatch separation of and of sources had a separation of , which is the LDR2 beam width. The largest crossmatch separations pertain to highly extended sources. A counterpart was identified for all known BZBs within the LDR2 footprint and all crossmatches were visually confirmed. We then excluded BZBs that have uncertain redshift estimates, and BZBs remained.
- •
We also identified the BZBs in the sample that have a -ray counterpart by crossmatching the Roma-BZCAT positions with the Fourth Catalog of AGN detected by the Fermi Large Area Telescope (Abdollahi et al. 2020; Ajello et al. 2020, 4LAC;) within , where we used the position of the associated counterpart in 4LAC. A total of BZBs are -ray detected in 4LAC.
- •
Using the Roma-BZCAT positions, the BZB sample was cross-matched with FIRST (Becker et al. 1995) within . There were FIRST counterparts to BZBs.
- •
Again using the Roma-BZCAT positions, the BZB sample was cross-matched with Pan-STARRS1 (Chambers et al. 2016) within , and a counterpart was identified in all cases.
The final sample consists of BZBs; are from Roma-BZCAT (5th edition) and are from recent optical spectroscopic campaigns (Paiano et al. 2019; Peña-Herazo et al. 2019; de Menezes et al. 2019; Massaro et al. 2016). An overview of the selection is given in Table 1.
| Total | Selected∗ | |
|---|---|---|
| Roma-BZCAT v | ||
| Optical campaigns of unassociated -ray sources | ||
| Total | ||
Note. — ∗BZBs in the LDR2 footprint with a reliable redshift estimate.
∗∗All have an optical counterpart in Pan-STARRS, have a radio counterpart in FIRST, and have a -ray counterpart in 4LAC.
For the analysis presented in § III, we used the data in the LDR2 catalogue. However, for J1231+3711, the source extraction software (PyBDSF) failed to accurately characterise the widespread diffuse emission that surrounds the compact core. Therefore, instead of using the LDR2 catalogue values for J1231+3711, we reran PyBDSF with a reduced threshold for the flux detection, and used these recalculated values for our analysis.
III Data analysis
The images and the catalogue we constructed based on LDR2 were the starting point of this analysis. The extents, core dominances, and spectral indices of the BZBs were calculated as follows.
III.1 Angular and spatial extents at 144 MHz
We used the empirically-derived equation in § 3.1 of Shimwell et al. 2019 to determine which BZBs in the sample are resolved (rBZBs) and which BZBs are unresolved (uBZBs). This equation defines an envelope separating resolved and unresolved sources,
| (1) |
where is the total flux density of a source, is the peak flux, and is the RMS noise as per the LDR2 catalogue. If , then the source is classified as an rBZB, otherwise the source is a uBZB. In total, there are rBZBs and uBZBs in the sample.
The intrinsic angular extent, , of each BZB was taken to be the FWHM of the major axis of the source after Gaussian deconvolution of the point spread function (PSF). For BZBs that consist of multiple Gaussians grouped, the FWHM in the catalogue refers to the combination of the major axes of the individual components combined using moment analysis. The median intrinsic angular extent for the rBZBs is and the median upper limit on the intrinsic angular extents for the uBZBs is .
We computed the spatial extent, , of each BZB using the intrinsic angular extent and the redshifts, assuming the flat cosmology described in § 1 (Wright 2006). For uBZBs, the angular and spatial extents are reported as upper limits.
III.2 Core dominances at 144 MHz
The core dominance is the ratio of fluxes from the core and extended regions (Giovannini et al. 1990), and the distribution of relative intensities of the core to the extended emission should reflect the distribution of Doppler factors (Antonucci & Ulvestad 1985; Perlman & Stocke 1993). Following on from studies such as that of Morganti et al. 1997, we define the core dominance at , , as
| (2) |
where and are the core and extended flux densities respectively and the core is defined to be coincident with the AGN central engine. The core dominances are calculated for the rBZBs only.
To calculate for each rBZB, first the core and extended flux components were separated. We simulated a point source that, when convolved with the LDR2 PSF, had the same peak flux as the core in the LDR2 image. The integration of this Gaussian component represents the core flux density, . We then computed the extended flux density as . Finally, and were used with Eq. 2 to yield .
III.3 Spectral properties at 144 MHz
As mentioned in § II.2, NVSS fluxes were used with LDR2 to compute the spatially integrated spectral indices of the BZBs. These spectral indices were then used to calculate the total specific luminosities of the sources in units of W Hz-1.
IV Results
IV.1 Overview
The median properties of the sample are provided in Table 2, with uncertainties derived from bootstrapping. Values for each BZB are given in Table 5, with the full Table accessible with the supplementary material online55 5 Accessible at http://tiny.cc/bzb-images-mooney-2020 for review..
| Resolved | Unresolved | Total | |||||||
|---|---|---|---|---|---|---|---|---|---|
| () | |||||||||
| () |
Note. — Number of sources is , redshift is , luminosity is , spectral index is , core dominance is , spatial extent is , and angular extent is .
IV.2 Visual inspection of the BZB images
LDR2, FIRST and Pan-STARRS1 -band images of all BZBs are included with the supplementary material online2. Broadly, we identify three classes of morphology for the BZBs. However, several sources have highly complex, asymmetrical morphologies, and in-depth studies using spatially-resolved spectral information would be necessary to fully interpret the source structures. While imaging artefacts cannot be categorically ruled out for all sources, they do not appear to be a significant factor in any case.
Regarding morphology, firstly there are the BZBs that do not appear to be extended in LDR2; these sources are the uBZBs by definition.
The second group of sources are the rBZBs where the extended morphology seems to consist exclusively of diffuse emission; there are such BZBs. This unbeamed emission is typically of low surface brightness and is believed to be emission from the extended lobes, where the jet interacts with the intergalactic medium. These BZBs typically appear as point sources in FIRST because the diffuse emission is not detected. When the inclination angle between the jet and our line-of-sight is small, the diffuse emission surrounds the beamed core component (e.g. J0911+3349 in Fig. 2). Alternatively, the inclination angle could be nonzero (but small) or there could be some level of jet bending, in which case there can be a distinct region of diffuse emission separate from the core. For example, for J1000+5746, termination regions associated with the jet and counterjet are potentially observed (Fig. 2).
The remaining BZBs are also extended, but some fraction of the extended emission is likely to be beamed. These sources are either extended in FIRST or have compact regions of high surface brightness in LDR2, with fluxes comparable to the core (e.g. J1340+4410 in Fig 2). This beamed emission is believed to be associated with relativistic bulk motion in the jet, in contrast to the unbeamed emission that is linked with the terminus of the jet. These sources have one-sided jets in FIRST but emission associated with a counterjet is detected in LDR2 in some cases.
IV.3 Angular and spatial extents at 144 MHz
The angular extent distribution is shown in Fig. 3 (bottom) and redshift as a function of angular extent is shown in Fig. 3 (top). The BZBs with the most extended emission tend to be at lower redshifts, but generally there is no trend. The median angular extent of the rBZBs is . Note that we classify the sources as rBZBs or uBZBs only to aid the analysis. That is, the uBZBs and rBZBs likely form a continuous distribution rather than representing distinct BZB subclasses.
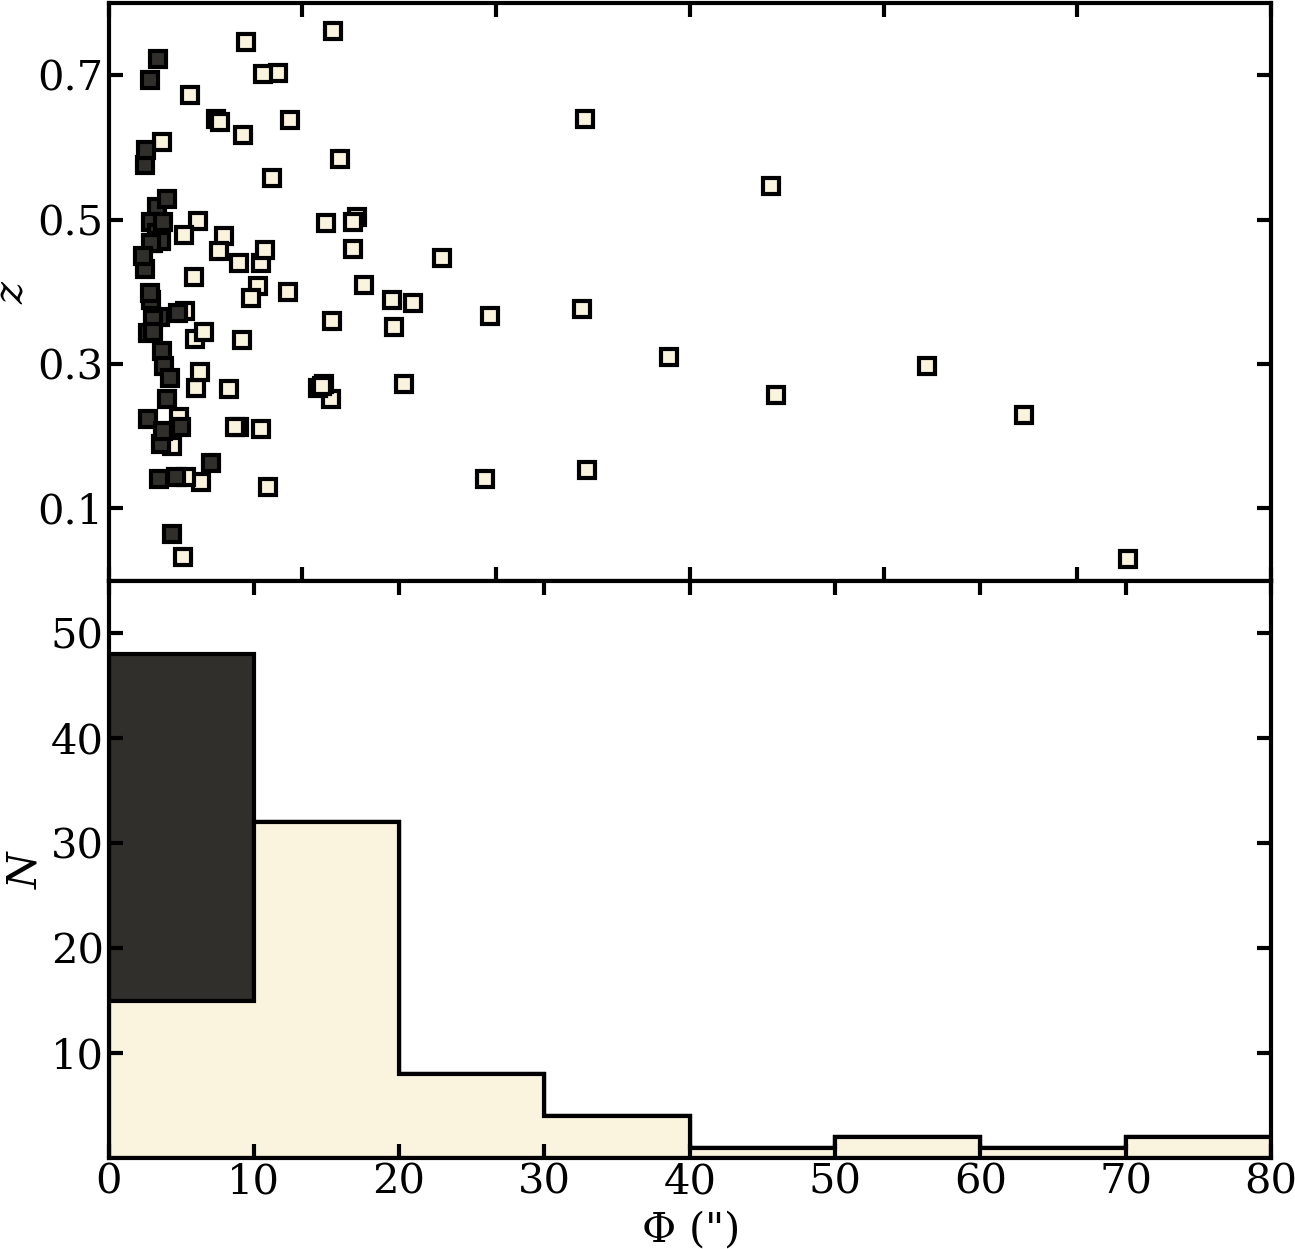
Fig. 4 shows the distribution of the spatial extents for the rBZBs, where the median rBZB spatial extent is . There is a large spread in the extents, ranging up to , and two sources, J1231+3711 (), and J1340+4410 () are more than . While this implies large deprojected (although not necessarily unphysical) sizes, it is possible that these jets are bent by some degree (as is typical for astrophysical jets), which could have the effect of reducing the deprojected sizes.

IV.4 Core dominances at 144 MHz
We find of the rBZBs are core-dominated (i.e. ). The median core dominance of the rBZBs is . Fig. 5 (bottom) shows the distribution of for the rBZBs, which spans two orders of magnitude, reflecting the sensitivity of the beaming factor with respect to the inclination angle and the Lorentz factor. There is a trend66 6 The Pearson correlation coefficient, , is reported with the associated probability value, . (, , and ) between and (Fig. 5; top), where the least core-dominated BZBs tend to have steeper .

IV.5 Spectral properties at 144 MHz
Of the sources, BZBs have steep spectra (), are flat (), and are inverted (). The median spectral index for the sample is also flat (). A permutation test (Good 2013) was used to show that the median spectral index of the well-resolved sources () is steeper than that of the unresolved sources () at a significance level of . The median spectral indices can be classed as flat for both subsamples. Fig. 6 shows the distribution of for the uBZBs (top) and rBZBs (bottom).

IV.6 Radio luminosities and redshifts
The integrated specific luminosities () of the sources were taking into account using . Fig. 7 (top) shows the luminosity at , , as a function of redshift, . While loosely increases with , this could be attributed to Malmquist bias (Malmquist 1925). The redshift distributions for the uBZBs and rBZBs are shown in Fig. 7 (middle; bottom). All BZBs in the sample are at , and the median redshifts of the uBZBs and rBZBs are and respectively.

The distribution of luminosities for the uBZBs and the rBZBs is shown in Fig. 8 (top two panels respectively). There is a clear distinction between these distributions, where rBZBs tend to be more luminous. The rBZBs have higher total luminosities due to the presence of more extended radio emission. The luminosities of the core and extended components were then calculated for the rBZBs, where the core and extended spectral indices were assumed to be and respectively. This assumption is relatively uncontroversial because the cores of blazars are known to have flat spectral indices, whereas optically-thin synchrotron emission has a spectral index close to . The distributions for the core and extended luminosities are shown in Fig. 8 (bottom two panels respectively). While the rBZBs tend to be more luminous than the uBZBs, the distributions of the core luminosities of the rBZBs and the total luminosities of the uBZBs are similar. The total and core luminosities are shown as a function of redshift in Table 3.

| z | Resolved | Unresolved | ||||
|---|---|---|---|---|---|---|
| N | Ltotal | Lcore | N | Ltotal | ||
| 0.0–0.2 | 8 | 5 | ||||
| 0.2–0.4 | 29 | 14 | ||||
| 0.4–0.6 | 18 | 12 | ||||
| 0.6–0.8 | 11 | 2 | ||||
| All | 66 | 33 | ||||
Note. — Redshift bin is , number of sources is , total luminosity is , and core luminosity is (both in ).
IV.7 The radio-to--ray connection
In total, BZBs had -ray detections; properties of the -ray BZBs are given in Table 4. The medians of the logarithms of the integrated photon fluxes at for the rBZBs () and uBZBs () are the same within uncertainty. The -ray-detected and non--ray-detected BZBs are similar in terms of spatial extents, angular extents, luminosities and core dominances. However, the -ray BZBs tend to have smaller redshifts. The median radio spectral index of the -ray BZBs is also slightly flatter than that of the BZBs without a detection.
Fig. 9 shows the total (top), core (middle), and extended (bottom) flux density against for the rBZBs. The Pearson correlation coefficient between and is ( and ). For and , increases to ( and ), while for and , ( and ).

| -ray | Non--ray | ||||||||
|---|---|---|---|---|---|---|---|---|---|
| (kpc) | |||||||||
| () |
Note. — Number of sources is , redshift is , luminosity is , spectral index is , -ray flux is , number of extended BL Lacs is , core dominance of extended BL Lacs is , spatial extent of extended BL Lacs is , and angular extent of extended BL Lacs is .
V Discussion
Previous studies identified extended emission at frequencies around BZBs (Ulvestad et al. 1983, e.g.), but the preliminary LoTSS Second Data Release has made it possible to systematically study the morphology of BZBs at for the first time, where we expect to find a larger fraction of diffuse emission due to the steeper spectra of the extended structures. We identified extended emission around BZBs at . We compare BZBs and LERGs because radio-loud AGN unification theories predict that these observational source classifications are the same source type intrinsically (Massaro et al. 2020a; Massaro et al. 2020b; Capetti et al. 2020). The spatial extents spanned a wide range (up to ), and this is in line with predictions of the AGN unification scenario, where BZBs are LERGs viewed end-on, because LERGs range from several to several in the plane of the sky. For the BZBs that were not found to be extended, it is possible that the resolution is insufficient to spatially resolve these sources, or that extended low-surface brightness radio emission exists below the LDR2 sensitivity. Particularly for the BZBs with , the extended emission may be below the detection threshold of LDR2.
The core luminosities per redshift bin of the rBZBs are comparable to the total luminosities of the uBZBs, suggesting no major difference in intrinsic core power between the two sources. That is, at a given core power we find large ranges of and . A similar effect has also been seen in Faranoff-Riley class 0 sources (Baldi et al. 2015, FR-0s;) and FR-Is, where Capetti et al. 2020 found that for a given core power, FR-0s tend to have fainter diffuse emission than FR-Is. The key variables controlling whether a BZB is extended or not is unclear, and could relate to the initial conditions or the environment. It is possible that the uBZBs have either only switched on recently, where the AGN activity is too recent to have produced plumes, or perhaps they have been switched off for years, as suggested by Punsly et al. 2015, where this timescale is an upper limit based on the fact that the synchrotron break frequency drops to , assuming , a magnetic field, and no new injections of energetic particles (Cordey 1986; Jamrozy et al. 2007).
We directly measured the core dominances of the extended BZBs by separating the core and extended flux components. Our results are broadly in line with Giroletti et al. 2016 and Fan & Wu 2018, where the core dominances of blazars were calculated by decomposing using estimates of the core and extended spectral indices. While the core component contributes more than half of the total flux for of the rBZBs, the majority of these extended BZBs were not core-dominated. This finding is in agreement with d’Antonio et al. 2019 where they state that deeper low frequency surveys should result in lower core dominances because more radio lobe emission can be detected. Thus, the core dominance may not be a reliable parameter for selecting new blazar candidates in future low frequency surveys.
The median radio spectral index for the sample is flat, which confirms several recent studies that have found that BZBs, and blazars generally, have flat spectral indices down to at least (Giroletti et al. 2016; Mooney et al. 2019; d’Antonio et al. 2019). However, the most extended BZBs tended to have spectral indices closer to , similar to classic radio galaxies, likely due to the presence of diffuse emission.
The population of relativistic electrons that give rise to the beamed radio emission are thought to be responsible for producing the -ray emission, by upscattering seed photons from external radiation fields to -ray energies. This is believed to be also the mechanism behind the radio-to--ray connection at GHz frequencies. Previous studies have shown that this correlation weakens with decreasing radio frequency (Giroletti et al. 2016; Mooney et al. 2019, e.g.). By calculating the radio-to--ray correlation using the core and extended flux densities at separately, we have shown that this connection weakens at low radio frequencies because there is an increase in diffuse emission. The diffuse MHz emission is not expected to correlate strongly with the -ray emission because the diffuse MHz emission is unbeamed, and the electron population producing the diffuse MHz emission is likely to be distinct from the electrons that give rise to the -rays, reflecting the time-integrated history of jet activity rather than the instantaneous view given by the core emission. In contrast, the beamed core emission at low frequencies still correlates reasonably well with the -ray photon flux.
VI Conclusions and future prospects
We have presented the first morphological study of a sample of BZBs at . Our findings are as follows:
- •
Extended emission was revealed around BZBs. The distributions of spatial extents and the extended component luminosities at are consistent with expectations based on the AGN unification paradigm, where BZBs are the aligned counterparts of LERGs. For a given core luminosity and redshift, a range of spatial extents were found.
- •
The median integrated spectral index for the BZBs was , confirming that the low frequency spectra of BZBs are still dominated by the beamed core component, but this depends on the spatial extent, with the spectral index being steeper for more extended BZBs.
- •
Of the rBZBs, were core-dominated at , and the most core-dominated sources tended to have smaller spatial extents and flatter spectral indices.
- •
Positive correlations were identified between the flux and both the total () and core () flux densities for the rBZBs. The correlation between the -ray flux and the extended emission was weaker (). This suggests that the emission from the core is more likely to be directly related to the present nuclear activity than the large-scale extended emission.
Characterising the diffuse emission around BZBs can help to explain some of the outstanding questions regarding blazars. For example, measurements of the diffuse flux allow for estimates of the jet power via scaling relations (Meyer et al. 2011). Calculating the jet power can shed light on the relationship between the jet power and the AGN accretion rate, while estimates of the diffuse flux and the spatial extent can also be used to characterise the environments. We focused on BZBs using LoTSS, the most sensitive low frequency survey in existence. In future, LoTSS in-band spectral index maps will make it possible to distinguish between the beamed jet flux and the unbeamed diffuse flux that contribute to the extended emission. Other forthcoming surveys will help further constrain the morphology of BZBs. The LOFAR LBA Sky Survey (LoLSS; de Gasperin et al., in prep) will eventually cover the northern hemisphere sky at at a sensitivity of and resolution. With LoLSS, we will be able to identify possible ultra-steep spectrum radio halos around the unresolved BZBs that are undetectable in LDR2. The future sky survey with the LOFAR international stations (Morabito et al. in prep) will image the sky at resolution, potentially spatially resolving some of the unresolved BZBs. In addition, optical spectra provided by the WEAVE-LOFAR survey (Smith et al. 2016) will be beneficial in identifying LDR2 counterparts to unidentified -ray sources. In the long term, surveys with the Square Kilometre Array (SKA) will also be key in studying this population (Kharb et al. 2016).
| Name | RA | Dec | Resolved? | ||||||||
|---|---|---|---|---|---|---|---|---|---|---|---|
| J0047+3948 | 11.9801 | 39.8160 | 0.252 | T | |||||||
| J0112+2244 | 18.0243 | 22.7441 | 0.265 | T | |||||||
| J0123+3420 | 20.7860 | 34.3468 | 0.272 | T | |||||||
| J0203+3042 | 30.9345 | 30.7105 | 0.761 | T | |||||||
| J1808+3520 | 272.2071 | 35.3452 | 0.141 | T | |||||||
| J2229+2255 | 337.2966 | 22.9166 | 0.440 | T | |||||||
| J2237+1840 | 339.2701 | 18.6822 | 0.722 | F | |||||||
| J2343+3439 | 355.8899 | 34.6641 | 0.366 | T |
Note. — (1) Source name. (2–3) Coordinates in the J2000 frame. (4) Redshift. (5) A flag stating whether the source is resolved (‘T’) or not (‘F’). (6) Integrated flux density at from LDR2. (7) -ray flux from 4LAC. (8) spectral index with LDR2 and NVSS. (9) Core dominance. (10) Spatial extent. (11) Angular extent. (12) Radio luminosity.
This table is available in its entirety in machine-readable form.
BZBs not in Roma-BZCAT v5.0.
References
- Abdollahi et al. (2020) Abdollahi, S., Acero, F., Ackermann, M., et al. 2020, ApJS, 247, 33, doi: 10.3847/1538-4365/ab6bcb
- Ackermann et al. (2011) Ackermann, M., Ajello, M., Allafort, A., et al. 2011, ApJ, 741, 30, doi: 10.1088/0004-637X/741/1/30
- Ajello et al. (2020) Ajello, M., Angioni, R., Axelsson, M., et al. 2020, ApJ, 892, 105, doi: 10.3847/1538-4357/ab791e
- Álvarez Crespo et al. (2016) Álvarez Crespo, N., Massaro, F., Milisavljevic, D., et al. 2016, AJ, 151, 95, doi: 10.3847/0004-6256/151/4/95
- Antonucci & Ulvestad (1985) Antonucci, R. R. J., & Ulvestad, J. S. 1985, ApJ, 294, 158, doi: 10.1086/163284
- Astropy Collaboration et al. (2013) Astropy Collaboration, Robitaille, T. P., Tollerud, E. J., et al. 2013, A&A, 558, A33, doi: 10.1051/0004-6361/201322068
- Atwood et al. (2009) Atwood, W. B., Abdo, A. A., Ackermann, M., et al. 2009, ApJ, 697, 1071, doi: 10.1088/0004-637X/697/2/1071
- Baldi et al. (2015) Baldi, R. D., Capetti, A., & Giovannini, G. 2015, A&A, 576, A38, doi: 10.1051/0004-6361/201425426
- Becker et al. (1995) Becker, R. H., White, R. L., & Helfand, D. J. 1995, ApJ, 450, 559, doi: 10.1086/176166
- Best & Heckman (2012) Best, P. N., & Heckman, T. M. 2012, MNRAS, 421, 1569, doi: 10.1111/j.1365-2966.2012.20414.x
- Capetti et al. (2020) Capetti, A., Massaro, F., & Baldi, R. D. 2020, A&A, 633, A161, doi: 10.1051/0004-6361/201935962
- Chambers et al. (2016) Chambers, K. C., Magnier, E. A., Metcalfe, N., et al. 2016, arXiv e-prints, arXiv:1612.05560. https://arxiv.org/abs/1612.05560
- Condon et al. (1998) Condon, J. J., Cotton, W. D., Greisen, E. W., et al. 1998, AJ, 115, 1693, doi: 10.1086/300337
- Cordey (1986) Cordey, R. A. 1986, MNRAS, 219, 575, doi: 10.1093/mnras/219.3.575
- d’Antonio et al. (2019) d’Antonio, D., Giroletti, M., Giovannini, G., & Maini, A. 2019, MNRAS, 490, 5798, doi: 10.1093/mnras/stz2967
- de Gasperin et al. (2018) de Gasperin, F., Intema, H. T., & Frail, D. A. 2018, MNRAS, 474, 5008, doi: 10.1093/mnras/stx3125
- de Menezes et al. (2019) de Menezes, R., Peña-Herazo, H. A., Marchesini, E. J., et al. 2019, A&A, 630, A55, doi: 10.1051/0004-6361/201936195
- Fan & Wu (2018) Fan, X.-L., & Wu, Q. 2018, ApJ, 869, 133, doi: 10.3847/1538-4357/aaeece
- Giovannini et al. (1990) Giovannini, G., Feretti, L., & Comoretto, G. 1990, ApJ, 358, 159, doi: 10.1086/168970
- Giroletti et al. (2016) Giroletti, M., Massaro, F., D’Abrusco, R., et al. 2016, A&A, 588, A141, doi: 10.1051/0004-6361/201527817
- Good (2013) Good, P. 2013, Permutation Tests: A Practical Guide to Resampling Methods for Testing Hypotheses, Springer Series in Statistics (Springer New York). https://books.google.ie/books?id=pK3hBwAAQBAJ
- Hardcastle & Krause (2014) Hardcastle, M. J., & Krause, M. G. H. 2014, MNRAS, 443, 1482, doi: 10.1093/mnras/stu1229
- Healey et al. (2007) Healey, S. E., Romani, R. W., Taylor, G. B., et al. 2007, ApJS, 171, 61, doi: 10.1086/513742
- Helfand et al. (2015) Helfand, D. J., White, R. L., & Becker, R. H. 2015, ApJ, 801, 26, doi: 10.1088/0004-637X/801/1/26
- Hine & Longair (1979) Hine, R. G., & Longair, M. S. 1979, MNRAS, 188, 111, doi: 10.1093/mnras/188.1.111
- Hunter (2007) Hunter, J. D. 2007, Computing in Science & Engineering, 9, 90, doi: 10.1109/MCSE.2007.55
- Jamrozy et al. (2007) Jamrozy, M., Konar, C., Saikia, D. J., et al. 2007, MNRAS, 378, 581, doi: 10.1111/j.1365-2966.2007.11782.x
- Kharb et al. (2016) Kharb, P., Lal, D. V., Singh, V., et al. 2016, Journal of Astrophysics and Astronomy, 37, 34, doi: 10.1007/s12036-016-9411-z
- Landoni et al. (2015) Landoni, M., Massaro, F., Paggi, A., et al. 2015, AJ, 149, 163, doi: 10.1088/0004-6256/149/5/163
- Landt et al. (2001) Landt, H., Padovani, P., Perlman, E. S., et al. 2001, MNRAS, 323, 757, doi: 10.1046/j.1365-8711.2001.04269.x
- Laurent-Muehleisen et al. (1993) Laurent-Muehleisen, S. A., Kollgaard, R. I., Moellenbrock, G. A., & Feigelson, E. D. 1993, AJ, 106, 875, doi: 10.1086/116691
- Malmquist (1925) Malmquist, K. G. 1925, Meddelanden fran Lunds Astronomiska Observatorium Serie I, 106, 1
- Massaglia et al. (2016) Massaglia, S., Bodo, G., Rossi, P., Capetti, S., & Mignone, A. 2016, A&A, 596, A12, doi: 10.1051/0004-6361/201629375
- Massaro et al. (2015) Massaro, E., Maselli, A., Leto, C., et al. 2015, Ap&SS, 357, 75, doi: 10.1007/s10509-015-2254-2
- Massaro et al. (2020a) Massaro, F., Capetti, A., Paggi, A., et al. 2020a, ApJ, 900, L34, doi: 10.3847/2041-8213/abac56
- Massaro et al. (2013a) Massaro, F., D’Abrusco, R., Giroletti, M., et al. 2013a, ApJS, 207, 4, doi: 10.1088/0067-0049/207/1/4
- Massaro et al. (2014) Massaro, F., Giroletti, M., D’Abrusco, R., et al. 2014, ApJS, 213, 3, doi: 10.1088/0067-0049/213/1/3
- Massaro et al. (2013b) Massaro, F., Giroletti, M., Paggi, A., et al. 2013b, ApJS, 208, 15, doi: 10.1088/0067-0049/208/2/15
- Massaro et al. (2016) Massaro, F., Álvarez Crespo, N., D’Abrusco, R., et al. 2016, Ap&SS, 361, 337, doi: 10.1007/s10509-016-2926-6
- Massaro et al. (2020b) Massaro, F., Capetti, A., Paggi, A., et al. 2020b, ApJS, 247, 71, doi: 10.3847/1538-4365/ab799e
- Meyer et al. (2011) Meyer, E. T., Fossati, G., Georganopoulos, M., & Lister, M. L. 2011, ApJ, 740, 98, doi: 10.1088/0004-637X/740/2/98
- Mohan & Rafferty (2015) Mohan, N., & Rafferty, D. 2015, PyBDSF: Python Blob Detection and Source Finder. http://ascl.net/1502.007
- Mooney et al. (2019) Mooney, S., Quinn, J., Callingham, J. R., et al. 2019, A&A, 622, A14, doi: 10.1051/0004-6361/201833937
- Morganti et al. (1997) Morganti, R., Oosterloo, T. A., Reynolds, J. E., Tadhunter, C. N., & Migenes, V. 1997, MNRAS, 284, 541, doi: 10.1093/mnras/284.3.541
- Paiano et al. (2019) Paiano, S., Falomo, R., Treves, A., Franceschini, A., & Scarpa, R. 2019, ApJ, 871, 162, doi: 10.3847/1538-4357/aaf6e4
- Peña-Herazo et al. (2019) Peña-Herazo, H. A., Massaro, F., Chavushyan, V., et al. 2019, Ap&SS, 364, 85, doi: 10.1007/s10509-019-3574-4
- Perlman & Stocke (1993) Perlman, E. S., & Stocke, J. T. 1993, ApJ, 406, 430, doi: 10.1086/172454
- Punsly et al. (2015) Punsly, B., Marziani, P., Kharb, P., O’Dea, C. P., & Vestergaard, M. 2015, ApJ, 812, 79, doi: 10.1088/0004-637X/812/1/79
- Ricci et al. (2015) Ricci, F., Massaro, F., Landoni, M., et al. 2015, AJ, 149, 160, doi: 10.1088/0004-6256/149/5/160
- Shimwell et al. (2017) Shimwell, T. W., Röttgering, H. J. A., Best, P. N., et al. 2017, A&A, 598, A104, doi: 10.1051/0004-6361/201629313
- Shimwell et al. (2019) Shimwell, T. W., Tasse, C., Hardcastle, M. J., et al. 2019, A&A, 622, A1, doi: 10.1051/0004-6361/201833559
- Smirnov & Tasse (2015) Smirnov, O. M., & Tasse, C. 2015, MNRAS, 449, 2668, doi: 10.1093/mnras/stv418
- Smith et al. (2016) Smith, D. J. B., Best, P. N., Duncan, K. J., et al. 2016, in SF2A-2016: Proceedings of the Annual meeting of the French Society of Astronomy and Astrophysics, 271–280. https://arxiv.org/abs/1611.02706
- Tasse (2014) Tasse, C. 2014, A&A, 566, A127, doi: 10.1051/0004-6361/201423503
- Tasse et al. (2018) Tasse, C., Hugo, B., Mirmont, M., et al. 2018, A&A, 611, A87, doi: 10.1051/0004-6361/201731474
- Tasse et al. (2020) Tasse, C., Shimwell, T., Hardcastle, M. J., et al. 2020, arXiv e-prints, arXiv:2011.08328. https://arxiv.org/abs/2011.08328
- Taylor (2013) Taylor, M. 2013, Starlink User Note, 253
- The LIGO Scientific Collaboration et al. (2017) The LIGO Scientific Collaboration, The VIRGO Collaboration, The 1M2H Collaboration, et al. 2017, Nature, 551, 85, doi: 10.1038/nature24471
- Ulvestad et al. (1983) Ulvestad, J. S., Johnston, K. J., & Weiler, K. W. 1983, ApJ, 266, 18, doi: 10.1086/160755
- Urry & Padovani (1995) Urry, C. M., & Padovani, P. 1995, PASP, 107, 803, doi: 10.1086/133630
- van der Walt et al. (2011) van der Walt, S., Colbert, S. C., & Varoquaux, G. 2011, Computing in Science and Engineering, 13, 22, doi: 10.1109/MCSE.2011.37
- van Diepen et al. (2018) van Diepen, G., Dijkema, T. J., & Offringa, A. 2018, DPPP: Default Pre-Processing Pipeline. http://ascl.net/1804.003
- van Haarlem et al. (2013) van Haarlem, M. P., Wise, M. W., Gunst, A. W., et al. 2013, A&A, 556, A2, doi: 10.1051/0004-6361/201220873
- van Rossum (1995) van Rossum, G. 1995, Python tutorial, Tech. Rep. CS-R9526, Centrum voor Wiskunde en Informatica (CWI), Amsterdam
- Wilkes (2004) Wilkes, B. 2004, in Astronomical Society of the Pacific Conference Series, Vol. 311, AGN Physics with the Sloan Digital Sky Survey, ed. G. T. Richards & P. B. Hall, 37. https://arxiv.org/abs/astro-ph/0310905
- Wright (2006) Wright, E. L. 2006, PASP, 118, 1711, doi: 10.1086/510102