[a]Sylvia J. Zhu
The upgraded Data Acquisition System of the H.E.S.S. telescope array
Abstract
The High Energy Stereoscopic System (H.E.S.S.) is an array of five Imaging Atmospheric Cherenkov Telescopes located in the Khomas Highland of Namibia. H.E.S.S. observes gamma rays above tens of GeV by detecting the Cherenkov light that is produced when Very High Energy gamma rays interact with the Earth’s atmosphere. The H.E.S.S. Data Acquisition System (DAQ) coordinates the nightly telescope operations, ensuring that the various components communicate properly and behave as intended. It also provides the interface between the telescopes and the people on shift who guide the operations. The DAQ comprises both the hardware and software, and since the beginning of H.E.S.S., both elements have been continuously adapted to improve the data-taking capabilities of the array and push the limits of what H.E.S.S. is capable of. Most recently, this includes the upgrade of the entire computing cluster hosting the DAQ software, and the accommodation of a new camera on the large 28m H.E.S.S. telescope. We discuss the performance of the upgraded DAQ and the lessons learned from these activities.
1 Introduction
One of the advantages of ground-based observatories is that they can be upgraded and adjusted to fit the changing needs of the collaboration that runs them. The High Energy Stereoscopic System (H.E.S.S.) has undergone multiple major upgrades in its nearly two decades of operations. Originally commissioned in 2003 as a set of four 12-m telescopes (CT1-4), the addition of a 28-m telescope (CT5) in 2012 greatly extended the array’s sensitivity to lower photon energies [1, 2]. The CT1-4 cameras were upgraded in 2016 and the CT5 camera in 2019, both times to replace the aging electronics with modern technologies, ensuring stable operations and allowing for novel data-taking modes.
A central computing system coordinates the activities of the array. This brain of the array is the Data Acquisition System (DAQ); it communicates commands to the array subsystems, and stores the data that is taken. The DAQ comprises both the software that manages the array operations — including the Graphical User Interface (GUI), with which the shift crew guide the telescope operation — and the hardware that houses it.
The core philosophy behind the DAQ is described in [3] and remains extremely relevant. However, by 2018, many hardware components had reached or would soon reach their "end-of-life" status and were no longer supported by their vendors. Aging, outdated components became difficult to replace; when they were replaced by newer equivalents, this increased the heterogeneity of the cluster thereby increasing maintenance costs. Additionally, the existing and planned camera upgrades introduced technological requirements that the old cluster hardware could not meet. In order to ensure smooth operations for at least seven years, the estimated minimal remaining lifetime of H.E.S.S. at the time, it was decided to undertake a full upgrade of the DAQ hardware; this included the main cluster as well as supporting devices such as the switches and firewall.
In addition to the hardware, the operating system (OS) deployed on the previous DAQ cluster was long past the end-of-life date, so that no upgrades and especially security updates were provided. Therefore it was decided to upgrade the operating system from Fedora Core 12 to CentOS 7, which at the time of writing is supposed to receive updates until June 2024.
The upgrade was planned with the following key concepts:
- •
The system must be sufficiently future-proof, both in terms of hardware and software.
- •
The cluster must have built-in redundancy, with spares that could easily be swapped in.
- •
The long-term maintenance effort should be minimized when possible.
- •
The setup should be easily reproducible.
- •
The hardware and OS should support the needs of the collaboration software.
A comprehensive description of the DAQ can be found in [3]. Here, we focus on the differences in implementation between the previous iteration and the most recently upgraded DAQ.
2 Cluster setup
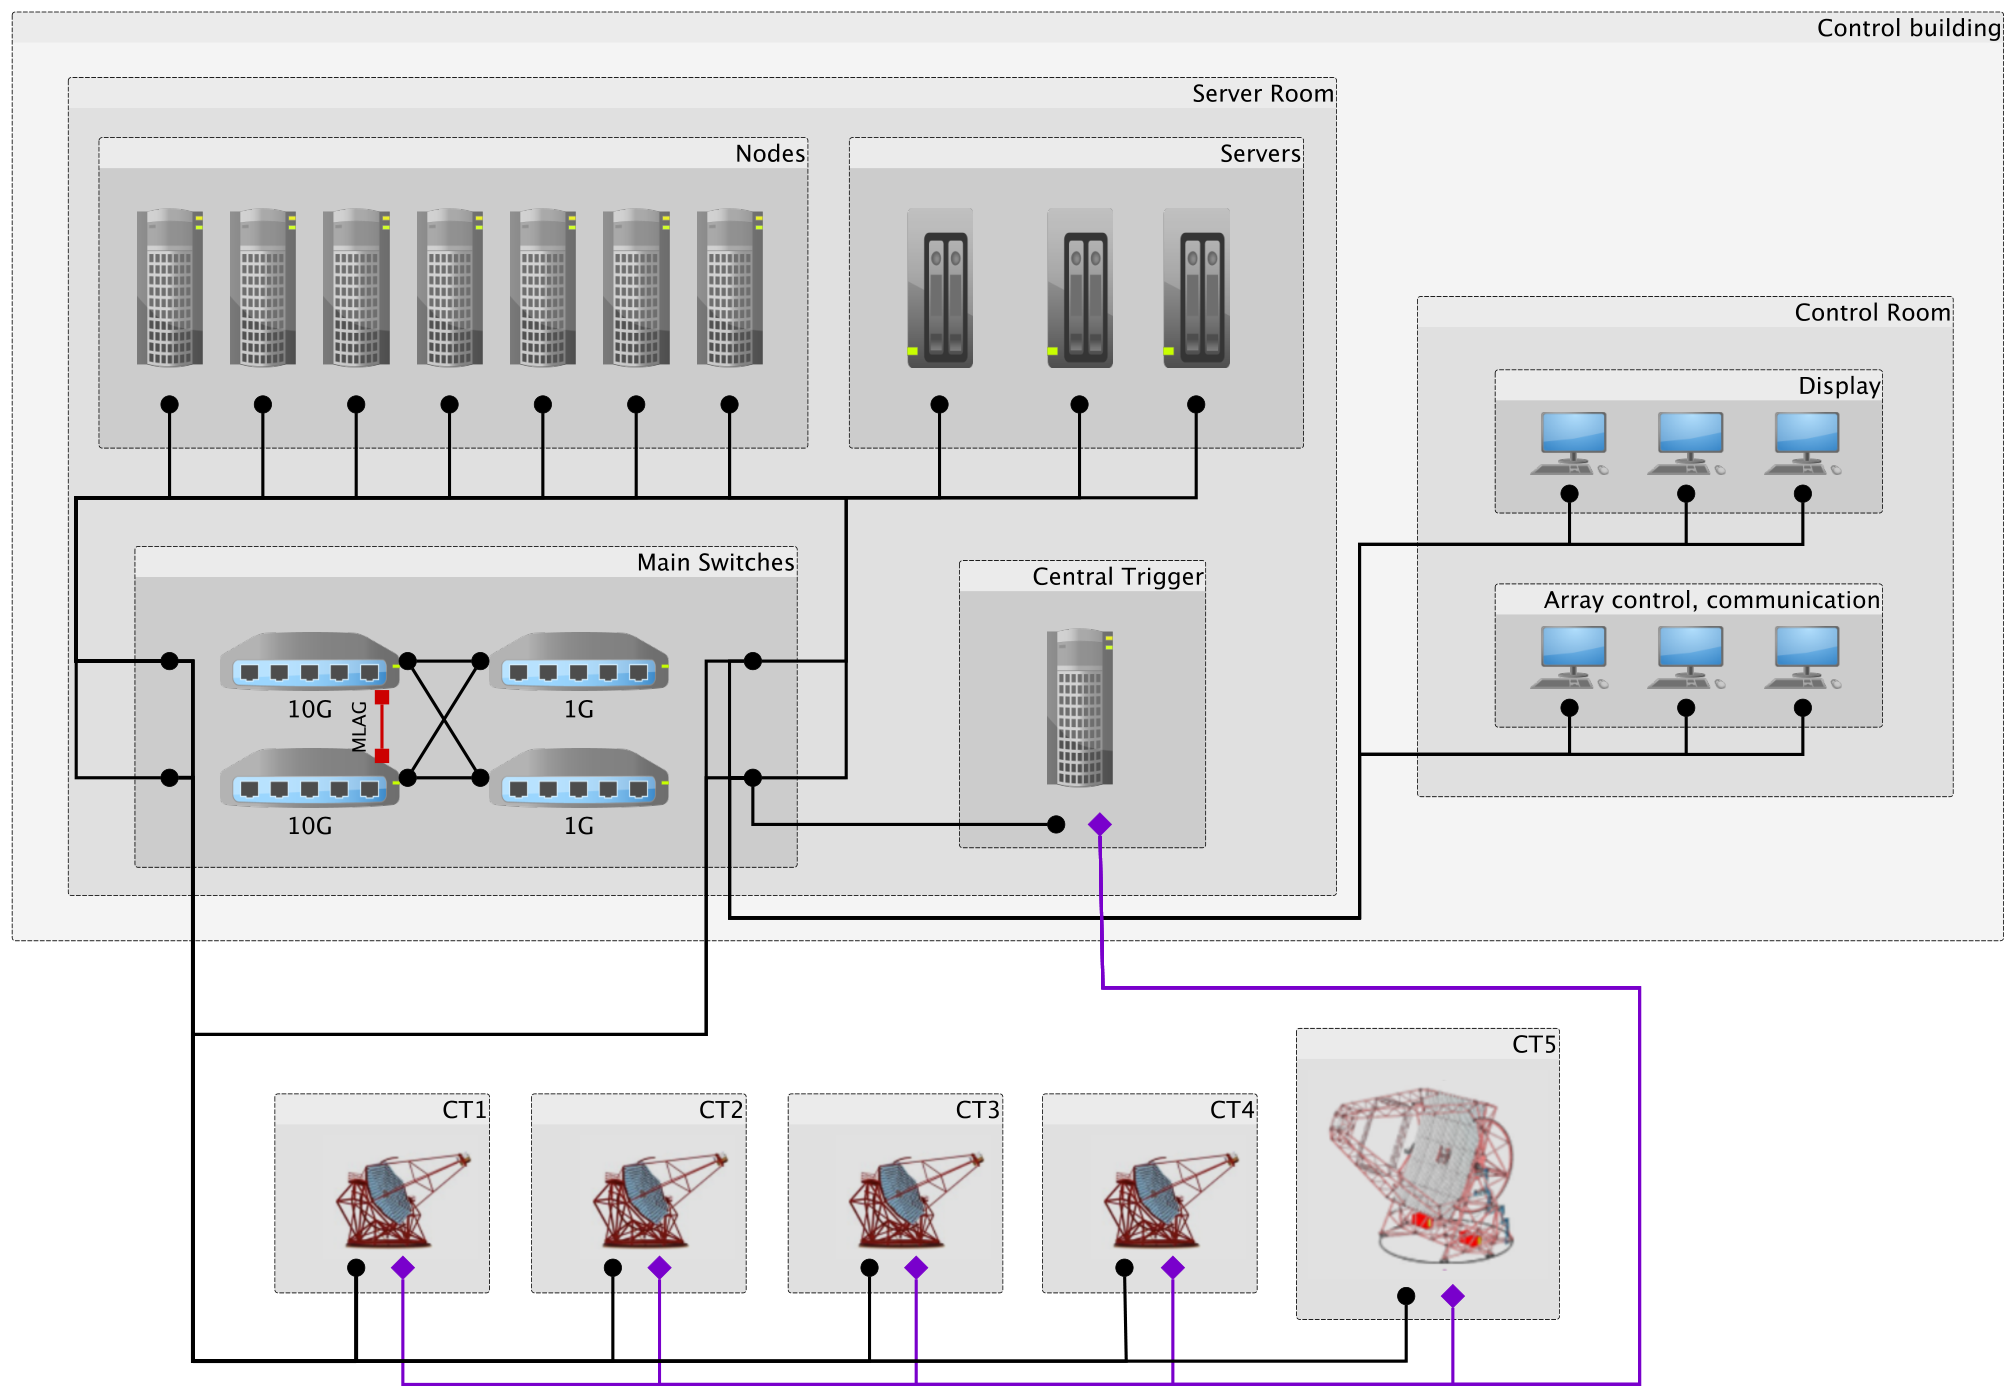
The core DAQ cluster is composed of seven computing nodes and three storage servers, and is illustrated in Figure 1. During data taking, the cameras on the telescopes report the detection of air shower events to the Central Trigger. A candidate event in CT1-4 must be accompanied by the reporting of a coincident event (within in one of the other four telescopes (including CT5), otherwise it is dropped [4]; events in CT5 do not have this requirement and are automatically saved [5]. The recorded event camera images are sent to the computing nodes in a round-robin load balancing scheme [6]. Each computing node receives chunks of of data, which are then transformed into the target data format. The full set of data for each run (including auxiliary files describing the array statuses during the run) is then sent to the storage servers, before being transferred over the internet to clusters in Europe.
As with the previous iteration of the DAQ [3], as soon as the new cluster hardware had been decided upon, a scaled-down version of the upgraded DAQ cluster — a TestDAQ — was installed at one of the home institutions, for studying the key components of the new cluster.
2.1 Core cluster: computing nodes and storage servers
| Type | Quantity | CPU | RAM | Storage | Network |
|---|---|---|---|---|---|
| computing | 7 | Intel Xeon Silver 4114, | 96 GB | 4 2 TB | 2 10 Gb/s |
| nodes | 10 2.2 GHz (20 threads) | + 2 1 Gb/s | |||
| storage | 3 | Intel Xeon Silver 4114, | 48 GB | 12 8TB | 2 10 Gb/s |
| servers | 10 2.2 GHz (20 threads) | (RAID6) | + 2 1 Gb/s | ||
| management | 1 | Intel Xeon Silver 4114, | 48 GB | 2 480 GB | 2 10 Gb/s |
| machine | 4 2.6 GHz (8 threads) | + 2 1 Gb/s | |||
| control room | 6 (+2) | Intel Core i3-7100 | 8 GB | 120 GB | 2 1 Gb/s |
| machines | 3.9 Hz dual core |
Compared to the setup described in [3], the new cluster machines reflect the updated needs of the array. New data-taking modes and the upgraded cameras have greatly increased the rate at which disk space is used; currently, approximately 30–40 TB of data is saved every month, compared to less than 5 TB per month in the months preceding the DAQ upgrade.
Until 2018, due to the lack of a fast, reliable, and cost effective internet connection at the time, the data were stored on magnetic tapes that were manually transported to Europe. Nowadays, the H.E.S.S. site is on a 100 Mbps plan, allowing for rapid transfer of the data. However, breakdowns in internet communications can occur especially between the continents, and it is therefore crucial to have enough storage space onsite to maintain a comfortable buffer. Each of the three storage servers (Table 1) is composed of twelve 8 TB disks in a RAID6 [7] configuration with one disk reserved as a hot swap, so that the total amount of available storage space onsite is . In practice, after allowing for space for user homes, database storage, and other needs, the amount of available storage for camera data is .
The computing nodes serve multiple purposes. Six of the seven nodes receive the camera data and process the data so that it can be stored in a standard format. As they process the data, they simultaneously run real-time analyses [8] on it as it is being taken, to provide low-latency results at somewhat reduced sensitivity compared to a full offline analysis. A set of medium-latency, moderate sensitivity analyses are also run on hours-timescales; during the night, they are only run on the seventh node (which is not used in data taking), while during the day they are run on all but one of the computing nodes to increase computational resources. Finally, the computing nodes house the DAQ software, and the seventh node serves as the login node to the internet and is accessible from outside via a hardware firewall.
A single storage volume, comprising dedicated fractions of the storage capacity of each of the three servers, is formed by means of a distributed GlusterFS file system [9]. All computing nodes mount this single GlusterFS volume and can thereby easily and transparently read from and write to the data storage server compound.
2.2 Control room
The telescope array is operated from a main control room which hosts a number of general purpose Linux machines that provide interfaces to the DAQ GUIs and monitoring displays. Over the years of operation, the control room set up was gradually extended as the experiment evolved, which resulted in a heterogeneous hardware setup with task-specific machines and thus high maintenance demands. The control room was therefore restructured to a homogeneous hardware setup in the first step of the cluster upgrade. In its current state, the array control interface with all its monitoring displays and GUIs requires a total display area of around twelve 24" full-HD screens (10801920 pixels) in order to be well readable for the shift crew.
The upgraded control room makes use of four general purpose Linux machines with 3 HDMI ports each. A fifth machine is provided as a hot swap and can take over any task of the other four machines by simply changing display host entries in the main H.E.S.S. DAQ database, while a sixth primarily provides communication channels to the rest of the collaboration. Further redundancy is achieved by having two additional machines set up as cold spares.
2.3 Internal network
The communication within the internal network is handled by a set of two 10 Gb/s switches (Arista 7050TX-64-R) and three 1 Gb/s switches (Arista 7010T-48-R). One of the latter switches serves as a backup. The two 10-Gb/s switches form a Multi-chassis Link Aggregation Group (MLAG) for redundancy and optimised transfer rates. The switches are accessible via the management machine and a dedicated serial connection, set up using a terminal server (Perle IOLAN STS) on a dedicated network, exclusively. In the previous DAQ system, the internal network was supported by only 1 Gb/s switches, without any built-in redundancy or access control; the upgraded setup is therefore a large improvement from the previous iteration.
The 10 Gb/s switches manage the connections to devices that are involved in the transfer of bulk data from the cameras, including the computing nodes, storage servers and the CameraPCs of the cameras. These high-throughput switches enable new, high volume data taking modes thereby increasing the camera capabilities.
The entire onsite network — encompassing the DAQ machines as well as the other subsystems, auxiliary devices, personal devices, and external non-H.E.S.S. devices — is divided into a few virtual networks (VLANs) to ensure separation of the network infrastructure into independent parts, for both greater security and stability. This aspect has remained largely unchanged from the previous iteration. However, in the past, routing tables were used to define permitted directions of communication between the VLANs; these have been replaced by Access Control Lists (ACLs) on the switches.
2.4 External communication
A Juniper SRX300 firewall restricts access from the outside to the cluster. Previously, the firewall was taken care of via software, using iptables configured through FireHOL [10]. For the upgrade, it was decided to use a hardware firewall, as this is a single special purpose device and therefore more robust to attacks and failures.
3 Cluster management
3.1 Monitoring tools
The hardware-level monitoring is primarily managed by the Integrated Dell Remote Access Controller (iDRAC), an implementation of an Intelligent Platform Management Interface (IPMI) [11] provided by the manufacturer. The iDRAC provides detailed statuses on the machines’ physical components such as the power supply, hard disks, cooling devices, etc., including the history of status changes. It also offers a virtual console and easy power management options (e.g., powering down, rebooting), all of which are crucial for a remotely located experiment. The iDRAC replaces the external IPMI devices — previously installed inside each DAQ computer in the old cluster — and web interface.
For monitoring of components and processes related to array operations, we utilize the TICK Stack [12]. This is a set of four pieces of open-source software that can work in tandem:
- 1.
Telegraf, for collecting standard system metrics of the monitored machines
- 2.
InfluxDB, a time series database for storing the collected metrics
- 3.
Chronograf, a UI for plotting and viewing the collected metrics
- 4.
Kapacitor, for metrics processing and alerting
At the end of this flow, if a metric surpasses predetermined limits, the team is notified by email as well as Slack messages. Examples of such metrics include high memory usage (which could indicate memory leaks caused by bugs during data taking) and high storage usage (indicating the need for deleting old data). This setup is also used to passively monitor properties such as the data transfer rate to off-site clusters in Europe, and has been used to identify problems in internet connectivity.
3.2 System provisioning and configuration
Previously, the system provisioning and configuration was taken care of with a set of bash scripts. For the upgrade, it was decided to use industry standard tools.
The provisioning of the system was performed via a network PXE [13] boot, with the storage servers acting as the PXE-servers. For machine configuration, Ansible [14] is used to perform these tasks in a controlled and automated manner, by converging the setup to a desired state. It is testable, reproducible, uses reusable components and is easily expandable. It reduces the amount of manual steps and thus the potential for mistakes. The access to the managed machines merely needs ssh and operations can be performed remotely and in parallel.
Thanks to this setup, we are able to set up and replace any failing cluster components with cold spares, completely from remote.
4 Integration of the new CT5 camera
The integration of a new camera for the CT5 telescope took place a few months after the DAQ upgrade. The installation of a new camera required changes to the databases, the integration of controllers — software that acts as the interface between a subsystem and the DAQ — for new camera subsystems, and modifications to the monitoring displays to reflect the properties of the new camera.
The databases contain the configuration information of the various devices. For the new CT5 camera, tables were added to specify the new camera properties. In addition, new controller code was written to manage the DAQ-subsystem communications; the new controllers were then integrated into the definitions of the various run types as appropriate.
Part of the DAQ GUI is the slow control, a set of processes that produce monitoring plots that are updated in realtime. These include camera-related information such as images, internal temperatures measurements, and voltages, all of which were updated to reflect the new CT5 camera (e.g., camera shape and drawer configuration). Finally, the Real-time Analysis was updated to utilize the properties of the new camera.
5 Evaluation
Planning for the DAQ upgrade began in mid-2018, about a year before the upgrade took place. Two weeks were allotted for the actual upgrade; to minimize the loss of observational time, this overlapped with a moonbreak, during which the brightness of the moon precludes the possibility of observations. The goal at the end of the two weeks was to have a fully functioning array. Successful array operations were mostly achieved by this time, although minor bug fixes were still required over the following weeks and months.
Given the magnitude of this upgrade — a full cluster replacement — this was only accomplished thanks to thorough preparations. The TestDAQ provided a resource for testing most aspects of the software beforehand; this proved to be crucial, as the libraries, kernel, and Python versions all had to be updated from the versions on the old cluster, although the latter was kept at Python2 due to the requirements of some of the legacy software. The GlusterFS configuration was set up and tested beforehand. The firewall was preconfigured and the ACLs defined, to reduce the required amount of setup for the network once onsite. Thanks to these preparations, the initial setup and installation of the hardware took less than one day.
The addition of the new CT5 camera required another week of active time, with a few months of preparation beforehand. Most of the requirements were handled by the camera team, but the last step in the integration process required action from the DAQ team.
Thanks to the upgrades, the amount of lost observation time due to issues with the DAQ is now at an all-time low, as can be seen from Figure 2. Before late 2019, a median of 0.64% of the available telescope time was lost due to DAQ-related issues, with some months reaching nearly 6%; the median has fallen by a factor of four, to just 0.14% since the start of 2020.
While extensive preparations were undertaken, some difficulties could not have been foreseen until the direct interactions with the array hardware. In a science collaboration, such as H.E.S.S., it is difficult to maintain continuity of expertise due to the amount of work that is performed by people with temporary positions such as students and post docs. This has a very real effect on not only the extent of possible preparations (which requires identifying who is in charge of the various pieces of hardware) but also the choice of tools for maintaining the setup; for every new tool, the advantages of the tool must be weighed against its learning curve. Thorough documentation, especially with an eye towards future-proofing, is therefore crucial for ensuring success.
References
- [1] P. Vincent for the H.E.S.S. Collaboration, "H.E.S.S. Phase II," Proc. 29 Int. Cosmic Ray Conference, Vol. 5, p. 163-166 (2005).
- [2] M. Punch for the H.E.S.S. Collaboration, "H.E.S.S.-II: Expansion of H.E.S.S. for higher sensitivity and lower energy," Proc. Conf. Towards a Network of Atmospheric Cherenkov Detectors VII, p. 379-392 (2005).
- [3] A. Balzer et al., "The H.E.S.S. central data acquisition system," Astroparticle Physics, Vol. 54, p. 67-80 (2013).
- [4] S. Funk et al., "The trigger system of the H.E.S.S. telescope array," Astroparticle Physics, Vol. 22, p. 285-296 (2004).
- [5] J. Bolmont et al., "The camera of the fifth H.E.S.S. telescope. Part I: System description," Nuclear Inst. and Methods in Physics Research, A, Vol. 761, p. 46-57 (2014).
- [6] "Round-robin scheduling – Wikipedia," https://en.wikipedia.org/wiki/Round-robin_scheduling, accessed 28 June 2021.
- [7] "Standard RAID levels – Wikipedia," https://en.wikipedia.org/wiki/Standard_RAID_levels, accessed 28 June 2021.
- [8] C. Hoischen, M. Fuessling, S. Ohm et al., in prep (2021).
- [9] "Gluster | Storage for your Cloud," https://www.gluster.org/, accessed 28 June 2021.
- [10] "FireHOL – Linux firewalling and traffic shaping for humans," https://firehol.org/, accessed 29 June 2021.
- [11] "Intelligent Platform Management Interface – Wikipedia," https://en.wikipedia.org/wiki/Intelligent_Platform_Management_Interface, accessed 29 June 2021.
- [12] InfluxDB 1.X: Open Source Time Series Platform | Influx Data," https://www.influxdata.com/time-series-platform/, accessed 1 July 2021.
- [13] "Preboot Execution Environment," https://en.wikipedia.org/wiki/Preboot_Execution_Environment, accessed 29 June 2021.
- [14] "Ansible Documentation," https://docs.ansible.com/, accessed 29 June 2021.