Interactive Region-of-Interest Discovery using Exploratory Feedback
Abstract
In this paper, we propose a geospatial data management framework called IRIDEF which captures and analyzes user’s exploratory feedback for an enriched guidance mechanism in the context of interactive analysis. We discuss that exploratory feedback can be a proxy for decision-making feedback when the latter is scarce or unavailable. IRIDEF identifies regions of interest (ROIs) via exploratory feedback, and highlights a few interesting and out-of-sight POIs in each ROI. These highlights enable the user to shape up his/her future interactions with the system. We detail the components of our proposed framework in the form of a data analysis pipeline, and present the aspects of efficiency and effectiveness for each component. We also discuss evaluation plans and future directions for IRIDEF.
1 Introduction
Background. Nowadays, geospatial data are ubiquitous in various fields of science, such as transportation, smart city management [1, 2], travel planning [3], bike sharing [4], localized advertising [5], and regional health-care [6]. A recent solution for an improved geospatial data management is to provide means for interactive analysis, where users in the loop are guided towards interesting subsets of data in an exploratory iterative manner [7, 8]. Typically, the guidance is performed through learning user’s preferences using a decision-making feedback received from the user in each iteration, e.g., picking (clicking on) a favorite point of interest (POI). However, it is often the case in geospatial scenarios that users forget or don’t feel necessary to explicitly express their feedback in what they find interesting. As a result, the interactive dialog will be broken and no guidance can be delivered. In this paper, we focus on the following question: Is it possible to perform interactive analysis on geospatial data without having access to decision-making interactions?
Proposal. In the absence of decision-making interactions, we propose to focus on exploratory feedback, i.e., patterns in signals captured from the user in the background which provide hints on user’s interests. For instance, users often hover their mouse (or make frequent touch actions on a touch screen, such as scroll, pinch and zoom) over a region of interest to collect information on the map (e.g., touristic places and hidden gems presented in the form of map layers and tooltips) before landing on a decision about picking a POI in that region, such as a home-stay. Hence it is possible to infer the interest towards that region even without decision-making interactions. This inferred knowledge should be leveraged in the guidance mechanism. An instance of such guidance is to highlight a few interesting POIs in the region of interest. We advocate a geospatial data management framework (called IRIDEF) which captures and analyzes user’s exploratory feedback for an enriched guidance mechanism in the context of interactive analysis.
Scenario. Lindsey is a visiting researcher from the US. She wants to rent a home-stay in Paris via the Airbnb website. She likes to discover the city, hence she is open to any type of lodging in any region with an interest to stay in the center of Paris. Her exploration starts with a query which expresses the preliminary set of her interests. The website returns 1500 different home-stays for her query. While scanning the very first items, she shows (an exploratory) interest towards the region of Trocadero by hovering her mouse around the Eiffel tower and checking the amenities within that region. However, she forgets or doesn’t feel the necessity to click a POI (i.e., a home-stay) in that region. While typical recommendation and exploration systems do not necessarily focus on this implicit interest in the future iterations, our framework ensures that Lindsey receives home-stay recommendations related to the Trocadero region even if she didn’t provide any decision-making feedback.
Challenges. Analyzing exploratory feedback is challenging. First, it is not clear how this feedback should be interpreted in terms of the user preferences. Exploratory feedback on geospatial data can be enabled via different signals, such as mouse hovering [9], touch actions [10], voice [11], and gaze [12]. Translating such enablers into geospatial semantics is challenging. Second, all exploratory signals are not necessarily useful and some may introduce false positives. For instance, a small mouse move on a typical screen would yield more than 14,000 points (assuming 1600 DPI) which may turn out to be just a random futile move. Beyond the first two challenges, guiding users towards interesting POIs is also challenging, as it requires an exhaustive scan over the geospatial data against the evolving user preferences.
Contributions. We propose a guidance approach for interactive exploration of geospatial data. Our approach identifies regions of interest (ROIs) without the need for any decision-making feedback. Our proposed guidance mechanism is to highlight a few interesting and out-of-sight POIs in each ROI, and let the user investigate those POIs in his/her future interactions with the system. The following list summarizes the contributions and claims discussed in this paper:
- •
We define the notion of “exploratory user feedback” which enables a seamless navigation in the geospatial data.
- •
We define the notion of “information highlighting”, a mechanism to highlight important spatial information that is out-of-sight.
- •
We employ an efficient polygon-based approach to discover ROIs.
- •
We propose an approach to compute highlights on-the-fly in an efficient manner.
To the best of our knowledge, our contributions have not been investigated before in the literature. Popular map-based applications such as Google Maps and Bing Maps do not offer interactive functionalities for feedback capturing. In the literature, information highlighting [13, 14, 15] and spatial recommendation approaches [16, 17] often assume that the user’s preferences are static and will never change in time. This limits their functionality for serving the scenarios of an interactive analysis. The process of feedback capturing is mostly formulated for decision-making interactions [18, 19, 20, 21, 22, 23]. While a few fuse decision-making and exploratory feedbacks [24, 25, 26], our approach is not dependent on decision-making feedback and is able to operate purely on exploratory feedback. It is to state the obvious that a straightforward extension of our system is to incorporate decision-making feedback (if available) to improve the effectiveness of the system.
Paper outline. The rest of this paper is organized as follows. In Section 2, we elaborate on different instances of decision-making and exploratory feedbacks in the literature. We discuss the data model and introduce in the problem in Section 3. We present our proposed approach in Section 4, and discuss evaluation plans in Section 5. Last, we conclude and present future directions in Section 6.

2 Decision-making Feedback versus and Exploratory Feedback
We briefly discuss a few examples in the literature to clarify the distinction between decision-making and exploratory feedback types in realistic geospatial applications. These examples are illustrated in Figure 1. In summary, we argue that different types of decision-making feedback have been already employed, but the exploratory feedback is often missing.
Medical domain. COVIZ [6] is an interactive web-based application which enables medical experts to form and compare medical cohorts. In Figure 1-A, the expert clicks on the Auvergne-Rhône-Alpes region (as a decision-making feedback) to compare the patient cohort in this particular region with the whole France. In Figure 1-B, the expert adds the air pollution layer to the analysis to examine any potential correlation between the patients’ health status and the abundance of the air pollution. While the expert explores the cohort comparisons and pollution correlations, the tool does not collect any exploratory feedback, such as mouse hover and gaze.
Aviation domain. DV8 [27] is an interactive aviation data analysis tool. When several flight trajectories are visualized (Figure 1-C), the expert can click on one trajectory to retrieve its information (departure, destination, etc.), and double-click to solely focus on that single trajectory and analyze it further (Figure 1-D). The interaction is always through the decision-making feedback (single-click and double-click) and the exploratory feedback is not supported. DV8 also supports touch gestures, such as pinch and zoom (Figure 1-E) and brush (Figure 1-F). However the touch actions are all considered as decision-making feedback with an immediate resulting action. Hence there is no support for exploratory feedback. The virtual reality (VR) version of DV8 (Figures 1-G and 1-H) enhances the exploration experience of the aviation expert, particularly for analyzing flights in different altitudes. While the gaze signal is an exploratory feedback which can be captured through VR, DV8 employs the signal only for navigating the geospatial data, and not for guidance.
Travel domain. Simurgh [3] is an interactive travel package generation tool. The user can ask for a new day plan using a drag-and-drop action over a region of interest (the drag-and-drop in Figure 1-I and the resulting day plan in Figure 1-J). She can also replace a point of interest by clicking on the point (the selection in Figure 1-K and the replacement in Figure 1-L). All the interactions are defined as the decision-making feedback. In other words, Simurgh does not detect the regions of interest by following the exploratory feedback.
3 Data Model and Problem Definition
To enable feedback capturing, we consider two different layers on a geographical map: spatial layer and interaction layer. The spatial layer contains POIs from a spatial database . The interaction layer contains exploratory feedback points . These layers are explained below.
Spatial layer. Each POI is described using its geographical coordinates. POIs are also associated to a set of domain-specific attributes . For instance, in the dataset of a real estate agency, POIs are properties (houses and apartments) and contains attributes such as surface, number of rooms and price. The set of all possible values for an attribute is denoted as . We also define user’s feedback as a vector over all attribute values (i.e., facets), i.e., . The vector is initialized by zeros and will be updated to express the user’s preferences. The facet-based schema of ensures that learned feedback is always transparent and interpretable by the user using the facets, and hence reduces algorithmic anxiety [28].
Interaction layer. We assume that an exploratory signal addresses one specific point on the screen, e.g., hovering at, gazing at, or providing a voice command about . When an exploratory signal is received, the point is appended to the set . Each point is a tuple , where and specify the affected pixel location and is a timestamp. To conform with geographical standards, we assume sits at the middle of the interaction layer, both horizontally and vertically, for any .
Transitioning between the layers. The user is in contact with the interaction layer. To update the feedback vector , we need to translate pixel locations in the interaction layer to latitudes and longitudes in the spatial layer. We employ equirectangular projection to obtain the best possible approximation of a point in the spatial layer, denoted as .
| (1) |
The inverse operation, i.e., transforming a point from the spatial layer to the interaction is done using Equation 2.
| (2) |
The reference point for the transformation is the center of both layers. In Equations 1 and 2, we assume that is the latitude and is the longitude of a point in the spatial layer corresponding to the center of the interaction layer, i.e., .
Problem definition. Given the user’s feedback , we are interested in solving two consecutive problems: discover regions of interest in the form of geospatial clusters whose centroids correlate with (with respect to the POI attributes in which the user is interested in), and for each discovered region, find at most POIs ( is an input parameter) which are relevant to and have high exploration quality. We define relevance and exploration quality in Section 4.

4 Proposed Approach
We propose IRIDEF (Interactive Region-of-Interest Discovery using Exploratory Feedback), a framework for exploiting exploratory feedback to highlight interesting POIs as future analysis directions. As depicted in Figure 2, our approach consists of a pipeline with three main components: CAPTURE, DISCOVER, and HIGHLIGHT. After the user has explored the map for a while, IRIDEF captures exploratory feedback from the exploration (i.e., the CAPTURE component detailed in Section 4.2). Then a set of regions of interest (ROIs) will be discovered using the captured feedback (i.e., the DISCOVER component detailed in Section 4.3). Finally some out-of-sight interesting POIs will be highlighted for each discovered ROI (i.e., HIGHLIGHTcomponent detailed in Section 4.4). In the following, we first discuss the desiderata behind our approach, and then detail each component of the pipeline.
4.1 Principles
In order to maximize the usability of IRIDEF, we believe that the framework should be generic and fluid, as discussed below.
Genericness. IRIDEF’s pipeline is applicable to different datasets and different types of exploratory feedback. This enables IRIDEF to cover different exploration scenarios. The minimal requirement is that the input dataset and the feedback signal match with our data model (Section 3).
Fluidity. A fluid interactive system does not break the user’s train of thought. The fluidity is ensured by rendering results in an efficient and effective manner. In the CAPTURE component, effectiveness is satisfied by disregarding irrelevant signals. In the DISCOVER and HIGHLIGHT components, effectiveness is interpreted as delivering meaningful and useful regions (ROIs) and highlights (POIs), respectively. In all of the components, efficiency is to return results instantaneously, often considered to be [29].
4.2 CAPTURE Component
Exploratory feedback can be captured using different latent signals, e.g., time dedicated to item details, touch actions, gaze, mouse moves, scrolling speed, etc. Without loss of generality, we focus on mouse moves as an instance of exploratory feedback signal. A particular challenge in capturing mouse moves as the exploratory feedback is that the user may mindlessly move the mouse everywhere on the map. Obviously, this should not signify that all the locations are equally important to the user. An effective approach should only capture a subset of this feedback which is then useful for discovering ROIs. Also an efficient approach should capture this feedback without any interruption in the fluidity of the user experience. For an effective and efficient feedback capturing, IRIDEF performs the two following actions:
- 1.
First, it records the exploratory signals (by adding the coordinates of the screen points they were applied on to ) only every milliseconds to prevent adding redundant points.
- 2.
After a given period of feedback capturing time, it groups the recorded signals into different segments, to . The first segment starts at time zero (where the system started to operate), and the last segment ends at the current time.
The choice of depends on various parameters such as the application (e.g., tourism, delivery, transportation) and the user’s expertise. For instance, a larger seems more appropriate for novice users, as they might perform many random moves to get acquainted with the data. In conformance with progressive data analytics [29], we set as the default value to ensure continuity preserving latency.
Moreover, the end of a segment is determined by one of the following approaches:
- •
: End the current segment after a fixed amount of time (i.e., fixed-length segments). In this case, the value of is selected based on the spatial density of the dataset under investigation.
- •
: End the current segment if the mouse location is unchanged for a certain amount of time.
- •
Algorithm 1 summarizes the CAPTURE process.
4.3 DISCOVER Component
The objective of this step in the IRIDEF pipeline is to obtain one or several ROIs in which the user has expressed his/her exploratory feedback. We conjecture that a region is more interesting for the user if it is denser, i.e., the user moves the mouse in that region frequently, to collect information from the background map. Hence ROIs can be simply discovered as dense clusters of mouse move points. We denote the set of all ROIs as and we refer to the -th ROI as . Algorithm 2 summarizes the DISCOVER process.
We employ ST-DBSCAN [32], a space-aware variant of DB-SCAN, to cluster points in each segment (line 2 in Algorithm 2). For each subset of mouse move points , , ST-DBSCAN begins with a random point and collects all density-reachable points from using a distance metric. As mouse move points are in the 2-dimensional pixel space (i.e., the screen), we choose euclidean distance as the distance metric. A density-reachable point is either directly reachable from , i.e., the distance between and is lower than a distance threshold (an input parameter for the ST-DBSCAN algorithm), or reachable via a path where each point in the path is directly reachable from its immediately prior point in the path . If turns out to be a core point, a cluster will be generated. A point is core if there exist a certain amount of points in its vicinity, i.e., with a distance lower than the distance threshold. The minimum number of points for a core point is yet another input parameter for ST-DBSCAN. If is not a core point, the algorithm picks another random point in . The process is repeated until all points have been processed. We denote the set of all resulting clusters for as .
Once the clusters are obtained for all the subsets of , we find their intersections to locate recurring regions. Note that we don’t aim to directly consider the clusters as the ROIs, as they may contain noisy signals. Their intersection counts as a confirmation of user preferences. To obtain intersections, we need to clearly define the spatial boundaries of each cluster. For this aim, we discover the polygons which cover the points inside each cluster. We employ Graham scan algorithm (line 2 in Algorithm 2) which is an efficient method to compute the convex hull for a given set of points in a 2D plane [33]. We reduce the typical complexity of Graham scan (i.e., , being the number of points in the -th cluster) to by ordering the cluster members by their spatial coordinates. For more efficiency, we perform Akl-Toussaint heuristics [34] before the polygon computation to prune the points which are unnecessary for shaping the polygons (line 2 in Algorithm 2). The intersections between the polygons constitute the ROIs (lines 2 to 2 in Algorithm 2).
Personalizing discovered ROIs. By default, our ROI discovery approach creates strictly tight ROIs, i.e., the area of the polygons is exactly inferred by the points it covers. However in exploratory scenarios, the feedback points do not necessarily reflect the exact interests of the user. The user exposes his/her interests in a gradual manner using exploratory feedback captured in several iterations. We believe that the user’s confidence (interpreted as the richness of the user feedback vector ) should impact the way ROIs are computed, hence personalized ROIs. In case the user is less confident (e.g., the user is in early stages of his/her exploration), ROIs should be expanded in their area (up to twice their original size) to let more opportunities arise (line 2 in Algorithm 2). The user confidence is computed as follows.
| (3) |
In Equation 3, is a feedback frequency, and is the number of interactions performed so far. For instance, given , , and assuming that a typical user provides exploratory signals per iteration, the confidence will be equal to . The confidence is a coefficient for stretching the ROI area. Let denote the area of the ROI , the confidence-aware area is computed as follows: . This process is shown in line 2 of Algorithm 2.
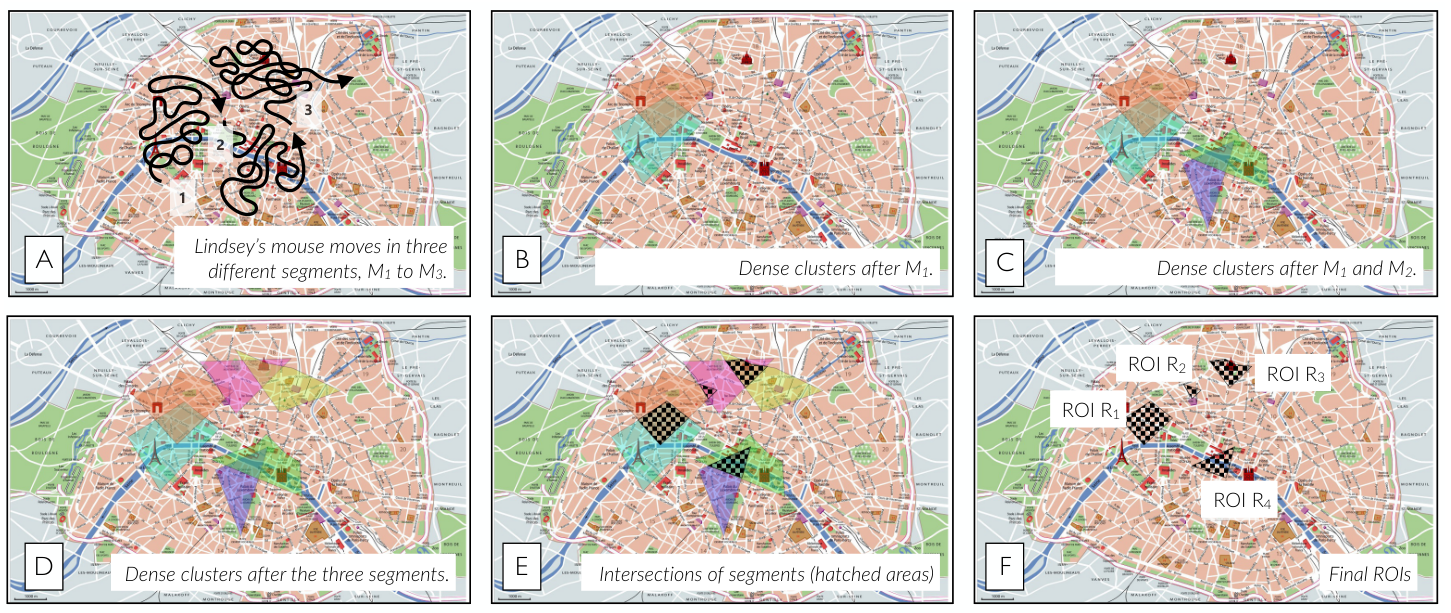
Example. Figure 3 shows the steps that Lindsey follows to explore home-stays in Paris. For the sake of simplicity, we assume Lindsey’s confidence is . Figure 3.A shows the mouse moves of Lindsey in different time stages. In this example, we consider and capture Lindsey’s feedback in three different time segments with fixed-length, i.e., (progressing from Figures 3.B to 3.D). It shows that Lindsey started her search around Eiffel Tower and Arc de Triomphe (Figure 3.B) and gradually showed interest in areas located south (Figure 3.C) and north (Figure 3.D) as well. All intersections between those clusters are discovered (hatched regions in Figure 3.E) which will contribute to the set of interesting regions (Figure 3.F), i.e., ROI1 to ROI4.
4.4 HIGHLIGHT Component
We define highlights as a subset of POIs in the form of suggestions for directions of future analysis of the user. The highlights are generated by performing the three following steps: matching points, updating feedback, and highlighting POIs. First, we find POIs which fit into the polygons obtained in the DISCOVER component. Then we update the user feedback according to those POIs. Finally we highlight a set of POIs based on the updated content of .
Matching points. Being a function of mouse move points, ROIs are discovered in the interaction layer. We then need to find out which POIs in fall into ROIs. We employ Equation 2 to transform those POIs from the spatial layer to the interaction layer. Then a simple spatial containment function can verify whether a given POI fits into a given ROI.11 1 Typically, we use the implementation of module in PostGIS for the containment verification. To improve efficiency, we employ Quadtrees [35] in a two-step approach: In an offline process, we build a Quadtree index for all POIs in . We record the membership relations between POIs and Quadtree grid cells in the index. Once ROIs are discovered, we record which cells in the Quadtree index intersect with the ROIs. For matching POIs, we only check a subset which is inside the cells associated to ROIs and ignore the ones outside, hence a drastic pruning of POIs in . Given an ROI , we denote the set of its matching points as . We also define the binary vector whose cell of is if at least one point in gets the value for the attribute , otherwise .
Updating feedback. The matching points depict the exploratory preferences of the user. To memorize these preferences, we update the feedback vector using the attributes of the matching points. We consider an increment value to update . If is a matching point and gets for attribute , we augment the value in the ’s cell of by the factor . Note that we only consider incremental feedback, i.e., we never decrease a value in . The vector will become normalized after each update using a softmax function. The updated feedback vector is fully transparent and the user can easily apprehend what has been learned from his/her previous actions. Our current update model considers the feedback vector to be recency-agnostic. We leave the integration of recency as future work.
Highlighting POIs. The updated feedback vector is the input to the highlighting phase. The objective is to select POIs out of all POIs inside ROIs whose relevance and exploration quality are maximal. We denote the set of highlights as . We propose two approaches to achieve our objective, depending on how we define relevance and quality:
Greedy approach. Inspired from [9, 36, 37], we define the relevance as the Cosine similarity between and the POIs (note that the feedback vector and the POIs are defined over the same schema), and the quality as the diversity between the POIs. The diversity is computed using Cosine distance between the POI attribute values. We then follow a greedy approach for each ROI to maximize diversity while respecting a lower bound on similarity. Algorithm 3 summarizes this approach. The similarity values are preprocessed and organized in for all POIs in (line 3 in the algorithm). The algorithm starts the greedy process by initializing a list with POIs at the top of , i.e., the most similar POIs in to (line 3 in the algorithm). While a time limit is not exceeded (time limit is an input parameter which is often set to values [29]), the algorithm scans sequentially to find appropriate POI replacements in to improve diversity (line 3 of the algorithm). Once the greedy loop is done, the set will be returned by the algorithm, containing the highlights for all the discovered ROIs.
Fuzzy approach. Inspired from [38, 39, 40, 3], we employ fuzzy clustering to process all ROIs simultaneously. Algorithm 4 summarizes this approach. The relevance is defined in the same way as the greedy approach, and the exploration quality is defined using two factors: cohesiveness between POIs of the same ROI (opposite of diversity, hence measured using Cosine similarity), and representativeness, i.e., the sum of euclidean distances between ROI centroids. We use a weighted sum over relevance and quality where the weights are user-defined parameters ( to in line 4 of Algorithm 4). Through several trial-and-error tests and user studies in previous works [40, 39], we found that the most ideal set of weights are , and . The algorithm refines the centroids of ROIs iteratively until convergence (lines 4 to 4 in Algorithm 4). Then most probable points (in fuzzy clustering semantics) will be returned as highlights for each centroid (line 4 in Algorithm 4).
Which approach to choose? We conjecture that the greedy approach is more appropriate for the bird’s-eye view exploration, which mainly refers to early stages of the exploration where the user is trying to get acquainted with the geospatial data by random explorations. In this case, ROIs do not necessarily need to be related and may represent independent future directions. However, in the case of more focused exploration scenarios, the fuzzy approach would be able to deliver highlights with more coverage over the whole regions of interest. We plan to validate these hypotheses via extensive qualitative evaluations.
Peculiar highlighting. Recall the main objective of the highlighting component is to return out-of-sight POIs as future analysis directions. This simply means that the neighborhoods that have been already investigated by the user are less peculiar, and the POIs within those regions may not be as interesting as the ones in unexplored regions. Given an ROI , we define its peculiarity score as follows.
| (4) |
We then enrich the traditional parameter with the peculiarity semantics as follows: (line 3 in Algorithm 3 and line 4 in Algorithm 4). Note that is the peculiarity-aware version of the . This simply means that is lower for less peculiar ROIs, and hence less POIs will be highlighted in them. For instance, in case has already captured feedback about two-bedroom home-stays and an ROI has only amenities with two bedrooms, that ROI will receive a low peculiarity score, and hence very few POIs will be highlighted in it.
5 Discussion on Evaluation
We plan to perform the following evaluation strategies to validate the usefulness of IRIDEF:
Single-shot quantitative analysis. Although our approach is multi-shot, we can consider only one iteration of our approach (CAPTURE DISCOVER HIGHLIGHT) and see how the components behave in this single iteration. The behavior can be captured through execution time and memory consumption, as well as precision. We average over several single-shot runs. The feedback will be captured through crowdsourcing campaigns.
Simulation study. We simulate interactive scenarios using virtual agents and measure accumulated quality such as precision, hit ratio, and diversity.
User study. We also perform an in-depth lab study and an in-breadth crowdsourcing study to survey real users about their perception on the resulting regions (ROIs) and the highlights (POIs).
6 Conclusion and Future Work
In this paper, we present IRIDEF, an approach to interactively discover regions of interest (ROIs) using exploratory feedback. The exploratory feedback is captured from mouse moves over the geographical map while analyzing spatial data. We propose a novel polygon-based mining algorithm which returns a few highlights (POIs) in conformance with user’s exploratory preferences. The highlights enable users to have a better understanding of what to focus on in the followup steps in their analysis scenarios. We plan to extend IRIDEF in several directions, such as the incorporation of multi-modal exploratory feedback and the generation of sequential highlights as a mobility-aware guidance.
Acknowledgment
The author thanks Thibaut Thonet, Sruthi Viswanathan, Fabien Guillot, Jean-Michel Renders, and Placido Neto for their constructive comments in the process of writing this paper.
References
- [1] John F. Roddick, Max J. Egenhofer, Erik G. Hoel, Dimitris Papadias, and Betty Salzberg. Spatial, temporal and spatio-temporal databases - hot issues and directions for phd research. SIGMOD Record, 33(2):126–131, 2004.
- [2] Zheng Xu, Yunhuai Liu, Neil Yen, Lin Mei, Xiangfeng Luo, Xiao Wei, and Chuanping Hu. Crowdsourcing based description of urban emergency events using social media big data. TCC, 2016.
- [3] Sihem Amer-Yahia, Ria M Borromeo, Shady Elbassuoni, Behrooz Omidvar-Tehrani, and Sruthi Viswanathan. Interactive generation and customization of travel packages for individuals and groups. In IUI, 2020.
- [4] Hangil Chung, Daniel Freund, and David B Shmoys. Bike angels: An analysis of citi bike’s incentive program. In SIGCAS. ACM, 2018.
- [5] Kaiyu Feng, Gao Cong, Sourav S Bhowmick, Wen-Chih Peng, and Chunyan Miao. Towards best region search for data exploration. In SIGMOD, 2016.
- [6] Cicero A. L. Pahin, Behrooz Omidvar-Tehrani, Sihem Amer-Yahia, Valerie Siroux, Jean-Louis Pepin, Jean-Christian Botel, and Comba Joao. COVIZ: A system for visual formation and exploration of patient cohorts. In VLDB, 2019.
- [7] Ori Bar El, Tova Milo, and Amit Somech. Towards autonomous, hands-free data exploration. In CIDR, 2020.
- [8] Arnab Nandi and H. V. Jagadish. Guided interaction: Rethinking the query-result paradigm. Proc. VLDB Endow., 4(12):1466–1469, 2011.
- [9] Behrooz Omidvar-Tehrani, Plácido A. Souza Neto, Francisco B. Silva Júnior, and Felipe M. Freire Pontes. Exploration of interesting dense regions on spatial data. In Proceedings of the Workshops of the EDBT/ICDT 2020 Joint Conference. CEUR-WS.org, 2020.
- [10] Lilong Jiang, Michael Mandel, and Arnab Nandi. Gesturequery: A multitouch database query interface. Proc. VLDB Endow., 6(12):1342–1345, 2013.
- [11] Sruthi Viswanathan, Fabien Guillot, and Maria Antonietta Grasso. What is natural?: Challenges and opportunities for conversational recommender systems. In María Inés Torres, Stephan Schlögl, Leigh Clark, and Martin Porcheron, editors, Proceedings of the 2nd Conference on Conversational User Interfaces, CUI 2020, Bilbao, Spain, July 22-24, 2020, pages 40:1–40:4. ACM, 2020.
- [12] Georg Buscher, Andreas Dengel, Ralf Biedert, and Ludger V Elst. Attentive documents: Eye tracking as implicit feedback for information retrieval and beyond. ACM Transactions on Interactive Intelligent Systems (TiiS), 1(2):1–30, 2012.
- [13] J. Liang and M. L. Huang. Highlighting in information visualization: A survey. In 2010 14th International Conference Information Visualisation, July 2010.
- [14] Anthony C. Robinson. Highlighting in geovisualization. Cartography and Geographic Information Science, 38(4):373–383, 2011.
- [15] Kanit Wongsuphasawat, Dominik Moritz, Anushka Anand, Jock Mackinlay, Bill Howe, and Jeffrey Heer. Voyager: Exploratory analysis via faceted browsing of visualization recommendations. TVCG, 22(1), 2016.
- [16] Jie Bao, Yu Zheng, David Wilkie, and Mohamed Mokbel. Recommendations in location-based social networks: a survey. GeoInformatica, 19(3):525–565, 2015.
- [17] Justin J. Levandoski, Mohamed Sarwat, Ahmed Eldawy, and Mohamed F. Mokbel. Lars: A location-aware recommender system. In ICDE, pages 450–461, 2012.
- [18] Mansurul Bhuiyan, Snehasis Mukhopadhyay, and Mohammad Al Hasan. Interactive pattern mining on hidden data: a sampling-based solution. In Proceedings of the 21st ACM international conference on Information and knowledge management, pages 95–104. ACM, 2012.
- [19] Dong Xin, Xuehua Shen, Qiaozhu Mei, and Jiawei Han. Discovering interesting patterns through user’s interactive feedback. In Proceedings of the 12th ACM SIGKDD international conference on Knowledge discovery and data mining, pages 773–778. ACM, 2006.
- [20] Kyriaki Dimitriadou, Olga Papaemmanouil, and Yanlei Diao. Aide: an active learning-based approach for interactive data exploration. IEEE Transactions on Knowledge and Data Engineering, 28(11):2842–2856, 2016.
- [21] Niranjan Kamat, Prasanth Jayachandran, Karthik Tunga, and Arnab Nandi. Distributed and interactive cube exploration. In ICDE, 2014.
- [22] Behrooz Omidvar-Tehrani, Sihem Amer-Yahia, and Alexandre Termier. Interactive user group analysis. In CIKM, pages 403–412. ACM, 2015.
- [23] Mario Boley, Michael Mampaey, Bo Kang, Pavel Tokmakov, and Stefan Wrobel. One click mining: Interactive local pattern discovery through implicit preference and performance learning. In Proceedings of the ACM SIGKDD Workshop on Interactive Data Exploration and Analytics, pages 27–35. ACM, 2013.
- [24] Eoin Mac Aoidh, Michela Bertolotto, and David C. Wilson. Analysis of implicit interest indicators for spatial data. In 15th ACM International Symposium on Geographic Information Systems, ACM-GIS 2007, November 7-9, 2007, Seattle, Washington, USA, Proceedings, page 47, 2007.
- [25] Andrea Ballatore and Michela Bertolotto. Semantically enriching vgi in support of implicit feedback analysis. In Katsumi Tanaka, Peter Fröhlich, and Kyoung-Sook Kim, editors, Web and Wireless Geographical Information Systems, pages 78–93, Berlin, Heidelberg, 2011. Springer Berlin Heidelberg.
- [26] Nathan N. Liu, Evan W. Xiang, Min Zhao, and Qiang Yang. Unifying explicit and implicit feedback for collaborative filtering. In Proceedings of the 19th ACM International Conference on Information and Knowledge Management, CIKM ’10, pages 1445–1448, New York, NY, USA, 2010. ACM.
- [27] Behrooz Omidvar-Tehrani, Arnab Nandi, Nicholas Meyer, Dalton Flanagan, and Seth Young. DV8: interactive analysis of aviation data. In 33rd IEEE International Conference on Data Engineering, ICDE 2017, San Diego, CA, USA, April 19-22, 2017, pages 1411–1412. IEEE Computer Society, 2017.
- [28] Shagun Jhaver, Yoni Karpfen, and Judd Antin. Algorithmic anxiety and coping strategies of airbnb hosts. In Proceedings of the 2018 CHI Conference on Human Factors in Computing Systems, page 421. ACM, 2018.
- [29] Jean-Daniel Fekete and Romain Primet. Progressive analytics: A computation paradigm for exploratory data analysis. arXiv preprint arXiv:1607.05162, 2016.
- [30] John Krumm and Eric Horvitz. Predestination: Inferring destinations from partial trajectories. In UbiComp, 2006.
- [31] Sobhan Moosavi, Behrooz Omidvar-Tehrani, R Bruce Craig, Arnab Nandi, and Rajiv Ramnath. Characterizing driving context from driver behavior. In Proceedings of the 25th ACM SIGSPATIAL International Conference on Advances in Geographic Information Systems, pages 1–4, 2017.
- [32] Derya Birant and Alp Kut. ST-DBSCAN: An algorithm for clustering spatial-temporal data. Data Knowl. Eng., 60(1):208–221, January 2007.
- [33] Ronald L. Graham. An efficient algorithm for determining the convex hull of a finite planar set. Info. Pro. Lett., 1:132–133, 1972.
- [34] Luc Devroye and Godfried T Toussaint. A note on linear expected time algorithms for finding convex hulls. Computing, 26(4):361–366, 1981.
- [35] Raphael A. Finkel and Jon Louis Bentley. Quad trees a data structure for retrieval on composite keys. Acta informatica, 4(1):1–9, 1974.
- [36] Behrooz Omidvar-Tehrani, Plácido A. Souza Neto, Felipe M. Freire Pontes, and Francisco Bento da Silva Júnior. Geoguide: An interactive guidance approach for spatial data. In IEEE Smart Data, pages 1112–1117, 2017.
- [37] Behrooz Omidvar-Tehrani, Sruthi Viswanathan, and Jean-Michel Renders. Interactive and explainable point-of-interestrecommendation using look-alike groups. In SIGSPATIAL, 2020.
- [38] Vincent Leroy, Sihem Amer-Yahia, Eric Gaussier, and Hamid Mirisaee. Building representative composite items. In Proceedings of the 24th ACM International on Conference on Information and Knowledge Management, pages 1421–1430, 2015.
- [39] Manish Singh, Ria Mae Borromeo, Anas Hosami, Sihem Amer-Yahia, and Shady Elbassuoni. Customizing travel packages with interactive composite items. In DSAA, pages 137–145. IEEE, 2017.
- [40] Sihem Amer-Yahia, Shady Elbassuoni, Behrooz Omidvar-Tehrani, Ria Borromeo, and Mehrdad Farokhnejad. Grouptravel: Customizing travel packages for groups. In EDBT, 2019.