Radiation study of Lead Fluoride crystals
Abstract
Lead fluoride (PbF2) crystals represent an excellent and relatively innovative choice for high resolution electromagnetic calorimeters with high granularity and fast timing for high intensity environments. For this reason two PbF2 crystals, sized mm3, were irradiated with 60Co photons up to Mrad and with 14 MeV neutrons up to a n/cm2 total fluence. Their loss in transmittance was evaluated at different steps of the photon and neutron irradiation campaign, resulting in a total of 30% loss above 350 nm. With crystals always kept in dark conditions, natural and thermal annealing, as well as optical bleaching with 400 nm light, were performed on the irradiated specimens, resulting in a partial recovery of their original optical characteristics.
1 Introduction
Lead Fluoride crystals represent a very interesting choice for new generation calorimeters. Differently from the most common crystals used in HEP, PbF2 is relatively cheap to produce and - being a Cherenkov radiatior - its timing performance is not limited by the typical scintillator rise and decay times. PbF2 shows a very good transmittance in the UV region with a spectral cut-off edge at 240 nm. Its optical transmittance is a key parameter, since the number of Cherenkov photons peaks at low wavelenghts as follows [1]:
a good transmittance at shorter wavelengths allows a better yield of Cherenkov light [2]. A comparison of its properties with respect to other high-density crystals frequently used in electromagnetic calorimetry is reported in Table 1 [3].
| Crystal | PbF2 | BGO | BaF2 | CsI | CeF2 |
|---|---|---|---|---|---|
| Density [g/cm3] | 7.7 | 7.13 | 4.87 | 4.51 | 6.16 |
| Radiation lenght [cm] | 0.93 | 1.1 | 2.1 | 1.9 | 1.7 |
| Molière radius [cm] | 2.2 | 2.7 | 4.4 | 3.8 | 2.6 |
| Decay constant [ns] | Ch | 300 | 0.6, 620 | 26 | 5, 30 |
The individual and combined effect of Total Ionizing Dose (TID) and neutrons was evaluated by measuring the resulting deterioration in transmittance for two crystals sized mm3, manufactured by SICCAS[4] using a melt growth process, thus resulting in a cubic form (-PbF2). The first crystal was tested without any kind of wrapping (in the following referred as the “naked” one), the other was wrapped with a 100 m thick Mylar foil.
2 Optical properties before the irradiation campaign
Transmittance measurements are useful to investigate properties and quality of these type of crystals.
Transmittance is defined as the ratio between the intensity of a light beam attenuated by its passage trough the crystal and its original intensity:
.
The transmittance was measured longitudinally - i.e. through the crystal axis - with a PerkinElmer Lambda 950 UV/VIS dual-beam spectrometer [5]. In this case the optical transmittance has been evaluated as follows:
where , and are respectively the measured, reference and dark signals, while the subscript 0 refers to the baseline measurement performed without the crystal inside the spectrometer.
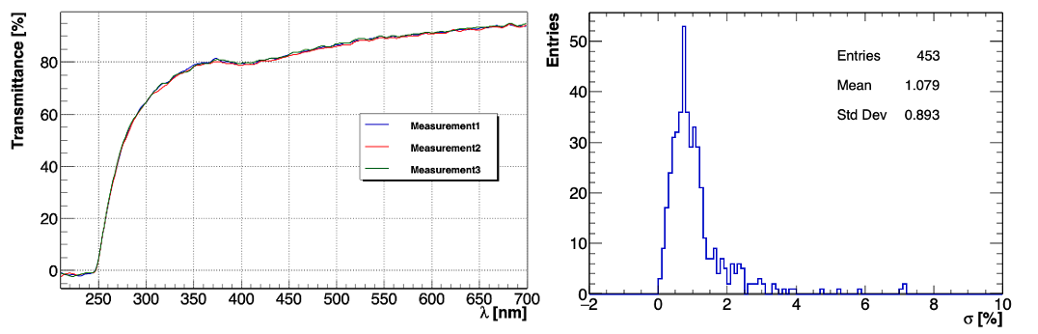
Before starting the measurements, a reproducibility test was performed by removing and placing the crystal on the sample holder for each acquisition. The obtained spectra are reported in Figure 1 (Left). The spread at each wavelength can be evaluated as:
Where and are respectively the maximum and minimum transmittance values relative to a single set of measurements. As shown in Figure 1 (Right), a = 1.1% is associated with the longitudinal transmittance measurement.
A comparison between the transmittance spectra obtained with the “naked” and the Mylar-wrapped crystals is shown in Figure 2. The spectrum of the “naked” crystals shows a lower transmittance with respect to the one wrapped with Mylar because of the reflection losses.
3 Optical properties after 60Co photons irradiation
After the reference transmittance measurements, the irradiation phase was carried out at Calliope[6], a pool-type gamma irradiation facility equipped with a 60Co radio-isotopic source array housed in a large volume m3) shielded cell. The source rack is composed of 25 60Co source rods (with cm2 active area) arranged in a planar geometry, producing photons with MeV. At the time when the measurements were conducted, the activity of the plant was Bq.
The crystals were positioned 70 cm away from the source, with their longitudinal axis perpendicular to it, yielding a 100 krad/h dose rate.
The transmittance measurements were performed at different irradiation steps. The irradiation campaign took place over the span of three days for a total absorbed dose of 4.4 Mrad.
In Table 2 the dose, expressed in krad (air), absorbed in each irradiation step are reported.
| Irradiation Step | Dose in air [krad] |
|---|---|
| I | 30.2 |
| II | 89.88 |
| III | 2082 |
| IV | 4031.8 |
| V | 4435.5 |
In Figure 3 the spectra obtained for the first two irradiation steps are reported, as well as the spectra measured after keeping the crystals one night in a dark environment. A transmission recovery of 10% is observed at 350 nm.
Figure 4 shows the longitudinal transmittance spectra obtained at step III, IV and V of the irradiation.
After a TID of approximately 80 krad, any subsequent irradiation step up to 4.4 Mrad did not result in any significant further decrease in transmittance, suggesting a saturation effect associated with the damage mechanism, as reported elsewhere [7]. The maximum degradation observed is at the level of . The results found with this study are within the range of degradation observed in [2], [3] and [8].
4 Natural annealing and optical bleaching of the crystals
After the irradiation phase, crystals were kept in a dark box to allow their natural recovery, according to the procedure described in [3]. To further improve the recovery process, a light-bleaching run with 400 nm blue light was performed on the irradiation crystals, according to the procedures and methods described in [8]. After 16 hours of optical bleaching, a recovery of a few percent was observed in the transmittance spectrum, indicating a small accelerating effect on the recovery process with respect to the natural annealing case. A summary of the results obtained with natural annealing and the optical bleaching can be found in Figure 5.
5 Optical properties after neutron irradiation
The crystals were subsequently irradiated at the Frascati Neutron Generator (FNG) facility of ENEA Frascati [9].
Neutron generation at FNG is based on the T(d,n) fusion reaction, producing 14 MeV neutrons with a flux up to neutrons/s in steady state or pulsed mode. In Figure 6, the neutron spectrum is shown as a function of the fluence.
The crystals under test were placed 1 cm away from the source (relatively to their front face).
Figure 7 (left) reports the neutron flux map in the FNG facility. In order to better evaluate the expected neutron fluences, a simulation of the irradiation process was implemented on the McStas simulation package [10], using 1 cm bins along the crystal axes.
As shown in Figure 7 (right), the TID associated with the neutron irradiation process resulted in a (negligible) 0.1 krad dose for crystals.
 |
 |
The total fluence delivered in the first cm of the crystals during hour and 30 minutes of irradiation with 14 MeV neutrons was n/cm2.
Due to the technical time related to logistics and shipment of the crystals, transmittance measurements could only be performed 14 days after the irradiation and showed no alteration in the transmittance spectrum (Figure 8 ).
6 Conclusion
The optical transmittance of the two SICCAS PbF2 crystals, the first without any wrapping and the second one with a Mylar wrapping, was studied before and after irradiation performed with photons and neutrons.
The transmittance of the crystals under test were monitored during the photon irradiation steps, up to a 4.4 Mrad TID, and after the subsequent neutron irradiation runs. Natural recovery of crystals, along with light-bleaching and thermal annealing were carried out and compared in terms of their effect on the recovery process.
Acknowledgments
This work was developed within the framework of the International Muon Collider Collaboration (https://muoncollider.web.cern.ch), where the Physics and Detector Group aims to evaluate potential detector R&D to optimize experiment design in the multi-TeV energy regime.
References
- Jelly [1958] JV Jelly. Cherenkov radiation and its application., 1958.
- Ren et al. [2001] Guo-Hao Ren, Ding-Zhong Shen, Shao-Hua Wang, and Zhi-Wen Yin. Optical absorption on cubic -PbF2 crystals. Chinese Physics Letters, 18(7):976–978, 2001.
- Kozma et al. [2002] Peter Kozma, Robert Bajgar, and Petr Kozma Jr. Radiation resistivity of PbF2 crystals. Nuclear Instruments and Methods in Physics Research Section A: Accelerators, Spectrometers, Detectors and Associated Equipment, 484(1-3):149–152, 2002.
- [4] Siccas official page official page. http://www.siccas.com/PbF2LeadfluorideCrystal.htm.
- [5] Perkinelmer website. https://www.perkinelmer.com/CMSResources/Images/44-74450BRO_LAMBDA8509501050.pdf.
- [6] Brochure calliope. https://www.enea.it/it/seguici/pubblicazioni/pdf-opuscoli/calliope.pdf.
- Zhu et al. [1996] R-Y Zhu et al. A study on the properties of lead tungstate crystals. Nuclear Instruments and Methods in Physics Research Section A: Accelerators, Spectrometers, Detectors and Associated Equipment, 376(3):319–334, 1996.
- Achenbach et al. [1998] P Achenbach, I Altarev, K Grimm, T Hammel, D Von Harrach, J Hoffmann, H Hofmann, E-M Kabuß, S Köbis, A Lopes Ginja, et al. Radiation resistance and optical properties of lead fluoride cherenkov crystals. Nuclear Instruments and Methods in Physics Research Section A: Accelerators, Spectrometers, Detectors and Associated Equipment, 416(2-3):357–363, 1998.
- [9] FNG website. http://www.fusione.enea.it/LABORATORIES/Tec/FNG.html.it.
- [10] McStas website. http://www.mcstas.org/.