Modeling Fast Radio Burst Dispersion and Scattering Properties in the First CHIME/FRB CatalogFacilities: CHIME
Abstract
We present a Monte Carlo-based population synthesis study of fast radio burst (FRB) dispersion and scattering focusing on the first catalog of sources detected with the Canadian Hydrogen Intensity Mapping Experiment Fast Radio Burst (CHIME/FRB) project. We simulate intrinsic properties and propagation effects for a variety of FRB population models and compare the simulated distributions of dispersion measures (DMs) and scattering timescales with the corresponding distributions from the CHIME/FRB catalog. Our simulations confirm the results of previous population studies, which suggested that the interstellar medium of the host galaxy alone (simulated based on the NE2001 model) cannot explain the observed scattering timescales of FRBs. We therefore consider additional sources of scattering, namely, the circumgalactic medium (CGM) of intervening galaxies and the circumburst medium whose properties are modeled based on typical Galactic plane environments. We find that a population of FRBs with scattering contributed by these media is marginally consistent with the CHIME/FRB catalog. In this scenario, our simulations favor a population of FRBs offset from their galaxy centers over a population which is distributed along the spiral arms. However, if the models proposing the CGM as a source of intense scattering are incorrect, then we conclude that FRBs may inhabit environments with more extreme properties than those inferred for pulsars in the Milky Way.
I Introduction
Fast radio bursts (FRBs) are dispersed transients of s to ms duration detectable at radio frequencies (see Petroff et al. 2019 and Cordes & Chatterjee 2019 for reviews). Their dispersion measures (DMs) represent the integrated electron column density along the line of sight. The measured DMs are in excess of those expected from the Milky Way, suggesting that the bursts originate outside our Galaxy. Identification of the host galaxy for 20 FRBs has confirmed that these bursts are located at cosmological distances11 1 http://frbhosts.org; accessed in November 2021 (Heintz et al. 2020 and references therein).
The physical origin of FRBs is as yet unknown, with potential progenitors ranging from isolated neutron stars to mergers of compact objects (see Platts et al. 2019 for a summary of the proposed models22 2 http://frbtheorycat.org). The recent detection of a ms-duration radio burst from the Galactic magnetar SGR 1935+2154 shows that magnetars produce at least some fraction of the FRB population (Bochenek et al. 2020; CHIME/FRB Collaboration et al. 2020). Additionally, cataclysmic models can be ruled out at least for the FRB sources that have been observed to repeat (see, e.g., Spitler et al. 2016; CHIME/FRB Collaboration et al. 2019a). It is still unclear whether repeating FRB sources have different progenitors from the so-far non-repeating FRBs, but recent studies suggest that some of the observed properties, namely, burst widths and bandwidths, are significantly different for the two populations (CHIME/FRB Collaboration et al. 2019a; Fonseca et al. 2020; Pleunis et al. 2021).
FRBs can be used as probes of electron density in the intervening media even without knowledge of their progenitors and emission mechanism. As FRB sightlines encounter baryons occurring in a highly diffuse state in the intergalactic medium (IGM), the measured DMs of localized FRBs have been used to constrain the cosmic baryon density (Macquart et al. 2020). Variations in DM along FRB sightlines can probe electron density fluctuations in the IGM and constrain the length scales for IGM turbulence (McQuinn 2014; Masui & Sigurdson 2015; Xu & Zhang 2020). Additionally, FRB DMs can be used to study the diffuse ionized gas in the halos of the Milky Way and other Local Group galaxies (see, e.g., Prochaska & Zheng 2019; Platts et al. 2020).
Another property of FRBs that can be used to study intervening plasma is scattering. Multi-path propagation in inhomogeneous plasma can cause an FRB pulse to be broadened and exhibit an asymmetric scattering tail. For some FRBs located at low Galactic latitudes, such as FRB 20121102A and FRB 20180916B, the Milky Way is inferred to be the dominant contributor to the observed scattering (Ocker et al. 2021). However, most FRBs have scattering times greater than the Galactic expectation along the line of sight (Cordes et al. 2016; Cordes & Chatterjee 2019). While the contribution of the Milky Way to FRB scattering is well constrained by Galactic models of electron density (Cordes & Lazio 2002; Yao et al. 2017), the dominant source of FRB scattering is uncertain.
No correlation has been observed between FRB scattering times and DMs (Katz 2016; Cordes et al. 2016; Qiu et al. 2020). Since the IGM contributes significantly to FRB DMs (Shannon et al. 2018), the lack of a correlation between DMs and scattering times suggests that the IGM is not a significant source of scattering. Masui et al. 2015 also argue against the IGM being the dominant source of scattering for FRB 20110523A and suggest that scattering material is located either in the host galaxy or the circumburst environment. More recently, Chittidi et al. 2020 and Simha et al. 2020 concluded that the scattering for FRB 20190608B originates in either the spiral arm of the host galaxy or the circumburst environment and ruled out intervening halo gas as a source of scattering.
While the aforementioned studies focus on individual FRBs, it is important to ascertain the dominant source of scattering for the population as a whole. If scattering originates in the circumburst medium, then observed scattering timescales can help determine its properties and allow for constraints on progenitor models (CHIME/FRB Collaboration et al. 2019b). If the majority of scattering is found to be caused by halos of intervening galaxies instead, as is suggested by Vedantham & Phinney 2019, then FRB scattering can enable studies of these halos which are poorly understood. Additionally, population studies can also probe the level of plasma turbulence in galaxies that host FRBs (Cordes et al. 2016).
Population synthesis studies of FRB scattering involve simulating host galaxies and other intervening media to assess whether they can reproduce the observed properties for the population. Using this approach, CHIME/FRB Collaboration et al. 2019b concluded that FRBs are located in environments with stronger scattering properties than those derived for the Milky Way ISM using the NE2001 model. Furthermore, Hackstein et al. 2020 found that the scattering timescales for bursts detected with the Parkes (Murriyang) telescope can only be explained by a more turbulent environment than that of SGR 1935+2154. However, these studies were conducted on small FRB samples without absolute calibration of observational biases.
Here we report on a population synthesis study to interpret the scattering properties of the first catalog of bursts detected with the Canadian Hydrogen Intensity Mapping Experiment Fast Radio Burst project (hereafter CHIME/FRB; CHIME/FRB Collaboration et al. 2018). The catalog includes 535 bursts and is the largest sample of FRBs detected using a single detection pipeline with a well-characterized selection function (CHIME/FRB Collaboration et al. 2021).
The paper’s outline is as follows. In §II, we discuss our observational inputs which include the dispersion and scattering properties of the CHIME/FRB catalog. Simulated models for intrinsic FRB properties and propagation effects are described in §III and §IV, respectively. The procedure for the simulations is detailed in §V while results are presented and discussed in §VI. We summarize our conclusions in §VII. We adopt the Planck cosmological parameters (Planck Collaboration et al. 2016) throughout this paper.
II Observations
The first CHIME/FRB catalog (hereafter “Catalog 1”) contains 474 so-far non-repeating sources and 61 bursts from 18 previously reported repeating sources observed in the interval from 2018 July 25 to 2019 July 2 (CHIME/FRB Collaboration et al. 2021). These bursts were detected in the frequency range of 400–800 MHz by searching 1024 total intensity (Stokes I) sky beams with a 0.983-ms time resolution.
The burst-fitting process is described in detail by CHIME/FRB Collaboration et al. 2021. In summary, intensity data for the beam in which the burst was detected with the highest S/N is processed using a least-squares fitting routine, fitburst33 3 The fitburst code has not yet been made public, but the underlying model and likelihood are the same as that used by Masui et al. 2015, whose code is public.. The two-dimensional dynamic spectra of the bursts is modeled as the product of two terms describing the time-independent spectral energy distribution (SED) and the temporal shape, respectively. The SED is modeled as a power-law function with an extra “running” term in the exponent. The intensity at frequency , , where is the spectral index and is the reference frequency (set to be equal to 400.1953125 MHz). The temporal shape is described by a Gaussian function convolved with an exponential scattering tail, the timescale for which has a power-law index of for the frequency dependence.
The routine fits for intrinsic width, DM, scattering timescale, burst amplitude, time of arrival, spectral index () and spectral running (). A second model assuming no scattering is also fit to each burst and values for the two models are compared to assess whether the detection of scattering is statistically significant. If the statistical significance is less than 3, the scattering time is reported as an upper limit approximately equal to the intrinsic width. This criterion results in scattering times for 257 bursts being reported as upper limits.
The observed distribution of best-fit scattering times for the 535 bursts in the sample is not equivalent to the intrinsic distribution for the FRB population and requires correction for selection biases. As a start, bursts susceptible to unquantifiable selection effects are removed from the scattering time distribution. Detailed criteria for exclusion are presented by CHIME/FRB Collaboration et al. 2021, but we note that these exclude bursts with DMs 100 pc cm-3. Bursts with DMs times the maximum of the Galactic DM estimates based on the NE2001 (Cordes & Lazio 2002) and YMW16 (Yao et al. 2017) models are also excluded.
Additionally, we only include the first detection from each repeating FRB source. Subsequent bursts are excluded to ensure that repeating FRBs are not overrepresented in the scattering time distribution for the full population. In doing so, we assume that the scattering timescales do not change between detection of repeat bursts. We find that this assumption is valid for all but one of the repeating sources in our sample i.e. scattering times for repeat bursts are consistent with each other at the level.
The remaining sample includes 292 bursts from both repeating and non-repeating FRB sources. The distribution of scattering times for the surviving sample is then corrected for selection biases, which can be introduced by the telescope beam, RFI environment, gain calibration and signal-classification techniques. These biases are determined by injection of simulated signals into the real-time detection pipeline (CHIME/FRB Collaboration et al. 2021). In summary, the fluence, DM, pulse width, scattering time, spectral index and running of the simulated signals are sampled from the plausible ranges of these parameters. The detection probabilities determined for the injected signals are used to ascertain the instrument selection function for different burst properties.
We use the resulting selection-corrected distribution of scattering timescales (see Figure 17 in CHIME/FRB Collaboration et al. 2021) as an observable to which we compare our simulations. Since dispersion and scattering properties for a given medium are correlated and cannot be studied in isolation, the selection-corrected DM distribution is also used in our analysis. Our population synthesis study tests different FRB population models based on whether they can reproduce this joint distribution of DM and scattering.
The population models that we test assume different spatial distributions and host galaxy types for the simulated FRBs. Additionally, some of the models invoke scattering originating in the circumburst medium and/or in the halos of intervening galaxies. For each population model, we first simulate properties intrinsic to the source, namely, burst energy, redshift, width and sky location. The prescriptions that we use for simulating these properties are described in §III. We then simulate the DM and scattering contributions of different intervening media, prescriptions for which are detailed in §IV.
Using burst energies and redshifts, we calculate burst fluences in order to determine which of the simulated FRBs are detectable with the CHIME/FRB system. The DM and scattering distributions of the simulated detectable bursts are then compared with the corresponding distributions in Catalog 1. We do not compare the simulated fluence distribution with the measured fluences in Catalog 1 as the selection-corrected distributions for DM and scattering are derived assuming these properties are uncorrelated with fluence.
III Modeling Intrinsic Properties
III.1 Redshift
The intrinsic distribution of FRB redshifts is not well-characterized due to the small number of observed FRBs with host galaxy associations (Heintz et al. 2020). In the absence of knowledge about the distribution, we test two different models for the variation of the number density of FRBs with redshift. The first model assumes a constant comoving number density with the probability of detecting an FRB at a redshift ,
| (1) |
where ) is the differential comoving volume per unit solid angle per unit redshift. The factor of corrects the occurence rate of FRBs in each redshift interval for time dilation due to cosmic expansion.

The second model assumes that the number density follows the star-formation rate, motivated by emission models which suggest that FRBs could originate from young stars (see, e.g., Connor et al. 2016; Margalit & Metzger 2018). For this model, the probability of detecting an FRB at a redshift is given by
| (2) |
where the additional pre-factor describes the variation in the comoving star-formation rate with redshift (Madau & Dickinson 2014). The probability density functions for the two models are plotted in Figure 1.
We simulate FRBs up to a maximum redshift of for both models. This choice is informed by the maximum possible redshift calculated using the Macquart et al. 2020 relation for the highest-DM event in Catalog 1. The event, FRB 20180906B, has a measured extragalactic DM of 3015 pc cm-3, which translates to a maximum redshift of 2.95. The maximum redshift of 3 is a conservative assumption as approximately half of the CHIME-detected FRBs are at redshifts (CHIME/FRB Collaboration et al. 2021).
III.2 Energy
We sample the energy emitted by the simulated bursts in the CHIME band according to the Schechter function (Schechter 1976). While a power-law model is widely used to describe the energy distribution of several extragalactic high-energy transients (see, e.g., Sun et al. 2015), we use the Schechter function as it adds an exponential cutoff to the power-law model. Under this assumption, the differential energy distribution for the FRB population is given by,
| (3) |
The exponential cutoff above a maximum energy, , ensures that the total energy emitted by the FRB population () does not diverge for . To reduce the computational cost incurred in simulating progressively larger number of FRBs with low energies, we also assume a minimum energy, . While we allow the power-law index of the distribution, , to vary for each population model being tested (see §V), the minimum and maximum burst energies are held fixed.
We choose the values of and by studying the inferred energy distribution of events included in Catalog 1. The isotropic-equivalent energy of each event is inferred using the expression derived by Macquart & Ekers 2018,
| (4) |
where is the luminosity distance to the FRB source, is the burst fluence, is the observing bandwidth and is the spectral index (). We set to be consistent with the calibration technique used to measure fluences for the Catalog 1 events. Calibration is performed on a band-averaged time series for each burst and thus involves the implicit assumption of (CHIME/FRB Collaboration et al. 2021).

Equation 4 requires the redshift to be known, which is the case for only two sources in Catalog 1, FRB20121102A and FRB20180916B (Tendulkar et al. 2017; Josephy et al. 2019; Marcote et al. 2020). For these sources, we compute burst energies with the associated uncertainties being propagated from the fluence measurements. For all other sources, i.e., those with undetermined redshifts, we compute a maximum energy by ascribing the excess DM to the IGM and calculating a maximum possible redshift using the Macquart relation (Macquart et al. 2020). The inferred burst energies are plotted in Figure 2.
Based on the inferred energy distribution, we adopt a value of erg for . We note that the fluence measurements in Catalog 1 are biased low as they are derived assuming the burst is detected along the meridian, which is the most sensitive location along the transit path. This effect is not accounted for in the fluence uncertainties, thereby causing the maximum inferred energy to not be a true upper bound. Therefore, we re-examine the assumed value of in §VI.1. We choose the value of based on the inferred energies for the two sources with measured redshifts. While the lowest inferred energy is 7 erg, we adopt a more conservative value of erg for .
III.3 Sky Location
We simulate sky locations in order to determine the contribution of the Milky Way to the burst DMs and scattering timescales. Burst locations are simulated based on the exposure of the CHIME/FRB system during the observing duration for Catalog 1 (2018 July 25 to 2019 July 1). Since the sky exposure does not vary significantly with right ascension (CHIME/FRB Collaboration et al. 2021), we sample the burst right ascensions from a uniform distribution. However, the exposure varies significantly with declination (), with sky locations at transiting through the field of view twice per day.

In order to characterize the variation in the total exposure of the CHIME/FRB system as a function of declination, we first co-add exposure maps for the two transits provided by CHIME/FRB Collaboration et al. 2021. While the native resolution of this combined map is 0.7 sq. arcminutes, we downsample the map to a resolution of 1 sq. deg. in order to smooth over the small-scale features such as zero exposure in the gaps between synthesized beams. We then marginalize the resulting map over right ascension to obtain the exposure as a function of declination. Multiplying this function with a cosine function, which describes the variation in sky area with declination, provides us with a probability distribution. We sample burst declinations in accordance with this probability distribution, which is shown in Figure 3. We note that we do not consider variation in sensitivity with declination or across beams and transits while simulating burst locations, as the selection-corrected distributions of observed properties, which the simulated distributions will be compared to, account for bursts detected in locations with different sensitivities.
IV Modeling Propagation Effects
We generate the DMs and scattering timescales of simulated FRBs by modeling the different media through which FRB signals propagate. The DM of each burst is equal to the integrated electron density () along the line of sight and is modeled as,
| (5) |
where the subscripts ‘MW’, ‘IGM’, ‘Host’ and ‘Local’ stand for the Milky Way, the intergalactic medium, host galaxy and local environment of the FRB source, respectively. Assumed models of electron density for each of these media are described in the following subsections. The contribution of the halos of intervening galaxies is included in DMIGM (see §IV.2). The DM contribution of the host galaxy and the circumburst environment are both reduced by a factor of (1+) to account for the combined effect of time dilation of the dispersive delay and photon redshift (Ioka 2003).
We simulate the phenomenon of scattering using the prescription provided by Cordes & Lazio 2002. They model electron density fluctuations () in the intervening inhomogeneous plasma as having a power-law wavenumber () spectrum,
| (6) |
where is the spectral coefficient and denotes the level of turbulence. The inner and outer scale of these fluctuations are denoted by and , respectively, and is set to be equal to for a Kolmogorov wavenumber spectrum. Based on this prescription, we can evaluate the scattering time () using the following expression (Blandford & Narayan 1985; Cordes et al. 2016),
| (7) | ||||
| (8) |
Here is the mean-square scattering angle per unit distance, which we express in Equation 8 in terms of following Appendix B of Cordes et al. 2016. Additionally, is the speed of light, is the gamma function, is the observing wavelength (corresponding to a frequency of 600 MHz), is the classical electron radius and is the angular diameter distance to the source. Following Cordes et al. 2016, we set the inner scale, to be equal to 103 km. The finite wavenumber cutoff associated with the inner scale results in a power-law index of for the frequency dependence, as opposed to the canonical value of for a Kolmogorov medium with a negligible inner scale (Bhat et al. 2004).
The models of electron density assumed for different media can also be used to ascertain scattering measures (SM). The SM integrates the amplitude of the turbulence over the path length that the FRB signal passes through and is estimated using the following equation presented by Cordes & Lazio 2002,
| (9) |
The spectral coefficient is related to the electron density () in the intervening medium as,
| (10) |
where is a numerical constant derived based on the slope of the wavenumber spectrum and is the fluctuation parameter which depends on the outer scale, the volume filling factor of ionized clouds and the magnitude of electron density fluctuations () in the medium. Analogous to the total DM, we obtain the total SM by adding the contributions of all intervening media,
| (11) |
where the subscript ‘CGM’ stands for the halos of intervening galaxies (see §IV.5.) The other subscripts are defined in Equation 5. We increase and by a factor of 3 and 6, respectively, to account for the increased broadening caused by plane waves from extragalactic sources as compared to spherical waves from sources within the Milky Way (Cordes et al. 2016). The factor of in the terms for scattering media at the source redshift corrects for the dilation of the scattering timescale and the observing frequency being redshifted as compared to the emission frequency (Macquart & Koay 2013). The total SM of each FRB is calculated based on its simulated redshift. The SM is then substituted in Equation 8 to calculate a scattering time after appropriately accounting for the prefactors.
IV.1 Milky Way
We estimate the contribution of the Milky Way to the dispersion and scattering measures using the NE2001 model of electron density (Cordes & Lazio 2002). The software implementation of the model integrates the electron density up to a galactocentric radius of 50 kpc, which is greater than the size of any modeled components, thereby providing the maximum possible values for DMMW and SMMW.
We do not use the more recent YMW16 model (Yao et al. 2017) as it derives Galactic scattering times using a DM relation instead of modeling electron density fluctuations. While the DM relation that Yao et al. 2017 use is valid for the level of turbulence in the inner Galaxy, the expected scattering per unit DM varies significantly between different regions of the Galaxy. Therefore, the model overestimates the scattering towards the Galactic anticenter region, as described in Ocker et al. 2021.
In addition to the components of the ISM included in the NE2001 model, we simulate the DM contributed from the halo of the Milky Way. The DM of the Galactic halo, , is greatly uncertain with estimates spanning 10–100 pc cm-3 (Dolag et al. 2015; Prochaska & Zheng 2019; Keating & Pen 2020). We initially assume pc cm-3 based on the results of Dolag et al. 2015. We examine the effect of this assumption on our results in §VI.1. We do not simulate the scattering contribution of the halo as it is constrained to be at least an order of magnitude lower than the temporal resolution of the CHIME/FRB system (Ocker et al. 2021).
IV.2 Intergalactic Medium
The contribution of the IGM to the DMs of FRBs can be calculated using the Macquart relation, which relates the source redshift to DMIGM (Macquart et al. 2020). There is significant scatter in this relation due to the inhomogeneity of the IGM with a majority of sightlines intersecting galaxy halos (McQuinn 2014). To account for these sightline variations, we sample the DMIGM for each simulated FRB from a normal distribution with the mean calculated as per Zheng et al. 2014,
| (12) |
where is the mean number density of nucleons at , is the fraction of baryons in an ionized state and is the matter density in units of the critical density at . The top x-axis in Figure 1 shows the variation in as a function of redshift. The standard deviation of the aforementioned normal distribution is obtained from cosmological simulations performed by McQuinn 2014 for . The standard deviation varies from at to at . For simulated FRBs with , we assume a standard deviation of 20%.
We do not simulate scatter-broadening caused by the IGM and set SM. This choice is motivated by the expected scattering time at 600 MHz, derived based on the turbulence injection scale associated with cosmic structure formation, being at least an order of magnitude lower than the sampling time of the CHIME/FRB system (Macquart & Koay 2013; Zhu et al. 2018).
IV.3 Host Galaxy
We simulate FRBs in different types of host galaxies, namely, spiral, elliptical and dwarf galaxies. We adopt different models of electron density for each galaxy type, which are described in the following subsections. Additionally, we assume that the inclination angles of these host galaxies are uniformly distributed, with the probability of having an inclination angle , . For each FRB, we randomly sample an inclination angle in the range, , based on the aforementioned probability. We do not simulate inclination angles with values between and as the assumed electron density models are symmetric about the plane of the galaxy.
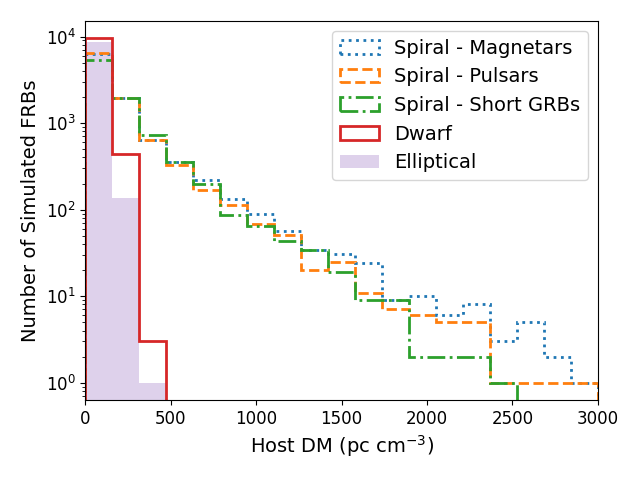
We simulate 104 FRB locations within the host for each galaxy type. The assumed distributions of FRB locations are also described in the following subsections. We then estimate DM and SM for these 104 sightlines through the host galaxy by integrating over the electron density distribution from the event location to the near edge of the host galaxy. The resulting distributions of DMs and scattering times are shown in Figure 4. Additionally, we add the DM expected from the halo of the host galaxy to DM. Analogous to the Milky Way, we assume DMHost,Halo = 30 pc cm-3. We make this assumption for all galaxy types as the electron distribution in the halos of dwarf and elliptical galaxies is poorly understood. While the known sample of FRB host galaxies is morphologically diverse (Heintz et al. 2020), we initially test population models where all FRBs are located in host galaxies of the same type. However, we repeat our analysis for models where FRBs exist in more than one type of host galaxy and present the results in §VI.4.

IV.3.1 Spiral Galaxies
We assume that all spiral galaxies have electron density distributions similar to the Milky Way and use the prescription from the NE2001 model to simulate the electron density in the thin disk, thick disk, spiral arms and galactic center (see Table 2 of Cordes & Lazio 2002). In using the NE2001 model to simulate the electron density of the host galaxy, we implicitly assume that the amplitude of turbulence () and inner scale of the fluctuations in electron density, , are the same as those assumed for the Milky Way by Cordes & Lazio 2002.
As noted earlier, we do not use the YMW16 model to simulate the host galaxy, as Yao et al. 2017 use a DM relation (as described in §IV.1) to obtain the scattering time. As this relation models the expected turbulence in the inner Galaxy, it is only valid for FRBs located in the inner regions of their host galaxy. However, FRBs could be located at large radial distances from their galaxy centers, as discussed below. Their sightlines would not pass through the inner regions of the host, implying that the YMW16 model would overestimate the pulse broadening for such sources.
The distribution of host DMs and scattering times could be influenced by the size distribution of the host galaxies. We assign a radius to each spiral host galaxy by first sampling a galaxy mass and then using the mass-radius relationship provided by Shen et al. 2003,
| (13) |
Here is the galaxy half-light radius and is the galaxy stellar mass. We sample the galaxy mass using the stellar mass function of star-forming galaxies, located at , provided in Table 3 of Moustakas et al. 2013. In doing so, we assume that the rate of FRB occurence within a galaxy is proportional to its stellar mass. We then derive a radius for each host galaxy based on Equation 13, and scale all modeled electron density structures by a factor of (). Here is the effective radius of the Milky Way and is set to be equal to 2.5 kpc (van den Bergh 1999).
We simulate three spatial distributions of FRBs within a spiral host, modifying any length scales for these distributions by a factor of (). The three distributions are motivated by progenitor models involving isolated pulsars (Connor et al. 2016; Cordes & Wasserman 2016), isolated magnetars (Metzger et al. 2019) and merging neutron stars (Totani 2013; Wang et al. 2016; Margalit et al. 2019). For all of these spatial configurations, we sample the source height above the plane of the host galaxy from an exponential distribution. The scale heights of these exponential distributions are set to be equal to those inferred from the observed Galactic population of these sources using population synthesis analyses. We assume a scale height of 30 pc for the magnetar population (Olausen & Kaspi 2014), 330 pc for the pulsar population (Lorimer et al. 2006) and 800 pc for binary neutron star systems (Kiel et al. 2010).
For the pulsar and magnetar models, we simulate FRBs along the spiral arms of the host galaxy. This is motivated by the results of a population synthesis analysis performed by Faucher-Giguère & Kaspi 2006 and we use the methodology described in §3.1.2 of their paper. In summary, the galactocentric radii of simulated FRBs are sampled from a radial distribution for which the surface density peaks at 3 kpc. The azimuthal angle of each FRB is sampled in a way that it falls on the centroids of the spiral arms, locations of which are consistent with those used in the NE2001 model.
For the model in which FRBs are associated with binary neutron star mergers, we simulate the galactocentric radius based on the corresponding distribution observed for short gamma-ray bursts, which exhibit large offsets from the centers of their host galaxies. We sample the radius of the simulated FRBs using the cumulative distribution function (CDF) of host-normalized offsets () provided by Fong & Berger 2013.
IV.3.2 Elliptical Galaxies
While we have a prior on the electron density distribution in spiral galaxies owing to extensive modeling of the Milky Way, the corresponding distribution for elliptical galaxies is not well understood. Although some theoretical models provide a functional form for the variation in electron density with radius (see, e.g., Seta et al. 2021), they do not include a prescription for the scattering properties of elliptical galaxies. Therefore, we follow Xu & Han 2015 in modeling an elliptical galaxy using the thick disk and galactic center components of the NE2001 model, using which we can ascertain both dispersive and scattering properties.
This approach makes an implicit assumption that the elliptical galaxy is the same size as the Milky Way. However, we reduce the free electron density by a factor of in order to account for the lack of ionized gas in elliptical galaxies. This factor is derived based on the H luminosity for an average elliptical galaxy being an order of magnitude lower than the inferred luminosity for the Milky Way (James et al. 2004). As the H luminosity is a tracer of ionized hydrogen, it is proportional to , implying that the free electron density is proportional to the square root of the total H luminosity emitted by the galaxy.
We assume a population of FRBs within the galaxy with a scale height and radial distribution the same as that inferred for the short GRB population, described in §IV.3.1. The resulting DM and scattering time distributions are shown in Figure 4. We note that we do not simulate other spatial distributions of FRBs in elliptical galaxies. Another caveat is that reducing the free electron density across the galaxy by a factor based on the H luminosity assumes that the distribution of ionized hydrogen in elliptical galaxies is similar to that for the Milky Way. This factor could be different if a significant fraction of the H emission originates in small-scale structures such as H II regions. Assuming a different spatial distribution for FRBs or correction factor for the H luminosity is unlikely to significantly change our results. This is because the contribution of an elliptical host galaxy to the total DM and SM will be significantly lower than that of other media, regardless of the assumed parameters.
IV.3.3 Dwarf Galaxies
We model dwarf galaxies using the prescription for the electron density distribution in the Large Magellanic Cloud (LMC) proposed by Yao et al. 2017. Although the LMC is not representative of the full population of dwarf galaxies, observations of radio pulsars have enabled modeling of its electron density distribution. Since similar studies have not been conducted for other galaxies, we use the LMC as a prior for all dwarf galaxies.
Based on DMs observed for 23 pulsars in the LMC, Yao et al. 2017 model it as a disk with exponentially decreasing electron density away from the plane of the galaxy and a Gaussian distribution in the radial direction. The scale height for the exponential fall-off is 0.8 kpc and the standard deviation for the Gaussian function is 3 kpc. We assume the vertical heights and galactocentric radii of the simulated FRBs to follow an exponential and Gaussian distribution, respectively. The parameters of these distributions are set to be the same as those for the assumed electron density distribution. While integrating over this electron density distribution to calculate the SM of a simulated FRB, we assume the turbulence to be the same as that for the thick disk of the Milky Way since the scattering properties of the LMC are not well understood. This is done by setting in Equation 9 to be the same as that for the thick disk in the NE2001 model.
We note that we do not implement a distribution of galaxy radii for dwarf or elliptical galaxies as the total DM and scattering time distribution is not expected to change significantly by varying the sizes of these galaxies. This is because the simulated contribution of these galaxy types to the total DMs of simulated FRBs is much lower than the expected IGM contribution. Additionally, the simulated host scattering times, as shown in Figure 4, are lower than the temporal resolution of the CHIME/FRB instrument.
Two repeating FRB sources, FRB 20121102A and FRB 20190520B, have been localized to star-forming dwarf galaxies (Tendulkar et al. 2017; Niu et al. 2021). The range of possible values for the host DM of FRB 20121102A ( pc cm-3) is consistent with the simulated DMs in this work (see Figure 4). However, the inferred total DM for the host galaxy and local environment of FRB 20190520B is significantly higher (902 pc cm-3). The high inferred DM could be consistent with our simulations if the dominant contributor is the local environment instead of the host galaxy ISM. The association of a compact, persistent radio source with FRB 20190520B supports this possibility.
IV.4 Circumburst Environment
The local environment of an FRB source could contribute significantly to its observed DM, as has been suggested for models in which FRBs are produced by young neutron stars (see, e.g., Connor et al. 2016; Piro 2016). However, these works do not provide an estimate of the scatter-broadening caused by high electron density local environments. The NE2001 model of electron density in the Milky Way provides empirical estimates of local DM and SM (hereafter and ) for 100 Galactic pulsars (Cordes & Lazio 2003). Cordes & Lazio 2003 note that most of these clumps are not associated with known H II regions or supernova remnants and hence might not be an adequate measure of the dispersive or scattering properties of such environments. Nevertheless, in the absence of theoretical estimates, we choose to use these empirically derived values as a prior on the scattering properties of H II regions and supernova remnants. Moreover, the observed dispersion and scattering properties of a few pulsars associated with known H II regions or supernova remnants (Johnston & Romani 2003; Rickett et al. 2009; Ocker et al. 2020) are consistent with the NE2001 estimates for the 100 pulsars, lending support to our choice of using this sample.
We sample the DM of the local environment, , from a log-normal distribution. The parameters of this distribution are based on the distribution of values modeled by Cordes & Lazio 2003. The mean and standard deviation of the underlying normal distribution are 0.18 and 1.09, respectively, and the DM values are generated within 2 of the mean of the normal distribution. Simulated values of range from 0.1 to 300 pc cm-3. The distribution of and are shown in Figure 5.
In order to estimate from the corresponding for each simulated FRB, we first model the relationship between and with a power law using an ordinary least squares regression (see, e.g., Isobe et al. 1990). We then calculate using this power-law model, but allow for scatter in the SM values based on the prediction interval for the least squares regression. The confidence and prediction intervals are shown in Figure 5. While the confidence interval represents the uncertainty in the fit, the prediction interval accounts for the scatter in the dependent variable (SMclump) and indicates the range in which a future observation will lie. Physically, the SM is related to the DM as,
| (14) |
where is the fluctuation parameter for the clump and is the clump radius. The SM values simulated within the prediction interval thus sample the range of fluctuation parameters and widths inferred for the local environments of Galactic pulsars.
We test another configuration in which the circumburst environment has more extreme properties than those assumed above. This is done by setting a minimum threshold for . While sampling local DMs for this configuration, DMs lower than the threshold are rejected and redrawn. We initially assume a threshold of 10 pc cm-3 but examine the effect of increasing the threshold in §VI.2. The scattering measure, , is derived using the same method as described above.

IV.5 Intervening Galaxies
The line of sight to an FRB could also intersect one or more galaxies. Macquart & Koay 2013 estimated the probability of an FRB sightline passing through the ISM of an intervening galaxy to be at . Since the probability of intersection is fairly low, we do not consider the ISM of intervening galaxies as an additional source of dispersion and scattering. However, the probability of a sightline intersecting the halo of an intervening galaxy is significantly higher. Vedantham & Phinney 2019 find that the majority of sightlines out to encounter a M☉ halo and approximately ten M☉ halos. The number of halos that a sightline intercepts peaks at and decreases thereafter.
While the DM contribution of such halos is accounted in the scatter in the Macquart relation (see §IV.2), we model the scattering times using the formalism proposed by Vedantham & Phinney 2019. Their model suggests that sub-parsec scale cool ionized gas clumps (T K) in the circumgalactic media (CGM) of intervening galaxies could contribute to FRB scattering.
The scattering time in this model depends on the volume fraction of the cool gas clumps (), the fraction of baryons in the CGM () and the source redshift. Additionally, the scattering time for two sources at the same redshift could vary by several orders of magnitude depending on the number of galaxy halos their sightlines intersect, masses and redshifts of these halos and the impact parameter to the center of the galaxy. Vedantham & Phinney 2019 account for the aforementioned variables to derive an expression for the fraction of sightlines (referred to as the areal covering factor) for which the scattering time exceeds any given value of (see Figure 8 of their paper). The differential of the areal covering factor with respect to provides the probability density function for . We sample the scattering time of each FRB based on this probability density function evaluated at the simulated source redshift.
Vedantham & Phinney 2019 note that their model is simplistic with many assumptions and that the values of several key parameters such as and are poorly constrained. As the validity of the model is uncertain, we perform our population synthesis analysis for two scenarios, with and without scattering originating in the CGM of intervening galaxies. For the former scenario, we test two configurations corresponding to 30% and 60% of baryons in the CGM, i.e., = 0.3 and 0.6, setting for both these configurations. We choose these two configurations as they can explain scattering observed for FRBs at 1.4 GHz, as noted by Vedantham & Phinney 2019. The scattering time is proportional to and hence varies by an order of magnitude, on average, between the two configurations.
V Simulation Procedure
We test different population models of FRBs, which are listed in Table 1, using Monte Carlo simulations. For each population model, we start by simulating properties intrinsic to the source, namely, burst energy, redshift, sky location, and pulse width (). We sample pulse widths in accordance with the log-normal function fit to the selection-corrected distribution of intrinsic widths for the Catalog 1 sample. Other intrinsic properties are sampled as described in §III. Burst energies are sampled according to the Schechter function (see Equation 3) for which the power-law index is initially set to be equal to a fiducial value of 2.
Based on simulated burst energies and redshifts, we calculate band-averaged fluences for the CHIME band using Equation 4. A simulated burst is considered to be detectable if its fluence is greater than 0.4 Jy ms, which is the lowest fluence for any burst in the catalog. We choose this threshold knowing that selection effects for the catalog have been adequately characterized above this fluence, thereby allowing a robust comparison of the simulated distributions with the selection-corrected distributions. Previous population synthesis studies (see, e.g., Caleb et al. 2016; Gardenier et al. 2019) implement a fluence threshold dependent on the pulse width, scattering time and DM, determined using the radiometer equation. Since an absolute calibration of selection effects is performed for Catalog 1, we do not use the radiometer equation as an approximation for the sensitivity of the CHIME/FRB system.
We simulate 104 bursts for each population model, the DMs and scattering times for which are sampled using the prescriptions provided in §IV. All DMs include the contribution of the Milky Way, the host galaxy and the IGM. However, the scattering times only include the contribution of the Milky Way and the host galaxy. While the contributions of the Milky Way and the IGM are derived based on simulated sky locations and redshifts, the host galaxy contribution is simulated for 104 different sightlines (see §IV.3). Contributions of intervening galaxies and local environments are added for some of the tested models. The different models that we test are listed in Table 1.
In order to compare the simulated DM and scattering distributions with Catalog 1, we perform the same set of cuts on these distributions as in the catalog. This involves excising bursts with DM pc cm-3 or DM times the maximum of the Galactic DM estimates obtained from the NE2001 and YMW16 models (see §II). Additionally, we excise all bursts with 100 ms, as selection effects for the catalog have not been assessed beyond this timescale (CHIME/FRB Collaboration et al. 2021). Since 95% of Catalog 1 bursts survived these three cuts, we redraw DMs and scattering times for bursts which are rejected until the surviving sample contains at least 95% of the simulated detectable bursts, i.e. 9500 bursts.
We also apply two corrections to the simulated distributions to emulate the constraints in measuring widths and scattering times for the Catalog 1 sample. The first of these corrections concerns narrow bursts for which intrinsic widths are difficult to discern due to dispersive smearing and scatter broadening. Simulated bursts with 0.1 ms are set to have widths equal to 0.1 ms, as CHIME/FRB Collaboration et al. 2021 report that intrinsic widths lower than this threshold cannot be robustly measured. The second correction is applied to bursts with low scattering times (), which are difficult to measure using burst-fitting algorithms. For these bursts, we set to be equal to half the intrinsic width, as is done for Catalog 1 (CHIME/FRB Collaboration et al. 2021).
For each population model, we first compare the simulated DM distribution with the selection-corrected catalog. We generate 100 realizations of the DM distribution for both the catalog and the model. The model distribution includes more than 9500 bursts and thus does not vary significantly between realizations. However, we vary the catalog distribution between realizations to account for the uncertainties shown in Figure 6. This is done by randomly sampling the probability density for each DM bin within its 68% confidence interval. Since the post-cut catalog consists of 292 bursts (see §II), we sample 292 DM values in accordance with the PDF using the rejection sampling technique (see, e.g., Flury 1990).
For each realization, we compare the DM distribution for the catalog with the model using a two-sample Kolmogorov-Smirnov (KS) test (Massey Jr. 1951). If the two distributions are inconsistent with each other, with significance, we resample the intrinsic properties, DMs, and scattering timescales for all bursts assuming a different power-law index for the energy distribution. The power-law index is varied in steps of 0.01 until the two DM distributions are found to be consistent. For most population models, we converge on a power-law index for which the simulated DM distribution is consistent with the catalog. We do not proceed with the scattering time comparison for models which fail to converge.
We compare the scattering time distribution for 100 realizations of the converged models with the catalog using both the KS and the Anderson-Darling (AD) tests (Scholz & Stephens 1987). The probability density function for the selection-corrected scattering time distribution for Catalog 1 has fairly large uncertainties particularly longward of 10 ms, as shown in Figure 6. Therefore, for each of the 100 catalog realizations, we randomly sample the probability density in each scattering time bin within its 68% confidence interval. We sample 292 scattering timescales based on the resulting PDF and compare these scattering times with the simulated sample of bursts. We report the results from these statistical tests in Table 1.
| DM (pc cm-3) | – | aaThe DM of the local environment ranges from the minimum reported here to 300 pc cm-3 and is drawn from a log-normal distribution (see §IV.4). | aaThe DM of the local environment ranges from the minimum reported here to 300 pc cm-3 and is drawn from a log-normal distribution (see §IV.4). | |||||||
|---|---|---|---|---|---|---|---|---|---|---|
| Intervening Galaxies (f)bbA dash (–) indicates that the scattering contribution of the CGM of intervening galaxies is assumed to be 0. | – | 0.3 | 0.6 | – | 0.3 | 0.6 | – | 0.3 | 0.6 | |
| Redshift Dist. | Host Galaxy | |||||||||
| Elliptical | 10-82 | 10-42 | 10-17 | 10-77 | 10-46 | 10-15 | 10-39 | 10-19 | 10-8 | |
| Constant | Dwarf | 10-83 | 10-53 | 10-25 | 10-62 | 10-35 | 10-21 | 10-41 | 10-15 | 10-10 |
| Number | Spiral - Short GRBs | 10-41 | 10-22 | 10-15 | 10-32 | 10-19 | 10-10 | 10-17 | 10-7 | 10-6 |
| Density | Spiral - Pulsars | 10-53 | 10-30 | 10-20 | 10-37 | 10-23 | 10-13 | 10-24 | 10-10 | 10-8 |
| Spiral - Magnetars | 10-45 | 10-36 | 10-31 | 10-44 | 10-20 | 10-21 | … | 10-15 | 10-11 | |
| Dwarf | 10-110 | 10-44 | 10-19 | 10-75 | 10-31 | 10-17 | 10-33 | 10-20 | 10-9 | |
| SFRccFor the redshift distribution tracing the star formation rate, we do not test the model in which all FRBs are in elliptical galaxies. The model is not physically motivated due to the low rate of star formation in these galaxies. | Spiral - Short GRBs | 10-42 | 10-20 | 10-15 | 10-35 | 10-18 | 10-9 | 10-15 | 10-8 | 10-4 |
| Spiral - Pulsars | 10-49 | 10-26 | 10-14 | 10-43 | 10-23 | 10-15 | 10-19 | 10-10 | 10-12 | |
| Spiral - Magnetars | 10-51 | 10-28 | 10-19 | 10-33 | 10-26 | 10-12 | 10-23 | 10-33 | … | |
VI Results and Discussion
We conclude that a model is able to reproduce the catalog if at least one of 100 Monte Carlo realizations of the DM and scattering distributions for the model is found to be consistent with the corresponding distributions for Catalog 1. The criteria for consistency is finding no significant differences between the observed and simulated distributions at confidence level with both KS and AD tests. Among the several models being tested (see Table 1), we find that only one population model is able to reproduce the observed properties in Catalog 1. The model that we cannot rule out corresponds to an FRB population hosted in spiral galaxies with a spatial distribution within the host resembling that of the short GRB population. The model also includes scattering arising both in the local environment ( pc cm-3) and in intervening galaxies (). Additionally, the model assumes that the FRB population evolves with redshift in a manner consistent with the star formation rate.
For this model, the mean p-value is 10-4 for the KS test comparing the simulated scattering time distribution with the catalog. While this value is lower than the threshold for 3 confidence, we do not reject the model as we are performing multiple statistical tests using the same data. Testing multiple hypotheses increases the chances of observing a rare event, thereby requiring a lower p-value threshold to claim an inconsistency between the model and the data. The modified threshold is evaluated using the Bonferroni correction (Shaffer 1995) which involves dividing the threshold for confidence (0.0027) by the total number of tests performed (81; see Table 1). The mean p-value for the favored model is greater than the modified threshold (10-5) implying that the model is marginally consistent with the observations. None of the other population models have mean p-values greater than this threshold. We investigate why other models were unable to reproduce our observations in §VI.2 and §VI.5.
The simulated DM and scattering distributions for the model we cannot exclude along with the corresponding distributions for Catalog 1 are shown in Figure 6 and 7. The DM and scattering time distributions for the model are obtained by modeling different intervening media (see §IV), the contributions of which are shown in Figure 8. The conclusion of the aforementioned model being marginally consistent with the observations is subject to various assumptions that we test in §VI.1. We discuss the constraints we can place on the properties of the intervening media and on FRB progenitor models based on this result in §VI.2–VI.5.


VI.1 Varying Assumed Parameters
The results reported in Table 1 are derived from simulations of intrinsic and observed properties of FRBs, modeling of which requires many assumptions. We investigate the robustness of our results to some of these assumptions by repeating our analysis for different values of the assumed parameters.
The first set of assumptions is related to measured fluences in Catalog 1 being biased low as they are calculated assuming all bursts are detected at the most sensitive location along their transit. This systematic error propagates through to the assumed value of for the intrinsic energy distribution chosen based on the inferred energies of Catalog 1 events (as described in §III.2). Additionally, this one-sided systematic error also implies that the minimum detectable fluence assumed for the simulations (0.4 Jy ms; lowest-measured fluence in Catalog 1) could be an underestimate.
We rerun the simulations for all population models twice. In the first iteration, we set to erg as compared to its previously assumed value of erg. While increasing Emax allows more events to be detectable at higher redshifts and hence higher DMs, we find that it does not significantly alter the overall DM distribution and the power-law index of the energy distribution. In the second iteration, we increase the minimum detectable fluence to twice the previously assumed value, setting it to be 0.8 Jy ms. The results for both these iterations confirm our initial conclusions. We find that a short GRB-like population in spiral galaxies with scattering arising in the local environment ( pc cm-3) and CGM of intervening galaxies () still remains the only model even marginally consistent with Catalog 1.
The other assumed parameter that we vary is the DM contribution of the halo of the Milky Way and the host galaxy. While we initially assumed pc cm-3, we perform another iteration of the simulations by sampling halo DM uniformly in the range from 50 to 80 pc cm-3 (Prochaska & Zheng 2019). We find the same model to be favored for this iteration as well.
For all population models, the simulated scattering times are compared to catalog measurements which are derived assuming a power-law index of for the frequency dependence. This choice is motivated by the measured scattering indices for pulsars and FRBs. While the mean value measured for 98 Galactic pulsars is (Bhat et al. 2004), the measured indices for FRBs44 4 https://www.frbcat.org range from to (Petroff et al. 2016). All these measurements are consistent with an index of due to the large associated uncertainties. However, these measurements could also be consistent with an index of , which is the theoretical expectation for a Kolmogorov medium with a negligible inner scale.
While fitting the Catalog 1 bursts with a scattering timescale valid for a power-law index of is outside the scope of this paper, we note that a difference of 0.4 in the index will modify the scattering time by a maximum of . Here and are the lowest and highest observing frequencies, respectively. Since the PDF for the scattering time distribution in the catalog is evaluated for logarithmic bins, measured scattering times for an index of would lie in the same or adjacent bin. The results of the comparison between the simulated distributions and Catalog 1 would thus not change significantly if a power-law index of is assumed.
The burst-fitting process for Catalog 1 (see §II) also involves the assumption of an exponential scattering tail. An exponential tail is expected only if the scattering medium has a single characteristic scale of inhomogeneities (Ostashov & Shishov 1977) and the scatter-broadened image of the source has a Gaussian brightness distribution (Cronyn 1970). Deviations from exponential decay can arise if the electron density fluctuations have a power-law spectrum or the inner scale of the fluctuations is comparable to the diffractive scale (Rickett et al. 2009; Ostashov & Shishov 1977). Although we fit a single functional form to all bursts in order to simplify the fitting process, adopting a different functional form is unlikely to change our results. This is because minor variations in the inferred scattering timescales are not expected to significantly change the resulting PDF which is evaluated for logarithmic bins.
VI.2 Circumburst Environment
We find that none of the population models in which scattering originates only in the ISM of the Milky Way and the host galaxy can reproduce the observed scattering time distribution (see Table 1). These models fail to match the large population of events with scattering times ms, as shown in Figure 9. This result confirms the conclusions of a population synthesis analysis conducted for the first 13 CHIME-detected bursts, which suggested that FRBs must have local environments with stronger scattering properties than the Milky Way ISM if all FRBs are located in spiral galaxies (CHIME/FRB Collaboration et al. 2019b). Similar to this work, the aforementioned analysis assumed that all FRBs are located in spiral galaxies, the ISM for which was simulated using the thin and thick disk, spiral arms and galactic center components of the NE2001 model. Additionally, our result is also consistent with the observation of two FRBs located in the outskirts of their host galaxies showing significant scattering (Day et al. 2020).

We also test models in which FRBs inhabit dense local environments, the DMs and scattering times for which are simulated based on empirically derived values for the lines of sight of 100 Galactic pulsars. The additional scattering contributed by these environments reduces the discrepancy between the simulated and observed population as is indicated by higher p-values for the KS test (see columns for which pc cm-3 in Table 1). We also allow for circumburst environments with more extreme properties by introducing a higher threshold for the local DM contribution, pc cm-3. Although these models, on average, have higher scattering times and higher p-values for the KS test, they are still unable to explain the highly scattered bursts in the observed population, as shown in Figure 10.
While further increasing the local DM threshold increases the total scattering timescales, it causes the overall DM distribution to be inconsistent with the catalog, as shown in Figure 10 for a model in which pc cm-3. Our results therefore suggest that the circumburst media must contribute more scattering per unit DM than typical Galactic plane environments such as H II regions or star-formation complexes. This agrees with the results of a population study of scattering in Parkes FRBs which concluded that FRBs must inhabit a denser and more turbulent environment than a SGR 1935+2154-like magnetar (Hackstein et al. 2020). One caveat, however, is that scattering could be contributed by sources other than the local environment and the ISM of the Milky Way and the host galaxy. We discuss the CGM of intervening galaxies as one such source in §VI.3.

VI.3 Intervening Galaxies
Introducing the CGM of intervening galaxies as an additional source of scattering reduces the discrepancy between the observed and simulated distributions. This is illustrated in Table 1, where population models with no scattering arising in intervening galaxies show higher deviation from the observed distribution as compared to models in which this source of scattering is included. Among the population models we test, the only one we cannot rule out has scattering originating both in the circumburst environment and in intervening galaxies. This model is statistically preferred over one with scattering originating only in the circumburst environment because of two reasons. Firstly, the geometric weighting factor in Equation 9, , implies that material located midway between the source and the observer contributes most significantly to the observed scattering. Therefore, material of the same scattering strength would cause more intense scattering if it were located in an intervening galaxy instead of in the circumburst medium. Secondly, the sub-parsec scale clumps in the CGM of intervening galaxies (Vedantham & Phinney 2019) have additional scattering strength, i.e., contribute more scattering per unit DM as compared to the simulated circumburst environments.
However, it could be that the CGM of intervening galaxies is not as turbulent as assumed in the model put forth by Vedantham & Phinney 2019. Ocker et al. 2021 place an upper limit on the fluctuation parameter, which is proportional to (), for the CGM of the Milky Way using scattering measurements of two FRBs. The fluctuation parameter that they infer is orders of magnitude lower than that proposed for the CGM by Vedantham & Phinney 2019, suggesting that halos of other galaxies might not significantly contribute to FRB scattering. Recent observations of two FRBs whose sightlines intercept halos of other galaxies also support this claim (Cho et al. 2020; Simha et al. 2020). The aforementioned studies prompt us to reconsider the conclusions of §VI.2. If the proposed model of CGM scattering is correct, then the halos of intervening galaxies along with typical galactic plane environments can explain the scattering properties of CHIME/FRB detected sources. However, if the CGM of intervening galaxies is not as turbulent as is suggested by Vedantham & Phinney 2019, then more extreme circumburst environments are required.
VI.4 Host Galaxies
We initially tested population models in which all FRBs are located in host galaxies of the same type, in order to reduce the computational cost of the simulations. For this simplistic scenario, the only model that we cannot formally exclude given the data assumes that all FRBs are located in spiral galaxies. However, observed host galaxies for localized FRBs seem to be drawn from a more heterogeneous sample. While the first repeating FRB was localized to a dwarf galaxy (Tendulkar et al. 2017), since then several spiral and elliptical hosts have been identified with varying rates of star formation (Bhandari et al. 2020). More recently, Heintz et al. 2020 studied the properties of the localized FRB sample and rejected the hypothesis that the population originates exclusively in late-type galaxies with confidence.
To test whether the observed scenario of a heterogeneous sample of host galaxies is consistent with the DM and scattering distributions in the catalog, we rerun our simulations for the model that initially reproduced our observations. However, for this iteration, we place half of the FRB population in spiral galaxies and half in elliptical galaxies. We keep all other parameters constant as we simulate a short GRB-like population evolving with the star-formation rate with scattering arising in the local environment and in intervening galaxies. We find that the population distributed like short GRBs with a mixed distribution of FRB host galaxies is also marginally consistent with the catalog, with the constraints on scattering being the same as those in §VI.3. The mean p-value for the KS test comparing 100 realizations of the scattering time distribution for this model with the catalog is 10-4, implying that the model is as likely as the one in which all FRBs have spiral hosts. As the scattering in both the models is mainly contributed by the circumburst environment and the CGM of intervening galaxies, the significance level does not change even after reducing the scattering contribution of the host ISM for half of the simulated FRBs.
Another property of FRB host galaxies that has been constrained by recent population studies is their DM contribution. The constraints range from 50 to 270 pc cm-3 (see, e.g., Gardenier & van Leeuwen 2020; Yang et al. 2017) and include the contribution of the host galaxy and the circumburst environment. For simulated models consistent with Catalog 1, we find that the median rest-frame host DM ranges from 150 to 200 pc cm-3. Our findings are consistent with a recent study by James et al. 2021 of a sample of FRBs detected with the Parkes (Murriyang) and ASKAP telescopes. The sample also includes seven FRBs with confirmed host galaxies, based on which they infer an average rest-frame host DM of pc cm-3.
More recently, an angular cross-correlation analysis of CHIME/FRB sources with cosmological galaxy catalogs has provided evidence for a sub-population of FRBs at z0.4 with host DMs of 400 pc cm-3 (Rafiei-Ravandi et al. 2021). The aforementioned host DM is estimated in the observer’s frame and translates to a rest-frame DM of 560 pc cm-3. However, Rafiei-Ravandi et al. 2021 clarify that their results do not suggest that majority of FRBs have host DMs greater than this value, implying that the median host DM for our simulations could be consistent with their findings.
Rafiei-Ravandi et al. 2021 suggest that the high host DMs for this sub-population of FRBs could be explained if they are located near the centers of large (1014 M☉) halos. Although we simulate the DM contribution of the host halo in our analysis, we assume it to be similar to the Milky Way (ranging from 30 to 80 pc cm-3). We do not consider the scattering contribution of the host halo as it is expected to be 1 ms for a Milky Way-like galaxy (see §IV.1). Scattering timescales could be larger for halos which are more massive than that of the Milky Way, which has a mass of (Posti & Helmi 2019). We do not simulate a sub-population of FRBs located near these large halos due to the uncertain scattering time contribution but note that it could reduce the discrepancy between the simulated and observed scattering time distributions.
VI.5 Progenitor Models
Our simulations favor a population of FRBs offset from their galaxy centers, modeled based on the observed offsets for the short GRB population. Other progenitor models with offsets similar to those observed for short GRBs could also be consistent with our observations. This result is consistent with observations of FRBs that have been localized with sub-arcsecond precision. Mannings et al. 2020 study the offset distribution for eight such FRBs and find that it is consistent both with a population of core-collapse supernovae and short GRBs (see Figure 4 of their paper).

If the circumburst environment and intervening galaxies contribute significantly to scattering, the simulated scattering times for all tested spatial distributions are consistent with the catalog, as shown in Figure 11. However, spatial distributions resembling those of the pulsar and magnetar populations in the Milky Way can be ruled out due to a lack of low-DM FRBs (see Figure 11). The simulated DMs for a population modeled based on pulsars or magnetars are consistent with the catalog only if the contributions of the host galaxy, the Milky Way and the IGM are considered. The distributions become inconsistent if the DM contribution of dense circumburst environments is included, as shown in Figure 11. Since a population of FRBs offset from their galaxy centers has lower host DMs, on average, than a population distributed along the spiral arms, the simulated DM distribution for a short GRB-like population is statistically consistent with the catalog even with the inclusion of dense circumburst environments.
It is important to note that we cannot rule out pulsars or magnetars as FRB progenitors if FRBs originate in environments with stronger scattering properties (such as a very young supernova remnant) than those simulated in our analysis. This is because higher scattering per unit DM in the local environment can potentially increase the number of low DM FRBs with high scattering times and reduce the discrepancy between the simulated and observed distributions in Figure 11. Although we test different spatial distributions in spiral galaxies, any spatial distribution of FRBs located in a mixed distribution of host galaxies could explain our observations, provided the FRBs inhabit circumburst environments with strong scattering properties. In this scenario, the elliptical and dwarf hosts might be able to explain the observed low DMs while the circumburst environments can reproduce the high scattering timescales.
VII Summary and Conclusions
We have performed a population synthesis study to interpret the joint distribution of dispersion measures and scattering timescales for the first CHIME/FRB catalog. The study involved simulating FRB populations, specifically, their intrinsic properties and propagation effects arising in the Milky Way, the IGM, the CGM of intervening galaxies, the host galaxy and the circumburst environment. The simulated FRB populations were based on different models varying in their redshift distribution, host galaxy types and spatial distribution within the host.
We compared the DM and scattering time distributions for the simulated FRB populations with the corresponding selection-corrected distributions for the catalog using KS and AD tests. For all population models that we simulate, we find that we cannot reproduce the observed scattering times if FRBs have circumburst environments with properties similar to those inferred for the local environments of Galactic pulsars. Based on this result, we infer that the circumburst media of FRBs must have more extreme properties than those of typical Galactic plane environments, thereby improving on the constraints that were derived based on the scattering times of the first 13 CHIME-detected FRBs (CHIME/FRB Collaboration et al. 2019a).
We also test the possibility that sub-parsec scale cool ionized gas clumps in the circumgalactic medium of intervening galaxies could be contributing to FRB scattering (Vedantham & Phinney 2019). We find that we cannot rule out a model of FRBs for which scattering originates in both in the local environment and in intervening galaxies. If the proposed models for CGM scattering are correct, then this additional source of scattering relaxes the requirement of local environments of FRBs having more extreme properties than the ensemble of Galactic plane environments that we model.
While we cannot as yet determine the dominant host galaxy type using the observed DM and scattering distributions, we place some constraints on FRB progenitor models. Our simulations favor a population of FRBs offset from their galaxy centers – like the short GRB population – over a population which is distributed along the spiral arms such as the magnetar and pulsar populations in the Milky Way. However, this result is dependent on the assumption that circumburst environments resemble those of Galactic pulsars.
Another major caveat is that we simulate FRBs in different host galaxies, the electron density distributions of which are poorly understood. The assumed electron density models might not be able to adequately characterize the dispersive and scattering properties of these galaxies. Population studies of this kind therefore need to be augmented by analysis of scattering budgets of localized FRBs (see, e.g., Simha et al. 2020; Ocker et al. 2021). We encourage more such studies as the scattering time measurement for localized sources can be interpreted using additional information about the host galaxy, intervening galaxies and the local environment available from multi-wavelength follow-up observations. Such studies could then provide priors on the level of turbulence in other galaxies which in turn can enhance the robustness of population synthesis studies.
In addition to causing temporal broadening, multi-path propagation can introduce other observable effects, namely, angular broadening and scintillation. Measurement of scintillation bandwidths and angular sizes of FRBs can be used to infer the location of the scattering material along the line of sight (Masui et al. 2015; Marcote et al. 2017) and verify the conclusions presented in this paper. While angular broadening is only observable using Very Long Baseline Interferometry (VLBI), scintillation bandwidths have been measured for 10 bright FRBs detected with CHIME (Schoen et al. 2021). A population study of scintillation bandwidths for the CHIME/FRB sources is reserved for future work.
It is also important to note that the aforementioned conclusions are derived for the full FRB population as the selection-corrected distributions for the CHIME/FRB catalog include both repeating and so-far non-repeating sources (CHIME/FRB Collaboration et al. 2021). The CHIME/FRB system is expected to detect more repeating FRB sources in the coming years which can allow for determination of the selection-corrected distributions exclusively for the repeating FRB population. Analyses similar to the one we report on here can then help discern whether repeating FRBs constitute a different population as compared to non-repeating sources based on their observed scattering properties.
References
- Bhandari et al. (2020) Bhandari, S., Sadler, E. M., Prochaska, J. X., et al. 2020, ApJ, 895, L37, doi: 10.3847/2041-8213/ab672e
- Bhat et al. (2004) Bhat, N. D. R., Cordes, J. M., Camilo, F., Nice, D. J., & Lorimer, D. R. 2004, ApJ, 605, 759, doi: 10.1086/382680
- Blandford & Narayan (1985) Blandford, R., & Narayan, R. 1985, MNRAS, 213, 591, doi: 10.1093/mnras/213.3.591
- Bochenek et al. (2020) Bochenek, C. D., Ravi, V., Belov, K. V., et al. 2020, Nature, 587, 59, doi: 10.1038/s41586-020-2872-x
- Caleb et al. (2016) Caleb, M., Flynn, C., Bailes, M., et al. 2016, MNRAS, 458, 708, doi: 10.1093/mnras/stw175
- CHIME/FRB Collaboration et al. (2018) CHIME/FRB Collaboration, Amiri, M., Bandura, K., et al. 2018, ApJ, 863, 48, doi: 10.3847/1538-4357/aad188
- CHIME/FRB Collaboration et al. (2019a) CHIME/FRB Collaboration, Andersen, B. C., Bandura, K., et al. 2019a, ApJ, 885, L24, doi: 10.3847/2041-8213/ab4a80
- CHIME/FRB Collaboration et al. (2019b) CHIME/FRB Collaboration, Amiri, M., Bandura, K., et al. 2019b, Nature, 566, 230, doi: 10.1038/s41586-018-0867-7
- CHIME/FRB Collaboration et al. (2020) CHIME/FRB Collaboration, Andersen, B. C., Bandura, K. M., et al. 2020, Nature, 587, 54, doi: 10.1038/s41586-020-2863-y
- CHIME/FRB Collaboration et al. (2021) CHIME/FRB Collaboration, :, Amiri, M., et al. 2021, arXiv e-prints, arXiv:2106.04352. https://arxiv.org/abs/2106.04352
- Chittidi et al. (2020) Chittidi, J. S., Simha, S., Mannings, A., et al. 2020, arXiv e-prints, arXiv:2005.13158. https://arxiv.org/abs/2005.13158
- Cho et al. (2020) Cho, H., Macquart, J.-P., Shannon, R. M., et al. 2020, ApJ, 891, L38, doi: 10.3847/2041-8213/ab7824
- Connor et al. (2016) Connor, L., Sievers, J., & Pen, U.-L. 2016, MNRAS, 458, L19, doi: 10.1093/mnrasl/slv124
- Cordes & Chatterjee (2019) Cordes, J. M., & Chatterjee, S. 2019, ARA&A, 57, 417, doi: 10.1146/annurev-astro-091918-104501
- Cordes & Lazio (2002) Cordes, J. M., & Lazio, T. J. W. 2002, arXiv e-prints, astro. https://arxiv.org/abs/astro-ph/0207156
- Cordes & Lazio (2003) —. 2003, arXiv e-prints, astro. https://arxiv.org/abs/astro-ph/0301598
- Cordes & Wasserman (2016) Cordes, J. M., & Wasserman, I. 2016, MNRAS, 457, 232, doi: 10.1093/mnras/stv2948
- Cordes et al. (2016) Cordes, J. M., Wharton, R. S., Spitler, L. G., Chatterjee, S., & Wasserman, I. 2016, arXiv e-prints, arXiv:1605.05890. https://arxiv.org/abs/1605.05890
- Cronyn (1970) Cronyn, W. M. 1970, Science, 168, 1453, doi: 10.1126/science.168.3938.1453
- Day et al. (2020) Day, C. K., Deller, A. T., Shannon, R. M., et al. 2020, MNRAS, 497, 3335, doi: 10.1093/mnras/staa2138
- Dolag et al. (2015) Dolag, K., Gaensler, B. M., Beck, A. M., & Beck, M. C. 2015, MNRAS, 451, 4277, doi: 10.1093/mnras/stv1190
- Faucher-Giguère & Kaspi (2006) Faucher-Giguère, C.-A., & Kaspi, V. M. 2006, ApJ, 643, 332, doi: 10.1086/501516
- Flury (1990) Flury, B. D. 1990, SIAM Review, 32, 474, doi: 10.1137/1032082
- Fong & Berger (2013) Fong, W., & Berger, E. 2013, ApJ, 776, 18, doi: 10.1088/0004-637X/776/1/18
- Fonseca et al. (2020) Fonseca, E., Andersen, B. C., Bhardwaj, M., et al. 2020, ApJ, 891, L6, doi: 10.3847/2041-8213/ab7208
- Gardenier & van Leeuwen (2020) Gardenier, D. W., & van Leeuwen, J. 2020, arXiv e-prints, arXiv:2012.06396. https://arxiv.org/abs/2012.06396
- Gardenier et al. (2019) Gardenier, D. W., van Leeuwen, J., Connor, L., & Petroff, E. 2019, A&A, 632, A125, doi: 10.1051/0004-6361/201936404
- Hackstein et al. (2020) Hackstein, S., Brüggen, M., Vazza, F., & Rodrigues, L. F. S. 2020, MNRAS, 498, 4811, doi: 10.1093/mnras/staa2572
- Heintz et al. (2020) Heintz, K. E., Prochaska, J. X., Simha, S., et al. 2020, ApJ, 903, 152, doi: 10.3847/1538-4357/abb6fb
- Ioka (2003) Ioka, K. 2003, ApJ, 598, L79, doi: 10.1086/380598
- Isobe et al. (1990) Isobe, T., Feigelson, E. D., Akritas, M. G., & Babu, G. J. 1990, ApJ, 364, 104, doi: 10.1086/169390
- James et al. (2021) James, C. W., Prochaska, J. X., Macquart, J. P., et al. 2021, arXiv e-prints, arXiv:2101.07998. https://arxiv.org/abs/2101.07998
- James et al. (2004) James, P. A., Shane, N. S., Beckman, J. E., et al. 2004, A&A, 414, 23, doi: 10.1051/0004-6361:20031568
- Johnston & Romani (2003) Johnston, S., & Romani, R. W. 2003, ApJ, 590, L95, doi: 10.1086/376826
- Josephy et al. (2019) Josephy, A., Chawla, P., Fonseca, E., et al. 2019, ApJ, 882, L18, doi: 10.3847/2041-8213/ab2c00
- Katz (2016) Katz, J. I. 2016, ApJ, 818, 19, doi: 10.3847/0004-637X/818/1/19
- Keating & Pen (2020) Keating, L. C., & Pen, U.-L. 2020, MNRAS, 496, L106, doi: 10.1093/mnrasl/slaa095
- Kiel et al. (2010) Kiel, P. D., Hurley, J. R., & Bailes, M. 2010, MNRAS, 406, 656, doi: 10.1111/j.1365-2966.2010.16717.x
- Lorimer et al. (2006) Lorimer, D. R., Faulkner, A. J., Lyne, A. G., et al. 2006, MNRAS, 372, 777, doi: 10.1111/j.1365-2966.2006.10887.x
- Macquart & Ekers (2018) Macquart, J. P., & Ekers, R. 2018, MNRAS, 480, 4211, doi: 10.1093/mnras/sty2083
- Macquart & Koay (2013) Macquart, J.-P., & Koay, J. Y. 2013, ApJ, 776, 125, doi: 10.1088/0004-637X/776/2/125
- Macquart et al. (2020) Macquart, J. P., Prochaska, J. X., McQuinn, M., et al. 2020, Nature, 581, 391, doi: 10.1038/s41586-020-2300-2
- Madau & Dickinson (2014) Madau, P., & Dickinson, M. 2014, ARA&A, 52, 415, doi: 10.1146/annurev-astro-081811-125615
- Mannings et al. (2020) Mannings, A. G., Fong, W.-f., Simha, S., et al. 2020, arXiv e-prints, arXiv:2012.11617. https://arxiv.org/abs/2012.11617
- Marcote et al. (2017) Marcote, B., Paragi, Z., Hessels, J. W. T., et al. 2017, ApJ, 834, L8, doi: 10.3847/2041-8213/834/2/L8
- Marcote et al. (2020) Marcote, B., Nimmo, K., Hessels, J. W. T., et al. 2020, Nature, 577, 190, doi: 10.1038/s41586-019-1866-z
- Margalit et al. (2019) Margalit, B., Berger, E., & Metzger, B. D. 2019, ApJ, 886, 110, doi: 10.3847/1538-4357/ab4c31
- Margalit & Metzger (2018) Margalit, B., & Metzger, B. D. 2018, ApJ, 868, L4, doi: 10.3847/2041-8213/aaedad
- Massey Jr. (1951) Massey Jr., F. J. 1951, Journal of the American Statistical Association, 46, 68, doi: 10.1080/01621459.1951.10500769
- Masui et al. (2015) Masui, K., Lin, H.-H., Sievers, J., et al. 2015, Nature, 528, 523, doi: 10.1038/nature15769
- Masui & Sigurdson (2015) Masui, K. W., & Sigurdson, K. 2015, Phys. Rev. Lett., 115, 121301, doi: 10.1103/PhysRevLett.115.121301
- McQuinn (2014) McQuinn, M. 2014, ApJ, 780, L33, doi: 10.1088/2041-8205/780/2/L33
- Metzger et al. (2019) Metzger, B. D., Margalit, B., & Sironi, L. 2019, MNRAS, 485, 4091, doi: 10.1093/mnras/stz700
- Moustakas et al. (2013) Moustakas, J., Coil, A. L., Aird, J., et al. 2013, ApJ, 767, 50, doi: 10.1088/0004-637X/767/1/50
- Niu et al. (2021) Niu, C. H., Aggarwal, K., Li, D., et al. 2021, arXiv e-prints, arXiv:2110.07418. https://arxiv.org/abs/2110.07418
- Ocker et al. (2020) Ocker, S. K., Cordes, J. M., & Chatterjee, S. 2020, ApJ, 897, 124, doi: 10.3847/1538-4357/ab98f9
- Ocker et al. (2021) —. 2021, ApJ, 911, 102, doi: 10.3847/1538-4357/abeb6e
- Olausen & Kaspi (2014) Olausen, S. A., & Kaspi, V. M. 2014, ApJS, 212, 6, doi: 10.1088/0067-0049/212/1/6
- Ostashov & Shishov (1977) Ostashov, V. E., & Shishov, V. I. 1977, Radiofizika, 20, 842
- Petroff et al. (2019) Petroff, E., Hessels, J. W. T., & Lorimer, D. R. 2019, A&A Rev., 27, 4, doi: 10.1007/s00159-019-0116-6
- Petroff et al. (2016) Petroff, E., Barr, E. D., Jameson, A., et al. 2016, PASA, 33, e045, doi: 10.1017/pasa.2016.35
- Piro (2016) Piro, A. L. 2016, ApJ, 824, L32, doi: 10.3847/2041-8205/824/2/L32
- Planck Collaboration et al. (2016) Planck Collaboration, Ade, P. A. R., Aghanim, N., et al. 2016, A&A, 594, A13, doi: 10.1051/0004-6361/201525830
- Platts et al. (2020) Platts, E., Prochaska, J. X., & Law, C. J. 2020, ApJ, 895, L49, doi: 10.3847/2041-8213/ab930a
- Platts et al. (2019) Platts, E., Weltman, A., Walters, A., et al. 2019, Phys. Rep., 821, 1, doi: 10.1016/j.physrep.2019.06.003
- Pleunis et al. (2021) Pleunis, Z., Good, D. C., Kaspi, V. M., et al. 2021, arXiv e-prints, arXiv:2106.04356. https://arxiv.org/abs/2106.04356
- Posti & Helmi (2019) Posti, L., & Helmi, A. 2019, A&A, 621, A56, doi: 10.1051/0004-6361/201833355
- Prochaska & Zheng (2019) Prochaska, J. X., & Zheng, Y. 2019, MNRAS, 485, 648, doi: 10.1093/mnras/stz261
- Qiu et al. (2020) Qiu, H., Shannon, R. M., Farah, W., et al. 2020, MNRAS, 497, 1382, doi: 10.1093/mnras/staa1916
- Rafiei-Ravandi et al. (2021) Rafiei-Ravandi, M., Smith, K. M., Li, D., et al. 2021, arXiv e-prints, arXiv:2106.04354. https://arxiv.org/abs/2106.04354
- Rickett et al. (2009) Rickett, B., Johnston, S., Tomlinson, T., & Reynolds, J. 2009, MNRAS, 395, 1391, doi: 10.1111/j.1365-2966.2009.14471.x
- Schechter (1976) Schechter, P. 1976, ApJ, 203, 297, doi: 10.1086/154079
- Schoen et al. (2021) Schoen, E., Leung, C., Masui, K., et al. 2021, Research Notes of the American Astronomical Society, 5, 271, doi: 10.3847/2515-5172/ac3af9
- Scholz & Stephens (1987) Scholz, F. W., & Stephens, M. A. 1987, Journal of the American Statistical Association, 82, 918, doi: 10.2307/2288805
- Seta et al. (2021) Seta, A., Rodrigues, L. F. S., Federrath, C., & Hales, C. A. 2021, ApJ, 907, 2, doi: 10.3847/1538-4357/abd2bb
- Shaffer (1995) Shaffer, J. P. 1995, Annual Review of Psychology, 46, 561, doi: 10.1146/annurev.ps.46.020195.003021
- Shannon et al. (2018) Shannon, R. M., Macquart, J. P., Bannister, K. W., et al. 2018, Nature, 562, 386, doi: 10.1038/s41586-018-0588-y
- Shen et al. (2003) Shen, S., Mo, H. J., White, S. D. M., et al. 2003, MNRAS, 343, 978, doi: 10.1046/j.1365-8711.2003.06740.x
- Simha et al. (2020) Simha, S., Burchett, J. N., Prochaska, J. X., et al. 2020, ApJ, 901, 134, doi: 10.3847/1538-4357/abafc3
- Spitler et al. (2016) Spitler, L. G., Scholz, P., Hessels, J. W. T., et al. 2016, Nature, 531, 202, doi: 10.1038/nature17168
- Sun et al. (2015) Sun, H., Zhang, B., & Li, Z. 2015, ApJ, 812, 33, doi: 10.1088/0004-637X/812/1/33
- Tendulkar et al. (2017) Tendulkar, S. P., Bassa, C. G., Cordes, J. M., et al. 2017, ApJ, 834, L7, doi: 10.3847/2041-8213/834/2/L7
- Totani (2013) Totani, T. 2013, PASJ, 65, L12, doi: 10.1093/pasj/65.5.L12
- van den Bergh (1999) van den Bergh, S. 1999, A&A Rev., 9, 273, doi: 10.1007/s001590050019
- Vedantham & Phinney (2019) Vedantham, H. K., & Phinney, E. S. 2019, MNRAS, 483, 971, doi: 10.1093/mnras/sty2948
- Wang et al. (2016) Wang, J.-S., Yang, Y.-P., Wu, X.-F., Dai, Z.-G., & Wang, F.-Y. 2016, ApJ, 822, L7, doi: 10.3847/2041-8205/822/1/L7
- Xu & Han (2015) Xu, J., & Han, J. L. 2015, Research in Astronomy and Astrophysics, 15, 1629, doi: 10.1088/1674-4527/15/10/002
- Xu & Zhang (2020) Xu, S., & Zhang, B. 2020, ApJ, 898, L48, doi: 10.3847/2041-8213/aba760
- Yang et al. (2017) Yang, Y.-P., Luo, R., Li, Z., & Zhang, B. 2017, ApJ, 839, L25, doi: 10.3847/2041-8213/aa6c2e
- Yao et al. (2017) Yao, J. M., Manchester, R. N., & Wang, N. 2017, ApJ, 835, 29, doi: 10.3847/1538-4357/835/1/29
- Zheng et al. (2014) Zheng, Z., Ofek, E. O., Kulkarni, S. R., Neill, J. D., & Juric, M. 2014, ApJ, 797, 71, doi: 10.1088/0004-637X/797/1/71
- Zhu et al. (2018) Zhu, W., Feng, L.-L., & Zhang, F. 2018, ApJ, 865, 147, doi: 10.3847/1538-4357/aadbb0