On the Evaluation of Neural Code SummarizationConference: The 44th International Conference on Software Engineering; May 21–29, 2022; Pittsburgh, PA, USAConference: 44th International Conference on Software Engineering; May 21–29, 2022; Pittsburgh, PA, USA44th International Conference on Software Engineering (ICSE ’22), May 21–29, 2022, Pittsburgh, PA, USAPrice: 15.00DOI: 10.1145/3510003.3510060ISBN: 978-1-4503-9221-1/22/05CCS: Software and its engineering Software maintenance tools
Abstract.
Source code summaries are important for program comprehension and maintenance. However, there are plenty of programs with missing, outdated, or mismatched summaries. Recently, deep learning techniques have been exploited to automatically generate summaries for given code snippets. To achieve a profound understanding of how far we are from solving this problem and provide suggestions to future research, in this paper, we conduct a systematic and in-depth analysis of 5 state-of-the-art neural code summarization models on 6 widely used BLEU variants, 4 pre-processing operations and their combinations, and 3 widely used datasets. The evaluation results show that some important factors have a great influence on the model evaluation, especially on the performance of models and the ranking among the models. However, these factors might be easily overlooked. Specifically, (1) the BLEU metric widely used in existing work of evaluating code summarization models has many variants. Ignoring the differences among these variants could greatly affect the validity of the claimed results. Besides, we discover and resolve an important and previously unknown bug in BLEU calculation in a commonly-used software package. Furthermore, we conduct human evaluations and find that the metric BLEU-DC is most correlated to human perception; (2) code pre-processing choices can have a large (from -18% to +25%) impact on the summarization performance and should not be neglected. We also explore the aggregation of pre-processing combinations and boost the performance of models; (3) some important characteristics of datasets (corpus sizes, data splitting methods, and duplication ratios) have a significant impact on model evaluation. Based on the experimental results, we give actionable suggestions for evaluating code summarization and choosing the best method in different scenarios. We also build a shared code summarization toolbox to facilitate future research.
Keywords:
Code summarization, Empirical study, Deep learning, Evaluation1. Introduction
Source code summaries†† †Work performed during internship at Microsoft Research Asia.†† §Corresponding authors. are important for program comprehension and maintenance since developers can quickly understand a piece of code by reading its natural language description. However, documenting code with summaries remains a labor-intensive and time-consuming task. As a result, code summaries are often missing, mismatched, or outdated in many projects (Tilley et al. 1992; Briand 2003; Forward and Lethbridge 2002). Therefore, automatic generation of code summaries is desirable and many approaches have been proposed over the years (Sridhara et al. 2010; Haiduc et al. 2010a; Haiduc et al. 2010b; Eddy et al. 2013; Rodeghero et al. 2014).
Recently, deep learning (DL) based models are exploited to generate better natural language summaries for code snippets (Iyer et al. 2016; Hu et al. 2018a; Hu et al. 2018b; Wan et al. 2018; Hu et al. 2020; LeClair et al. 2019; Zhang et al. 2020; Ahmad et al. 2020). These models usually adopt a neural machine translation framework to learn the alignment between code and summaries. Some studies also enhance DL-based models by incorporating information retrieval techniques (Zhang et al. 2020; Wei et al. 2020). Generally, existing neural source code summarization models show promising results and claim their superiority over traditional approaches.
However, we notice that in the current code summarization work, there are many important details that could be easily overlooked and important issues that have not received much attention. These details and issues are associated with evaluation metrics, evaluated datasets and experimental settings, and affect the evaluation and comparison of approaches. In this work, we would like to dive deep into the problem and answer: how to evaluate and compare code summarization models more correctly and comprehensively?
To answer the above question, we conduct systematic experiments of 5 representative code summarization approaches (including CodeNN (Iyer et al. 2016), Deepcom (Hu et al. 2018a), Astattgru (LeClair et al. 2019), Rencos (Zhang et al. 2020) and NCS (Ahmad et al. 2020)) on 6 widely used BLEU variants, 4 extensively used code pre-processing operations (Table 4), and 3 commonly used datasets (including TL-CodeSum (Hu et al. 2018b), Funcom (LeClair et al. 2019), and CodeSearchNet (Husain et al. 2019)). The 6 BLEU variants and 4 code pre-processing operations cover most of the studies on code summarization since 2010. Each dataset is used in at least 5 previous studies.
Our experiments can be divided into three major parts. First, we conduct an in-depth analysis of the BLEU metric, which is widely used in previous code summarization work (Iyer et al. 2016; Hu et al. 2018a; Hu et al. 2018b; Wan et al. 2018; Hu et al. 2020; Alon et al. 2019; LeClair et al. 2019; Ahmad et al. 2020; Zhang et al. 2020; Wei et al. 2019; Feng et al. 2020; LeClair et al. 2020; Wei et al. 2020) and perform human evaluations to find the BLEU variant that best correlates with human perception (Section 4.1). Then, we study different code pre-processing operations in recent code summarization works and explore an ensemble learning based technique to boost the performance of code summarization models (Section 4.2). Finally, we conduct experiments on the three datasets from three perspectives: corpus sizes, data splitting methods, and duplication ratios (Section 4.3). Through extensive experiments, we obtain the following major findings about the current neural code summarization evaluation.
The first major finding is that there is a wide variety of BLEU metrics used in prior work and they produce rather different results for the same generated summaries. Some previous studies (Iyer et al. 2016; Alon et al. 2019; LeClair et al. 2019; Zhang et al. 2020; Wei et al. 2020; Feng et al. 2020; Hu et al. 2018a; Hu et al. 2020; Wei et al. 2019; Lin et al. 2021) accurately describe the BLEU metric used and compare models under the same BLEU metric (Iyer et al. 2016; Alon et al. 2019; LeClair et al. 2019; Zhang et al. 2020; Wei et al. 2020; Feng et al. 2020; Hu et al. 2018a; Hu et al. 2020; Wei et al. 2019; Lin et al. 2021). However, there are still many works (Wan et al. 2018; Hu et al. 2018b; Fernandes et al. 2019; Ahmad et al. 2020; Wu et al. 2021) cite or describe inconsistent BLEU metrics, leading to confusion for subsequent research. What’s worse, some software packages used in (Wei et al. 2019; Hu et al. 2018a; Hu et al. 2020) for calculating BLEU are buggy: ① they may produce a BLEU score greater than 100% (or even 700%), which extremely exaggerates the performance of code summarization models, and ② the results are also different across different package versions. More importantly, BLEU scores between papers cannot be directly compared (Post 2018). However, some studies (Ahmad et al. 2020; Wu et al. 2021) copy the BLEU scores reported in other papers and directly compare with them under different BLEU metrics. For example, (Ahmad et al. 2020) copied the scores reported in (Wei et al. 2019), and (Wu et al. 2021) copied the scores reported in (Ahmad et al. 2020). The BLEU implementations in their released code (Wei et al. 2019; Ahmad et al. 2020) are different. Furthermore, the study (Wu et al. 2021) does not release its source code. Therefore, these studies may overestimate their model performance or may fail to achieve fair comparisons, even though they are evaluated on the same dataset with the same experimental setting. Through human evaluation, we find that BLEU-DC (Section 2.2) correlates with human perception the most. We further give some actionable suggestions on the usage of BLEU in Section 4.1.
The second major finding is that different pre-processing combinations can affect the overall performance by a noticeable margin of -18% to +25%. The results of the exploration experiment show that a simple ensemble learning technique can boost the performance of code summarization models. We also give actionable suggestions on the choice and usage of code pre-processing operations in Section 4.2.
The third major finding is that code summarization approaches perform inconsistently on different datasets, i.e., one approach may perform better than other approaches on one dataset and poorly on another dataset. Furthermore, we experimentally find that three dataset attributes (corpus sizes, data splitting methods, and duplication ratios) have important impact on the performance of code summarization models. We further give some suggestions about evaluation datasets in Section 4.3.
In summary, our findings indicate that in order to evaluate and compare code summarization models more correctly and comprehensively, we need to pay much attention to the implementation of BLEU metrics, the way of code pre-processing, and the usage of datasets. The major contributions of this work are as follows:
- •
We conduct an extensive evaluation of five representative neural code summarization models with different evaluation metrics, code pre-processing operations, and datasets.
- •
We conduct human evaluation and find that BLEU-DC is most correlated to human perception for evaluating neural code summarization models among the six widely-used BLEU variants.
- •
We conclude that many existing code summarization models are not evaluated comprehensively and do not generalize well in new experimental settings. Therefore, more research is needed to further improve code summarization models.
- •
Based on the evaluation results, we give actionable suggestions for evaluating code summarization models from multiple perspectives.
- •
We build a shared code summarization toolbox11 1 https://github.com/DeepSoftwareAnalytics/CodeSumEvaluation containing 6 BLEU variants implementation, 4 code pre-processing operations and 16 of their combinations, 12 datasets, re-implementations of baseline approaches that do not have publicly available source code, and all experimental results described in this paper.
2. Background
2.1. Code Summarization
In the early stage of automatic source code summarization, template-based approaches (Sridhara et al. 2010; Haiduc et al. 2010a; Haiduc et al. 2010b; Eddy et al. 2013; Rodeghero et al. 2014) are widely used. However, a well-designed template requires expert domain knowledge. Therefore, information retrieval (IR) based approaches (Haiduc et al. 2010a; Haiduc et al. 2010b; Eddy et al. 2013; Rodeghero et al. 2014) are proposed. The basic idea is to retrieve terms from source code to generate term-based summaries or to retrieve similar source code and use its summary as the target summary. However, the retrieved summaries may not correctly describe the semantics and behavior of code snippets, leading to the mismatches between code and summaries.
Recently, Neural Machine Translation (NMT) based models are exploited to generate summaries for code snippets (Iyer et al. 2016; Hu et al. 2018a; Hu et al. 2018b; Wan et al. 2018; Fernandes et al. 2019; Hu et al. 2020; Alon et al. 2019; LeClair et al. 2019; Wei et al. 2019; Feng et al. 2020; Ahmad et al. 2020; Cai et al. 2020; Bansal et al. 2021; Lin et al. 2021; Xie et al. 2021; Chen and Zhou 2018; LeClair et al. 2020; Haque et al. 2020; Ye et al. 2020; Wang et al. 2021). CodeNN (Iyer et al. 2016) is an early attempt that uses only code token sequences, followed by various approaches that utilize AST (Hu et al. 2018a; Hu et al. 2020; Alon et al. 2019; LeClair et al. 2019; LeClair et al. 2020; Lin et al. 2021; Shi et al. 2021), API knowledge (Hu et al. 2018b), type information (Cai et al. 2020), global context (Bansal et al. 2021; Haque et al. 2020; Wang et al. 2021), reinforcement learning (Wan et al. 2018; Wang et al. 2020), multi-task learning (Xie et al. 2021), dual learning (Wei et al. 2019; Ye et al. 2020), and pre-trained language models (Feng et al. 2020). In addition, hybrid approaches (Zhang et al. 2020; Wei et al. 2020) that combine the NMT-based and IR-based methods are proposed and shown to be promising.
2.2. BLEU
Bilingual Evaluation Understudy (BLEU) (Papineni et al. 2002) is commonly used for evaluating the quality of the generated code summaries (Iyer et al. 2016; Hu et al. 2018a; Hu et al. 2018b; Wan et al. 2018; Hu et al. 2020; Alon et al. 2019; LeClair et al. 2019; Ahmad et al. 2020; Zhang et al. 2020; Wei et al. 2019; Feng et al. 2020; LeClair et al. 2020; Wei et al. 2020; Haque et al. 2020; Ye et al. 2020). In short, a BLEU score is a percentage number between 0 and 100 that measures the similarity between one sentence to a set of reference sentences using constituent n-grams precision scores. BLEU typically uses BLEU-1, BLEU-2, BLEU-3, and BLEU-4 (calculated by 1-gram, 2-gram, 3-gram, and 4-gram precisions) to measure the precision. A value of 0 means that the generated sentence has no overlap with the reference while a value of 100 means perfect overlap with the reference. Mathematically, the n-gram precision is defined as:
| (1) |
BLEU combines all n-gram precision scores using geometric mean:
| (2) |
is a uniform weight (). The straightforward calculation will result in high scores for short sentences or sentences with repeated high-frequency n-grams. Therefore, Brevity Penalty (BP) is used to scale the score and each n-gram in the reference is limited to be used just once.
The original BLEU was designed for the corpus-level calculation (Papineni et al. 2002). For sentence-level BLEU, since the generated sentences and references are much shorter, is more likely to be zero when the sentence has no 4-gram or 4-gram match. Then the geometric mean will be zero even if , , and are large. In this case, the BLEU score correlates poorly with human judgment. Therefore, several smoothing methods are proposed (Chen and Cherry 2014) to mitigate this problem.
As BLEU can be calculated at different levels and with different smoothing methods, there are many BLEU variants used in prior work and they could generate different results for the same generated summary. Here, we use the names of BLEU variants defined in (Gros et al. 2020) and add another BLEU variant: BLEU-DM, which is a Sentence BLEU without smoothing (Chen and Cherry 2014) and is based on the implementation of NLTK3.2.4. The meaning of these BLEU variants are:
- •
BLEU-CN: This is a Sentence BLEU metric used in (Iyer et al. 2016; Alon et al. 2019; Feng et al. 2020). It applies a Laplace-like smoothing by adding 1 to both the numerator and denominator of for .
- •
BLEU-DM: This is a Sentence BLEU metric used in (Hu et al. 2018a). It uses smoothing method0 based on NLTK3.2.4.
- •
BLEU-DC: This is a Sentence BLEU metric based on NLTK3.2.4 smoothing method4, used in (Hu et al. 2020; Wei et al. 2019).
- •
BLEU-FC: This is an unsmoothed Corpus BLEU metric based on NLTK, used in (LeClair et al. 2019; LeClair et al. 2020; Wei et al. 2020).
- •
BLEU-NCS: This is a Sentence BLEU metric used in (Ahmad et al. 2020). It applies a Laplace-like smoothing by adding 1 to both the numerator and denominator of all .
- •
BLEU-RC: This is an unsmoothed Sentence BLEU metric used in (Zhang et al. 2020). To avoid the divided-by-zero error, it adds a tiny number in the numerator and a small number in the denominator of .
There is an interpretation of BLEU scores by Google (Cloud 2007), which is shown in Table 1. We also show the original BLEU scores reported by existing approaches in Table 2. These scores vary a lot. Specifically, 19.61 for Astattgru would be interpreted as “hard to get the gist” and 38.17 for Deepcom would be interpreted as “understandable to good translations” according to Table 1. However, this interpretation is contrary to the results shown in (LeClair et al. 2019) where Astattgru is relatively better than Deepcom. To study this issue, we need to explore the difference and comparability of different metrics and experimental settings used in different works.
| Score | Interpretation |
|---|---|
| <10 | Almost useless |
| 10-19 | Hard to get the gist |
| 20-29 | The gist is clear, but has significant grammatical errors |
| 30-40 | Understandable to good translations |
| 40-50 | High quality translations |
| 50-60 | Very high quality, adequate, and fluent translations |
| >60 | Quality often better than human |
| Model | CodeNN (Iyer et al. 2016) | Deepcom (Hu et al. 2018a) | Astattgru (LeClair et al. 2019) | Rencos (Zhang et al. 2020) | NCS (Ahmad et al. 2020) |
| BLEU Score | 20.50 | 38.17 | 19.61 | 20.70 | 44.14 |
3. Experimental Design
3.1. Datasets
We conduct experiments on three widely used code summarization datasets: TL-CodeSum (Hu et al. 2018b), Funcom (LeClair et al. 2019), and CodeSearchNet (Husain et al. 2019).
TL-CodeSum has 87,136 method-summary pairs crawled from 9,732 Java projects created from 2015 to 2016 with at least 20 stars. The ratio of the training, validation and test sets is 8:1:1. Since all pairs are shuffled, there can be methods from the same project in the training, validation, and test sets. In addition, there are exact code duplicates among the three partitions.
CodeSearchNet is a well-formatted dataset containing 496,688 Java methods across the training, validation, and test sets. Duplicates are removed and the dataset is split into training, validation, and test sets in proportion with 8:1:1 by project (80% of projects into training, 10% into validation, and 10% into testing) such that code from the same repository can only exist in one partition.
Funcom is a collection of 2.1 million method-summary pairs from 28,945 projects. Auto-generated code and exact duplicates are removed. Then the dataset is split into three parts for training, validation, and testing with the ratio of 9:0.5:0.5 by project.
In Section 4.3, we find that the performance of the same model and the ranking among the models are different on different datasets. To study which characteristic (such as corpus size, deduplication, etc) of datasets affects the performance and how they affect the performance. we modify some characteristics of the datasets and obtain 9 new variants. In total, we experiment on 12 datasets, as shown in Table 3 the statistics. In this paper, we use TLC, FCM, and CSN to denote TL-CodeSum, Funcom, and CodeSearchNet, respectively. TLC is the original TL-CodeSum. TLCDedup is a TL-CodeSum variant, which removes the duplicated samples from the testing set. CSN and FCM are CodeSearchNet and Funcom with source code that cannot be parsed by javalang22 2 https://github.com/c2nes/javalang filtered out. Javalang is used in many previous studies (Zhang et al. 2020; Panthaplackel et al. 2020; Panthaplackel et al. 2021; Hu et al. 2020; Lin et al. 2021; Zhang et al. 2019) to parse source code. The three magnitudes (small, medium and large) are defined by the training set size of three widely used datasets we investigated in this paper. Specifically, small: the training size of TLC, medium: the training size of CSN, large: the training size of FCM. These datasets are mainly different from each other in corpus sizes, data splitting ways, and duplication ratios. Their detailed descriptions can be found in Section 3.4.
| Name | #Method | #Class | #Project | Description | |||
| Training | Validation | Test | All | ||||
| TLC | 69,708 | 8,714 | 8,714 | 87,136 | – | 9,732 | Original TL-CodeSum (Hu et al. 2018b) |
| TLCDedup | 69,708 | 8,714 | 6,449 | 84,871 | – | – | Deduplicated TL-CodeSum |
| CSN | 454,044 | 15,299 | 26,897 | 496,240 | 136,495 | 25,596 | Filtered CodeSearchNet (Husain et al. 2019) |
| CSNProject-Medium | 454,044 | 15,299 | 26,897 | 496,240 | 136,495 | 25,596 | CSN split by project |
| CSNClass-Medium | 448,368 | 19,707 | 28,165 | 496,240 | 136,495 | 25,596 | CSN split by class |
| CSNMethod-Medium | 446,607 | 19,855 | 29,778 | 496,240 | 136,495 | 25,596 | CSN split by method |
| CSNMethod-Small | 69,708 | 19,855 | 29,778 | 119,341 | – | – | Subset of CSNMethod-Medium |
| FCM | 1,908,694 | 104,948 | 104,777 | 2,118,419 | – | 28,790 | Filtered Funcom (LeClair et al. 2019) |
| FCMProject-Large | 1,908,694 | 104,948 | 104,777 | 2,118,419 | – | 28,790 | Split FCM by project |
| FCMMethod-Large | 1,908,694 | 104,948 | 104,777 | 2,118,419 | – | 28,790 | Split FCM by method |
| FCMMethod-Medium | 454,044 | 104,948 | 104,777 | 663,769 | – | – | Subset of FCMMethod-Large |
| FCMMethod-Small | 69,708 | 104,948 | 104,777 | 279,433 | – | – | Subset of FCMMethod-Large |
3.2. Evaluated Approaches
We choose the five approaches with the consideration of representativeness and diversity.
CodeNN (Iyer et al. 2016) is the first neural approach that learns to generate summaries of code snippets. It is a classical encoder-decoder framework in NMT that encodes code to context vectors and then generates summaries in the decoder with the attention mechanism.
Deepcom (Hu et al. 2018a) is an SBT-based (Structure-based Traversal) model, which can capture the syntactic and structural information from AST. It is an attentional LSTM-based encoder-decoder neural network that encodes the SBT sequence and generates summaries.
Astattgru (LeClair et al. 2019) is a multi-encoder neural model that encodes both code and AST to learn lexical and syntactic information of Java methods. It uses two GRUs to encode code and SBT sequences, respectively.
NCS (Ahmad et al. 2020) is the first attempt to replace the previous RNN units with the more advanced Transformer model, and it incorporates the copying mechanism (See et al. 2017) in the Transformer to allow both generating words from vocabulary and copying from the input source code.
Rencos (Zhang et al. 2020) is a representative model that combines information retrieval techniques with the generation model in the code summarization task. Specifically, it enhances the neural model with the most similar code snippets retrieved from the training set.
3.3. Experimental Settings
We use the default hyper-parameter settings provided by each method and adjust the embedding size, hidden size, learning rate, and max epoch empirically to ensure that each model performs well on each dataset. We adopt max epoch 200 for TLC and TLCDedup (others are 40) and early stopping with patience 20 to enable the convergence and generalization. In addition, we run each experiment 3 times and display the mean and standard deviation in the form of . All experiments are conducted on a machine with 252 GB main memory and 4 Tesla V100 32GB GPUs.
We use the provided implementations by each approach: CodeNN 33 3 https://github.com/sriniiyer/codenn, Astattgru 44 4 https://bit.ly/2MLSxFg, NCS 55 5 https://github.com/wasiahmad/NeuralCodeSum and Rencos 66 6 https://github.com/zhangj111/rencos. For Deepcom, we re-implement the method77 7 The code for our re-implementation is included in our toolbox. according to the paper description since it is not publicly available. We have checked the correctness by reproducing the scores in the original paper (Hu et al. 2018a) and double confirmed with the authors of Deepcom.
3.4. Research Questions
We investigate three research questions from three aspects: metrics, pre-processing operations, and datasets.
RQ1: How do different BLEU variants affect the evaluation of code summarization?
There are several metrics commonly used for various NLP tasks such as machine translation, text summarization, and captioning. These metrics include BLEU (Papineni et al. 2002), Meteor (Banerjee and Lavie 2005), Rouge-L (Lin 2004), Cider (Vedantam et al. 2015), etc. In RQ1, we only present BLEU as it is the most commonly used metric in the code summarization task. To study "how do different BLEU variants affect the evaluation of code summarization?" and find "which variant should we use in practice?", we conduct some extensive experiments and the human evaluation. We first train and test the 5 approaches on TLC and TLCDedup, and measure their generated summaries using different BLEU variants. Then we will introduce the differences of the BLEU variants in detail, and summarize the reasons for the differences from three aspects: different calculation levels (sentence-level v.s. corpus-level), different smoothing methods used, and many problematic software implementations. Finally, we analyze the impact of each aspect, conduct human evaluation, and provide actionable guidelines on the use of BLEU, such as how to choose a smoothing method, and how to report BLEU scores more clearly and comprehensively.
Human evaluation. To find which BLEU correlates with the human perception the most, we conduct a human evaluation. First, we randomly sample 300 (100 per dataset) generated summaries paired with original summaries. Then, we invite 5 annotators with excellent English ability and more than 2 years of software development experience. Each annotator is asked to assign scores from 0 to 4 to measure the semantic similarity between reference and generated summaries. The detailed meaning of these scores is given in Table 1 of our online Appendix88 8 https://github.com/DeepSoftwareAnalytics/CodeSumEvaluation/tree/master/Appendix. To verify the agreement among the annotators, we calculate the Krippendorff’s alpha (Hayes and Krippendorff 2007) and Kendall rank correlation coefficient (Kendall’s Tau) (Kendall 1945) values. The value of Krippendorff’s alpha is 0.93, and the values of pairwise Kendall’s Tau range from 0.87 to 0.99, which indicates that there is a high degree of agreement between the 5 annotators and the scores are reliable. Then, we average scores of 5 annotators as the human score for each generated summary. Finally, following Wei at al. (Tao et al. 2021), we use Kendall’s rank correlation coefficient (Kendall 1945) and Spearman correlation coefficient (Ziegel 2001) to measure the correlation between the human evaluation and each BLEU variant.
Human score for each corpus. To study the correlation between BLEU variants and human evaluation at the corpus-level, we should obtain the human score of a corpus. Following (Ma et al. 2019), we average the human scores over all generated summaries as the final human score for a corpus. We use both arithmetic and geometric average in this paper.
Number of summaries in each corpus. To ensure the generalization and reliability of the conclusion, we randomly sample summaries from 300 scored samples as a corpus, where , and we repeat this sampling process 5000 times.
RQ2: How do different pre-processing operations affect the performance of code summarization?
There are various code pre-processing operations used in related work, such as token splitting, lowercase. We study recent papers on code summarization since 2010 according to the pre-processing operations they have used and summarize the result in Table 4. We select four operations that are most widely used to investigate whether different pre-processing operations would affect performance and find the dominated pre-processing choice.
We define a bit-wise notation to denote different pre-processing combinations. For example, means , , , and , which stands for performing , , and preventing , . Then, we evaluate different pre-processing combinations on TLCDedup dataset in Section 4.2.
RQ3: How do different characteristics of datasets affect the performance?
Many datasets have been used in source code summarization. We first evaluate the performance of different methods on three widely used datasets, which are different in three attributes: corpus sizes, data splitting methods, and duplication ratios. Then, we study the impact of the three attributes with the extended datasets shown in Table 3. The three attributes we consider are as follows:
Data splitting methods: there are three data splitting ways we investigate: ① by method: randomly split the dataset after shuffling the all samples (Hu et al. 2018b), ② by class: randomly divide the classes into the three partitions such that code from the same class can only exist in one partition, and ③ by project: randomly divide the projects into the three partitions such that code from the same project can only exist in one partition (Husain et al. 2019; LeClair et al. 2019).
Corpus sizes: there are three magnitudes of training set size we investigate: ① small: the training size of TLC, ② medium: the training size of CSN, and ③ large: the training size of FCM.
Duplication ratios: Code duplication is common in software development practice. This is often because developers copy and paste code snippets and source files from other projects (Lopes et al. 2017). According to a large-scale study (Mockus 2007), more than 50% of files were reused in more than one open-source project. Normally, for evaluating neural network models, the training set should not contain samples in the test set. Thus, ignoring code duplication may result in model performance and generalization ability not being comprehensively evaluated according to the actual practice. Among the three datasets we experimented on, Funcom and CodeSearchNet contain no duplicates because they have been deduplicated, but we find the existence of 20% exact code duplication in TL-CodeSum. Therefore, we conduct experiments on TL-CodeSum with different duplication ratios to study this effect.
4. Experimental Results
4.1. Analysis of Different Evaluation Metrics. (RQ1)
| Model | TLC | TLCDedup | ||||||||||
| BLEU-DM | BLEU-FC | BLEU-DC | BLEU-CN | BLEU-NCS | BLEU-RC | BLEU-DM | BLEU-FC | BLEU-DC | BLEU-CN | BLEU-NCS | BLEU-RC | |
| CodeNN | 51.98 | 26.04 | 36.50 | 33.07 | 33.78 | 26.32 | 40.95 | 8.90 | 20.51 | 15.64 | 16.60 | 7.24 |
| Deepcom | 40.18 | 12.14 | 24.46 | 21.18 | 22.26 | 13.74 | 34.81 | 4.03 | 15.87 | 11.26 | 12.68 | 3.51 |
| Astattgru | 50.87 | 27.11 | 35.77 | 31.98 | 32.64 | 25.87 | 38.41 | 7.50 | 18.51 | 13.35 | 14.24 | 5.53 |
| Rencos | 58.64 | 41.01 | 47.78 | 46.75 | 47.17 | 40.39 | 45.69 | 22.98 | 31.22 | 29.81 | 30.37 | 21.39 |
| NCS | 57.08 | 36.89 | 45.97 | 45.19 | 45.51 | 38.37 | 43.91 | 18.37 | 29.07 | 27.99 | 28.42 | 18.94 |
| and represent sentence BLEU and corpus BLEU, respectively. represents different smoothing methods, | ||||||||||||
| is without smoothing method, and means using add-one Laplace smoothing which is similar to . | ||||||||||||
We experiment on the five approaches and measure their generated summaries using different BLEU variants. The results are shown in Table 5. We can find that:
- •
The scores of different BLEU variants are different for the same summary. For example, the BLEU scores of Deepcom on TLC vary from 12.14 to 40.18. Astattgru is better than Deepcom in all BLEU variants.
- •
The ranking of models is not consistent using different BLEU variants. For example, the score of Astattgru is higher than that of CodeNN in terms of BLEU-FC but lower than that of CodeNN in other BLEU variants on TLC.
- •
Under the BLEU-FC measure, many existing models (except Rencos) have scored lower than 20 on TLCDedup dataset. According to the interpretations in Table 1, this means that under this experimental setting, the generated summaries are not gist-clear and understandable.
Next, we elaborate on the differences among the BLEU variants. The mathematical equation of BLEU is shown in Equation (2), which combines all n-gram precision scores using the geometric mean. The BP (Brevity Penalty) is used to scale the score because the short sentence such as single word outputs could potentially have high precision.
BLEU (Papineni et al. 2002) is firstly designed for measuring the generated corpus; as such, it requires no smoothing, as some sentences would have at least one n-gram match. For sentence-level BLEU, will be zero when the example has not a 4-gram, and thus the geometric mean will be zero even if is large. For sentence-level measurement, it usually correlates poorly with human judgment. Therefore, several smoothing methods have been proposed in (Chen and Cherry 2014). NLTK 99 9 https://github.com/nltk/nltk (the Natural Language Toolkit), which is a popular toolkit with 9.7K stars, implements the corpus-level and sentence-level measures with different smoothing methods and are widely used in evaluating generated summaries (Hu et al. 2018a; Hu et al. 2020; Wei et al. 2019; Hu et al. 2018b; LeClair et al. 2019; LeClair et al. 2020; Stapleton et al. 2020; Wei et al. 2020). However, there are problematic implementations in different NLTK versions, leading to some BLEU variants unusable. We further explain these differences in detail.
4.1.1. Sentence v.s. corpus BLEU
The BLEU score calculated at the sentence level and corpus level is different, which is mainly caused by the different calculation strategies for merging all sentences. The corpus-level BLEU treats all sentences as a whole, where the numerator of is the sum of the numerators of all sentences’ , and the denominator of is the sum of the denominators of all sentences’ . Then the final BLEU score is calculated by the geometric mean of . Different from corpus-level BLEU, sentence-level BLEU is calculated by separately calculating the BLEU scores for all sentences, and then the arithmetic average of them is used as sentence-level BLEU. In other words, sentence-level BLEU aggregates the contributions of each sentence equally, while for corpus-level, the contribution of each sentence is positively correlated with the length of the sentence. Because of the different calculation methods, the scores of the two are not comparable. We thus suggest explicitly report at which level the BLEU is being used.
4.1.2. Smoothing methods
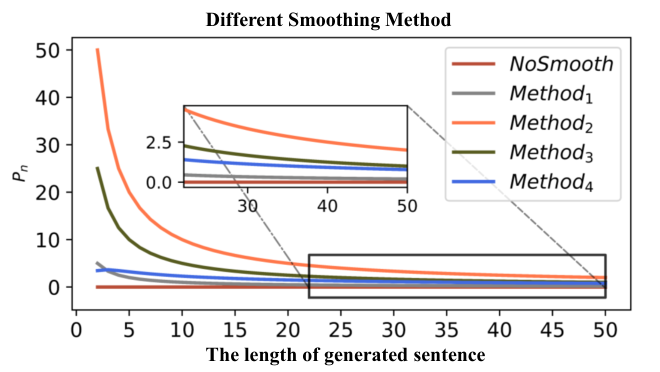
Smoothing methods are applied when deciding how to deal with cases if the number of matched n-grams is 0. Since BLEU combines all n-gram precision scores () using the geometric mean, BLEU will be zero as long as any n-gram precision is zero. One may add a small number to , however, it will result in the geometric mean being near zero. Thus, many smoothing methods are proposed. Chen et al. (Chen and Cherry 2014) summarized 7 smoothing methods. Smoothing methods 1-4 replace 0 with a small positive value, which can be a constant or a function of the generated sentence length. Smoothing methods 5-7 average the , , and –gram matched counts in different ways to obtain the n-gram matched count. We plot the curve of under different smoothing methods applied to sentences of varying lengths in Figure 1 (upper). We can find that the values of calculated by different smoothing methods can vary a lot, especially for short sentences, which are often seen in code summaries.

4.1.3. Bugs in software packages
We measure the same summaries generated by CodeNN in three BLEU variants (BLEU-DM, BLEU-FC, and BLEU-DC), which are all based on the NLTK implementation (but with different versions). From Table 6, we can observe that scores of BLEU-DM and BLEU-DC are very different under different NLTK versions (from to ). This is because the buggy implementations for method0 and method4 in different versions, which can cause up to 97% performance difference for the same metric.
Smoothing method0 bug. method0 (means no smoothing method) of NLTK3.2.x only combines the non-zero precision values of all n-grams using the geometric mean. For example, BLEU is the geometric mean of , , and when and .
Smoothing method4 bugs. method4 is implemented problematically in different NLTK versions. We plot the curve of of different smoothing method4 implementations in NLTK in Figure 1 bottom, where the correct version is NLTK3.6.x. In NLTK versions 3.2.2 to 3.4.x, , where , which always inflates the score in different length (Figure 1). The correct method4 proposed in (Chen and Cherry 2014) is , where and is a geometric sequence starting from 1/2 to n-grams with 0 matches. In NLTK3.5.x, where is the length of the generated sentence, thus can be assigned with a percentage number that is much greater than 100% (even 700%) when 5 in n-gram. We have reported this issue1010 10 https://github.com/nltk/nltk/issues/2676 and filed a pull request1111 11 https://github.com/nltk/nltk/pull/2681 to NLTK GitHub repository, which has been accepted and merged into the official NLTK library and released in NLTK3.6.x (the revision is shown in Figure 2). Therefore, NLTK3.6.x should be used when using smoothing method4.
From the above experiments, we can conclude that BLEU variants used in prior work on code summarization are different from each other and the differences can carry some risks such as the validity of their claimed results. Thus, it is unfair and risky to compare different models without using the same BLEU implementation. For instance, it is unacceptable that researchers ignore the differences among the BLEU variants and directly compare their results with the BLEU scores reported in other papers. We use the correct implementation to calculate BLEU scores in the following experiments.
| Metric | NLTK version | |||
|---|---|---|---|---|
| 1212 12 Except for versions 3.2 and 3.2.1, as these versions are buggy with the ZeroDivisionError exception. Please refer to https://github.com/nltk/nltk/issues/1458 for more details. | / | 1313 13 NLTK3.6.x are the versions with the BLEU calculation bug fixed by us. | ||
| BLEU-DM | 51.98 | 26.32 | 26.32 | 26.32 |
| BLEU-FC | 26.04 | 26.04 | 26.04 | 26.04 |
| BLEU-DC | 36.50 | 36.50 | 42.39 | 28.35 |
4.1.4. Human evaluation
| Metric | 1 | 20 | 40 | 60 | 80 | 100 | ||||||
|---|---|---|---|---|---|---|---|---|---|---|---|---|
| BLEU-DM | 0.32 | 0.68 | 0.61 | 0.80 | 0.62 | 0.81 | 0.62 | 0.81 | 0.62 | 0.82 | 0.61 | 0.8 |
| BLEU-FC | 0.32 | 0.68 | 0.41 | 0.58 | 0.39 | 0.56 | 0.38 | 0.55 | 0.38 | 0.55 | 0.37 | 0.54 |
| BLEU-DC | 0.54 | 0.75 | 0.65 | 0.84 | 0.66 | 0.85 | 0.66 | 0.85 | 0.66 | 0.85 | 0.65 | 0.84 |
| BLEU-CN | 0.47 | 0.66 | 0.60 | 0.79 | 0.61 | 0.81 | 0.62 | 0.81 | 0.62 | 0.81 | 0.61 | 0.81 |
| BLEU-NCS | 0.37 | 0.53 | 0.57 | 0.76 | 0.58 | 0.78 | 0.59 | 0.78 | 0.59 | 0.79 | 0.58 | 0.78 |
| BLEU-RC | 0.32 | 0.68 | 0.61 | 0.80 | 0.62 | 0.81 | 0.62 | 0.81 | 0.62 | 0.82 | 0.61 | 0.8 |
To answer the question “which BLEU correlates with human perception the most”, we conduct the human evaluation. Table 7 shows the values of correlation coefficient under different corpus sizes when using arithmetic average1414 14 We also conduct another experiment that uses a geometric average to aggregate summary-level human scores as the corpus-level score. As the conclusion is consistent with the arithmetic average experiment, we put the results in the online Appendix Table 2 to save space. to aggregate summary-level human scores as the corpus-level score. Table 7 shows that, in terms of correlation coefficient , ① when the corpus size is 1 (one-sentence level), BLEU metrics without smoothing method (BLEU-DM, BLEU-FC, and BLEU-RC) correlate poorly with human perception, and smoothing methods improve the correlation over no smoothing. Both findings are consistent with previous studies (Roy et al. 2021; Chen and Cherry 2014). ② BLEU-DC, BLEU-CN, and BLEU-NCS are comparable and always have higher correlation coefficients than other BLEU variants. Among them, the BLEU-DC performs significantly better, which indicates that sentence-level BLEU with method4 is more relevant to human perception. This is because method4 smooths zero values without inflating the precision compared to method2 and method3 (top of Figure 1).
4.2. The Impact of Different Pre-processing Operations (RQ2)
| Model | ||||||||
|---|---|---|---|---|---|---|---|---|
| CodeNN | 7.19 | 7.18 | 7.18 | 7.19 | 7.18 | 7.19 | 7.19 | 7.18 |
| Astattgru | 5.91 | 5.97 | 5.63 | 6.26 | 5.85 | 6.03 | 5.81 | 6.07 |
| Rencos | 21.85 | 21.55 | 20.91 | 22.5 | 21.79 | 21.62 | 21.43 | 21.98 |
| NCS | 12.20 | 12.08 | 11.65 | 12.63 | 12.04 | 12.24 | 11.82 | 12.45 |
| Avg. | 11.79 | 11.70 | 11.34 | 12.15* | 11.72 | 11.77 | 11.56 | 11.92 |
In order to evaluate the individual effect of four different code pre-processing operations and the effect of their combinations, we train and test the four models (CodeNN, Astattgru, Rencos, and NCS) under 16 different code pre-processing combinations. Note that the model Deepcom is not experimented as it does not use source code directly. In the following experiments, we have performed calculations on all metrics. Due to space limitation, we present the scores under BLEU-DC, which correlates more with human perception. All findings in the following sections still hold for other metrics, and the omitted results can be found in the online Appendix.
As shown in Table 8, for all models, performing (identifier splitting) is always better than not performing it, while it is unclear whether to perform the other three operations. Then, we conduct the two-sided t-test (Dowdy et al. 2011) and Wilcoxon-Mann-Whitney test (Mann and Whitney 1947) to statistically evaluate the difference between using or dropping each operation. The significance signs (*) labelled in Table 8 mean that the p-values of the statistical tests at 95% confidence level are less than 0.05. The results confirm that the improvement achieved by performing is statistically significant, while performing the other three operations does not lead to statistically different results1515 15 The detailed statistical test scores can be found in the online Appendix Tables 11 to 19. . As pointed out in (Karampatsis et al. 2020), the OOV (out of vocabulary) ratio is reduced after splitting compound words, and using subtokens allows a model to suggest neologisms, which are unseen in the training data. Many studies (Allamanis et al. 2016; Grave et al. 2017; Merity et al. 2017; Bazzi 2002; Luong et al. 2013) have shown that the performance of neural language models can be improved after handling the OOV problem. Similarly, the performance of code summarization is also improved after performing .
| Model | Ensemble | ||||||||||||||||
|---|---|---|---|---|---|---|---|---|---|---|---|---|---|---|---|---|---|
| CodeNN | 7.06 | 7.10 | 6.98 | 7.25 | 7.54 | 7.01 | 7.43 | 7.06 | 7.22 | 7.19 | 7.24 | 7.40 | 7.06 | 7.34 | 7.02 | 7.05 | 10.64 |
| Astattgru | 5.67 | 5.65 | 5.44 | 5.48 | 6.17 | 6.67 | 6.28 | 6.41 | 5.84 | 5.83 | 5.30 | 5.81 | 5.79 | 6.62 | 6.03 | 6.09 | 11.28 |
| Rencos | 20.21 | 20.35 | 21.28 | 21.01 | 21.52 | 23.37 | 22.25 | 22.45 | 20.91 | 20.96 | 21.20 | 21.33 | 21.42 | 24.21 | 22.62 | 22.15 | 24.21 |
| NCS | 11.22 | 11.95 | 11.12 | 12.07 | 12.06 | 13.30 | 12.12 | 12.82 | 11.87 | 11.51 | 11.78 | 11.64 | 12.34 | 13.67 | 12.09 | 12.67 | 19.90 |
Next, we evaluate the effect of different combinations of operations and show the result in Table 9. For each model, we mark the bottom 5 in underline, the top 5 in bold. We can find that:
- •
Different pre-processing operations can affect the overall performance by a noticeable margin.
- •
is a recommended code pre-processing method, as it is top 5 for all approaches. is the not-recommended code pre-processing method, as it is bottom 5 for all approaches.
- •
The ranking of performance for different models are generally consistent under different code pre-processing settings.
An exploration experiment From Table 9, we can see that there is no dominated pre-processing combination across these approaches. We conduct a simple exploratory experiment that aggregates four different pre-processing: , , , and , which mostly perform better than other combinations on the four approaches. We use the stacking-based technique (LeClair et al. 2021) (the online Appendix Figure 1) to aggregate the component models. In detail, ensemble components have the same network structure but the input data is processed by different pre-processing combinations. The result is shown in the last column of Table 9. We can see that in general, the ensemble model performs better than the single models, indicating that different pre-processing combinations may contain complementary information that can improve the final output through ensemble learning.
4.3. How Do Different Characteristics of Datasets Affect the Performance?(RQ3)
| Model | Dataset | ||
|---|---|---|---|
| TLC | FCM | CSN | |
| CodeNN | 28.240.19 | 12.640.13 | 3.320.09 |
| Deepcom | 15.652.12 | 9.120.03 | 1.980.30 |
| Astattgru | 25.900.79 | 15.580.11 | 5.010.27 |
| Rencos | 42.460.05* | 15.470.00 | 6.650.05 |
| NCS | 39.500.23 | 18.070.46* | 6.660.51 |
| Avg | 30.359.70 | 14.173.05 | 4.721.85 |
To answer RQ3, we evaluate the five approaches on the three base datasets: TLC, CSN, and FCM. From Table 10, we can find that:
- •
The performance of the same model is different on different datasets.
- •
The ranking among the approaches does not preserve when evaluating them on different datasets. For instance, Rencos outperforms other approaches in TLC but is worse than Astattgru and NCS in FCM. CodeNN performs better than Astattgru on TLC, but Astattgru outperforms CodeNN in the other two datasets.
- •
The average performance of all models on TLC is better than the other two datasets, although TLC is much smaller (about 96% less than FCM and 84% less than CSN).
- •
The average performance of FCM is better than that of CSN.
Since there are many factors that make the three datasets different, in order to further explore the reasons for the above results in-depth, we use the controlled variable method to study from three aspects: corpus sizes, data splitting ways, and duplication ratios.
4.3.1. The impact of different corpus sizes
We evaluate all models on two groups (one group contains CSNMethod-Medium and CSNMethod-Small, the other group contains FCMMethod-Large, FCMMethod-Medium and FCMMethod-Small). Within each group, the test sets are the same, the only difference is in the corpus size.
The results are shown in Table 11. We can find that the ranking between models can be generally preserved on different corpus sizes. Also, as the size of the training set becomes larger, the performance of the five approaches improves in both groups, which is consistent with the findings of previous work (Alon et al. 2019). We can also find that, compared to other models, the performance of Deepcom does not improve significantly when the size of the training set increases. We suspect that this is due to the high OOV ratio, which affects the scalability of the Deepcom model (Hellendoorn and Devanbu 2017; Karampatsis et al. 2020), as shown in the bottom of Table 11. Deepcom uses only SBT and represents an AST node as a concatenation of the type and value of the AST node, resulting in a sparse vocabulary. Therefore, even if the training set becomes larger, the OOV ratio is still high. Therefore, Deepcom could not fully leverage the larger datasets.
| Model | FCMMethod-Small | FCMMethod-Medium | FCMMethod-Large | CSNMethod-Small | CSNMethod-Medium |
| CodeNN | 10.370.17 | 14.760.17 | 18.680.26 | 5.200.01 | 12.710.23 |
| Deepcom | 8.990.06 | 10.870.20 | 11.650.36 | 7.570.74 | 7.851.07 |
| Astattgru | 12.860.64 | 18.150.05 | 21.730.11 | 5.890.12 | 15.830.17 |
| Rencos | 14.240.12 | 21.970.08 | 23.810.04 | 7.360.08 | 19.560.03 |
| NCS | 14.700.19 | 23.100.32* | 29.030.32* | 9.070.20* | 25.170.39* |
| OOV Ratio of Deepcom | 91.90% | 88.94% | 88.32% | 91.49% | 85.81% |
| OOV Ratio of Others | 63.36% | 53.09% | 48.60% | 60.99% | 34.00% |
4.3.2. The impact of different data splitting methods
In this experiment, we evaluate the five approaches on two groups (one group contains FCMProject-Large and FCMMethod-Large and another contains CSNProject-Medium, CSNClass-Medium, CSNMethod-Medium). Each group only differs in data splitting ways. From Table 12, we can observe that all approaches perform differently in different data splitting ways, and they all perform better on the dataset split by method than by project. This is because similar tokens and code patterns are used in the methods from the same project (Panthaplackel et al. 2020; LeClair and McMillan 2019; Liu et al. 2019). In addition, when the data splitting ways are different, the rankings between various approaches remain basically unchanged, which indicates that it would not impact comparison fairness across different approaches whether or not to consider multiple data splitting ways.
4.3.3. The impact of different duplication ratios
To simulate scenarios with different code duplication ratios, we construct synthetic test sets from TLCDedup by adding random samples from the training set to the test set. Then, we train the five models using the same training set and test them using the synthetic test sets with different duplication ratios (i.e., the test sets with random samples). From the results shown in Figure 3, we can find that:
- •
The BLEU scores of all approaches increase as the duplication ratio increases.
- •
The score of the model Rencos increases significantly when the duplication ratio increases. We speculate that the reason should be the duplicated samples being retrieved back by the retrieval module in Rencos. Therefore, retrieval-based models could benefit more from code duplication.
- •
In addition, the ranking of the models is not preserved with different duplication ratios. For instance, CodeNN outperforms Astattgru without duplication and is no better than Astattgru on other duplication ratios.
| Model | CSNProject-Medium | CSNClass-Medium | CSNMethod-Medium | FCMProject-Large | FCMMethod-Large |
|---|---|---|---|---|---|
| CodeNN | 3.320.09 | 9.570.15 | 12.710.23 | 12.640.13 | 18.680.26 |
| Deepcom | 1.980.30 | 6.140.12 | 7.851.07 | 9.120.03 | 11.650.36 |
| Astattgru | 6.863.07 | 11.720.41 | 15.830.17 | 15.580.11 | 21.730.11 |
| Rencos | 6.650.05 | 14.370.03 | 19.560.03 | 15.470.00 | 23.810.04 |
| NCS | 6.660.51 | 17.960.23* | 25.170.39* | 18.070.46* | 29.030.32* |
| OOV Ratio | 48.74% | 35.38% | 34.00% | 57.56% | 48.60% |
We observe that even when we control all three factors (splitting methods, duplication ratios, and dataset sizes), the performance of the same model still varies greatly between different datasets1616 16 The results are given in the online Appendix Tables 61 to 69 due to space limitation.. This indicates that the differences in training data may also be a factor that affects the performance of code summarization. We leave it to future work to study the impact of data differences.
5. Threats to Validity
We have identified the following main threats to validity:
Programming languages. We only conduct experiments on Java datasets. Although in principle, the models and experiments are not specifically designed for Java, more evaluations are needed when generalizing our findings to other languages. In the future, we will extend our study to other programming languages.
The quality of summaries. The summaries in all datasets are collected by extracting the first sentences of Javadoc. Although this is a common practice to place a method’s summary at the first sentence according to the Javadoc guidelines1717 17 http://www.oracle.com/technetwork/articles/java/index-137868.html, there might still be some incomplete or mismatched summaries in the datasets.
Models evaluated. We covered all representative models with different characteristics, such as Transformer-based and RNN-based models, single-channel and multi-channel models, models with and without retrieval techniques. However, other models that we are out of our study may still cause our findings to be untenable.
Human evaluation. We use two different ways (arithmetic and geometric average) to aggregate the sentence-level human scores as a corpus-level human score. The aggregation method may threaten our conclusion. We will explore other ways to assess corpus-level quality in human evaluation.
6. Related Work
Code summarization plays an important role in comprehension, reusing and maintenance of program. Some surveys (Nazar et al. 2016; Song et al. 2019; Zhu and Pan 2019) provided a taxonomy of code summarization methods and discussed the advantages, limitations, and challenges of existing models from a high-level perspective. Especially, Song et al. (Song et al. 2019) also provided a discussion of the evaluation techniques being used in existing methods. Gros et al. (Gros et al. 2020) described an analysis of several machine learning approaches originally designed for the task of natural language translation for the code summarization task. They also observed that different datasets were used in existing work and different metrics were used to evaluate different approaches. Allamanis et al. (Allamanis 2019) explored the effect of code duplication and concluded that the performance of the technique is sometimes overestimated when evaluated on the duplicated dataset. LeClair et al. (LeClair and McMillan 2019) conducted the experiment of a standard NMT algorithm from two aspects: splitting strategies (splitting the dataset by project or by method) and a clean approach, and proposed the guidelines for building datasets based on experiment results. Some studies (Stapleton et al. 2020; Roy et al. 2021) conducted a human study and concluded that BLEU is not correlated to human quality assessments when measuring one generated summary. Roy et al. (Roy et al. 2021) also re-assessed and interpreted other automatic metrics for code summarization. Our work differs from previous work in that we not only observe the inconsistent usage of different BLEU metrics but also conduct dozens of experiments on the five models and explicitly confirm that the inconsistent usage can cause severe problems in evaluating/comparing models. Besides, we perform a human evaluation to provide additional findings, e.g., which BLEU metrics correlate with human perception the most. Moreover, we explore factors affecting model evaluation, which have not been systematically studied before, such as dataset size, dataset split methods, code pre-processing operations, etc. Different from the surveys, we provide extensive experiments on various datasets for various findings and corresponding discussions. Finally, we consolidate all findings and propose actionable guidelines for evaluating code summarization models.
7. Conclusion
In this paper, we conduct an in-depth analysis of recent neural code summarization models. We have investigated several aspects of model evaluation: evaluation metrics, code pre-processing operations, and datasets. Our results point out that all these aspects have large impact on evaluation results. Without a carefully and systematically designed experiment, neural code summarization models cannot be fairly evaluated and compared. Our work also suggests some actionable guidelines including: (1) Reporting BLEU metrics explicitly (including sentence or corpus level, smoothing method, NLTK version, etc). BLEU-DC, which correlates more with human perception, can be selected as the evaluation metric. (2) Using proper (and maybe multiple) code pre-processing operations. (3) Considering the dataset characteristics when evaluating and choosing the best model. We build a shared code summarization toolbox containing the implementation of BLEU variants, code pre-processing operations, datasets, the implementation of baselines, and all experimental results. We believe the results and findings we obtained can be of great help for practitioners and researchers working on this interesting area.
For future work, we will extend our study to programming languages other than Java. We will design an automatic evaluation metric which is more correlated to human perception. We will also explore more attributes of datasets. Furthermore, we plan to extend the study to other text generation tasks in software engineering such as commit message generation.
To facilitate reproducibility, our code and data are available at https://github.com/DeepSoftwareAnalytics/CodeSumEvaluation.
8. Acknowledgement
We thank reviewers for their valuable comments on this work. This research was supported by National Key R&D Program of China (No.2017YFA0700800). We would like to thank Jiaqi Guo for his valuable suggestions and feedback. We also thank the participants of our human evaluation for their time.
References
- (1)
- Ahmad et al. (2020) Wasi Uddin Ahmad, Saikat Chakraborty, Baishakhi Ray, and Kai-Wei Chang. 2020. A Transformer-based Approach for Source Code Summarization. In ACL. Association for Computational Linguistics, 4998–5007.
- Allamanis (2019) Miltiadis Allamanis. 2019. The adverse effects of code duplication in machine learning models of code. In Onward! ACM, 143–153.
- Allamanis et al. (2016) Miltiadis Allamanis, Hao Peng, and Charles Sutton. 2016. A Convolutional Attention Network for Extreme Summarization of Source Code. In ICML (JMLR Workshop and Conference Proceedings, Vol. 48). JMLR.org, 2091–2100.
- Alon et al. (2019) Uri Alon, Shaked Brody, Omer Levy, and Eran Yahav. 2019. code2seq: Generating Sequences from Structured Representations of Code. In ICLR (Poster). OpenReview.net.
- Banerjee and Lavie (2005) Satanjeev Banerjee and Alon Lavie. 2005. METEOR: An Automatic Metric for MT Evaluation with Improved Correlation with Human Judgments. In IEEvaluation@ACL.
- Bansal et al. (2021) Aakash Bansal, Sakib Haque, and Collin McMillan. 2021. Project-Level Encoding for Neural Source Code Summarization of Subroutines. In ICPC.
- Bazzi (2002) Issam Bazzi. 2002. Modelling out-of-vocabulary words for robust speech recognition. Ph. D. Dissertation. Massachusetts Institute of Technology.
- Briand (2003) Lionel C. Briand. 2003. Software Documentation: How Much Is Enough?. In CSMR. IEEE Computer Society, 13.
- Cai et al. (2020) Ruichu Cai, Zhihao Liang, Boyan Xu, Zijian Li, Yuexing Hao, and Yao Chen. 2020. TAG: Type Auxiliary Guiding for Code Comment Generation. In ACL.
- Chen and Cherry (2014) Boxing Chen and Colin Cherry. 2014. A Systematic Comparison of Smoothing Techniques for Sentence-Level BLEU. In WMT@ACL. The Association for Computer Linguistics, 362–367.
- Chen and Zhou (2018) Qingying Chen and Minghui Zhou. 2018. A neural framework for retrieval and summarization of source code. In ASE. ACM, 826–831.
- Cloud (2007) Google Cloud. 2007. AutoML: Evaluating models. https://cloud.google.com/translate/automl/docs/evaluate#bleu
- Dowdy et al. (2011) Shirley Dowdy, Stanley Wearden, and Daniel Chilko. 2011. Statistics for research. Vol. 512. John Wiley & Sons.
- Eddy et al. (2013) Brian P. Eddy, Jeffrey A. Robinson, Nicholas A. Kraft, and Jeffrey C. Carver. 2013. Evaluating source code summarization techniques: Replication and expansion. In ICPC. IEEE Computer Society, 13–22.
- Feng et al. (2020) Zhangyin Feng, Daya Guo, Duyu Tang, Nan Duan, Xiaocheng Feng, Ming Gong, Linjun Shou, Bing Qin, Ting Liu, Daxin Jiang, and Ming Zhou. 2020. CodeBERT: A Pre-Trained Model for Programming and Natural Languages. In EMNLP (Findings) (Findings of ACL, Vol. EMNLP 2020). Association for Computational Linguistics, 1536–1547.
- Fernandes et al. (2019) Patrick Fernandes, Miltiadis Allamanis, and Marc Brockschmidt. 2019. Structured Neural Summarization. In ICLR.
- Forward and Lethbridge (2002) Andrew Forward and Timothy Lethbridge. 2002. The relevance of software documentation, tools and technologies: a survey. In ACM Symposium on Document Engineering. ACM, 26–33.
- Grave et al. (2017) Edouard Grave, Armand Joulin, and Nicolas Usunier. 2017. Improving Neural Language Models with a Continuous Cache. In ICLR (Poster). OpenReview.net.
- Gros et al. (2020) David Gros, Hariharan Sezhiyan, Prem Devanbu, and Zhou Yu. 2020. Code to Comment "Translation": Data, Metrics, Baselining & Evaluation. In ASE. IEEE, 746–757.
- Haiduc et al. (2010a) Sonia Haiduc, Jairo Aponte, and Andrian Marcus. 2010a. Supporting program comprehension with source code summarization. In ICSE, Vol. 2. ACM, 223–226.
- Haiduc et al. (2010b) Sonia Haiduc, Jairo Aponte, Laura Moreno, and Andrian Marcus. 2010b. On the Use of Automated Text Summarization Techniques for Summarizing Source Code. In WCRE. IEEE Computer Society, 35–44.
- Haque et al. (2020) Sakib Haque, Alexander LeClair, Lingfei Wu, and Collin McMillan. 2020. Improved automatic summarization of subroutines via attention to file context. In MSR.
- Hayes and Krippendorff (2007) Andrew F Hayes and Klaus Krippendorff. 2007. Answering the call for a standard reliability measure for coding data. Communication methods and measures 1, 1 (2007), 77–89.
- Hellendoorn and Devanbu (2017) Vincent J. Hellendoorn and Premkumar T. Devanbu. 2017. Are deep neural networks the best choice for modeling source code?. In ESEC/SIGSOFT FSE. ACM, 763–773.
- Hu et al. (2018a) Xing Hu, Ge Li, Xin Xia, David Lo, and Zhi Jin. 2018a. Deep code comment generation. In ICPC. ACM, 200–210.
- Hu et al. (2020) Xing Hu, Ge Li, Xin Xia, David Lo, and Zhi Jin. 2020. Deep code comment generation with hybrid lexical and syntactical information. Empir. Softw. Eng. 25, 3 (2020), 2179–2217.
- Hu et al. (2018b) Xing Hu, Ge Li, Xin Xia, David Lo, Shuai Lu, and Zhi Jin. 2018b. Summarizing Source Code with Transferred API Knowledge. In IJCAI. ijcai.org, 2269–2275.
- Husain et al. (2019) Hamel Husain, Ho-Hsiang Wu, Tiferet Gazit, Miltiadis Allamanis, and Marc Brockschmidt. 2019. CodeSearchNet Challenge: Evaluating the State of Semantic Code Search. arXiv Preprint (2019). https://arxiv.org/abs/1909.09436
- Iyer et al. (2016) Srinivasan Iyer, Ioannis Konstas, Alvin Cheung, and Luke Zettlemoyer. 2016. Summarizing Source Code using a Neural Attention Model. In ACL (1). The Association for Computer Linguistics.
- Karampatsis et al. (2020) Rafael-Michael Karampatsis, Hlib Babii, Romain Robbes, Charles Sutton, and Andrea Janes. 2020. Big code != big vocabulary: open-vocabulary models for sfBLEUzource code. In ICSE. ACM, 1073–1085.
- Kendall (1945) Maurice G Kendall. 1945. The treatment of ties in ranking problems. Biometrika 33, 3 (1945), 239–251.
- LeClair et al. (2021) Alexander LeClair, Aakash Bansal, and Collin McMillan. 2021. Ensemble Models for Neural Source Code Summarization of Subroutines. CoRR abs/2107.11423 (2021).
- LeClair et al. (2020) Alexander LeClair, Sakib Haque, Lingfei Wu, and Collin McMillan. 2020. Improved Code Summarization via a Graph Neural Network. In ICPC. ACM, 184–195.
- LeClair et al. (2019) Alexander LeClair, Siyuan Jiang, and Collin McMillan. 2019. A neural model for generating natural language summaries of program subroutines. In ICSE. IEEE / ACM, 795–806.
- LeClair and McMillan (2019) Alexander LeClair and Collin McMillan. 2019. Recommendations for datasets for source code summarization. In NAACL.
- Lin (2004) Chin-Yew Lin. 2004. ROUGE: A Package for Automatic Evaluation of Summaries. In ACL.
- Lin et al. (2021) Chen Lin, Zhichao Ouyang, Junqing Zhuang, Jianqiang Chen, Hui Li, and Rongxin Wu. 2021. Improving Code Summarization with Block-wise Abstract Syntax Tree Splitting. In ICPC.
- Liu et al. (2019) Shangqing Liu, Cuiyun Gao, Sen Chen, Lun Yiu Nie, and Yang Liu. 2019. ATOM: Commit Message Generation Based on Abstract Syntax Tree and Hybrid Ranking. arXiv (2019).
- Lopes et al. (2017) Cristina V Lopes, Petr Maj, Pedro Martins, Vaibhav Saini, Di Yang, Jakub Zitny, Hitesh Sajnani, and Jan Vitek. 2017. DéjàVu: a map of code duplicates on GitHub. In OOPSLA.
- Luong et al. (2013) Thang Luong, Richard Socher, and Christopher D. Manning. 2013. Better Word Representations with Recursive Neural Networks for Morphology. In CoNLL. ACL, 104–113.
- Ma et al. (2019) Qingsong Ma, Johnny Wei, Ondrej Bojar, and Yvette Graham. 2019. Results of the WMT19 Metrics Shared Task: Segment-Level and Strong MT Systems Pose Big Challenges. In WMT (2). Association for Computational Linguistics, 62–90.
- Mann and Whitney (1947) H. B. Mann and D. R. Whitney. 1947. On a Test of Whether one of Two Random Variables is Stochastically Larger than the Other. The Annals of Mathematical Statistics 18, 1 (1947), 50 – 60. https://doi.org/10.1214/aoms/1177730491
- Merity et al. (2017) Stephen Merity, Caiming Xiong, James Bradbury, and Richard Socher. 2017. Pointer Sentinel Mixture Models. In ICLR (Poster). OpenReview.net.
- Mockus (2007) Audris Mockus. 2007. Large-scale code reuse in open source software. In First International Workshop on Emerging Trends in FLOSS Research and Development (FLOSS’07: ICSE Workshops 2007). IEEE, 7–7.
- Moreno et al. (2013) Laura Moreno, Jairo Aponte, Giriprasad Sridhara, Andrian Marcus, Lori L. Pollock, and K. Vijay-Shanker. 2013. Automatic generation of natural language summaries for Java classes. In ICPC. IEEE Computer Society, 23–32.
- Nazar et al. (2016) Najam Nazar, Yan Hu, and He Jiang. 2016. Summarizing software artifacts: A literature review. Journal of Computer Science and Technology 31, 5 (2016), 883–909.
- Panthaplackel et al. (2021) Sheena Panthaplackel, Junyi Jessy Li, Milos Gligoric, and Raymond J. Mooney. 2021. Deep Just-In-Time Inconsistency Detection Between Comments and Source Code. In AAAI. AAAI Press, 427–435.
- Panthaplackel et al. (2020) Sheena Panthaplackel, Pengyu Nie, Milos Gligoric, Junyi Jessy Li, and Raymond J. Mooney. 2020. Learning to Update Natural Language Comments Based on Code Changes. In ACL. Association for Computational Linguistics, 1853–1868.
- Papineni et al. (2002) Kishore Papineni, Salim Roukos, Todd Ward, and Wei-Jing Zhu. 2002. Bleu: a Method for Automatic Evaluation of Machine Translation. In ACL. ACL, 311–318.
- Post (2018) Matt Post. 2018. A Call for Clarity in Reporting BLEU Scores. In WMT. Association for Computational Linguistics, 186–191.
- Rodeghero et al. (2014) Paige Rodeghero, Collin McMillan, Paul W. McBurney, Nigel Bosch, and Sidney K. D’Mello. 2014. Improving automated source code summarization via an eye-tracking study of programmers. In ICSE. ACM, 390–401.
- Roy et al. (2021) Devjeet Roy, Sarah Fakhoury, and Venera Arnaoudova. 2021. Reassessing automatic evaluation metrics for code summarization tasks. In ESEC/SIGSOFT FSE. ACM, 1105–1116.
- See et al. (2017) Abigail See, Peter J. Liu, and Christopher D. Manning. 2017. Get To The Point: Summarization with Pointer-Generator Networks. In ACL (1). Association for Computational Linguistics, 1073–1083.
- Shi et al. (2021) Ensheng Shi, Yanlin Wang, Lun Du, Hongyu Zhang, Shi Han, Dongmei Zhang, and Hongbin Sun. 2021. CAST: Enhancing Code Summarization with Hierarchical Splitting and Reconstruction of Abstract Syntax Trees. In EMNLP (1). Association for Computational Linguistics, 4053–4062.
- Song et al. (2019) Xiaotao Song, Hailong Sun, Xu Wang, and Jiafei Yan. 2019. A survey of automatic generation of source code comments: Algorithms and techniques. IEEE Access 7 (2019), 111411–111428.
- Sridhara et al. (2010) Giriprasad Sridhara, Emily Hill, Divya Muppaneni, Lori L. Pollock, and K. Vijay-Shanker. 2010. Towards automatically generating summary comments for Java methods. In ASE. ACM, 43–52.
- Stapleton et al. (2020) Sean Stapleton, Yashmeet Gambhir, Alexander LeClair, Zachary Eberhart, Westley Weimer, Kevin Leach, and Yu Huang. 2020. A Human Study of Comprehension and Code Summarization. In ICPC. ACM, 2–13.
- Tao et al. (2021) Wei Tao, Yanlin Wang, Ensheng Shi, Lun Du, Shi Han, Hongyu Zhang, Dongmei Zhang, and Wenqiang Zhang. 2021. On the Evaluation of Commit Message Generation Models: An Experimental Study. CoRR abs/2107.05373 (2021).
- Tilley et al. (1992) Scott R. Tilley, Hausi A. Müller, and Mehmet A. Orgun. 1992. Documenting software systems with views. In SIGDOC. ACM, 211–219.
- Vedantam et al. (2015) Ramakrishna Vedantam, C. Lawrence Zitnick, and Devi Parikh. 2015. CIDEr: Consensus-based image description evaluation. In CVPR.
- Wan et al. (2018) Yao Wan, Zhou Zhao, Min Yang, Guandong Xu, Haochao Ying, Jian Wu, and Philip S. Yu. 2018. Improving automatic source code summarization via deep reinforcement learning. In ASE. ACM, 397–407.
- Wang et al. (2020) Wenhua Wang, Yuqun Zhang, Yulei Sui, Yao Wan, Zhou Zhao, Jian Wu, Philip Yu, and Guandong Xu. 2020. Reinforcement-learning-guided source code summarization via hierarchical attention. IEEE Transactions on Software Engineering (2020).
- Wang et al. (2021) Yanlin Wang, Ensheng Shi, Lun Du, Xiaodi Yang, Yuxuan Hu, Shi Han, Hongyu Zhang, and Dongmei Zhang. 2021. CoCoSum: Contextual Code Summarization with Multi-Relational Graph Neural Network. CoRR abs/2107.01933 (2021).
- Wei et al. (2019) Bolin Wei, Ge Li, Xin Xia, Zhiyi Fu, and Zhi Jin. 2019. Code Generation as a Dual Task of Code Summarization. In NeurIPS. 6559–6569.
- Wei et al. (2020) Bolin Wei, Yongmin Li, Ge Li, Xin Xia, and Zhi Jin. 2020. Retrieve and Refine: Exemplar-based Neural Comment Generation. In ASE. IEEE, 349–360.
- Wu et al. (2021) Hongqiu Wu, Hai Zhao, and Min Zhang. 2021. Code Summarization with Structure-induced Transformer. In ACL/IJCNLP (Findings). Association for Computational Linguistics, 1078–1090.
- Xie et al. (2021) Rui Xie, Wei Ye, Jinan Sun, and Shikun Zhang. 2021. Exploiting Method Names to Improve Code Summarization: A Deliberation Multi-Task Learning Approach. In ICPC.
- Ye et al. (2020) Wei Ye, Rui Xie, Jinglei Zhang, Tianxiang Hu, Xiaoyin Wang, and Shikun Zhang. 2020. Leveraging code generation to improve code retrieval and summarization via dual learning. In The Web Conference.
- Zhang et al. (2020) Jian Zhang, Xu Wang, Hongyu Zhang, Hailong Sun, and Xudong Liu. 2020. Retrieval-based neural source code summarization. In ICSE. ACM, 1385–1397.
- Zhang et al. (2019) Jian Zhang, Xu Wang, Hongyu Zhang, Hailong Sun, Kaixuan Wang, and Xudong Liu. 2019. A novel neural source code representation based on abstract syntax tree. In ICSE. IEEE / ACM, 783–794.
- Zhu and Pan (2019) Yuxiang Zhu and Minxue Pan. 2019. Automatic Code Summarization: A Systematic Literature Review. arXiv preprint arXiv:1909.04352 (2019).
- Ziegel (2001) Eric R Ziegel. 2001. Standard probability and statistics tables and formulae. Technometrics 43, 2 (2001), 249.