A study of outer disk stellar populations of face-on star-forming galaxies in SDSS-IV MaNGA: causes of H deficiency
Abstract
Integral field unit (IFU) spectra of face-on star-forming galaxies from the MaNGA survey are stacked in radial bins so as to reach a S/N high enough to measure emission lines and Lick indices out to 2.5-3 Re. Two thirds of galaxies have stellar populations in the outer disks that are older, more metal poor and less dusty than in the inner disks. Recent bursts of star formation have occurred more frequently in the outer disk, but extinction-corrected H equivalent widths are significantly lower at fixed Dn(4000) in these regions. I examine the properties of a subset of galaxies with the the most H deficient outer disks. These regions contain young stellar populations that must have formed within the last 0.5 Gyr, but extinction-corrected H values well below the values predicted for a standard Kroupa IMF. The H deficient galaxies have flat Dn(4000) and H profiles with little radial fluctuation, indicating that star formation has occurred extremely uniformly across the entire disk. The H line profiles indicate that the ionized gas kinematics is also very regular across the disk. The main clue to the origin of the H deficiency is that it sets in at the same radius where the dust extinction abruptly decreases, suggesting a mode of star formation deficient in massive stars in quiescent, HI-dominated gas. Finally, I have carried out a search for galaxies with signatures of unusual H kinematics and find that 15% of the sample exhibit evidence for significant ionized gas that is displaced from the systemic velocity of the disk.
Keywords:
galaxies: star formation, galaxies: stellar content, galaxies:disc, galaxies:ISM1 Introduction
The far outskirts of nearby star-forming spiral and irregular galaxies are of considerable interest because they are hypothesized to be still in the process of assembly through the infall of gas and accretion of satellite systems at the present day (Kauffmann 1996; Chiappini et al 1997; Boissier & Prantzos 1999; Fu et al 2010). Many observational studies have focused on whether the luminosity and/or stellar mass profiles of disk galaxies deviate from a pure exponential in the outer disk (Van der Kruit 2001; Pohlen & Trujillo 2006), and whether radial gradients in mean stellar age and metallicity also show clear breaks or discontinuities near the edge of the disk (Bakos et al 2008, Yoachim et al 2012, Zheng et al 2015, Ruiz-Lara et al 2016). At least some part of this phenomenology is currently believed to be result of the redistribution of evolved stars in the disk through secular processes. Stars that were formed at one location migrate radially through the disk when they are perturbed from their orbits by disk spiral structures or by bar instabilities (Roskar et al 2008).
The study of young stars and HII regions in outer disks has been another active avenue of observational research. The launch of the GALEX satellite enabled a systematic study of so-called extended ultra-violet (XUV) disks in the local Universe (Gil de Paz et al 2007, Thilker et al 2007). The XUV terminology first arose because it was noticed that the amount and spatial extent of star formation in the outskirts of a galaxy can be underestimated by looking for HII regions alone (as traced by H emission). In the prototype XUV galaxy M83, UV-bright stellar complexes are found extending out to about 4 times the radius at which the majority of HII regions are detected (Thilker et al 2005).
The physical explanation for the mismatch between the population of young stars traced by H and UV observations has been the subject of considerable controversy. In a classic paper, Martin & Kennicutt (2001) presented an atlas of H images of 32 nearby spiral galaxies with well-measured rotation HI and H2 (as traced by CO) surface density profiles, and had identified prominent breaks in their H surface brightness profiles, confirming previous claims of clear star formation thresholds in disk galaxies. They also showed that the outer threshold radii were in general agreement with those expected from the Toomre Q stability criterion. The discovery of the XUV disk phenomenon led to considerable speculation that there might be two modes of star formation in disk galaxies – a high efficiency mode corresponding to the gravitationally unstable inner regions of disks and a low efficiency mode in the far outskirts (Thilker et al 2007).
The existence of high and low efficiency modes of star formation is now well established thanks to well-resolved and deeper HI and CO data obtained for samples of a few dozen nearby spiral galaxies (Bigiel et al 2008, 2010). In the inner disks, the bulk of the gas is in the molecular phase and there is a simple linear relation between star formation rate surface density and molecular gas surface density. In the outer disk regions, the molecular fraction drops dramatically and CO is often undetectable for individual galaxies. Schruba et al (2010) stacked CO line observations in the outer regions of multiple disk galaxies and found that the same molecular gas-based star formation law could be extended down to very low densities, with no evidence for a sharp truncation or threshold in star formation, as proposed by Martin & Kennicutt (2010). In this work, star formation rates were derived using a combination of H, far-UV, and Infrared (IR) emission at 24 and 70 m with standard assumptions about the form of the stellar initial mass function (IMF). The question of whether there was any discrepancy between star formation traced by H and star formation traced by UV was laid aside.
The so-called H deficiency problem has, nevertheless, remained the subject of ongoing investigation and controversy (see Elmegreen 2017 for a review). It has been argued that the decline in H/FUV ratio with radius reflects a systematic change in the initial mass function of stars in disks (Meurer et al 2009, Bruzzese et al 2015). However, these inferences have been criticized as being on shaky grounds for a number of reasons: 1) stochastic sampling issues caused by the fact that the most massive stars are rare compared to less massive stars leading to significant degeneracies between star formation history IMF (Fumagalli et al 2011), 2) the fact that a significant component of the H emission may be in diffuse form and be missed in some studies (Hunter et al 2011, Lee et al 2011), 3) possible loss of ionizing photons from the galaxy in their very low density outer regions.
The most recent work on this topic has made use of star counts derived from HST imaging of main sequence and red giant branch stars in the outer disk of M83 to simultaneously constrain the slope and the upper mass cutoff of the IMF (Bruzzese et al 2020). Averaged over the 4 HST fields that were available for this galaxy, the main sequence luminosity function provides some evidence for an IMF deficient in the most massive stars. Together with the H data, the observations yield evidence for an IMF with an upper mass cutoff of 20 M⊙ compared to values in normal star-forming regions.
In this paper, I analyze outer disk stellar populations for a sample of 126 galaxies with stellar masses in the range with face-on orientation and with IFU data from the Mapping Nearby Galaxies at APO (MaNGA) survey that extend out to at least 2.5 . Face-on galaxies are chosen so as to minimize dust extinction effects. To ensure high enough to measure key emission lines and stellar absorption features in the low surface brightness outer regions of the galaxy, I create stacked spectra with fixed in increasing bins of from the centre of each galaxy to its outskirts. In comparison to previous work, the analysis of stacked spectra has the advantage that it does not exclude diffuse emission from lower surface brightness regions of the disk and that it averages over localized fluctuations in recent star formation. The analysis also accounts for the effects of dust by making use of narrow indices such as the 4000 Å break instead of FUV luminosity. Because the spectra are of high enough to measure the Balmer decrement, the H fluxes can also be corrected for dust extinction. The stacked spectra also have high enough to measure a variety of additional properties of the ionized gas and stars, such as metallicity, ionization parameter, and emission line shapes that probe gas kinematics. Finally, the analysis is carried out for a sample that is large enough to examine whether there are systematic trends as a function of galaxy mass, morphological type or global colour.
The paper is organized as follows. Section 2 provides a summary of the data set and the spectral analysis methodology. Section 3.1 examines how a variety of spectral properties change between two ranges in radii: and . This section examines trends both in individual spectral properties and in correlations between different properties. In Section 3.2, a subsample of H deficient outer disks is selected and stellar population synthesis models are employed to place constraints on both star formation history and IMF. In Section 3.3, I return to the question of outer disks with evidence for irregularities in gas kinematics, presenting a number of interesting cases and discusses prospects for larger samples. Section 4 contains a summary of the main results in the paper.
2 The galaxy sample and spectral analysis methods
The sample of galaxies is drawn from the 15th data release (DR15) of the Sloan Digital Sky Survey’s MaNGA project (Bundy et al 2015), which is part of the Sloan Digital Sky Survey IV programme (SDSS-IV; Blanton et al. 2017). DR15 includes data for 4,621 unique galaxies. Stellar masses and structural parameters such as position angles, ellipticities, and half-light radii for all galaxies in the MaNGA sample are available from the MaNGA drpall file; in all cases, the structural parameters are obtained from the SDSS elliptical Petrosian apertures. All galaxies with ellipticity parameter greater than 0.75, half-light radii greater than 2 arcseconds and NUV-r colour less than 4.0 are selected. The NUV-r colour cut ensures that only galaxies with ongoing star formation are included in the sample. The cut on galaxies with near face-on inclination helps to minimize dust obscuration of young stellar populations in the outer disks. The cuts yield a sample of 987 galaxies. The SDSS images of all these galaxies were inspected by eye to find galaxies where the IFU coverage extends beyond the high surface brightness optical disk, yielding a sample of 366 galaxies. The average half-light radius of the galaxies in the sample is 3.8 arcsec and the average redshift is 0.054. The MaNGA fibre diameter on the sky (including fibre cladding) is 2 arcseconds, corresponding to a physical size of 2.1 kpc. The number of spaxels interior to the half-light radius is thus very limited for the galaxies under study and our analysis will be confined to spaxels with .
The available spectroscopic data consists of the raw data from the first three years of the survey, the intermediate/final data reduction pipeline (DRP; Law et al 2016) products, and the first release of derived data products from the data analysis pipeline (DAP; Westfall et al. 2019; Belfiore et al. 2019). The spectra cover the wavelength range 360-1000 nm at a resolution resolution . The analysis begins with the model LOGCUBE files, which provide the binned spectra and the best-fitting model spectrum for each spectrum that was successfully fit. For DR15, two kinds of LOGCUBE files have been made available, VOR10-GAU-MILESHC and HYB10-GAUMILESHC. Only the binning approach differs between the two, and is differentiated by whether or not the main analysis steps are performed on binned spectra or individual spaxels. The analysis in this paper uses spectra contained in the HYB10-GAUMILESHC files, which pertain to individual spaxels. First, all the spectra are arranged in increasing order of radial distance from the centre of the galaxy. Successive spectra are combined until an average signal-to-noise per wavelength element of 50 is reached, averaged over the wavelength range 4500-6000 Å. For each galaxy, there are typically between 10 and 20 stacked spectra in the radial range 1-3
The stellar continuum fitting procedure is documented in detail in Kauffmann & Maraston (2019,KM19) and is based on the algorithm described in Wilkinson et al (2017). The main change made to the procedure described in KM19 is that instead of fitting combinations of single stellar populations (SSPs), I have generated a spectral library stellar components consisting of smoothly varying star formation histories with form , where is the time when star formation commences and varies over the range 1-12 Gyr after the Big Bang (for standard cosmological parameters where the age of the Universe is yr). is a time constant that varies from 0 (constant star formation rate) to -2. The metallicity of each stellar component varies over the range from 0.01 solar to solar. Finally, as in KM19, the two parameter dust extinction model of Wild (2007) is applied to each component. This has the form:
| (1) |
spans the range from 0 to 1 and varies from 0 to 3.
The continuum fitting is only applied to the stacked spectra at radii greater than 1 from the centre of the galaxy, where the assumption of a superposition of smooth star formation histories should be a better prior than a superposition of single stellar populations. In practice, the fitting procedure usually converges to very close to its final form in the first or second iteration. The addition of additional stellar components can improve the fit, but these components often only contribute at the few percent level. The most common additional component that needs to be added is a short duration episode of recent star formation. This will be discussed in more detail in the next section.
In Figures 1 and 2, I show example outer disk stacked spectra over the wavelength range from 3600 to 7000 Å. Figure 1 shows a stacked spectrum at and Figure 2 shows a spectrum at . Cyan shading indicates 1 measurement errors and the red curves show the stellar continuum fits. The main emission lines are also marked in the figures.


The best-fit continuum model is then subtracted and single Gaussian line fitting is carried out for the emission lines [OII]3726,3728, [NeIII]3869, H4102, H4340, [OIII]4363, [HeII]4686, H4861, [OIII]4959,[OIII]5007, [OI]6300, H6563, [NII]6583 and [SII]6716,6731
In the far outer disks, the strongest emission line is usually H6563. Possible deviations from a simple single Gaussian line shape are characterized by measuring the difference between the summed flux between 6543 and 6563 Å (after subtracting the best-fit stellar continuum model) and half the summed flux predicted by the single Gaussian line fit. The comparison is made on the bluewards side of the line centroid so as to avoid any confusion with [NII]6583. I define an asymmetry index as
| (2) |
where EQW H is the equivalent width calculated from the summed flux and GEWQ H is calculated from the half-Gaussian.
Finally, the best-fit Gaussian line profiles are subtracted from the stacked spectra, and the following stellar absorption line indices are measured: Dn(4000), the narrow version of the 4000 Å break strength defined in Balogh et al (1999), and the Lick indices H, Mgb, Fe5270 and Fe5335. As discussed in Kauffmann et al (2003), the location within the plane of H versus Dn(4000) is a useful diagnostic of whether recent star formation has occurred in a continuous manner or in short bursts or episodes. The other three indices form part of a composite Mg+Fe index, which is sensitive to metallicity (i.e. the fraction by mass of all elements heavier than helium over the gas mass) but shows little sensitivity to /Fe (i.e. the ratio of the total mass of elements to the mass of iron). In this paper, the index [MgFe]= proposed by Thomas et al (2003) will be used as a stellar metallicity indicator.
3 Results
The analysis in this paper follows the same basic route as the one in a companion paper on the stellar populations in the central regions of nearby galaxies (Kauffmann 2021, submitted). I first look at the differences between the stellar populations in the inner disk () and the outer disk () for the sample as a whole. One of the main results is that outer disks are offset from inner disks in the relation between extinction corrected H equivalent width and Dn(4000). I then focus on a subclass of the most H deficient objects where the relation between H equivalent width and Dn(4000) deviates strongly from the Kroupa (2001) IMF predictions and look at their properties in more detail. The main advantage over previous work is that the analysis in this paper makes use of results for stacked spectra, and stellar population properties are thus smoothed over much larger areas of the galaxy. Note that outer disks contain much less dust than the central regions of star-forming bulges, making uncertainties in fitting stellar population models to the data less of a concern. Only galaxies with 3 or more stacked spectra in the radial range 2-3 are included in the analysis. There are a total of 65 galaxies with stellar masses in the range and 63 galaxies in the range .
3.1 Stellar populations in the inner and outer disk
Figure 3 shows differences between a variety of different properties of the stellar populations and ionized gas in the outer and the inner regions of the disk for galaxies in the sample with stellar masses in the range . The outer region is defined to be located between 2 and 3 R50, where R50 is the elliptical aperture half-light radius of the galaxy listed in the MaNGA drpall file, while the inner region is defined to be located between 1 and 2 R50. The difference is defined by subtracting the inner value from the outer value, so that if the outer value is larger, is positive. In the figure, is plotted as a function of the stellar mass of each galaxy.
It is important to understand the extent to which the measured differences reflect true gradients in physical conditions within the disk, or whether they are dominated by measurement errors in the line indices and emission line fluxes and equivalent widths. The errors on the inner and outer disk measurements are estimated from the variance between the measurements for individual stacked spectra that fall within each radial range. This takes into account not only the uncertainties due to measurement errors, but also real variations in physical conditions within the disk. The average error on is indicated in each panel in Figure 3 by a blue error bar. measurements that are larger than the estimated error are coloured in magenta. The two numbers listed in each panel are the number of magenta points with positive/negative values, i.e. with higher/lower values of the quantity in the outer disk compared to the inner disk.
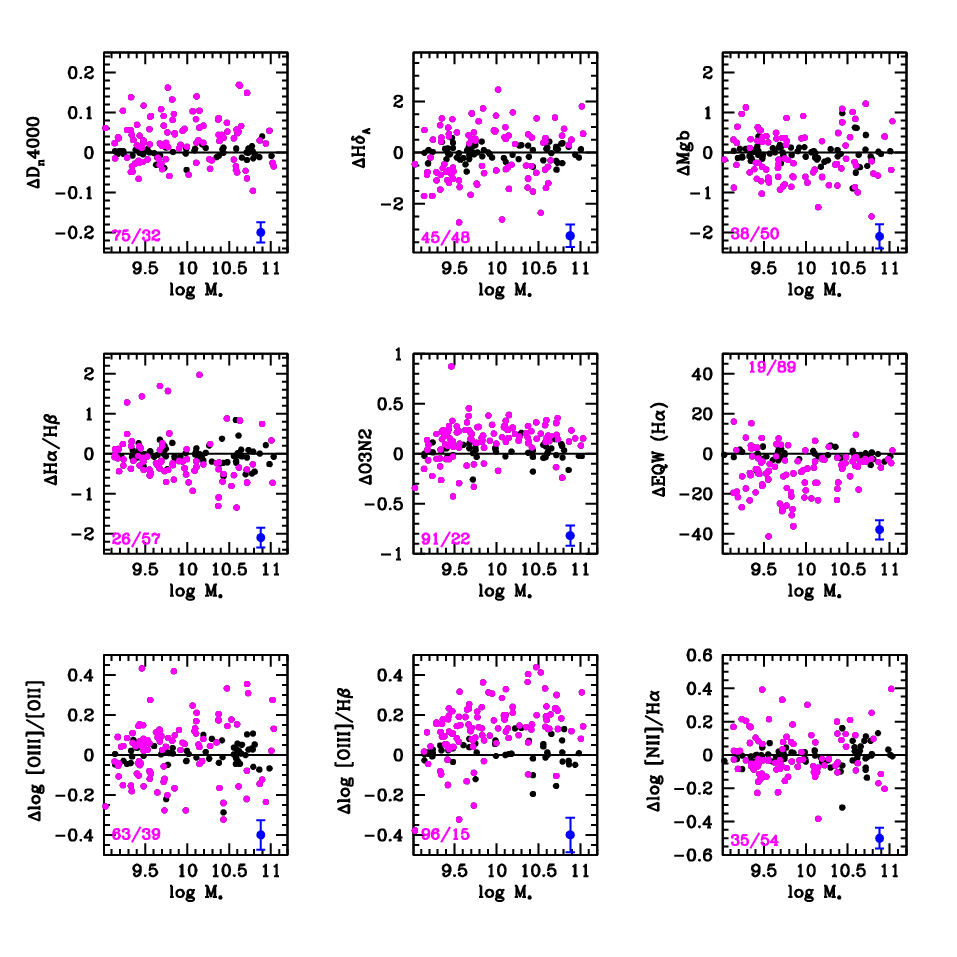
I now discuss the main findings. The first panel shows that outer disks have larger values of Dn(4000) than inner disks on average. This is in accord with previous studies of radial colour gradients in large sample of galaxies, which find that the upturn towards redder colours usually occurs at radii greater than 2 (Zheng et al 2015). An upturn in colour could be caused by either an increase in age, in metallicity or in dust content at the outskirts of the galaxy. The fact that Mgb and H/H are on average lower in the outer disk (panels 3 and 4) demonstrates that stellar metallicity and dust content decrease in the outer disk, and that the redder outer colours reflect the presence of older stars. These results are in qualitative agreement with a study of radial age and metallicity gradients in nearby galaxies using IFU spectroscopic data from the CALIFA survey (González Delgado et al 2015), which show that the average age gradient flattens considerably in the outer disk for later type galaxies in contrast to the stellar metallicities, which decrease smoothly with radius.
Panel 5 shows the O3N2 emission line index, introduced by Alloin et al (1979), and defined as
| (3) |
One popular calibration (among many) that relates the oxygen abundance and the O3N2 index with a simple linear regression has been proposed by Pettini & Pagel (2004) where . In this paper I will only use the O3N2 indicator as a way of comparing the ionized gas metallicities in a relative rather than absolute sense.
The results in panel 5 show that the metallicity of the ionized gas is almost always lower in the outer disk than in the inner disk. Panel 7 shows the ionization parameter, defined as the ratio of the [OIII] line luminosity to the [OII] line luminosity. Outer disks have higher ionization parameter. The results shown in panels 8 and 9 for the line rations [OIII]/H and [NII]/H confirm these findings – the [OIII]/H rato has the largest outer-inner disk differences because it is sensitive to both betallicity band ionization. The radial trends found here for ionization parameter and gas-phase metallicity agree well with the analysis of the CALIFA galaxy sample by Rodriguez-Baras et al (2018).
Panel 6 compares H equivalent widths in the inner and outer disks. No dust correction has been applied. H equivalent widths are lower in outer disks compared to inner disks for 82% of the galaxies in the sample. This number is roughly consistent with the 70% of galaxies that show higher values of Dn(4000) in the outer disk (panel 1). The H luminosity can also be corrected for extinction using the formula , where is assumed, together with the Calzetti (2001) extinction curve. Applying dust corrections does not change the conclusions, it just increases the difference between the inner and outer disk values.
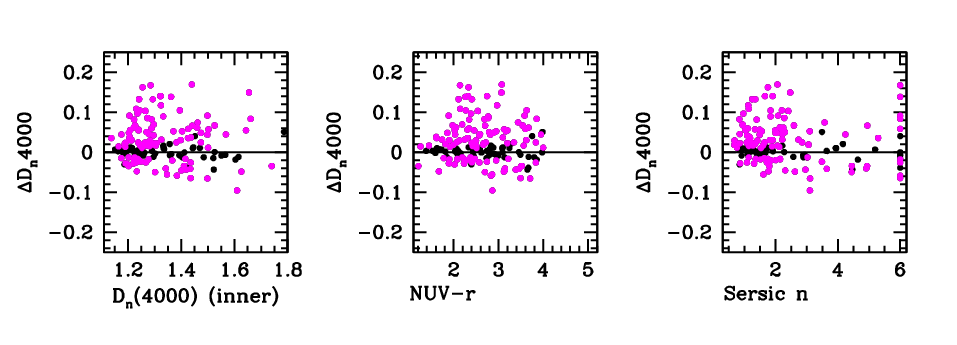
In Figure 3, I have plotted differences between outer and inner disk quantities as a function of the stellar mass of each galaxy. The trends are qualitatively similar across the entire mass range . More massive galaxies have smaller outer disk differences in H equivalent width and larger differences in ionization parameter and extinction. In Figure 4, I explore how outer-inner differences in the two stellar age parameters Dn(4000) and EQW H depend on the age of the disk, parametrized by the value of Dn(4000) in the inner disk and the global NUV-r colour of the galaxy (panels 1 and 2), as well as the Sersic index from a 2 dimensional fit to the luminosity profile of the galaxy. This figure shows that the bluest galaxies (Dn(4000) and NUV-r) have the smallest differences. Galaxies with intermediate morphological type (n=3-5) also have smaller outer disk differences than very late-type and very early-type galaxies.
I now move on to the correlations between different spectral quantities and analyze whether they differ systematically between the inner and outer regions of galaxies. Kauffmann (2021,submitted) showed that the extinction corrected H equivalent width in the centres of galaxies measured at a fixed value of Dn(4000) were boosted on average in the centres of galaxies compared to their disk regions. In a subset of galaxies where the boost factor was very large, clear Wolf-Rayet signatures were often found in conjunction with he very high H equivalent width values, giving credence to the hypothesis that that an excess of young, high mass stars is found in the central regions of these systems.
Figure 5 shows the relations between H and Dn(4000) (panel 1), uncorrected H equivalent width versus Dn(4000) (panel 2), extinction corrected H equivalent width versus Dn(4000) (panel 3) and extinction corrected H equivalent width versus (panel 4). The red points show individual stacked spectra measurements from inner disk regions (), while blue points show results from the outer regions (). The red and blue lines show the median of the distributions for red and blue plotted points. The median is evaluated by arranging the measurements in ascending order along the x-axis and evaluating the median in bins containing a fixed number of galaxies, so that the up-and-down fluctuations can be read as errors. As can be seen in panel 1, the median relation between and Dn(4000) is the same in the inner and the outer disk. There are, however, indications that the scatter in H at fixed Dn(4000) is larger in the outer disk compared to the inner disk. Because each spectrum in binned to fixed signal-to-noise, the increase in scatter is likely an indication that that star formation histories in the outer disks of galaxies have been characterized by more bursts over the past 1-2 Gyr.
The best-fit star formation histories described in section 2 can be used to quantify this in more detail. Many of the the stacked spectra require more than one exponential to produce a converged fit. In order to parameterize the star formation histories of all of the galaxies in a uniform way, I combine the exponentials and calculate the following quantities: 1) tlookback(90%), the look-back time to the epoch before 90% of the stars were formed, 2) tlookback(50%), the look-back time to the epoch when half the stars were formed, 3) tlookback(25%), the look-back time to when the first quarter of the stars were formed. (3) is a diagnostic of whether there was a recent burst of star formation, (1) is a diagnostic of the time of the onset of star formation, and (2) is a diagnostic of the median time of star formation.
Figure 6 shows histograms of these three quantities for the inner disks (red) and outer disks (blue). The first panel shows that tlookback(25%) is more frequently a Gyr or less in the outer disk than in the inner disk, confirming an excess population of outer disks with recent bursts of star formation. The biggest differences between inner and outer disks are seen for the quantity tlookback(50%). The median value of this quantity in the outer disk is at a look-back time of 7 Gyr compared to 3.5 Gyr in the inner disk. In contrast, the histograms of tlookback(90%) are almost identical for the inner and outer disks, indicating that the look-back time to the onset of star formation is the same in both environments. The combination of identical distributions of tlookback(90%) and strong differences in tlookback(50%) is in accord with the idea that the physical mechanism causing the difference is the radial migration of stars in the disk. Older stars have migrated further than younger stars.


Returning to the correlations between different indicators of stellar age, panel 2 of Figure 5 show that the median H equivalent width in the outer disk is displaced to lower values at fixed Dn(4000). This is true for both extinction-corrected and “raw” H equivalent widths, though the effects become larger once dust is taken into account. The same thing is found for the median relation between H equivalent width and H. The main conclusion is that there is a systematic H deficiency in the outer regions of late-type galaxies. The deficiency is strongest for the galaxies with the youngest stellar populations (low Dn(4000) and high H). As will be demonstrated in the next subsection, the Dn(4000), H and H equivalent widths measured for these outer disk regions cannot be fit assuming a standard initial mass function,
Figure 7 shows relations between metallicity indicators and stellar age indicators, plotted the same way as in Figure 5. The Lick Mgb index and O3N2 are shown, because these are the two indicators with the highest measurements in the outer disk. Dn(4000) and extinction-corrected H equivalent widths are used as stellar age indicators. The main result is that there is a strong correlation between age and metallicity in both the inner and the outer disk, with lower metallicities found at younger ages. The outer disk exhibits a relation that is slightly offset to lower Mgb and higher O3N2 at fixed Dn(4000) and H equivalent width. Note that because star formation has been more episodic in the outer disks of some galaxies, comparing the relations at fixed Dn(4000) is not equivalent to comparing them at fixed age. A correction accounting for bursty star formation histories would likely bring the relations into closer agreement with each other.

In Figure 8, the top two panels show [OIII]/H versus [NII]/H BPT line ratio diagnostic diagrams (Baldwin, Phillipps & Terlevich 1981) for stacked spectra from the inner (red) and the outer (blue) disks. Results are shown separately for galaxies in the stellar mass range (left) and (right). There is a strong offset between low and high mass galaxies, indicative of higher metallicity HII regions in more massive systems. There is, however, no clear offset in the locii occupied by inner disk and outer disk regions, suggesting that the physical properties of HII regions are similar across the entire disk. In the bottom panels, the Balmer decrement H/H is plotted against [OIII]/H. The Balmer decrement is a measure of the dust extinction in the HII regions, while [OIII]/H is measure of the ionization state of the gas. Low-ionization gas in galaxies tends to be dustier. In high mass galaxies, the offset between inner and outer disk regions is very pronounced, with outer disks containing significantly less dusty, higher ionization HII regions, than the inner disks.

3.2 Subsample with H deficient outer disks
I use the criterion D and extinction-corrected H equivalent width less than 80 Å averaged over the the radial range to select a sample of strongly star-forming galaxies with H deficient outer disks. As will be shown later in the section, stellar populations in this parameter range cannot be fit with a standard IMF. There are 21 galaxies (out of a total of 128) in this subsample. Figure 9 compares the global properties of this subsample with those of a “control” sample of galaxies with D and outer extinction-corrected H EQW greater than 80 Å. Galaxies are plotted in the plane of Sersic index versus stellar mass and NUV-r colour versus stellar mass. As can be seen, the galaxies with H deficient outer disks span the same range in and in Sersic index as the control galaxies, showing that they are not unusual in their structural properties. The H deficient outer disk sample is slightly shifted to bluer NUV-r global colours, suggesting that the H deficiency defined using Dn(4000) may be the same as previously studied using XUV disk selection techniques. More detailed investigation would require analysis of resolved UV phtometry of the outer regions of these systems.

Figure 10 demonstrates that the same basic conclusions reached by Bruzzese et al (2020) in their analysis of the stellar populations of four HST fields in the outer XUV disk of M83 also apply to the outer disks of the galaxies in the subsample selected from MaNGA using optical spectral diagnostics. In each of the three panels in the figure, the black points are individual measurements from stacked spectra in the radial range . The coloured curves in the left panel indicate the loci occupied by continuous models where stars form with a standard Kroupa (2001) IMF. As in Kauffmann (2021), the Starburst99 code (Leitherer et 1999; 2014) is used to predict the H equivalent width of galaxies and models from Bruzual & Charlot (2003) to predict the stellar continuum indices Dn(4000) and H. Red, green and blue curves show results for solar, 0.5 solar and 0.25 solar metallicity models. In these models, galaxies begin forming stars 9 Gyr in the past and their star formation rate is parameterized as , where varies over the range -2.0 to 0.0, i.e. from steeply declining to constant star formation rate as a function of time. As can be seen, none of these models reach Dn(4000) values less than 1.25 and they also overpredict the H equivalent width. The cyan curve shows 0.5 solar continuous models where stars begin to form 0.5 Gyr in the past. These models do a better job of spanning the observed range in Dn(4000), but still overpredict H. It should be noted that Bruzzese et al (2020) found that the main sequence population of the M83 outer disk was well fit assuming constant star formation over the same 0.5 Gyr timescale, but that H was similarly overpredicted.

The middle panel shows the same set of models where star formation is suddenly truncated at a random time between 0 and 2 years in the past. Because star formation shut down so recently, residual H emission from massive stars is still present. As can be seen, these models do overlap the observed data points. There are two main problems with recent truncation being a viable scenario: 1) Because the H emission decays very quickly, a steadily increasing fraction of galaxies are found as the H equivalent width decreases, whereas the number of galaxies as a function of H EQW is roughly constant in our sample, 2) As I show below, the H EQW is roughly constant across the entire outer disk in our sample of galaxies. Very rapid recent shutdown of star formation across such a large region violates causality constraints. Bruzzese et al (2020) similarly argue that recent stochastic fluctuations in star formation are highly unlikely in M83 because the H deficiency is present in all four widely separated HST fields that they study.
The right panel of Figure 10 shows a set of continuous models with half solar metallicity where the Kroupa IMF slope parameters are held fixed, but where the upper mass limit of stars is varied (red is for an upper limit of 50 M⊙, green for 35 M⊙ and blue for 20 M⊙). The cyan curve is the model with an upper mass limit of 35 M⊙ where stars begin forming 0.5 Gyr in the past. The main conclusion is that models where the outer disks begin forming stars recently with an IMF that lacks stars with masses greater than 35 M⊙ can fit the data.
Figure 11 shows radial profiles for 6 different quantities for these galaxies. The radial profiles of Dn(4000) of all the galaxies are extremely flat, varying by at most 0.05 across the entire disk. The radial profiles of extinction-corrected H width shown in panel 2 separate into two classes: 1) steeply falling radial profiles with central H EQW width values of 100 or greater, coloured in red in each panel ; 2) flat radial profiles, where the H deficiency persists into the central regions of the galaxy, coloured in black in each panel. The galaxies with steeply falling H EQW width profiles tend to have stronger dust extinction (panel 5) and higher gas-phase metallicities (panel 6) in their central regions. The two classes of galaxies with H deficient outer disks do not appear to have had significantly different star formation histories over the past 1-2 Gyr as evidenced by the fact that their H profiles are quite similar (panel 3). Finally, panel 4 investigates whether there is any evidence for disturbed gas kinematics in the H deficient galaxies. As discussed in section 2, deviations from a simple Gaussian line profile shape can be probed by comparing the flux predicted by the best-fit Gaussian with the actual summed flux. The results plotted in panel 4 show that the line flux differences normalized by the continuum do not exceed values greater than a few Å even in the far outer disk. We will show in the next subsection that there are galaxies in the parent face-on disk sample with outer H profiles that deviate much more strongly from a Gaussian, but these galaxies do not have H deficient outer disks. Our analysis thus yields no evidence that the H deficient outer disk phenomenon is connected with the accretion of cooler gas traced by H. The fact that only dust content and metallicity seem to vary between disk regions with and without H deficiency suggests instead that molecular gas-phase chemistry may be the determining factor in this phenomenon.

3.3 Subsamples with complex H kinematics
As detailed in section 2, the continuum normalized difference between the H line flux given by the best-fit single Gaussian and the flux integrated over the blue side of the H spectral window, provides a first-order diagnostic of kinematic irregularities. This quantity has been calculated for all the stacked spectra, and the average normalized H asymmetry value, which I call Asym from now on, is evaluated for all spectra in the radial ranges and . 114 out of 133 galaxies have average Asym smaller than 3 Å in both the inner and the outer disk, i.e. 86% of all galaxes show little or no evidence for disturbed H kinematics. Of the remainder, 6 galaxies have disturbed H kinematics only in their outer regions. 9 galaxies both in the inner and in the outer disk, and 4 galaxies only in the inner disk.
Figure 12 shows radial profiles of a variety of quantities for 3 of the galaxies with the highest Asym parameters in the outer disk . As seen in panel 9, in one galaxy, Asym rises suddenly to a value of 10 Å beyond 2 Re and in the other two, it reaches values of 5 Å in the outer regions. All three of these galaxies have Dn(4000) profiles that decrease with radius and H profiles that increase with radius, indicating that the outer stellar populations are young. In two of the galaxies where Asym rises suddenly at , H also rises discontinuously to large values at the same radius, but Dn(4000) remains constant. This trend can be understood in terms of an increasing post-starburst contribution in the outer disk. In all three galaxies, the stellar metallicity probed by the Mgb and [MgFe] indices decreases with radius, as does the dust extinction as measured from the Balmer decrement H/H.

Huang & Kauffmann (2013) probed the nature of episodic star formation in nearby galactic disks using a sample of 200 galaxies with longslit spectra. They found that recent star formation in outer disks is strongly correlated with the global atomic gas fraction of the galaxy (but not its molecular gas fraction), and proposed that outer episodic star formation is triggered by gas accretion events. The results shown in Figure 6 corroborate the finding that the stars in the outer disks of nearby galaxies have often formed in episodic bursts rather than smoothly. I have checked that selecting a sample galaxies with enhanced H at fixed Dn(4000) in the outer disk does not preferentially pick out galaxies with H kinematic asymmetries. Evidently, episodic star formation in outer disks can have a number of different triggering mechanisms in addition to gas accretion. Bursts of star formation in the outer regions of the galaxy could be excited by spiral density waves and other gas compression mechanisms that are internal, rather than external to the disk.
Figure 13 shows the H line in the stacked spectra at 6 different radii for two of the galaxies with high Asym parameter in the outer disk. As can be seen, the line shapes first become flat-topped and then appear to split into two components. Examination of SDSS -band postage stamp images for these galaxies reveals rather regular systems with no strong asymmetric features and no very obvious ongoing interactions with a satellite system of significant mass. Interestingly, the rest-frame H wavelength is located exactly in between the two components, which may be an indication of the presence of a counter-rotating disk rather than a continuous distribution of extra planar gas. Metallicity variations could also be an interesting diagnostic of the origin of the extra gas component. A metallicity drop was found in one example of an HI-rich galaxy studied by Moran at al (2010), but the connection between metallicity, episodic star formation and kinemetric asymmetries in outer disks has not yet been firmly established. Because of the very small sample size, more detailed analysis of the kinematic properties of these systems is deferred to future work.


I now turn to an examination of the subsample with high Asym parameter in both the inner and outer disks. Figure 14 shows radial profiles for the same quantities as in Figure 12 for three example galaxies. The main difference with regard to the subsample with high Asym only in the outer disk is that there are large fluctuations from one radial bin to another in the asymmetry parameter, the Balmer decrement H/H and the extinction corrected H equivalent width across the entire galaxy. Stellar ages and metallicities vary more smoothly within each galaxy, but there are large differences from one galaxy to another. The H line profiles plotted for these galaxies in Figure 15 also show large variation in shape from one radial bin to another. In the inner radial bins, the profiles appear to have red or blue wing extensions, while in the outer bins, they appear to be double-peaked, with the rest-frame H wavelength located exactly in between the two components, as in Figure 13. Finally, I note that the optical images of these systems reveal no pronounced morphological disturbances or interactions, but the star forming regions in the innerpart of the galaxy tend to have have considerably higher surface brightnesses.


4 Summary and Discussion
This paper describes an analysis of the spatially-resolved stellar populations and ionized gas properties of a sample of star-forming galaxies with stellar masses in the range . Integral field unit (IFU) spectra from the MaNGA survey are stacked in radial bins to reach a S/N high enough to measure not only emission lines, but also the main Lick indices out to 2.5-3 Re. In this section, I summarize the main results of the analysis and discuss future directions for improving understanding of some of the main unresolved issues. The outer disks differ from the inner disks in the following ways:
- •
Two thirds of galaxies have outer disk stellar populations that are older and more metal poor.
- •
Two thirds of galaxies have lower dust extinction and higher ionization parameters in their outer disks.
- •
80% of galaxies have lower metallicities and H equivalent widths in their outer disks.
- •
Recent bursts of star formation have occurred more frequently in the outer disk compared to the inner disk.
- •
Extinction-corrected H equivalent widths are significantly lower at fixed Dn(4000) in the outer disk compared to the inner disk.
- •
Other 2-dimensional correlations between spectral properties remain roughly constant between the inner and outer disk.
I then examine the properties of a subset of galaxies with the most H deficient outer disks. These are selected to have in the outer disk, indicative of young stellar populations that must have formed within the last 0.5 Gyr, but with extinction-corrected H values well below the values predicted for a standard Kroupa IMF. These galaxies all have extremely flat Dn(4000) and H profiles that fluctuate very little from one radial bin to the next, indicating that star formation has occurred extremely uniformly across the entire disk. The H profiles are also well-fit with a single Gaussian at all radii, indicating that the ionzed gas kinematics is also very regular. The main clue to the origin of the H deficiency is that in a large fraction of galaxies there is a sharp transition in both H equivalent width and dust extinction at , reminiscent of the transition between the inner molecular gas-dominated region of the disk and the outer HI-dominated region. This suggests that the H deficiency may reflect a different mode of star formation in quiescent, HI-dominated gas.
The question of whether stars can form in the absence of molecular gas was first addressed quantitatively by Glover & MacLow (2007) and Glover & Clark (2012). These authors ran simulations of the collapse of a gas clouds to form stars using a set of different chemical models. They showed that even if molecule formation in the gas was “switched off”, gas at low densities is able to cool via C+ fine structure emission. Once at higher densities, the main cooling process involves the transfer of energy from gas to dust, so the absence of molecules does not, in and of itself, constitute a barrier to star formation. These simulations were highly idealized experiments and not self-consistent representations of the chemical enrichment and dust production and destruction processes going on in the real interstellar medium of a galaxy as stars form and die. Hu et al (2016) took the next step of modelling the formation of stars in an isolated, low-metallicity dwarf galaxy with full treatment of the chemistry of the ISM, and verified that in such a system, the dense and cold gas constituting the main reservoir for star formation could be HI rather than H2-dominated. This simulation did not reach high enough resolution to probe the formation of stars within individual molecular clouds. The question of whether a systematic change in the IMF is expected in star-forming gas that is HI-dominated is still an open one.
I have also carried out a search for galaxies with signatures of unusual H kinematics and find that 15% of the sample exhibit clear evidence for significant ionized gas that is displaced away from the systemic velocity of the main disk. There are a number of detailed studies of extra-planar HI in face on disk galaxies. Schulman et al (1994) observed 14 nearly face-on disk galaxies with the Arecibo 305 m telescope and found the double-horned HI profiles to have high-velocity wings in 10 of these galaxies. Follow-up observations of one of these galaxies, NGC 5668 using the Very Large Array, confirm that 60% of the material in the high-velocity wings is distinct in position-velocity diagrams, located primarily outside the optical disk of the galaxy. Similar studies have been carried out for M101 (Van der Hulst & Sancisi 1988), NGC 608 (Kamphuis & Briggs 1992), NGC 4254 (Phookun et al 1993), NGC 2403 (Fraternali et al 2002), amongst others.
The current generation of large optical IFU and HI surveys should enable a
more systematic quantification of the nature of these extra-planar gas
components. The existing literature is still unclear as to whether the
extra-planar gas is material that is infalling for the first time to fuel
future star formation in the disk, or whether it is “galactic fountain”
material that was recently ejected by supernovae. Current hydrodynamical
simulations of disk galaxy formation provide detailed predictions for the
way in which present-day disk material assembles. For example, an analysis
of the assembly of 15 Milky Way mass galaxies from the Auriga simulations
predicts that half of the stellar material in their present-day disks
originates from gas accreted in subhalo/satellite systems and the other
half is smoothly accreted from the intergalactic medium. About 90% of all
the material has been ejected and re-accreted in galactic winds at least
once. The vast majority of smoothly accreted gas enters into a galactic
fountain that extends to a median galactocentric distance of 20 kpc with a
median recycling time-scale of 500 Myr (Grand et al 2019). The challenge
for the future is to translate these predictions into observable
diagnostics that can be compared directly with the survey results. This
will be the subject of future work.
Acknowledgements
Funding for SDSS-IV has been provided by the Alfred
P. Sloan Foundation and Participating Institutions. Ad-
ditional funding towards SDSS-IV has been provided by
the US Department of Energy Onece of Science. SDSS-
IV acknowledges support and resources from the Centre
for High-Performance Computing at the University of
Utah. The SDSS web site is www.sdss.org.
SDSS-IV is managed by the Astrophysical Research
Consortium for the Participating Institutions of the
SDSS Collaboration including the Brazilian Participation
Group, the Carnegie Institution for Science,
Carnegie Mellon University, the Chilean Participation
Group, the French Participation Group, Harvard-
Smithsonian Center for Astrophysics, Instituto de
Astrofsica de Canarias, The Johns Hopkins University
sity, Kavli Institute for the Physics and Mathematics
of the Universe (IPMU)/University of Tokyo, Lawrence
Berkeley National Laboratory, Leibniz Institut fur
Astrophysik Potsdam (AIP), Max-Planck-Institut für
Astronomie (MPIA Heidelberg), Max-Planck-Institut für
Astrophysik (MPA Garching), Max-Planck-Institut für
Extraterrestrische Physik (MPE), National Astronom-
ical Observatory of China, New Mexico State University,
New York University, University of Notre Dame,
Observatario Nacional/MCTI, the Ohio State University,
Pennsylvania State University, Shanghai Astronomical
Observatory, United Kingdom Participation Group,
Universidad Nacional Autonoma de Mexico, University
of Arizona, University of Colorado Boulder, University
of Oxford, University of Portsmouth, University of Utah,
University of Virginia, University of Washington,
University of Wisconsin, Vanderbilt University and Yale
University.
Data Availability
Data from this paper will be made available on reasonable request to the
corresponding author.
References
- Alloin et al. (1979) Alloin D., Collin-Souffrin S., Joly M., Vigroux L., 1979, A&A, 78, 200
- Bakos, Trujillo, & Pohlen (2008) Bakos J., Trujillo I., Pohlen M., 2008, ApJL, 683, L103. doi:10.1086/591671
- Baldwin, Phillips, & Terlevich (1981) Baldwin J. A., Phillips M. M., Terlevich R., 1981, PASP, 93, 5. doi:10.1086/130766
- Belfiore, et al. (2019) Belfiore F., et al., 2019, AJ, 158, 160
- Bigiel et al. (2008) Bigiel F., Leroy A., Walter F., Brinks E., de Blok W. J. G., Madore B., Thornley M. D., 2008, AJ, 136, 2846. doi:10.1088/0004-6256/136/6/2846
- Bigiel et al. (2010) Bigiel F., Leroy A., Walter F., Blitz L., Brinks E., de Blok W. J. G., Madore B., 2010, AJ, 140, 1194. doi:10.1088/0004-6256/140/5/1194
- Blanton, et al. (2017) Blanton M. R., et al., 2017, AJ, 154, 28
- Boissier & Prantzos (1999) Boissier S., Prantzos N., 1999, MNRAS, 307, 857. doi:10.1046/j.1365-8711.1999.02699.x
- Bruzual & Charlot (2003) Bruzual G., Charlot S., 2003, MNRAS, 344, 1000. doi:10.1046/j.1365-8711.2003.06897.x
- Bruzzese et al. (2015) Bruzzese S. M., Meurer G. R., Lagos C. D. P., Elson E. C., Werk J. K., Blakeslee J. P., Ford H., 2015, MNRAS, 447, 618. doi:10.1093/mnras/stu2461
- Bruzzese et al. (2020) Bruzzese S. M., Thilker D. A., Meurer G. R., Bianchi L., Watts A. B., Ferguson A. M. N., Gil de Paz A., et al., 2020, MNRAS, 491, 2366. doi:10.1093/mnras/stz3151
- Bundy, et al. (2015) Bundy K., et al., 2015, ApJ, 798, 7
- Calzetti (2001) Calzetti D., 2001, PASP, 113, 1449. doi:10.1086/324269
- Chiappini, Matteucci, & Gratton (1997) Chiappini C., Matteucci F., Gratton R., 1997, ApJ, 477, 765. doi:10.1086/303726
- Drory, et al. (2015) Drory N., et al., 2015, AJ, 149, 77
- Fraternali et al. (2002) Fraternali F., van Moorsel G., Sancisi R., Oosterloo T., 2002, AJ, 123, 3124. doi:10.1086/340358
- Fu et al. (2010) Fu J., Guo Q., Kauffmann G., Krumholz M. R., 2010, MNRAS, 409, 515. doi:10.1111/j.1365-2966.2010.17342.x
- Fumagalli, da Silva, & Krumholz (2011) Fumagalli M., da Silva R. L., Krumholz M. R., 2011, ApJL, 741, L26. doi:10.1088/2041-8205/741/2/L26
- Gil de Paz et al. (2007) Gil de Paz A., Boissier S., Madore B. F., Seibert M., Joe Y. H., Boselli A., Wyder T. K., et al., 2007, ApJS, 173, 185. doi:10.1086/516636
- Glover & Mac Low (2007) Glover S. C. O., Mac Low M.-M., 2007, ApJS, 169, 239. doi:10.1086/512238
- Glover & Clark (2012) Glover S. C. O., Clark P. C., 2012, MNRAS, 426, 377. doi:10.1111/j.1365-2966.2012.21737.x
- González Delgado et al. (2015) González Delgado R. M., García-Benito R., Pérez E., Cid Fernandes R., de Amorim A. L., Cortijo-Ferrero C., Lacerda E. A. D., et al., 2015, A&A, 581, A103. doi:10.1051/0004-6361/201525938
- Grand et al. (2019) Grand R. J. J., van de Voort F., Zjupa J., Fragkoudi F., Gómez F. A., Kauffmann G., Marinacci F., et al., 2019, MNRAS, 490, 4786. doi:10.1093/mnras/stz2928
- Hu et al. (2016) Hu C.-Y., Naab T., Walch S., Glover S. C. O., Clark P. C., 2016, MNRAS, 458, 3528. doi:10.1093/mnras/stw544
- Huang et al. (2013) Huang M.-L., Kauffmann G., Chen Y.-M., Moran S. M., Heckman T. M., Davé R., Johansson J., 2013, MNRAS, 431, 2622. doi:10.1093/mnras/stt370
- Hunter et al. (2011) Hunter D. A., Elmegreen B. G., Oh S.-H., Anderson E., Nordgren T. E., Massey P., Wilsey N., et al., 2011, AJ, 142, 121. doi:10.1088/0004-6256/142/4/121
- Kamphuis & Briggs (1992) Kamphuis J., Briggs F., 1992, A&A, 253, 335
- Kauffmann (1996) Kauffmann G., 1996, MNRAS, 281, 475. doi:10.1093/mnras/281.2.475
- Kauffmann et al. (2003) Kauffmann G., Heckman T. M., White S. D. M., Charlot S., Tremonti C., Brinchmann J., Bruzual G., et al., 2003, MNRAS, 341, 33. doi:10.1046/j.1365-8711.2003.06291.x
- Kauffmann & Maraston (2019) Kauffmann G., Maraston C., 2019, MNRAS, 489, 1973. doi:10.1093/mnras/stz2271 (KM19)
- Kroupa (2001) Kroupa P., 2001, MNRAS, 322, 231. doi:10.1046/j.1365-8711.2001.04022.x
- Law, et al. (2016) Law D. R., et al., 2016, AJ, 152, 83
- Lee et al. (2011) Lee J. C., Gil de Paz A., Kennicutt R. C., Bothwell M., Dalcanton J., José G. Funes S. J., Johnson B. D., et al., 2011, ApJS, 192, 6. doi:10.1088/0067-0049/192/1/6
- Leitherer et al. (1999) Leitherer C., Schaerer D., Goldader J. D., Delgado R. M. G., Robert C., Kune D. F., de Mello D. F., et al., 1999, ApJS, 123, 3. doi:10.1086/313233
- Leitherer et al. (2014) Leitherer C., Ekström S., Meynet G., Schaerer D., Agienko K. B., Levesque E. M., 2014, ApJS, 212, 14. doi:10.1088/0067-0049/212/1/14
- Martin & Kennicutt (2001) Martin C. L., Kennicutt R. C., 2001, ApJ, 555, 301. doi:10.1086/321452
- Meurer et al. (2009) Meurer G. R., Wong O. I., Kim J. H., Hanish D. J., Heckman T. M., Werk J., Bland-Hawthorn J., et al., 2009, ApJ, 695, 765. doi:10.1088/0004-637X/695/1/765
- Moran et al. (2010) Moran S. M., Kauffmann G., Heckman T. M., Gracia-Carpio J., Saintonge A., Catinella B., Wang J., et al., 2010, ApJ, 720, 1126. doi:10.1088/0004-637X/720/2/1126
- Pettini & Pagel (2004) Pettini M., Pagel B. E. J., 2004, MNRAS, 348, L59. doi:10.1111/j.1365-2966.2004.07591.x
- Phookun, Vogel, & Mundy (1993) Phookun B., Vogel S. N., Mundy L. G., 1993, ApJ, 418, 113. doi:10.1086/173375
- Pohlen & Trujillo (2006) Pohlen M., Trujillo I., 2006, A&A, 454, 759
- Rodríguez-Baras et al. (2018) Rodríguez-Baras M., Díaz A. I., Rosales-Ortega F. F., Sánchez S. F., 2018, A&A, 609, A102. doi:10.1051/0004-6361/201731592
- Roškar et al. (2008) Roškar R., Debattista V. P., Stinson G. S., Quinn T. R., Kaufmann T., Wadsley J., 2008, ApJL, 675, L65. doi:10.1086/586734
- Ruiz-Lara et al. (2016) Ruiz-Lara T., Pérez I., Florido E., Sánchez-Blázquez P., Méndez-Abreu J., Lyubenova M., Falcón-Barroso J., et al., 2016, MNRAS, 456, L35
- Schruba et al. (2010) Schruba A., Leroy A. K., Walter F., Sandstrom K., Rosolowsky E., 2010, ApJ, 722, 1699. doi:10.1088/0004-637X/722/2/1699
- Schulman, Bregman, & Roberts (1994) Schulman E., Bregman J. N., Roberts M. S., 1994, ApJ, 423, 180. doi:10.1086/173797
- Thilker et al. (2005) Thilker D. A., Hoopes C. G., Bianchi L., Boissier S., Rich R. M., Seibert M., Friedman P. G., et al., 2005, ApJL, 619, L67. doi:10.1086/424816
- Thilker et al. (2007) Thilker D. A., Bianchi L., Meurer G., Gil de Paz A., Boissier S., Madore B. F., Boselli A., et al., 2007, ApJS, 173, 538. doi:10.1086/523853
- Thomas, Maraston, & Bender (2003) Thomas D., Maraston C., Bender R., 2003, MNRAS, 339, 897. doi:10.1046/j.1365-8711.2003.06248.x
- van der Hulst & Sancisi (1988) van der Hulst T., Sancisi R., 1988, AJ, 95, 1354. doi:10.1086/114731
- van der Kruit (2001) van der Kruit P. C., 2001, ASPC, 230, 119
- Westfall, et al. (2019) Westfall K. B., et al., 2019, AJ, 158, 231
- Yoachim, Roškar, & Debattista (2012) Yoachim P., Roškar R., Debattista V. P., 2012, ApJ, 752, 97. doi:10.1088/0004-637X/752/2/97
- Zheng et al. (2015) Zheng Z., Thilker D. A., Heckman T. M., Meurer G. R., Burgett W. S., Chambers K. C., Huber M. E., et al., 2015, ApJ, 800, 120. doi:10.1088/0004-637X/800/2/120