Keywords: Integrating sphere, inverse adding doubling, absorption coefficient, reduced scattering coefficient, Monte Carlo simulation
Methodology development and evaluation of optical properties characterisation of small size tissue samples
Abstract
Integrating sphere (IS) techniques combined with an inverse adding doubling (IAD) algorithm have been widely used for determination of optical properties of ex vivo tissues. Semi-infinite samples are required in such cases. The aim of this study is to develop a methodology for calculating the optical absorption and reduced scattering of biological tissues of small size from IS measurements at 400-1800 nm. We propose a two-stage IAD algorithm to mitigate profound cross-talk effects in the estimation of the in the case of very high . We developed a small sample adaptor kit to allow IS measurements of samples with small sizes using a commercial spectrophotometer. Results showed that: The two-stage IAD substantially eliminated the cross-talks in the spectra, thus rectifying accordingly; and the small sized sample measurements led to systematically overestimated values while the spectrum shape well preserved as compared to the normal port size measurements.
1 Introduction
Optical imaging modalities have become valuable tools in clinical applications, providing real-time structural, molecular and functional information of tissue for diagnosis, and for guiding surgical or therapeutic interventions [1, 2, 3, 4, 5, 6, 7, 8]. The design and development of optical imaging systems requires a thorough understanding of the optical properties of tissue which are typically characterized by the absorption coefficient and reduced scattering coefficient .
Tissue optical properties can be estimated using direct or indirect methods [9, 10]. Direct methods are based on fundamental tissue-light interaction rules, such as the Beer-Lambert Law; Direct methods often involve rigorous experimental conditions, such as very thin tissue samples (200 - 500 m) to allow only single scattering events. Indirect methods obtain the solution of the inverse problem using a theoretical model that approximates light propagation in a turbid medium. Indirect methods may be further divided into non-iterative and iterative models. The former are typically based on the two flux Kubelka–Munk model or multi-flux models, that use equations where the optical properties are defined through parameters directly related to the quantities being measured [10]. In indirect iterative methods, the optical properties are implicitly defined through measured parameters; a numerical solution to the model is obtained by iteratively making guesses at the solution, testing whether the problem is solved well enough, and stop accordingly. Typical approaches include inverse adding doubling (IAD) and inverse Monte Carlo simulation (IMC)[10].
Among the aforementioned methods, the IAD algorithm together with measurements stemming from an integrating sphere (IS) technique is one of the most widely used approaches to derive optical properties of ex vivo biological tissue samples. The open-source IAD software [11] may be conveniently used with IS measurements where the geometrical parameters such as dimension and port size of an integrating sphere, number of measurements, size of the incident light beam and as well as the refractive index of the given biological sample have been considered. Moreover, it also includes a Monte Carlo subroutine that calculates the loss of the light scattered through the transverse boundary of the sample so as to eliminate the light loss effect on IAD [11].
To date, the majority of the researches concerning tissue optics have employed light in the visible and near-infrared regions of the spectrum (VIS-NIR 400 nm to 1100 nm), as summarised in the work by Madsen and Wilson [12], and the work by Tuchin [9]. Researches focus on characterising the concentration of oxygenated (Hb) and de-oxygenated haemoglobin () in a tissue would deploy light in the visible range to be able to detect the primary absorption peaks of Hb and [13, 14, 15]. Light at the long wavelength of 900 to 1100 nm would be utilised in studies focus on the investigation of tissue’s water and lipid concentrations [16, 17]. Furthermore, the tissue samples previously studied were either in large size that were able to cover a standard sphere port or alternatively patched together [18].
The aim of this study is to develop a methodology for calculating optical absorption () and reduced scattering () of small sized (approx. 6 x 10 mm) biological tissues from reflectance and transmittance measurements acquired over an extended spectral range spanning from 400 to 1800 nm. We developed a small sample adaptor kit to allow integrating sphere measurements of samples with small sizes using a commercial spectrophotometer. A dual beam single integrating sphere technique was used to measure the total transmittance () and total reflectance () of samples, and inverse adding doubling (IAD) was used to calculate the absorption coefficient and reduced scattering coefficient from the measurements. We observed that the standard IAD algorithm would produce profound cross-talk effect on the calculated reduced scattering spectrum at wavelength regions where the corresponding absorption coefficient is very high due to high haemoglobin or water content in the tissue sample. We propose a two-stage IAD algorithm incorporating Mie and Rayleigh Scattering models as input constrains to mitigate this profound cross-talk effect and to provide an accurate estimation of the reduce scattering spectrum of tissue. We evaluated the two-stage IAD with data generated using Monte Carlo simulation and with rigorous experimental data obtained from controlled phantom experiments. We then investigated the accuracy of the proposed method using our small sample adaptor kit and condensed incident light beam by comparing results to those obtained with standard IS measurements and IAD with larger samples.
2 Materials & methods
2.1 Integrating sphere measurement
In this study, we used a commercial dual beam high performance spectrophotometer system (Lambda 750s, Perkin Elmer) equipped with a 100 mm single integrating sphere module (L6020371, Perkin Elmer) to obtain transmittance and reflectance measurements. The system is supplied with a photomultiplier tube detector (PMT, 200 - 860 nm) and a Indium gallium arsenide detector (InGaAs, 860 nm - 2500 nm), covering a wide wavelength range from 200 to 2500 nm. The system’s performance in terms of wavelength calibration and measurement accuracy was validated by the manufacturer and has been regularly serviced according to protocol. It has been used in research and industrial labs as a standard tool for precise analysis of materials in various applications [19, 20, 21, 22, 23, 24]. A schematic illustration of the original spectrophotometer setup and the modified set up with small sample adaptor kits presenting is shown in Figure 1 (A, C). The original sample port size at the transmittance port is 11 mm (w) x 24 mm (h), and at the reflectance port it is 17 mm (w) x 22 mm (h); the incident light beam size is measured around 3 mm (w) x 15 mm (h) at the transmittance port, and 6.5 mm (w) x 13.5 mm (h) at the reflectance port. The basic operational principle of performing reflectance and transmittance measurements using a spectrophotometer with an integrating sphere, respectively, are also sketched in Figure 1(A, C). All measurements were carried out relative to a diffuse optical standard, Spectralon® (SRS-99-020, Labsphere), which is a white Lambertian material with diffuse reflectance values between 95–99% in the wavelength region from 250 nm to 2500 nm. With the aforementioned integrating sphere configuration, total transmittance and total reflectance are measured for all experiments conducted in this study and are denoted as and , respectively, unless otherwise stated.

2.2 Small sample kit
The original setup of the spectrophotometer can be used to obtain measurements of various solid materials. The size of the sample should be such that the distance () from the edge of the incident beam on the sample to the edge of the integrating sphere port is made as large as practicable. This is to prevent light loss from the lateral sides of the sample. It has been demonstrated that when is larger than five times of the light loss from the lateral sides could be considered negligible [18]. In order to perform transmittance and reflectance measurements on specimens that are only available in small size (smaller than the original spectrophotometer port size and the beam size on both ports), we designed and developed a small sample kit to adapt the original spectrophotometer setup. Our small sample kit includes: 1) an adjustable slit to reduce the beam dimension at the beam exit port in the primary sample chamber (shown in Figure 1(C)); 2) lens sets to focus the incident beam at the transmittance and reflectance ports, respectively; and 3) a sample holder to hold the sample slide and to create a mask on the original port with reduced port size (shown in Figure 1 (B, D)). The side facing the integrating sphere of the small sample holder consists of a patch of polytetrafluoroethylen (PTFE) sheet (99% reflectance, Zenith Lite, Pro-Lite Technology, UK ) that covers the original port of the integrating sphere. In the centre of the PTFE sheet we designed a square port defining the new sample port size. The PTFE material matches the material of the integrating sphere inner wall material, namely Spectralon®. We developed two sets of the small sample kit with configurations listed in Table 1.
| Reduced port size | Measurement type | Lenses | Slit width | Beam size at the port |
|---|---|---|---|---|
| 3 mm | Transmittance | L1 -150, L2 60 | 5 mm | 1 x 1.5 mm |
| 3 mm | Reflectance | L3 -150, L4 200 | 3 mm | 2 x 2 mm |
| 5 mm | Transmittance | L1 -150, L2 60 | 5 mm | 1 x 1.5 mm |
| 5 mm | Reflectance | L3 -150, L4 200 | 3 mm | 2 x 2 mm |
L1: LC1611 Thorlabs; L2: LA1401 Thorlabs; L3: LC1611 Thorlabs; L4: LA1979 Thorlabs
2.3 Two-stage inverse adding doubling
To derive optical absorption and reduced scattering spectra from transmittance and reflectance spectra, we developed a two-stage IAD algorithm based on the open-source IAD algorithm developed by Prahl et al. [11]11 1 Available from https://github.com/scottprahl/iad. In general, inverse adding doubling is a numerical approach to solve the radiative transport equation (RTE) providing analytical calculations of the optical properties of a sample slab from reflectance and transmittance measurements. The algorithm first assumes a thin slab with known optical properties and calculates the transmittance and reflectance at the slab surface, doubles them as adding another thin layer slab of the same material iteratively until the measured values of transmittance and reflectance are matched with those corresponding to the estimated optical properties. The algorithm can be conveniently used with integrating sphere measurements where the geometrical parameters such as the port size of the integrating sphere, number of measurements, dimensions of the sphere, size of the incident light beam and the refractive index of the given biological sample have been considered and accounted in the algorithm. However, a profound cross-talk effect occurs in the IAD calculated reduced scattering at the wavelength regions where the sample’s absorption is very high. This is notably the case at 420 nm where the haemoglobin absorption peak is, and at 1450 nm where the predominant water absorption peak is. This was observed in our tissue experiments, as shown in Figure 2 and in [25, 26], and as well as reported and investigated in the work by Gebhart et al. [27].

To mitigate the inter-parameter cross-talk effect, we propose a two-stage inverse adding doubling process as illustrated in Figure 3. During the first-stage IAD, for each wavelength , we calculate intermediate values and . We then used non-linear least squares Equation 1 [28] to fit the spectrum with a parametric model.
| (1) |
In its simplest form, the fitted model is a power law according to the Mie theory:
| (2) |
where , is a reference wavelength, is the power law exponent (scattering power) related to the Mie scattering. To account for the contribution of both Mie and Rayleigh scattering, a combined power law may also be fitted:
| (3) |
The Rayleigh scattering is expressed as . The Mie scattering is denoted as . , , and denote the same factors as above in Equation 2. and indicate the fraction of Rayleigh scattering and Mie scattering, respectively. The power factor 4 for Rayleigh scattering was determined in previous studies [29]. We have observed from our phantom experiments that the reduced scattering spectrum is affected by the cross-talk most noticeably at the wavelength of 400 - 450 nm and 1200 - 1700 nm where haemoglobin and water dominate the absorption spectrum (see Figure 2). To that end, the is fitted with either of the above equations at to achieve optimum fitting results. We chose because at this wavelength there is no significant absorption that arise from either haemoglobin or lipid or water. For the non-linear least squares fitting, our implementation makes use of the nlinfit function in MATLAB®.
For the second-stage IAD, at each wavelength , we constrain the scattering coefficient with the value from the model fitted in the first-stage IAD, or . The current version of the open-source IAD software (iad 3-9-12, 31 May 2017) already allows for providing a reduced scattering coefficient as a constraint in the inverse calculation leading to the estimation of the absorption coefficient . However, it only allows so by inputting model parameters (, and ) based on Mie theory. To provide more flexibility and encompass both Mie and Rayleigh scattering, we modified the IAD software to allow it to use model parameters (, , and ) from Equation 3 to calculate . The modified source code is available at https://github.com/cai4cai/RevIAD. This was deemed important to exploit the two-stage IAD also in the case of biological samples with scatterings attributed to ultra-structures (e.g. collagen fibrils). The final output of absorption and reduced scattering were denoted as , , and , , respectively.

2.4 Validation protocol with simulated data

To validate the proposed two-stage IAD, we first used computer-synthetic phantoms and their transmittance and reflectance spectra which were simulated by Monte Carlo modeling of light transport in Multi-Layered tissues (MCML) algorithm22 2 Available from https://omlc.org/software/mc [30, 31]. The work flow of the procedure includes the following steps:
- 1.
Define a synthetic phantom consisting of four chromophores (Hb, , Water, Lipid) that are the main constituents in most biological tissues. Assign each of them a volume fraction that are similar to those in biological tissues [16].
- 2.
Calculate the total absorption spectrum of the phantom based on the known respective absorption spectra of the four chromophores in their pure form and their volume fractions as per Section 2.4 [16, 32];
We assume the reduced scattering and the anisotropy coefficient are only attributed to the lipid content from the Intralipid. Thus we use the formula in Equation 6 as presented in [33] to calculate the expected optical value of Intralipid ( and ) with given volume concentration.
- 3.
Define the phantom’s thickness , and refractive index to be used as input for the Monte Carlo simulation generating the total reflectance and total transmittance spectra of the phantom.
- 4.
Use the IAD algorithm to calculate, at each wavelength , the absorption coefficient and reduced scattering coefficient of the phantom from the and .
- 5.
Use nonlinear least squares to fit with Equation 2 and Equation 3.
- 6.
In the second stage IAD, use the fitted reduced scattering or as an input constraint for the IAD algorithm to calculate a revised absorption spectrum, and to obtain the revised absorption coefficient .
- 7.
For validation, compare the absorption and reduced scattering coefficients derived from the two-stage IAD () and those derived from the original IAD () to the ground-truth from the simulations ().
2.5 Validation protocol with integrating sphere measurements on physical phantoms
We further validated our method using standard physical phantoms of which the absorption coefficient and reduced scattering coefficient can be precisely calculated from the phantoms’ compositions. The procedure was similar to the one for validation on simulated data, except that we used the spectrophotometer to measure the total transmittance and total reflectance of the physical phantom (workflow shown in Figure 5).

2.5.1 Phantom preparation.
We prepared liquid phantoms using lipid emulsion (Intralipid® 20%, batch numbers 10PE3391 EXP:04/2022, Fresenius Kabi Ltd, UK) as a scattering agent and haemoglobin (lyophilized powder, H2500 Sigma-Aldrich, UK) as absorber. Intralipid has been demonstrated as a reliable material for introducing controllable scattering properties in phantoms. Its optical properties and stability has also been fully investigated and reported ([34, 35, 33, 36, 37, 38, 39]). The batch-to-batch variations of the reduced scattering coefficient of Intralipid were found to be about 1.5% [40]. Its predominant absorbers are soy bean oil and water. Thus its absorption coefficient is negligible in the visible wavelength range and is practically equal to that of water at the near infrared range [34]. Haemoglobin solution has been commonly used in optical phantom preparation to mimic blood absorption spectrum [41, 42, 43, 44]. While its extinction coefficient has been determined and is available from literature [45, 46, 41, 47], it should be noted that the lyophilized powder of haemoglobin used in this study may be predominantly methaemoglobin (MetHb), since the native haemoglobin is readily oxidized in air during the supplier’s manufacturing process. The extinction coefficient of MetHb is distinctly different to either oxygenated haemoglobin (HbO) or deoxygenated haemoglobin (Hb) [48, 49]. We thus used our spectrophotometer to measure the absorption coefficient () of the methaemoglobin/haemoglobin solution prepared from lyophilized powder of bovine haemoglobin and Phosphate Buffered Saline (PBS, Sigma Alrich, UK) at concentration of 1.0 , and used as an unit absorption coefficient in later calculations. We also calculated the absorption coefficient of 10% Intralipid (IL) as reported in the work of Michels et al. [34]. In summary, the basic absorption coefficient spectra of the substances () we used for the phantom preparation are shown in SI Figure 1.
We prepared six sets of phantoms with various combinations of IL and MetHb concentrations ( and ) as shown in Table 2. All phantoms were prepared with PBS at room temperature (ca. ) and were mixed with a vortex mixer (Fisherbrand, Fisher Scientific UK) for 2 min. We chose PBS for preparing phantoms to stabilise the mixture of methaemoglobin, lipid emulsion and water, and to ensure the reproducibility of the measurements. Intralipid is a colloidal suspension stabilised by surface positive charges on the colloidal particles creating an electrical double layer according to the Derjaguin-Landau-Verwey-Overbeek (DVLO) theory[50]. Methaemoglobin is able to reversibly bind to H+ ions therefore increasing the pH of the deionised water and the availability of negatively charged ions. When mixed with intralipid, these negative ions neutralise the surface charges on the colloids removing the electrical double layer and cause the suspension to aggregate and therefore the Methaemoglobin and Intralipid solutions are immiscible. By introducing PBS, the pH of both solutions is maintained, thus preventing the neutralisation of these surface charges and therefore preventing the aggregation of the intralipid colloids. For this reason, PBS is included in all phantom synthesis to ensure an even dispersion of intralipid by maintaining a constant pH.
| Set A | Set B | Set C | Set D | Set E | Set F | |
|---|---|---|---|---|---|---|
| (mg/ml) | 2.5 | 5.0 | 7.5 | 10.0 | 1.5 | 3.0 |
| (v/v % ) | 2.0 | 2.0 | 2.0 | 2.0 | 1.0 | 6.0 |
| Total volume (ml) | 10 | 10 | 10 | 10 | 10 | 10 |
| IS port size | Original | Original | Original | Original | Original, modified | Original, modified |
IS: Integrating sphere
The expected absorption and scattering coefficient of the liquid phantom were calculated as follows:
| (5) |
| (6) |
where is the volume concentration of Intralipid. The refractive index of the phantom was calculated based on the volume concentration of scattering particles or lipid () in the phantom [51]. We also designed and developed sample chambers to contain liquid phantom samples for integrating sphere measurements. The sample chamber consisted of two glass slides 52 mm (w) x 76 mm (h) x 1 mm (d), and a 2 mm thick U shape acrylic spacer that was processed by a laser cutter (VLS6.75, Universal Laser Systems, USA) and glued between the two glass slides with a UV-curing optical adhesive (NOA68, Thorlabs, USA).
2.5.2 Small sample kit.
To validate the measurement with a small sample kit, we used the liquid phantoms developed as described in Section 2.5. The phantoms’ total transmittance and total reflectance were measured in the spectrophotometer with the 3 mm and 5 mm sample kit.
2.5.3 Measures of accuracy.
We used the median value of residuals, Mean Squared Error (MSE), and Pearson Correlation Coefficient (CC) to characterise the performance of the two-stage IAD algorithm as compared with the original version. MSE was calculated by , and CC was calculated using MATLAB® corrcoef function.
2.6 Measurement on fresh mouse tissue
To evaluate the capability and performance of the two-stage IAD algorithm and the small sample kit on measuring biological tissue, we performed ex vivo testing on various mouse tissues. All experiments were performed in accordance with local laboratory guidelines. A female laboratory Balb/C mouse weighing of approximately 30 g was used in the experiments. Animal was culled by rising the concentration of , followed by a secondary confirmation with cervical dislocation. Immediately after dissection, the tissue specimens were rinsed with PBS solution for about 1 min to remove any excess blood on their surface. One specimen of liver, one specimen of quadriceps muscle, and one specimen of brain (cerebral cortex) were examined and reported here. The average size of specimens was 7 x 10 x 2 . The specimens were placed in the sample chamber between two glass slides. We used index matching gel (G608N3, Thorlabs, UK) to secure the tissue in place by filling the empty region within the specimen chamber at either end of the tissue and to diminish refractive index mismatch at the tissue/glass boundaries. The specimens were brought for spectrophotometer measurements promptly (within 15 min).
3 Results & discussions
3.1 Validation of the two-stage IAD algorithm
3.1.1 Computer simulations.
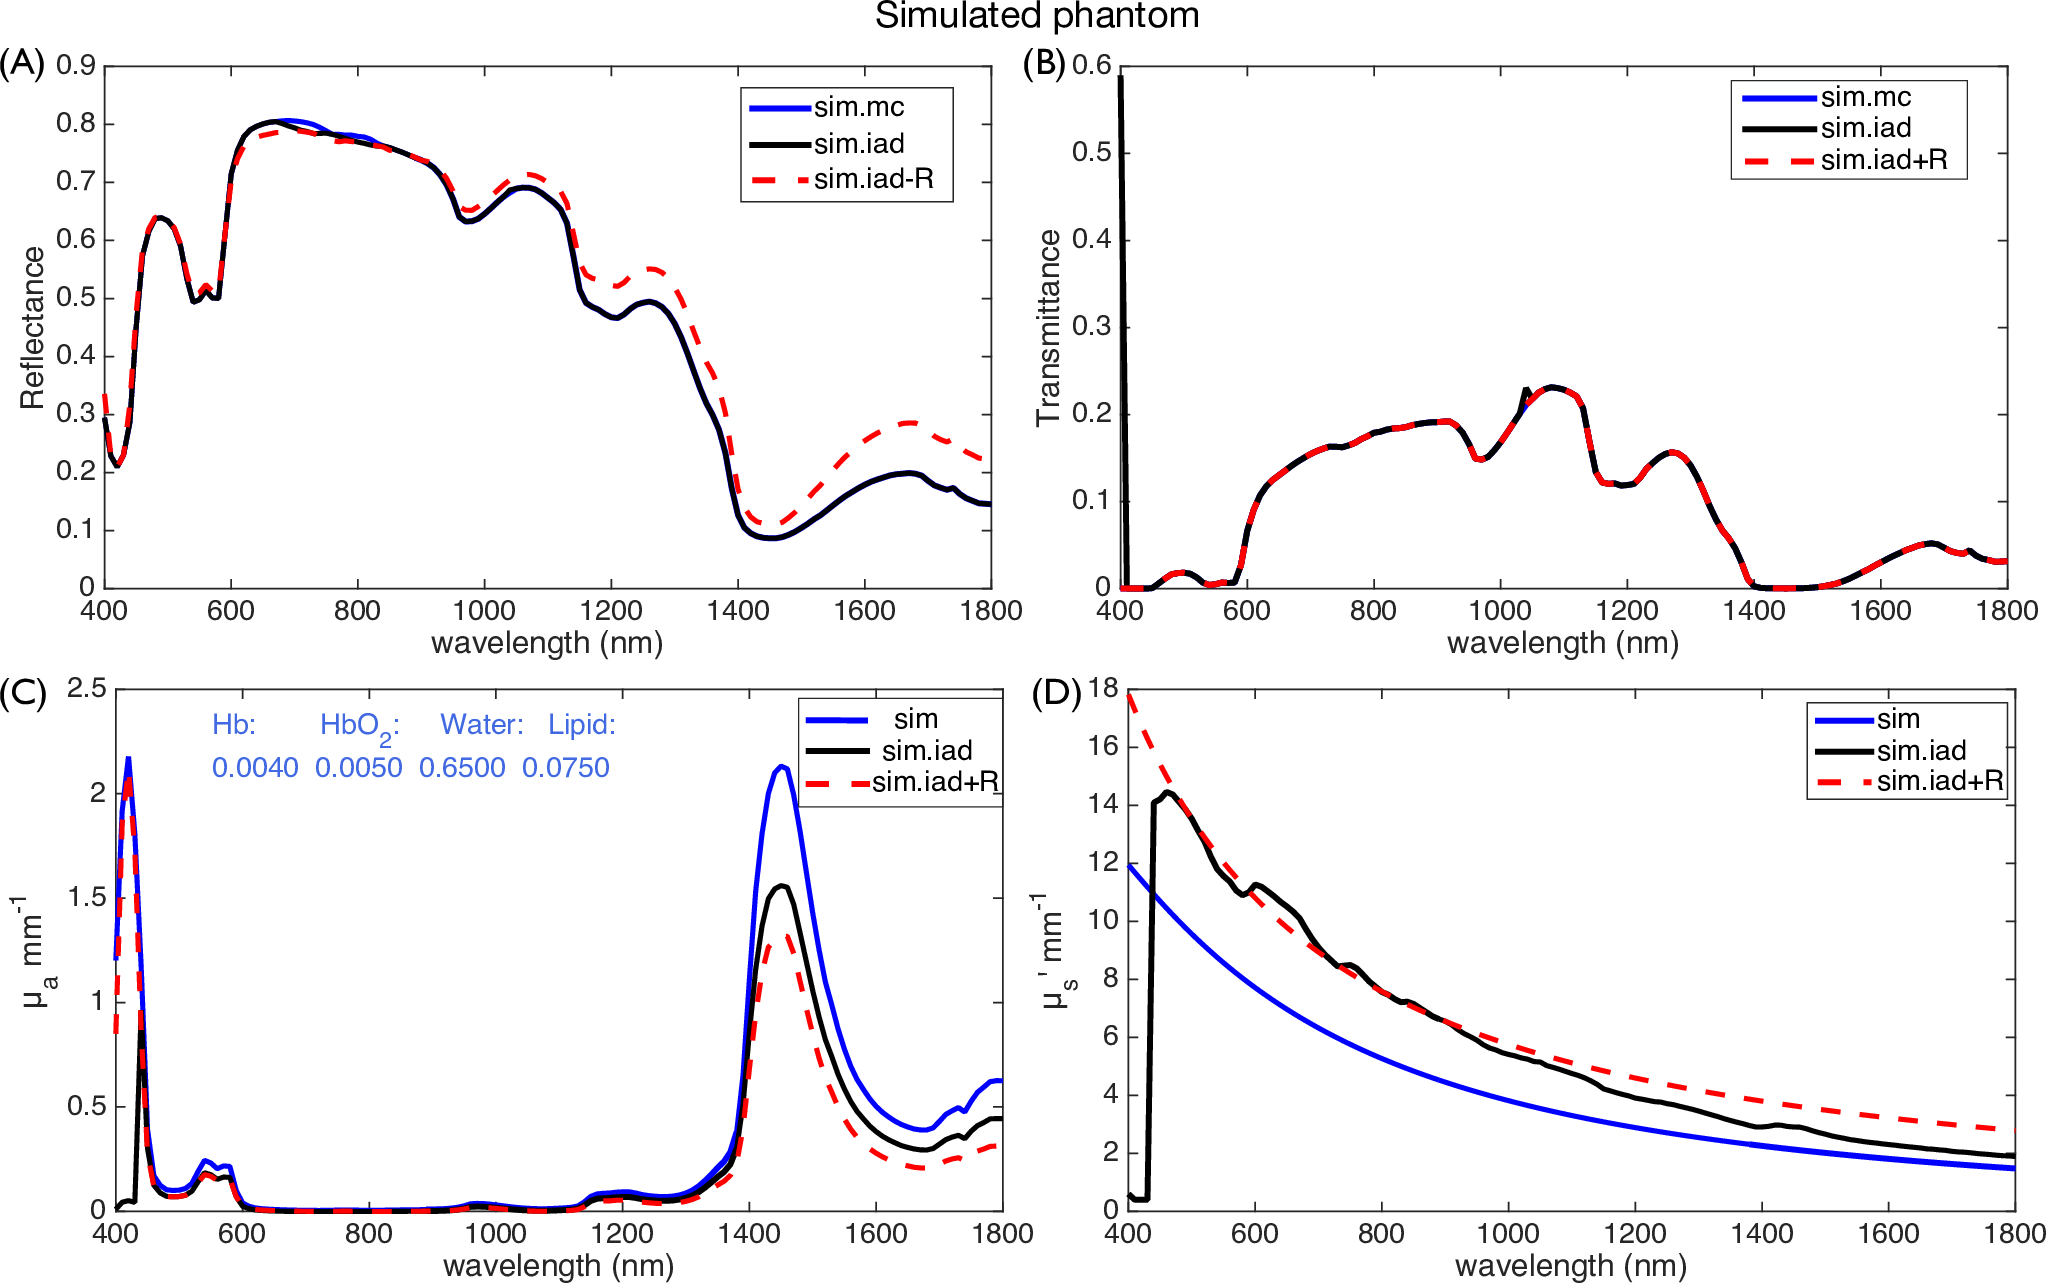
The computer simulated phantom comprised oxy- and deoxy- haemoglobin (HbO, Hb), water and lipid with given volume fractions as displayed in Figure 6. Results of absorption coefficient spectra and reduced scattering spectra () of the phantom using the proposed two-stage IAD process are presented in Figure 6. The values are compared to results by original IAD algorithm () and as well as the calculated expected values (). There is a noticeable discrepancy between the IAD derived and the calculated expected at which is affected by the cross-talk with as shown in Figure 6(C, D). The underestimated absorption is successfully corrected by applying the second stage of IAD as proposed. The corrected aligns greatly with the expected (Figure 6(C, D)). However, we noticed that in the longer wavelength region when there is noticeable discrepancy between the resulting values and the expected value. This is presumably caused by using the simple power law fitted as the constrain for the second stage of IAD computing, the residuals of the fitting model are higher at the longer wavelength range. Simulated transmittance spectra and reflectance spectra by using MCML algorithm and the values were derived with IAD algorithms are also presented in Figure 6(A, B). As a result of two-stage IAD the pronounced discrepancy of the transmittance spectra at was rectified. We also notice that mostly changed the reflectance spectra rather than transmission spectra.

3.1.2 Phantom experiments
Phantom set A-F were freshly produced and measured with the integrating sphere using the standard set-up. The phantom sample dimension was 40 mm (w) x 50 mm (h) x 2 mm (d) which was defined by the size of the sample chamber. A representative example (phantom set C) of the integration sphere measurements and calculated optical properties is shown in Figure 7. We compared the transmittance spectra and reflectance spectra calculated by using the IAD algorithm to the values from integrating sphere measurements and simulated values by using MCML algorithm (Figure 7(A, C), residuals are plotted in Figure 7(B, D). The absorption coefficient spectra and reduced scattering spectra (, ; , ) of phantom C are presented in Figure 7(E, G), and residuals as compared with expected values are plotted in Figure 7(F, H). For the absorption coefficient, the results from the two-stage IAD are compared to values obtained with original IAD algorithm () and as well as to the calculated expected values (), showing an improved mean MSE (averaged over all six phantom sets) from 0.6629 to 0.1469 and 0.1189 when using the Mie fitted scattering and Mie+Rayleigh fitted scattering respectively. There is an constant offset across whole spectrum between the and the calculated expected values (), which is likely due to 1) the discrepancy between Intralipid batches; 2) the variability of different models of estimating intralipid’s reduced scattering (SI Figure 2); 3) the model we used to create the expected reduced scattering values is given at the 600-1850 nm range. In addition, the Mie theory based fitting was done at to eliminate outliers caused by cross-talk, future works on using robust fitting on the whole wavelength range would reduce the discrepancy. Nevertheless, the peaks caused by cross-talk (420 nm, 630 nm and 1440 nm) in the reduced scattering spectrum were removed (as marked in Figure 7 with arrows.). We calculated the mean squared error, median value of the residual and Person’s correlation coefficient of each phantom experiment, their mean values averaged from six phantom sets are demonstrated in Table 3. The difference between the IAD calculated values and the expected values are reduced markedly for absorption and reduced scattering as reflected in the reduced MSE value, while the similarity between them are increased to yield a higher correlation score.
| MSE | Median | CC | ||||||||||
|---|---|---|---|---|---|---|---|---|---|---|---|---|
| R | T | R | T | R | T | |||||||
| IAD | 0.0008 | 0.0024 | 0.4977 | 0.4140 | 0.0076 | 0.3831 | 0.9955 | 0.9271 | 0.8739 | 0.8743 | ||
| RevIAD (Mie) | 0.0011 | 0.0008 | 0.3454 | 0.1359 | 0.0076 | 0.4309 | 0.9871 | 0.9929 | 0.9991 | 0.9685 | ||
| RevIAD (Mie+Rayleigh) | 0.0013 | 0.0008 | 0.2955 | 0.1246 | 0.0076 | 0.3568 | 0.9887 | 0.9929 | 0.9987 | 0.9709 | ||
MSE: Mean Squared Error, CC: Person Correlation Coefficient

3.2 Validation of the small sample kit method
The liquid phantom set B, E, F from the same freshly-prepared batch were then measured with the small sample kit. The phantom sample dimension was 7 mm (w) x 15 mm (h) x 2 mm (d) defined by the size of the sample chamber. As expected, the reflectance and transmittance spectra measured with small sample kits were lower than the ones with original set-ups, which were attributed to the light loss on the lateral sides of the sample. The distance () from the edge of the incident beam on the sample to the edge of the adapted integrating sphere transmittance ports were calculated as 1 mm for the 3 mm port and 1.5 mm for the 5 mm port. for the reflectance ports were calculated as 0.5 mm and 0.75 mm for the 3 mm port and 5 mm port, respectively. For the liquid phantom sample we used here, the value is greater than roughly at wavelength range . Consequently, the value is less than fives of resulting in noticeable light loss [18]. As shown in Figure 8, residuals in reflectance and transmittance measurements are noticeably larger than residuals in the calculated optical properties, suggesting that the IAD algorithm with MC as subroutine is able to consider the sample port size and incident light beam size and eliminate their influence on the resulting optical properties. However, as compared with measurement with original port, and obtained with either small size port still display an offset across entire spectra. This is likely because the lost light from the lateral sides of the sample and as well as on the sides of glass slides for sandwiching the sample can not be fully recovered by IAD. Vinvely et al. studied the lost light during IAD calculation in relation to the sample size (optical thickness, radial path length), beam size and sample port size [52]. They found when the incident beam had a diameter less than 80% of the sample length, the optical properties of the sample could be well estimated. The work from Prahl also demonstrated that the inherent limitation of IAD [53]. Our results are consistent with their findings that the inherent challenging of using the IAD on small samples can be addressed to some extent, and a quantified correction model to mitigate the light loss effects could be future directions.
3.3 Optical properties of fresh mouse tissues
Tissue specimens were measured with a spectrophotometer using our small sample kit: 3 mm port for the brain tissue and 5 mm port for the others. For IAD calculation the refractive index of brain tissue was selected at 1.36 [54], and the n value of muscle and liver tissue were selected at 1.37 [55, 56]. The anisotropy value g was fixed at 0.85 for all tissue types, this was chosen based on our calculation (SI Figure 3) as well as the reported values in previous works [27, 57, 58]. As shown in Figure 9, Figure 10 and Figure 11, the water absorption with maxima at 970, 1180, and 1440 nm are evident in the all tissue specimen. The total haemoglobin absorption bands with maxima at 420/430 and 550 nm present in the brain and muscle absorption spectrum with a lower magnitude as compared with the liver spectrum, which is because of the higher blood content in the liver tissue. However, liver’s absorption value at 420/430 nm is greatly lower than expected (as highlighted in red dash circle in Figure 11) which is presumably caused by extremely low transmittance (0) and thus can’t be accurately processed by IAD. Also, there is a noticeable peak in the liver’s absorption spectrum at 750 nm, corresponding to the de-oxygenated hemoglobin’s absorption peak at around 758 nm. This observation suggests that the animal’s blood oxygenation level was low when it was sacrificed, which coincides with the termination method of using . The reduced scattering coefficient decreases as wavelength increases and the spectra can be fitted with Mie and Rayleigh theory as discussed in Section 2.3.
We compared our results with data from related reported works in which fresh rat tissues have been investigated [18, 59, 60, 61], and these are included and plotted in Figure 9, Figure 10 and Figure 11 with respective symbols. For all tissue, the absorption coefficients and reduced scattering coefficients in the present work are generally in good agreement with the reported values. We also noted there are discrepancies in optical properties of liver tissue. The differences are within one order of magnitude which could possibly be caused by tissue variability and preparation variance.


4 Conclusions
The contributions of the present study are two folds: 1) the proposed two-stage IAD process is able to produce a revised absorption spectrum using the fitted reduced scattering as an input constraint at the second stage IAD; 2) the small sample kit allows characterisation of optical properties of small sized biological tissues ex vivo.
The revised absorption spectra as well as the fitted reduced scattering spectra were evaluated with both computer simulations and physical phantom experiments. Results were compared with expected values that were calculated using well-established equations. In general, the findings in the quantitative measures (Median of residuals, Mean Squared Error, and Pearson Correlation Coefficient) suggested that the revised absorption coefficients and fitted reduced scattering coefficients were closer to the expected values as compared to values obtained by original IAD algorithm. In regard to the small sample kit, the incident beam was condensed as small as possible given the limited space in the spectrophotometer’s sample chamber for modifying the optics. However, the results of using small sample kit, notably the absorption coefficients were higher (approx. 0.1 - 0.2 ) than the ones obtained using standard port. Even though, our measurements of animal tissue were comparable to those previously reported values. Future works would focus on provide a computer model that can simulate relations between sample port sizes and estimated optical properties to quantify the discrepancies.
Nevertheless,our proposed method of a two-stage IAD pipeline and small sample kit could be a useful and reliable tool to characterise optical properties of biological tissue ex vivo particularly when only small size samples are available. Our method and the associated data represent a valuable resource, which is being made publicly available, that can be used as comparison with other related works.
5 Disclosure
ME, JS, and TV are shareholders of Hypervision Surgical Ltd London, UK, and have an equity interest in the company. TV is a shareholder of Mauna Kea Technologies, Paris, France.
6 Reference
References
- [1] Xie Y, Bonin T, Loeffler S, Huettmann G, Tronnier V and Hofmann U G 2010 Fiber spectral domain optical coherence tomography for in vivo rat brain imaging Biophotonics: Photonic Solutions for Better Health Care II. ed Popp J, Drexler W, Tuchin V V and Matthews D L (SPIE) pp 77152F–77152F–9
- [2] Ebner M, Nabavi E, Shapey J, Xie Y, Liebmann F, Spirig J M, Hoch A, Farshad M, Saeed S R, Bradford R, Yardley I, Ourselin S, Edwards A D, Führnstahl P and Vercauteren T 2021 Journal of Physics D: Applied Physics 54 ISSN 13616463
- [3] Shapey J, Xie Y, Nabavi E, Bradford R, Saeed S R, Ourselin S and Vercauteren T 2019 Journal of Biophotonics 12 ISSN 18640648
- [4] Stummer W, Tonn J C, Goetz C, Ullrich W, Stepp H, Bink A, Pietsch T and Pichlmeier U 2014 Neurosurgery 74 310–319 ISSN 0148396X
- [5] Zharkikh E, Dremin V, Zherebtsov E, Dunaev A and Meglinski I 2020 Journal of Biophotonics 13 1–20 ISSN 18640648
- [6] Desroches J, Jermyn M, Pinto M, Picot F, Tremblay M A, Obaid S, Marple E, Urmey K, Trudel D, Soulez G, Guiot M C, Wilson B C, Petrecca K and Leblond F 2018 Scientific Reports 8 1–10 ISSN 20452322
- [7] Clancy N T, Soares A S, Bano S, Lovat L B, Chand M and Stoyanov D 2021 Biomedical Optics Express 12 7556 ISSN 2156-7085 URL https://www.osapublishing.org/abstract.cfm?URI=boe-12-12-7556
- [8] Sibai M, Wirth D J, Leblond F, Roberts D W, Paulsen K D and Wilson B C 2019 Journal of Biophotonics 1–6 ISSN 18640648
- [9] Tuchin V V 2015 Tissue Optics: Light Scattering Methods and Instruments for Medical Diagnosis (1000 20th Street, Bellingham, WA 98227-0010 USA: Society of Photo-Optical Instrumentation Engineers (SPIE)) ISBN 9781628415162 URL http://ebooks.spiedigitallibrary.org/content.aspx?doi=10.1117/3.684093.ch2http://ebooks.spiedigitallibrary.org/book.aspx?doi=10.1117/3.1003040
- [10] Bashkatov A N, Genina E A and Tuchin V V 2016 Tissue Optical Properties Handbook of Biomedical Optics ed Boas D A, Pitris C and Ramanujam N (CRC Press) chap Chapter 5, pp 67–100 ISBN 9781420090376 URL https://www.taylorfrancis.com/books/9781420090376
- [11] Prahl S A, van Gemert M J C and Welch A J 1993 Applied Optics 32 559 ISSN 0003-6935
- [12] Madsen S J and Wilson B C 2013 Optical Methods and Instrumentation in Brain Imaging and Therapy (New York, NY: Springer New York) ISBN 978-1-4614-4977-5 URL http://link.springer.com/10.1007/978-1-4614-4978-2
- [13] Rejmstad P, Zsigmond P and Wårdell K 2017 Optics Express 25 8192 ISSN 1094-4087
- [14] Crane N J, Huffman S W, Gage F A, Levin I W and Elster E A 2003 Journal of Biomedical Optics 18 035001–7
- [15] Giannoni L, Lange F and Tachtsidis I 2018 Journal of Optics (United Kingdom) 20 44009 ISSN 20408986 URL http://dx.doi.org/10.1088/2040-8986/aab3a6
- [16] Nachabé R, Hendriks B H W, van der Voort M, Desjardins A E and Sterenborg H J C M 2010 Biomedical Optics Express 1 1432 ISSN 2156-7085
- [17] Wisotzky E L, Uecker F C, Dommerich S, Hilsmann A, Eisert P and Arens P 2019 Journal of Biomedical Optics 24 1 ISSN 1560-2281
- [18] Mesradi M, Genoux A, Cuplov V, Haidar D A, Jan S, Buvat I, Pain F, Mesradi M, Genoux A, Cuplov V, Haidar D A, Jan S and Pain F 2013 Journal of biomedical optics 18 117010
- [19] Jernshøj K D and Hassing S 2009 Applied Spectroscopy 63 879–888 ISSN 00037028
- [20] Gaigalas A K, Wang L and Choquette S 2013 Journal of Research of the National Institute of Standards and Technology 118 1–14 ISSN 21657254
- [21] Jang H, Joshua Pfefer T and Chen Y 2015 Optics Letters 40 4321 ISSN 0146-9592
- [22] Dantuma M, van Dommelen R and Manohar S 2019 Biomedical Optics Express 10 5921 ISSN 2156-7085 URL https://www.osapublishing.org/abstract.cfm?URI=boe-10-11-5921
- [23] Rehman A u, Ahmad I and Qureshi S A 2020 Photodiagnosis and Photodynamic Therapy 31 ISSN 18731597
- [24] Kanniyappan U, Wang B, Yang C, Ghassemi P, Litorja M, Suresh N, Wang Q, Chen Y and Pfefer T J 2020 Medical Physics 47 3389–3401 ISSN 0094-2405 URL https://onlinelibrary.wiley.com/doi/10.1002/mp.14189
- [25] Shapey J, Xie Y, Nabavi E, Ebner M, Maneas E, Saeed S R, Dorward N, Kitchen N, Desjardins A E, Ourselin S, Jaunmuktane Z, Brandner S, Bradford R and Vercauteren T 2020 Spie
- [26] Shapey J, Xie Y, Nabavi E, Ebner M, Saeed S R, Kitchen N, Dorward N, Grieve J, McEvoy A W, Miserocchi A, Grover P, Bradford R, Lim Y M, Ourselin S, Brandner S, Jaunmuktane Z and Vercauteren T 2021 Journal of Biophotonics Under revi
- [27] Gebhart S C, Lin W C and Mahadevan-Jansen A 2006 Physics in Medicine and Biology 51 2011–2027 ISSN 00319155
- [28] Seber G A F and Wild C J 1989 Nonlinear Regression Wiley Series in Probability and Statistics (Hoboken, NJ, USA: John Wiley & Sons, Inc.) ISBN 9780471725312 URL http://doi.wiley.com/10.1002/0471725315
- [29] Jacques S L 2013 Physics in Medicine and Biology 58 ISSN 00319155
- [30] L Wang, S L Jaques and L Zheng 1995 Computer Methods and Programs in Biomedicine 47 131–146
- [31] Wang L, Jacques S L and Zheng L 1997 Computer Methods and Programs in Biomedicine 54 141–150 ISSN 01692607 URL https://linkinghub.elsevier.com/retrieve/pii/S0169260797000217
- [32] Nachabé R, Hendriks B H W, Desjardins A E, van der Voort M, van der Mark M B and Sterenborg H J C M 2010 Journal of Biomedical Optics 15 037015 ISSN 10833668
- [33] Aernouts B, Van Beers R, Watté R, Lammertyn J and Saeys W 2014 Optics Express 22 6086 ISSN 1094-4087
- [34] Michels R, Foschum F and Kienle A 2008 Optics Express 16 5907 ISSN 1094-4087 URL https://www.osapublishing.org/oe/abstract.cfm?uri=oe-16-8-5907
- [35] Di Ninni P, Bérubé-Lauzière Y, Mercatelli L, Sani E and Martelli F 2012 Applied Optics 51 7176 ISSN 1559-128X
- [36] Spinelli L, Botwicz M, Zolek N, Kacprzak M, Milej D, Sawosz P, Liebert A, Weigel U, Durduran T, Foschum F, Kienle A, Baribeau F, Leclair S, Bouchard J P, Noiseux I, Gallant P, Mermut O, Farina A, Pifferi A, Torricelli A, Cubeddu R, Ho H C, Mazurenka M, Wabnitz H, Klauenberg K, Bodnar O, Elster C, Bénazech-Lavoué M, Bérubé-Lauzière Y, Lesage F, Khoptyar D, Subash A A, Andersson-Engels S, Di Ninni P, Martelli F and Zaccanti G 2014 Biomedical Optics Express 5 2037 ISSN 2156-7085
- [37] Krauter P, Nothelfer S, Bodenschatz N, Simon E, Stocker S, Foschum F and Kienle A 2015 Journal of Biomedical Optics 20 105008 ISSN 1083-3668
- [38] Samkoe K S, Bates B D, Tselepidakis N N, DSouza A V and Gunn J R 2017 Journal of Biomedical Optics 22 1 ISSN 1560-2281
- [39] Fredriksson I, Saager R B, Durkin A J and Strömberg T 2017 Journal of Biomedical Optics 22 1 ISSN 1560-2281
- [40] Di Ninni P, Martelli F and Zaccanti G 2011 Biomedical Optics Express 2 2265 ISSN 2156-7085
- [41] Haj-Hosseini N, Kistler B and Wårdell K 2014 Development and characterization of a brain tumor mimicking fluorescence phantom Proceedings of SPIE vol 8945 ed Nordstrom R J, Bouchard J P and Allen D W p 894505 ISBN 9780819498588 ISSN 16057422 URL http://proceedings.spiedigitallibrary.org/proceeding.aspx?doi=10.1117/12.2039861
- [42] James J, Murukeshan V M and Woh L S 2014 Biomedical Optics Express 5 2135 ISSN 2156-7085
- [43] Ghassemi P, Wang J, Melchiorri A J, Ramella-Roman J C, Mathews S A, Coburn J C, Sorg B S, Chen Y and Pfefer T J 2015 Journal of Biomedical Optics 20 1 ISSN 1083-3668
- [44] Rejmstad P, Johansson J D, Haj-Hosseini N and Wårdell K 2017 Journal of Biophotonics 10 446–455 ISSN 1864063X URL https://onlinelibrary.wiley.com/doi/10.1002/jbio.201500334
- [45] Pogue B W and Patterson M S 2006 Journal of Biomedical Optics 11 041102 ISSN 10833668
- [46] Lamouche G, Kennedy B F, Kennedy K M, Bisaillon C E, Curatolo A, Campbell G, Pazos V and Sampson D D 2012 Biomedical Optics Express 3 1381 ISSN 2156-7085
- [47] Du Le V N, Nie Z, Hayward J E, Farrell T J and Fang Q 2014 Biomedical Optics Express 5 2726 ISSN 2156-7085 URL https://www.osapublishing.org/boe/abstract.cfm?uri=boe-5-8-2726
- [48] Cruz-Landeira A, Bal M J, Quintela O and López-Rivadulla M 2002 Journal of Analytical Toxicology 26 67–72 ISSN 01464760
- [49] Zijlstra W G and Buursma A 1997 Comparative Biochemistry and Physiology - B Biochemistry and Molecular Biology 118 743–749 ISSN 03050491
- [50] Horinek D 2014 DLVO Theory Encyclopedia of Applied Electrochemistry ed Kreysa G, Ota K i and Savinell R F (New York, NY: Springer New York) pp 343–346 ISBN 978-1-4419-6996-5 URL https://doi.org/10.1007/978-1-4419-6996-5_7http://link.springer.com/10.1007/978-1-4419-6996-5_7
- [51] Aernouts B, Zamora-Rojas E, Van Beers R, Watté R, Wang L, Tsuta M, Lammertyn J and Saeys W 2013 Optics Express 21 32450 ISSN 1094-4087
- [52] Vincely V D and Vishwanath K 2020 Lateral light losses in integrating sphere measurements: comparison of Monte-Carlo with inverse adding-doubling algorithm Design and Quality for Biomedical Technologies XIII vol 11231 ed Pfefer T J, Hwang J and Vargas G International Society for Optics and Photonics (SPIE) p 15 ISBN 9781510632257 URL https://doi.org/10.1117/12.2546265https://www.spiedigitallibrary.org/conference-proceedings-of-spie/11231/2546265/Lateral-light-losses-in-integrating-sphere-measurements--comparison-of/10.1117/12.2546265.full
- [53] Prahl S A 2011 Oregon Medical Laser Center, St. Vincent Hospital 1344 1–74 URL http://omlc.ogi.edu/software/iad
- [54] Binding J, Ben Arous J, Léger J F, Gigan S, Boccara C and Bourdieu L 2011 Optics Express 19 4833 ISSN 1094-4087
- [55] Giannios P, Toutouzas K G, Matiatou M, Stasinos K, Konstadoulakis M M, Zografos G C and Moutzouris K 2016 Scientific Reports 6 1–10 ISSN 20452322
- [56] Tuchina D K, Bashkatov A N, Genina E A and Tuchin V V 2015 Journal of Innovative Optical Health Sciences 8 ISSN 17937205
- [57] Honda N, Ishii K, Kajimoto Y and Kuroiwa T 2018 Journal of Biomedical Optics 23 1 ISSN 1560-2281
- [58] Tuchin V V 2007 Optical Properties of Tissues with Strong (Multiple) Scattering Tissue Optics (1000 20th Street, Bellingham, WA 98227-0010 USA: SPIE) chap chapter 1, pp 3–142 URL http://ebooks.spiedigitallibrary.org/content.aspx?doi=10.1117/3.684093.ch1
- [59] Golovynskyi S, Golovynska I, Stepanova L I, Datsenko O I, Liu L, Qu J and Ohulchanskyy T Y 2018 Journal of Biophotonics 11 1–12 ISSN 18640648
- [60] Nilsson A M K, Berg R and Andersson-Engels S 1995 Applied Optics 34 4609 ISSN 0003-6935
- [61] Parsa P, Jacques S L and Nishioka N S 1989 Applied Optics 28 2325 ISSN 0003-6935