Studies of Cepheus X-4 during 2018 outburst observed with AstroSat
Abstract
We present timing and spectral results of 2018 outburst of Cepheus X-4, observed twice by AstroSat at luminosity of erg s-1 and erg s-1 respectively. The light curves showed strong pulsation and co-related X-ray intensity variation in SXT (0.5–8.0 keV) and LAXPC (3–60 keV) energy bands. Spin-period and spin-down rate of the pulsar were determined from two observations as s , Hz s-1 at an epoch MJD 58301.61850 and s, Hz s-1 for an epoch MJD 58307.40211. Pulse-shape studies with AstroSat showed energy and intensity dependent variations. The pulsar showed an overall continuous spin-down, over 30 years at an average-rate of Hz s-1, attributed to propeller-effect in the subsonic-regime of the pulsar, in addition to variations during its outburst activities. Spectra between 0.7–55 keV energy band were well fitted by two continuum models, an absorbed compTT-model and an absorbed power-law with a Fermi-Dirac cutoff (FD-cutoff) model with a black-body. These were combined with an iron-emission line and a cyclotron absorption line. The prominent cyclotron resonance scattering features with a peak absorption energy of keV and keV for FD-cutoff-model and keV and keV for compTT-model were detected during two AstroSat observations. These when compared with earlier results, showed long term stability of its average value of keV. The pulsar showed pulse-phase as well as luminosity dependent variations in cyclotron-line energy and width and in plasma optical-depth of its spectral continuum.
I Introduction
X-ray pulsars offer vital information through studies of their pulse characteristics about their nature and geometry of the binary system. The shape of the pulse profile offers insight about mode of accretion inflows, its luminosity, geometry of accretion column and its magnetic field configuration (Parmar et al. 1989a). Therefore, such studies offer understanding of its pulsar system and the process of mass accretion in the presence of strong magnetic field of the neutron star. Detailed studies on pulse characteristics were conducted during outburst activities of some of the pulsars earlier such as EXO 2030+375 (Parmar et al. 1989a), Cepheus X-4 (Koyama et al. 1991; Mihara et al. 1991; Mukerjee et al. 2000), XTE J1946+274 (Paul et al. 2001) etc., which offered valuable information and understanding of physical processes responsible for the observed properties of these pulsars. Spectroscopic studies, on the other hand, reveal environment surrounding the pulsar and the underlying mechanism responsible for energy generation in these systems. Detailed studies on cyclotron absorption features, if present in the pulsar spectrum, not only enable us to determine its surface magnetic field, but also offers an insight into the line producing region, its structure and geometry of the accretion column (Staubert et al. 2019). Therefore, detailed studies of cyclotron absorption features are being pursued by researchers since its discovery (Truemper et al. 1978) as it is an important diagnostic probe for pulsars. Cyclotron absorption features were detected in the spectrum of many Be-binaries covering a wide range of energies, starting from a lower energy of keV (DeCesar et al. 2013; Jun et al. 2012) to a higher energy at keV (La Barbara et al. 2001). Detailed studies of cyclotron line sources and their properties were reported by Staubert et al. 2019 and Maitra 2017. The Be-binaries, particularly because of their transient nature, offer us opportunities of detailed studies of some of these interesting properties with change in source luminosity and in time. The studies on cyclotron-line energy with respect to its pulse-phase, source luminosity and with time, showed a wide variations for some sources, such as Vela X-1, Cen X-3 and Her X-1 (Staubert et al. 2019). These interesting properties help us to systematically investigate and understand their underlying physical properties.
A Be-binary pulsar system is a class of high mass X-ray binary, where a neutron star has a Be-star as its companion, shows significant variations of the source luminosity and pulse period during its outburst activity. The stellar wind from rapidly rotating Be-stars are highly asymmetric and frequently form equatorial accretion disc around the Be-star. Such systems typically have a large orbital eccentricity resulting from relatively recent supernova explosion. The presence of these two features, equatorial disc and large eccentricity, enables the matter to accrete on to the neutron star directly from the equatorial Be-star disc during its periastron passage. This results in a short duration outburst due to enhanced accretion on to the neutron star and cause increase in the observed X-ray flux by several orders of magnitude, typically up to erg s-1. Such outburst events occur in a particular phase of the orbit and are identified as a Type-I outburst. In addition to such events, there are Type-II outbursts, which are due to a sudden increase in amount of matter in the circumstellar disc surrounding the Be-star, which can occur at any orbital phase (Okazaki et al. 2001; Okazaki et al. 2002; Okazaki 2016). The duration of Type-II outbursts varies from weeks to months, during which the source X-ray luminosity can reach the Eddington limit, erg s-1 Reig (2011). Therefore, Be-binary systems in particular, offer the best opportunities for studies of variation of pulse characteristics and spectral behavior of sources with change in source luminosity during its outburst activity. Hence, many Be-binaries were observed over the period during outbursts and offered interesting results for understanding accretion theory (Bildsten et al. 1997; Reig 2011). The Cepheus X-4 is one such interesting Be-binary pulsar which showed rare and long outburst of about 40 days in a span of about 4–5 years and was observed and studied by many observatories from time to time during its outburst activities.
Cepheus X-4 was discovered by X-ray telescope of OSO-7 as a transient source during June–July, 1972 (Ulmer et al. 1973). Ginga observed the source during March 1988 outburst and detected spin period of 66.25 s of its neutron star for the first time (Koyama et al. 1991). Spectroscopic studies from the same Ginga observations lead to detection of cyclotron resonance scattering feature corresponding to a centroid energy at keV (Mihara et al. 1991). The ROSAT observations during June 1993 outburst refined the source coordinates and also determined its pulsar spin period (Schulz et al. 1995). The observations by BATSE during June–July 1993 and during subsequent outburst of June–July 1997 which was also followed by RXTE, determined pulse characteristics of Cepheus X-4. Additionally, a possible range of its orbital period from 23–147.3 days was suggested using RXTE data (Wilson et al. 1999). From observed characteristic features and outburst activities, it was predicted that Cepheus X-4 could possibly have a massive early type Be-star with its circumstellar disk as a companion, which was thought as most likely cause for its long outburst of about 40 days, as seen for other Be-binaries. Optical observations of Cepheus X-4 subsequently confirmed it as a Be-binary system and estimated its location at a distance of kpc (Bonnet-Bidaud and Mouchet 1998). But this distance estimate was later challenged by Riquelme et al. 2012 who proposed a distance of either 7.9 or 5.9 kpc according to whether the stellar type of the companion is a B1 or B2 star, respectively. The distance of Cepheus X-4 was later reported by Gaia at kpc (Malacaria et al. 2020). Luminosity dependent changes in the pulse profile of Cepheus X-4 were studied during declining phase of 1997 outburst (Mukerjee et al. 2000) by combining observations by Indian X-ray Astronomy Experiment (Agrawal et al. 1997) along with RXTE (Rothschild et al. 1998). The RXTE observed another outburst in 2002 and re-established its cyclotron resonance feature corresponding to its centroid energy at keV (as established earlier by Ginga) which did not show a significant dependence on X-ray luminosity, although the continuum became harder with increasing source luminosity (McBride et al. 2007). The source went into outburst again in 2014 and was observed with the Nuclear Spectroscopic Telescope Array (NuSTAR), (Harrison et al. 2013) and Suzaku (Mitsuda et al. 2007). Results obtained from Suzaku observation of the 2014 outburst, overlapped with NuSTAR second observation on July 1–2, 2014, which detected additional absorption feature at keV in the phase-resolved spectra of the pulsar, which was identified as the first harmonic of the fundamental cyclotron line detected at keV (Jaiswal et al. 2015). The source spectra obtained from NuSTAR observations of 2014 were well fitted by Fermi-Dirac cutoff (FD-cutoff) model along with iron emission line and cyclotron absorption feature was clearly detected in both the observations at keV and keV, respectively. Although, the averaged source luminosity was different by a factor of about 3 between these two observations, however it only showed marginal variation in its centroid energy (Furst et al. 2015). Using same observations of NuSTAR of 2014 outburst (Vybornov et al. 2017) reported that spectrum of Cepheus X-4 showed two cyclotron resonance scattering features, the fundamental line at keV and its harmonic at keV. They also showed that the energy of the fundamental cyclotron absorption feature increases and the continuum becomes harder with increasing X-ray luminosity. Pulse phase resolved spectroscopic studies of Cepheus X-4 were conducted by Bhargava et al. 2019 at these two different intensities of the source using same two observations of NuSTAR of 2014 outburst. It was found that the observed cyclotron line profile of Cepheus X-4 was of asymmetric shape for phase averaged spectrum. However, for phase resolved spectra, a single symmetric cyclotron profile fitted the data well. The spectral continuum and parameters of the cyclotron line, showed some variations with respect to the pulse phase only within a limited pulse-phase (Bhargava et al. 2019).
Motivated with further studies and investigations on timing and spectroscopic properties of Cepheus X-4 during its latest 2018 outburst, AstroSat observed the source, on July 2 and again on July 8, during the declining phase of the outburst at two different source luminosities. Results obtained from these studies on timing and spectral properties of Cepheus X-4 at two different source luminosity during 2018 outburst are presented in this paper. The rest of the paper is organized such that Section 2 describes the observations and data analysis including software tools used, Section 3 describes the results and then implications of these results are discussed in Section 4. Finally, the conclusions drawn from this study are summarized in Section 5.

II Observations and Data Analysis
Cepheus X-4 had another long outburst during June–July, 2018 as its latest event, as seen in the Swift-BAT intensity curve shown in Figure 1. The peak of the outburst was approximately determined by fitting a combination of two Lorentzian to the Swift-BAT intensity curve. The peak of the outburst occurred at MJD 58298.37 when the source intensity was about 60 mCrab (Swift-BAT 0.01308 cts cm-2 s-1) in the 15–50 keV energy band as determined from the fitted model. AstroSat observed the source twice during its declining phase of the 2018 outburst under target of opportunity observation (TOO). First observation was made during July 2–3, 2018 between MJD 58301.61850 and 58302.56154 with an Obsid T02_055T01_9000002206. This was followed by the second observation during July 8–9, 2018 between MJD 58307.40211 and 58308.60036 with an Obsid T02_057T01_9000002212. The start and end times of these observation intervals are marked by consecutive dashed vertical lines on Swift-BAT light curve in Figure 1. The source intensity during these two observations were about 52 mCrab and 27 mCrab, respectively in the Swift-BAT energy band. The Swift-BAT light curve was obtained from Archive11 1 https://swift.gsfc.nasa.gov/results/transients/index.html and relevant descriptions about these light curves are given by Krimm et al. 2013. The outburst of 2018 and the earlier outburst of 2014, lasted for about the same duration of days but peak intensity of the 2018 outburst mCrab (Figure 1), was lower compared to mCrab during 2014 in the 15–50 keV energy band of the Swift-BAT (Furst et al. 2015). AstroSat observed the source during the outburst about 3-days and 9-days after attaining its peak luminosity, which is about 87% and 45% of its observed peak luminosity.
During the two AstroSat observations of Cepheus X-4, the Large Area X-ray Proportional Counter (LAXPC) was used as the prime instrument for data acquisition. The LAXPC and its capabilities are well described by Antia et al. 2017 and can be referred for details. During these observations only LAXPC20 was working nominally and was operated in its event-analysis mode. As LAXPC10 was operated at a very low gain hence data were not utilized for our studies. An average source count-rate of 158 cts s-1 and 77 cts s-1 were detected by LAXPC20 in the 3–60 keV energy band. Total effective exposure for two observations of LAXPC were 44 ks and 54 ks respectively. The Soft X-ray Telescope (SXT) was operated in its photon counting mode during both observations, with an effective exposure of about 20 ks and 29 ks. An average count-rate of cts s-1 and cts s-1, were detected in SXT during two observations respectively in the 0.5–8 keV energy band. The SXT payload and its read-out modes are described by Singh et al. 2016. The data from the AstroSat SXT and LAXPC20 were combined for detailed timing and spectroscopic studies in 0.3--60 keV energy band. AstroSat data of these TOO proposals are available in the public domain at the AstroSat Data Archive22 2 https://astrobrowse.issdc.gov.in/astro_archive/archive/Home.jsp.
The pipeline software version laxpcsoftv3.433 3 https://www.tifr.res.in/astrosat_laxpc/LaxpcSoft.html was used for the analysis of LAXPC data. The pipeline software runs by taking the required input files from its well defined directory structure which includes level-1 data files, calibration and background files for generation of level-2 data products. These included light curves in the desired energy band and its full range of spectrum. The required background files are supplied along with the software. The software itself offers guidance for selection of a suitable background as well as a response file which may be used for further analysis. The background observation of August, 2018 was used for this analysis to estimate the contribution from the source. The background observation of July 2018 as recommended for use by the pipeline software was avoided as it posed problems particularly at energies of 30 keV and above, as the model under-predicted the background counts affecting source contributions. The July 2018 background observations was most likely affected due to occurrence of a geomagnetic storm, hence was not considered. The pipeline software was executed with default values of all the input parameters. We have considered all the events from main anodes from each layer of LAXPC20. Appropriate energy channels were selected during the software run for extracting light curves for a required energy band. Gain corrections are applied automatically by the pipeline software itself to account for any shift in the gain between the source and background, based on calibration data. Thus the pipeline generates calibrated spectrum and background subtracted light curves of the source within its selected energy band for further analysis of the data using other astronomical software as mentioned later.
The pipeline analysis software specifically designed for SXT was used. The latest version of the software AS1SXTLevel2-1.4b, available at its payload operation center site44 4 https://www.tifr.res.in/astrosat_sxt/index.html was used. The software includes other files such as spectral response, auxiliary response and background files, those are required for spectral data analysis. The SXT calibration files are accessed automatically by the software from its well organized directory structure during its execution. The SXT level-1 data along with House Keeping and calibration files are taken as input by the analysis software and produce cleaned and calibrated events lists. The ultimate data products such as spectrum, light curve and image were produced by the pipeline software, by filtering and screening of the events, for a set of default parameters. A circular region of interest of 6 arc minutes radius was considered with respect to the source center, for extraction of photon events for this analysis, covering all the grades between 0–12. We thus generated spectrum and light curves in different energy bands covering 0.3–8.0 keV. The version 2.4c of the Xselect tool was used for screening of the data. Timing analysis was performed after delay time corrections applied to all the events with respect to the solar system barycenter for both SXT and LAXPC data, using a tool as1bary55 5 https://astrosat-ssc.iucaa.in/?q=data_and_analysis, developed by the AstroSat science support cell.
Astronomical software HEASoft version 6.14 was employed for the higher level analysis of AstroSat data. The timing analysis was done using software tools lcurve, efsearch and efold etc. of Xronos 5.22 package. The spectral data were analyzed using Xspec software version 12.8.1. The standard spectral models supplied by the Xspec software were used. Additionally, a Fermi-Dirac cuttoff model was defined and used in combination with other Xspec models which are described below. All these results are presented in the following section.


III Results
III.1 X-ray Light curve and Pulse Period determination
Light curves of Cepheus X-4 in 3–60 keV energy band from LAXPC20 with 1 s time bin
showed regular and strong 66 s pulsations along with variation in its intensity.
A time segment of X-ray light curves after applying the solar system barycentric time correction,
for both SXT and LAXPC20 with 133 s binning are shown from the observations of
July 2–3, 2018 (Figure 2-left panel) and of July 8–9, 2018 (Figure 2-right panel).
Start time for these two observations are at MJD 58301.61850 and
MJD 58307.40211, respectively.
The binning of 133 s, which is twice the pulse period was applied to the light curve to detect source flaring and
dipping activities by suppressing observed intensity variations due to spin-pulses and pulse to pulse variations
in the high time resolution light curve and to improve on statistical fluctuations.
Sudden flaring and dips were clearly seen in the light curves of SXT and LAXPC20
as can be seen in the Figure 2 along with its usual intensity variations during
AstroSat observations. These variations are typical property of a Be-binary pulsar
and is also observed in the case of Cepheus X-4 during AstroSat observations.
Using photon arrival time delay corrected light curves, first, average spin-period of the pulsar was determined using epoch folding technique for each of these two AstroSat observations along with its estimated 1- error as s and s respectively. The uncertainties are the estimated 1- errors from Gaussian function fit to the values of calculated versus a range of period curve, where best-period is chosen corresponding to the Gaussian peak (Pravdo & Ghosh 2001). The estimated errors so derived are rather an over estimate of the measurement errors. From the difference of these spin periods, an average spin-down rate of the order of Hz s-1 was determined for the purpose of an initial information. Now, the pulsar spin period was determined with higher precision, at an epoch corresponding to the start of the observation at along with its time derivative independently for two observations, by applying the phase correction technique using
| (1) |
where is the phase which covers the range 0–1 of the period, is the phase, is the spin frequency and is its time derivative, all corresponding to the start time . The fit was performed by fitting a periodic signal and considering reasonable numbers of harmonics of the basic spin frequency using
| (2) |
where is the observed count rate, is the number of harmonics included in the fit and are the coefficients fitted, apart from and . The light curve with a time resolution of 1 s was obtained for the analysis. The best fitted values for spin-frequency and its derivative were determined by minimizing deviation of the light curve from the model defined by Eq. 2. Different number of harmonics were tried and it was found that is adequate to define the signal appropriately for the analysis. Monte Carlo simulations were done to determine errors in the fitted values of and . The simulations were performed by perturbing and repeating the process for 4000 different realization of noise and thus 90% confidence limits for the parameters were determined. The program was also used to extract data for pulse-profile generation and to define good time intervals for different phase intervals for extraction of spectra using the fitted values of parameters, for studies of phase resolved spectroscopy. The fitted value of the spin-period of the pulsar and its spin-up rate were determined as s and Hz s-1 corresponding to MJD 58301.61850 for the first AstroSat observation. Whereas for the second observation, it was determined as and Hz s-1 at an epoch MJD 58307.40211. The quoted error denotes 90% confidence limit for both the observations. The effect of orbital motion on these parameters could not be determined, as orbit of this binary is still unknown.


III.2 Pulse profiles and Pulse fraction Measurements
Light curves were extracted corresponding to different energy bands and barycentric corrections were applied. Respective pulse profiles were derived by folding corresponding light curves with its derived spin-period and its derivative for the two observations. Small phase-shifts were applied to the corresponding start of the epochs to match the phase of these pulse profiles for the two observations. Pulse profiles were derived for observation-1, using 3–60 keV light curve of LAXPC20 first, such that the minimum of the profile corresponds to pulse phase 0.5. Same reference epoch was used for folding 0.3–8 keV SXT light curve for observation-1. Similar procedure was followed for observation-2. Two cycles of all such pulse-profiles are shown in Figures for clarity. The pulse profiles showed mainly two prominent pulses, the pulse between the phase 0.5–1.0 (1.5–2.0) covers the primary-pulse and phase between 0.0–0.5 (1.0–1.5) the secondary-pulse, as can be seen in Figure 3. Folded pulse-profiles showed variation at different energy with respect to the pulsar spin-phase. The average pulse-profile for both observations covering energy band between 0.3–8 keV of SXT and between 3–60 keV of LAXPC20 are overlayed in the Figure 3 for relative comparison. The relative intensities of primary pulse compared to its secondary showed increase with decrease in source luminosity at both energy bands 0.3–8 keV (left panel) and 3–60 keV (right panel) as can be seen in Figure 3. For detailed comparison, we derived pulse profiles at 7-different energy bands between 0.5–60 keV from two AstroSat observations and results are shown in Figure 4 for observation-1 (left panel) and observation-2 (right panel). The pulse profile between 0.5–3 keV energy band was derived from SXT data, where both the pulses, primary and secondary showed multiple structures at lower energy bands and are most prominent between 0.5–3.0 keV. Where as for higher energy bands, it showed two pulses with change in its relative intensities depending on energy and source luminosity. The relative intensity of primary pulse increases with energy and the secondary pulse becomes gradually narrower. Moreover, the sharp narrow dip at lower energies changes to a smoother and broader shape connecting primary and secondary pulses as can be seen during both the observations. It is also noticed that the presence of multiple structures and absorption dips of both primary and secondary pulses as seen at lower energies, gradually merged into a double-pulse profile with gradual increase in the energy and then becomes asymmetric and broad with smoothening of the dip joining primary and secondary at higher energies. We also noticed that for observation-2 at lower luminosity the primary pulse becomes relatively stronger than the secondary pulse in contrast to observation-1 for higher source luminosity.
Pulse profiles showed remarkable variability in shape and its
pulse-fraction with respect to energy and source luminosity as seen in Figure 4 and
Figure 5 respectively.
The RMS pulse fraction varied from about % at 3–6 keV,
% at 15–20 keV and % at 30–60 keV during observation-1.
The corresponding measurements for observation-2 showed %,
% and %, respectively.
Pulse-profiles derived from recent AstroSat observations are though
similar in shape but structures can be seen more clearly, as compared to those reported from
November 28, 1996 RXTE observation between 2–60 keV during its earlier
outburst (Wilson et al. 1999).
RMS pulse fraction measurements from 2 outbursts of Cepheus X-4, observed by
NuSTAR in 2014 and with AstroSat in 2018, are shown in Figure 5.
The pulse shape and pulse fractions measurements
of AstroSat observation-2 corresponding to 27 mCrab Swift-BAT intensity in 15-50 keV energy band,
showed consistency with the
NuSTAR observation at similar intensity during 2014 outburst (Bhargava et al. 2019).
These plots show that the RMS pulse fraction varies with both the energy and the source intensity.
The pulse fraction measurements starting from highest intensity of source at 72 mCrab showed gradual
increase as source intensity decrease to 52 mCrab and 27 mCrab attaining its peak-value around 20 keV.

III.3 Spectrum and Cyclotron Resonance Scattering feature
AstroSat observations enabled us to derive X-ray spectrum in 0.7–55 keV energy band at two different source intensities which fitted reasonably well using two continuum models. The first model was defined as an absorbed Fermi-Dirac cutoff (FD-cutoff) model (Tanaka 1986) along with a black-body, a Fe-emission line and a cyclotron absorption line as shown in Figure 6. The compTT model (Titarchuk 1994) was used as the second model in combination with a Fe-emission line and a cyclotron absorption line as shown in Figure 7. In most cases, the compTT-model itself defines pulsar spectrum adequately well at lower energies, without a black-body component (Doroshenko et al. 2010; Maitra & Paul 2013; Jaiswal et al. 2015; Yoshida et al. 2017; Mukerjee et al. 2020) unlike cutoff-models combined with a black-body. However, in some cases black-body model was combined with compTT-model to appropriately define the low energy spectrum such as for 1A 1118-61 (Suchy et al. 2011). For AstroSat phase-averaged spectra, addition of a black-body component with the compTT-model changed the overall only by and resulted in large errors of the black-body parameters, hence it did not offer any useful results. We, therefore, used a compTT-model for Cepheus X-4 without a back-body component which defined its continuum well covering the energy band 0.7–55 keV, like it was used earlier for Suzaku observations (Jaiswal et al. 2015). The fitted model parameters along with estimated flux for two observations are given in Table 1. The relative normalization between the two instruments were modeled by introducing a constant term in the combined model. Then by fixing the normalization of LAXPC20 to 1, the relative normalization of the SXT was found to be 0.3 due to its fixed offset with respect to LAXPC20. The SXT spectral data were restricted to the energy range within 0.7–4.6 keV to offer a good statistics to its spectral data in the range which helped in improving the overall spectral fit. An overall systematic error of was introduced during spectral fitting to account for uncertainties in response matrices of both the instruments. The Cepheus X-4 spectrum during two AstroSat observations shows significant change in its continuum as can be seen by comparing spectral parameters as given in the Table 1. A single photo-electric absorption (phabs) component is employed in both the models for two observations. The combined effect of absorption due to hydrogen column density and due to presence of matter surrounding the neutron star should result in relatively lower net absorption for lower source luminosity. Therefore phabs is relatively lower for the second AstroSat observation of Cepheus X-4 as seen in the Table 1. This is consistent with earlier observed case of GX 1+4, where corresponding to lower source luminosity in 2–60 keV energy band, the phabs were lower as can be observed in Table 1 of Galloway 2000. Moreover, the photo-electric absorption is usually found relatively lower when compTT-model is employed compared to when high energy cutoff models combined with a black-body are used (Enoto et al. 2014; Mukerjee et al. 2020). This is also observed here for the case of Cepheus X-4. The compTT-model does reflect this change appropriately as seen in GX 1+4 and also in the present case of Cepheus X-4 from Table 1. The Fe-emission line was prominently detected by LAXPC during both the AstroSat observations and its energy and width were fixed to appropriately model other features of spectra.
A residual feature around 30 keV, which is sometimes observed in the LAXPC spectra in many sources, (Antia et al. 2020; Beri et al. 2021; Jaiswal et al. 2020; Sridhar et al. 2019; Sreehari et al. 2019), was found to be very weak and barely detectable in LAXPC spectra of Cepheus X-4. This is similar to the case of GRO J2058+42 (Mukerjee et al. 2020), and hence it would not pose any implications for measurements of the spectral continuum and cyclotron-line parameters for Cepheus X-4.
Spectral data when fitted with a variety of continuum models, additional features were observed in the spectral residuals of many accretion powered X-ray pulsars. These features were observed either in emission between energy band 10–20 keV or more rarely in absorption between 8–10 keV (Coburn et al. 2002). It was subsequently argued and understood that such features may be caused more likely because of inadequacies of the continuum models rather than due to presence of cyclotron resonance features (Coburn et al. 2002). For example, this feature was observed as an emission-line between 10–20 keV for Vela X-1 (Kreykenbohm et al. 2002), Her X-1 (Coburn et al. 2002), Cepheus X-4 (McBride et al. 2007) while as an absorption-line between 8–10 keV for 4U 1907+09, 4U 1538-52 and 4U 0352+309, as can be seen in Figure 6 of Coburn et al. 2002. During the RXTE observations of Cepheus X-4, a similar feature was clearly seen and modeled using keV Gaussian line (McBride et al. 2007). This is in contrast to the NuSTAR data where a broad feature with 6 keV line-width and centered around 12–13 keV was observed (Vybornov et al. 2017) during its two observations of Cepheus X-4 during 2014 outburst. Interestingly, similar feature between 10–20 keV was also observed by Furst et al. 2015 (in their Figure-2(b)) during studies of Cepheus X-4 using the same NuSTAR observations. An absorption feature around 19 keV was added in their model, to account for an asymmetry of the main absorption line profile. Most likely due to inclusion of 19 keV line, the observed feature in emission between 10–20 keV was also smoothed out during the spectral fit. Similar approach was followed by Bhargava et al. 2019 for their studies using the same 2014 NuSTAR data, however, no absorption line around 19 keV was introduced for their studies of phase resolved spectroscopy. This is in contrast to the fact that such broad-feature was clearly seen in the residuals of phase-averaged spectra of two NuSTAR observation of 2014 as reported by Vybornov et al. 2017. We find presence of 16 keV feature in the phase averaged spectra for both the observations of AstroSat and hence a Gaussian component was included in the combined model as can be seen in the Table 1. We find 16 keV feature is relatively weaker for the observation-2 and has no significant interference with the cyclotron line. For observation-1, the Gaussian width of the 16 keV feature was measured from the residuals of the fitted spectral model without it and then fixed its width for the overall spectral modeling, particularly for FD-cutoff model to reduce its interference with the cyclotron line measurements. The effect of 16 keV features on spectral continuum was found to be in-significant for both the models for two observations, as all parameters values are found to be consistent within their respective error limits. The cyclotron-line width, particularly for observation-1, is found to be significantly lower due to introduction of 16 keV feature in the model. The cyclotron-line energy, however, are either marginally affected or remains consistent like its optical-depth within their parameter error limits. The parameter for observation-2 showed wide variation with respect to observation-1 for FD-cutoff model, with or without the inclusion of 16 keV feature in the spectral model, which was not seen in all earlier observations by other instruments. Therefore, parameter was frozen at a value as in observation-1 and then all other parameter were estimated for observation-2.
The derived spectral parameters from FD-cutoff model showed that the source spectrum is relatively harder for higher source luminosity. Where as the black-body temperature is although relatively lower at keV at higher source luminosity than the temperature keV observed at the lower luminosity but are within their error limits. This is similar to earlier observation of Cepheus X-4 during 2014 where back-body temperatures were found to be at keV and at keV at two luminosities (Bhargava et al. 2019) but at higher values compared to 2018 observations. The compTT model could successfully define spectrum of many X-ray pulsars in high mass X-ray binaries for example Cepheus X-4 (Jaiswal et al. 2015), 4U 1907+09 (Varun et al. 2019) and GRO J2058+42 (Molkov et al. 2019; Mukerjee et al. 2020). Though, It is generally applied to neutron star based low mass X-ray binaries such as Z-type and atoll sources having relatively lower magnetic field ( G) (Ferinelli et al. 2008). The FD-cutoff model estimated black-body temperatures at two different luminosity of the source along with other spectral and cyclotron line parameters for both the AstroSat observations (Table 1). The Comptonization model on the other hand enabled us to determine input photon Wien-temperature of keV and , the plasma temperature of keV and keV, along with its corresponding plasma optical depth of and respectively for the phase-averaged spectra. As bulk Comptonization occurs as per compTT model, in the innermost part of the transition-layer presumably within some extended region located away from the neutron star, while thermal Comptonization is dominant in the outer transition layer. The Wien-temperature is, therefore, always found to be relatively lower than the neutron star surface black-body temperature as it originates away from the neutron star surface at the outer transition layer (Ferinelli et al. 2008). Difference in these two temperatures were also observed earlier in spectral data of Cepheus X-4 fitted with compTT-model and FD-cutoff model combined with a black-body (Jaiswal et al. 2015, Table 1 of). The cyclotron line parameters are found to be consistent well within the error limits of the two models. The cyclotron line parameters when compared for two different luminosity of the source showed consistency in cyclotron line energy, however, line width and the line depth were found relatively larger at lower luminosity of the source.


The detection of a second cyclotron absorption feature in the spectrum was reported earlier during 2014 outburst around 45 keV by Jaiswal et al. 2015 in Suzaku observation, and around 55 keV by Vybornov et al. 2017 in NuSTAR observation. AstroSat LAXPC20 is having effective area of about 1500 cm2 at 50 keV and 1300 cm2 at 60 keV (Antia et al. 2017) in comparison to about 150 cm2 at 50 keV and 130 cm2 at 60 keV of NuSTAR (Harrison et al. 2013). AstroSat, thus has superior effective area of an order of magnitude higher than the NuSTAR in these energies, though uncertainties in LAXPC background are higher at these energies. We, therefore, made a comparison of spectral counts at two observed source intensities of AstroSat. The combined source plus background and background counts of LAXPC20 with errors on data are shown in Figure 8. These plots show detection of source above the background spectrum until it merges with the background around 52–55 keV. We noticed a weak signature of absorption feature around 50 keV in the residuals of the AstroSat spectrum. And, since the source appears to be marginally detectable above background at around 50 keV with detection limit for both the AstroSat observations. We, therefore, attempted to include an additional absorption line around 49 keV in the combined spectral model for both the continuum. We could not detect presence of any significant absorption feature in the spectrum around 49–50 keV in the AstroSat data as overall difference in , was found. As a result, we have not included this feature in further analysis.

| Parameter | Units | Obs-1(FD-cutoff) | Obs-2(FD-cutoff) | Obs-1(compTT) | Obs-2(compTT) |
|---|---|---|---|---|---|
| Parameter values with 16 keV line | |||||
| Phabs(nH) | 1022 cm-2 | ||||
| bbody(kT) | keV | - | - | ||
| bbody(Norm) | ph keV-1 cm-2 s-1 | - | - | ||
| gauss(Line E) | keV | 6.5 (fixed) | 6.5 (fixed) | 6.5 (fixed) | 6.5 (fixed) |
| gauss(Sigma) | keV | 0.30 (fixed) | 0.30 (fixed) | 0.30 (fixed) | 0.30 (fixed) |
| gauss(Norm) | ph cm | ||||
| gauss(Line E) | keV | ||||
| gauss(Sigma) | keV | 2.34 (fixed) | |||
| gauss(Norm) | ph cm | ||||
| power-law(PI) | - | - | - | ||
| keV | 12.79 (fixed) | - | - | ||
| keV | - | - | |||
| power-law(Norm) at 1 keV | ph keV-1 cm-2 s-1 | - | - | ||
| compTT(T0) | keV | - | - | ||
| compTT(kT) | keV | - | - | ||
| compTT(tau) | - | - | - | ||
| compTT(Norm) | - | - | - | ||
| cyclabs(Line E0) | keV | ||||
| cyclabs(Width) | keV | ||||
| cyclabs(Opt. Depth) | - | ||||
| Flux(3–80 keV) | erg cm-2 s-1 | ||||
| - | 429.09 | 456.13 | 426.53 | 463.03 | |
| (dof) | - | 0.962(446) | 1.016(449) | 0.956(446) | 1.031(449) |
| Parameter values without 16 keV line | |||||
| Phabs(nH) | 1022 cm-2 | ||||
| bbody(kT) | keV | - | - | ||
| bbody(Norm) | ph keV-1 cm-2 s-1 | - | - | ||
| gauss(Line E) | keV | 6.5 (fixed) | 6.5 (fixed) | 6.5 (fixed) | 6.5 (fixed) |
| gauss(Sigma) | keV | 0.30 (fixed) | 0.30 (fixed) | 0.30 (fixed) | 0.30 (fixed) |
| gauss(Norm) | ph cm | ||||
| Power-law(PI) | - | - | - | ||
| keV | 20.88 (fixed) | - | - | ||
| keV | - | - | |||
| power-law(Norm) at 1 keV | ph keV-1 cm-2 s-1 | - | - | ||
| compTT(T0) | keV | - | - | ||
| compTT(kT) | keV | - | - | ||
| compTT(tau) | - | - | - | ||
| compTT(Norm) | - | - | - | ||
| cyclabs(Line E0) | keV | ||||
| cyclabs(Width) | keV | ||||
| cyclabs(Opt. Depth) | - | ||||
| - | 465.21 | 473.50 | 484.94 | 463.03 | |
| (dof) | - | 1.036(449) | 1.048(452) | 1.080(449) | 1.069(452) |
Note. — Errors quoted for each parameters above are with 90% confidence range. *–parameter pegged at hard limit 0
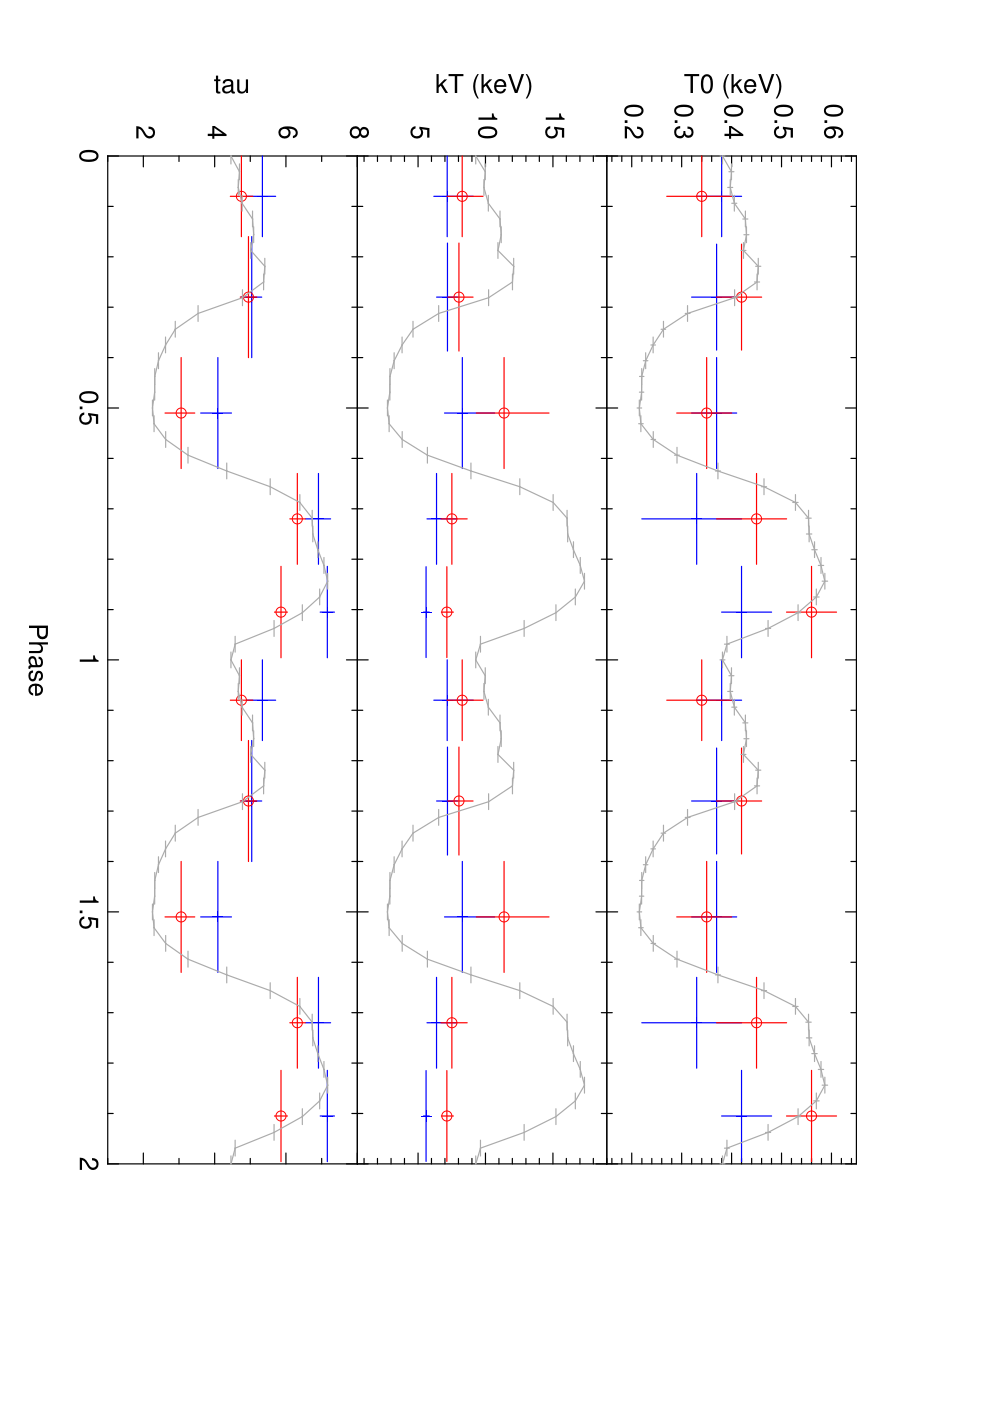
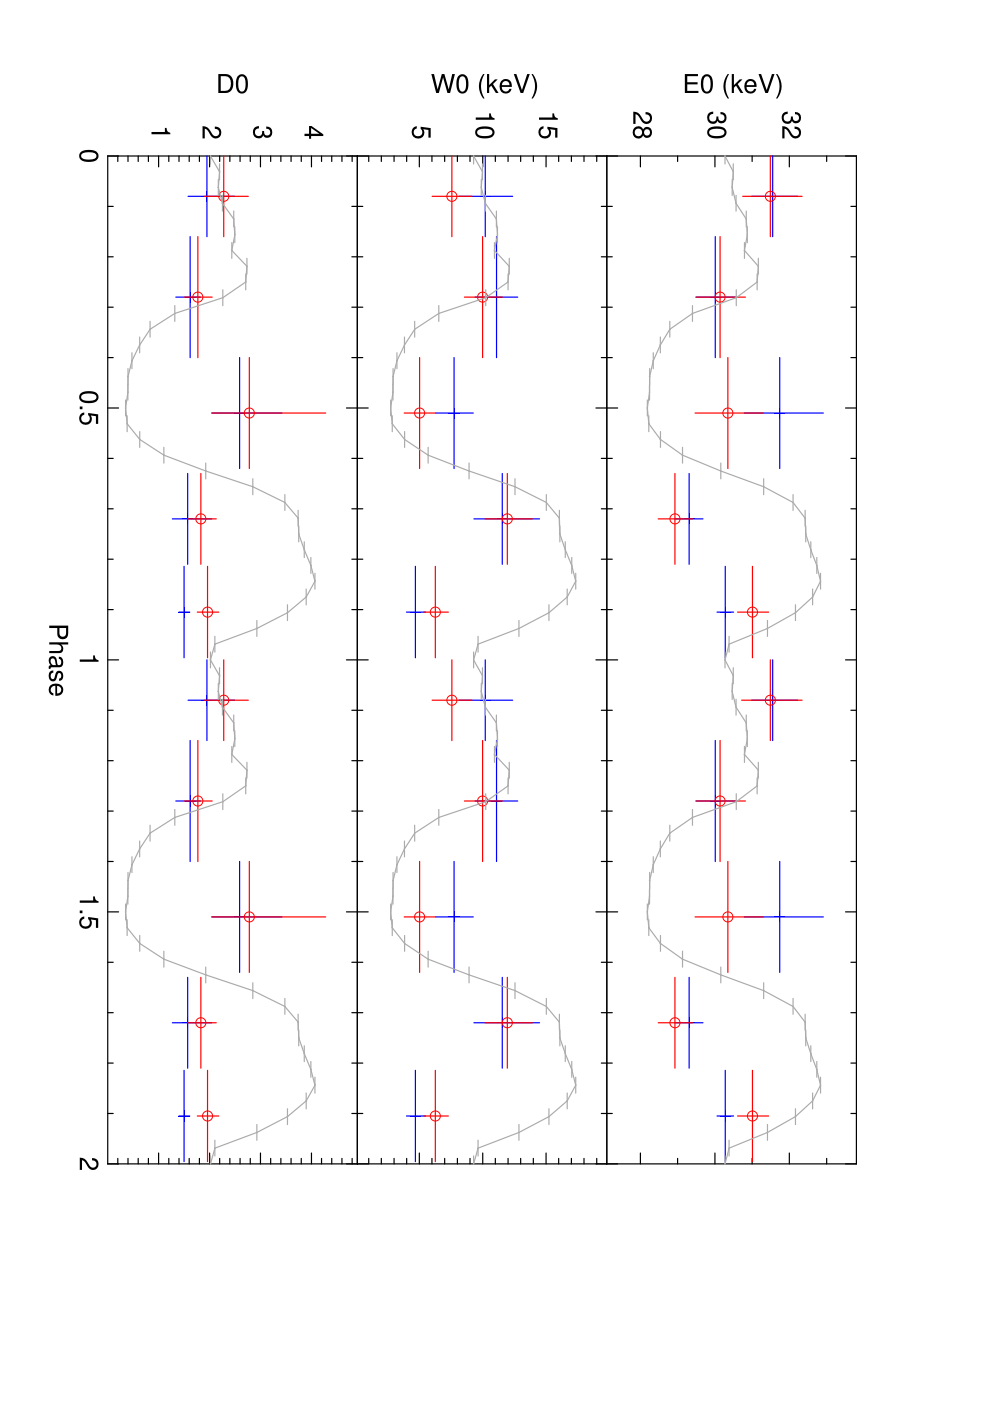
Studies of spin-pulse phase resolved spectroscopy were performed from two AstroSat observations of 2018 outburst during its declining phase with a source intensity changed by a factor of . The spectral data from SXT and LAXPC20 from two AstroSat observations, were extracted corresponding to the 5-different pulse-phase intervals considered as marked in Figure 3. The phase intervals were selected primarily for easy comparison of AstroSat results with the results of 2014 outburst observed by NuSTAR (Bhargava et al. 2019), and to capture variations in the structures of secondary and primary pulses of the pulse profile in reference to the soft X-rays energy band as marked in Figure 3 (left-panel) and to follow variations in the higher energy bands in the same 5 phase-intervals. The primary and the secondary pulse were divided in 2 phase-intervals each, while a single interval was chosen to include the valley region (Ph3), in between the secondary-pulse and the primary-pulse (Figure 3). The valley region so defined is found to become gradually wider and flatter at higher energies than at lower X-ray energy bands as can be seen in Figure 4. Therefore, the second phase interval at higher energies appears to capture larger extent of the narrower secondary pulse at higher energies than at lower energies (Figure 3, Figure 4).
The compTT-model was preferred over the FD-cutoff model for phase resolved spectroscopy, as parameters of cutoff model such as E-cut has no clear physical meaning, although it might be related to the strength of the magnetic field (Makishima et al. 1990), where as E-fold has been associated by some authors (Unger et al. 1992) with the plasma temperature in the emission region. The thermal Comptonization compTT-model on the other hand, offers significant physical details about plasma distributions in the pulsar accretion column in terms of its plasma temperature, its optical depth in addition to its input photon Wien temperature over the different pulse-phases. We, thus, studied phase resolved spectroscopy for Cepheus X-4 for the first time employing a compTT-model without a black-body component for the spectral continuum. The black-body temperature variation, therefore, was not considered here, like it was presented earlier along with FD-cutoff model by Bhargava et al. 2019. All the important spectral features of the Cepheus X-4, as observed in the phase-averaged spectrum of AstroSat were also present in the phase-resolved spectra of the pulsar. As regards to the Fe-line, its energy and width were frozen to the values as in the phase-averaged case for all the 5-phases considered, as extracted data for the 5 individual phase intervals could not constrain the Fe-line parameters during the spectral fit. Thus, all these spectra were well fitted using absorbed compTT model for the continuum along with a fixed Fe-emission line and a cyclotron absorption feature defined by cyclabs-model. We have not included 16 keV feature for AstroSat phase resolved spectroscopic studies, to avoid any interference of this feature with cyclotron-line parameters. For phase resolved spectrum, the significance of the feature is also low because of division of data in 5-phases resulting in lower signal to noise ratio. Our main motivation is to study the fundamental line through phase-resolved spectroscopy. Therefore, results obtained from analysis of pulse phase-resolved spectra corresponding to 5 different pulse-phases of the pulsar are presented in Figure 9. Spectral parameters derived for the continuum fitted with a compTT-model are plotted in left-panel and cyclotron line parameters are plotted on the right-panel of the Figure 9. These results from both the observations were plotted on the same graph along with extent of each interval along with overlay spin-pulse of observation-2 for direct comparison of phase-resolved spectral parameters and studying relative variability at two different source intensity.
It is noticed that input soft photon Wien temperature T0 varies, in the these 5 pulse phases, covering the range
including its 90% error limits from 0.22–0.48 keV and 0.27–0.61 keV for two observations respectively.
It has a maximum at the falling edge of the primary-pulse around
phase 0.9 and minimum near the rising edge of the secondary pulse around phase 0.1
for the both AstroSat observations as seen in Figure 9.
We observed plasma temperature kT though marginally higher for observation-2 than for observation-1, but
remained consistently stable in all phases within its 90% error limits. It covers
a range 5.41–10.66 keV for the observation-1 and 6.74–14.71 keV for observation-2 within its error limits.
The plasma optical depth varied in the range 3.61–7.36 for observation-1 and 2.61–6.54 for observation-2
with relatively lower range of variation and following pulse
amplitude variation with phase with minimum near pulse-minima at phase 0.5 and maximum
corresponding to primary-pulse-maxima near the phase 0.7 as can be seen in Figure 9 (left panel).
The cyclotron line energy within 90% error limits, was found to vary in the range
from 28.93–32.91 keV and 28.48–32.34 keV for two observations respectively. The minimum is
near the rising edge of the primary around phase 0.7 and maximum is around rising edge of the secondary
around phase 0.1.
The centroid energy for the cyclotron line for both AstroSat observations, showed
variation with the pulse-phase as seen in Figure 9 (right panel).
The cyclotron line-widths showed overall indication of variations with pulse amplitude in phase but
remained consistent for both the observations within 90% error limits. The line-widths was found
to vary in the range 3.99–12.77 keV and 3.81–13.91 keV over the phase for the two observations
respectively with some indication of variation. The optical-depths of the cyclotron line were
found in the range 1.40–2.49 and 1.51–2.76 over the complete phase.
The optical-depth, however, remains stable overall with phase except for some indication of increase near phase 0.5
for these two AstroSat observations.
| Observation | Telescope | MJD | Pulse-Perioda | Refc |
|---|---|---|---|---|
| 1988 April | GINGAb | 47263.5 | [1] | |
| 1993 June | ROSAT | 49160.0 | [2] | |
| 1993 June | BATSE | 49163.0 | [3] | |
| 49167.0 | ||||
| 49169.0 | ||||
| 49171.0 | ||||
| 49173.0 | ||||
| 1997 July | BATSE | 50633.0 | [3] | |
| 50635.0 | ||||
| 50637.0 | ||||
| 50639.0 | ||||
| 50641.0 | ||||
| 50643.0 | ||||
| 1997 July | RXTE | 50647.0 | [3] | |
| 50654.0 | ||||
| 2002 July | RXTE | 52450.7 | [4] | |
| 52451.3 | ||||
| 52451.7 | ||||
| 2014 June | NuSTAR | 56827.38 | [5] | |
| 2014 July | 56839.87 | |||
| 2018 July | AstroSat | 58301.61850 | [6] | |
| 2018 July | 58307.40211 |
Note. — aErrors with 68% confidence range for each parameter. b Helio-centric corrected time. cReferences [1] Koyama et al. (1991) [2] Schulz et al. (1995) [3] Wilson et al. (1999) [4] McBride et al.(2007) [5] Vybornov et al.(2017) [6] Present Work
IV Discussion
IV.1 Long term Spin-down of the Pulsar
The measurements of spin-up and spin-down rate in X-ray pulsars offers scope for in-depth studies of underlying mechanism for transfer of angular momentum to the neutron star by accreting matter (Bildsten et al. 1997). It can serve as a tool to investigate the interaction of accreting plasma with magnetosphere of rotating neutron stars and the nature of the different torques acting on the neutron star (Nelson et al. 2000; Dai Hai-Lang et al. 2016). In the case of a wind-fed accretion in a high mass X-ray binary, if the specific angular momentum of gravitationally captured matter is sufficiently high, then an accretion disk can possibly be formed around the neutron star, as seen in the cases of A0535+262 (Finger et al. 1996; Finger et al. 1998), EXO 2030+375 (Angelini et al. 1989), 4U 0115+63 (Soong & Swank 1989; Heindl et al. 1999; Dugair et al. 2013), V0032+53 (Qui et al. 2005), 4U 1907+09 (Mukerjee et al. 2001), and GRO J2058+42 (Mukerjee et al. 2020). Accretion, otherwise can occur through different regimes of a quasi-spherical accretion on to the neutron star (Burnard et al. 1983; Shakura et al. 2012). Measurements of pulse period variations in such systems can provide scope for understanding different processes responsible for the angular momentum transfer, the structure of the accretion flows in binary systems, their dependence on system parameters, X-ray luminosity, etc. Different physical mechanisms for torques acting on X-ray pulsars have been proposed to explain these variations (Ghosh & Lamb 1979; Lovelace et al. 1995; Rappaport et al. 2004).
For studies of variation of spin-period of Cepheus X-4, we compiled all the period measurements of the Cepheus X-4 observed during various outbursts over the last 30 years by different observatories (Table-2). All these data are plotted with a linear fit and shown in Figure 10. Two types of variations in the spin-period are seen in the Cepheus X-4 during all these observations as can be seen from Figure 10. Firstly, the source showed luminosity dependent spin-period variations during each outburst which gives rise to the spread of data points in Figure 10 about the mean trend, as expected from accretion torque theory (Ghosh & Lamb 1979; Bildsten et al. 1997; Malacaria et al. 2020, and references therein). Whereby during an outburst, depending on change in the mass accretion rate and hence due to proportionate change in transfer of angular momentum, it affects change in the pulsar spin period and its rate as seen in Cepheus X-4. Similar changes were also observed for many other Be-binaries during an outburst (Sugizaki et al. 2017; Finger et al. 1996; Parmar et al. 1989b). During declining phase of 2018 outburst, the observed rate of change in spin period of Cepheus X-4 are relatively higher at higher source luminosity Hz s-1 for the first AstroSat observation compared to the second observation Hz s-1 at lower source luminosity as expected from the accretion torque theory. Additionally, a long term secular decrease in the spin period of the pulsar was also observed between each of these outbursts as shown by the straight line fit to all the data. The straight-line fit to the data showed a continuous decrease in the pulsar spin-period at a rate of ( Hz s-1) over the long duration of about 30 years, which we investigate in detail below. For Ginga observation only helio-centric correction was applied to the measured value of the spin-period. This average spin-down is consistent with the earlier reported measurement of BATSE s s-1 ( Hz s-1) between two outbursts of 1993 and 1997, (Wilson et al. 1999).
The observed continuous slowing down behavior of pulsars could be due to resulting centrifugal inhibition of accretion, which occurs at the end of the outburst. During the declining phase of an outburst, there is a gradual decrease of accretion on to the neutron star leading to the reduction of source luminosity. As the accretion rate decreases, the ram pressure decreases, the magnetosphere expands and magnetospheric radius extends closer to the co-rotation radius where the angular velocity of Keplerian motion is equal to that of the neutron star. As the magnetosphere grows beyond the co-rotation radius, centrifugal force prevents material from entering the magnetosphere, and thus accretion onto magnetic poles ceases (Pringle & Rees 1972; Lamb et al. 1973; Illarionov & Sunyaev 1975). Consequently, no X-ray pulsation is expected. This is commonly known as the propeller effect, because accreting matter is likely to be ejected in the presence of a strong magnetic field. The in-falling material is flung away, carrying part of the angular momentum extracted from the neutron star, resulting in slowing down of the neutron star. As this mechanism occurs at relatively much lower source luminosity at about erg s-1 as shown below for Cepheus X-4 and hence at much lower mass accretion rate at the end of the source outburst. Therefore, change of angular momentum of the neutron star due to onset of propeller effect is at a much lower rate of spin-down ( Hz s-1), which is two orders of magnitude lower than that during the outburst as derived from all the available observations of Cepheus X-4. Now, prior to detailed investigations on the Propeller effect, we derive some of the required parameters associated with the neutron star as below.
In the presence of a strong magnetic field of a neutron star of an accreting X-ray binary, the plasma electrons in the accretion column, get quantized in the Landau states. X-ray photons get scattered from these quantized plasma electrons in the strong magnetic field close to the surface of an accreting X-ray pulsar and produce cyclotron resonant scattering features. It results in appearance of a complex absorption features at a particular energy in the X-ray spectrum depending on strength of magnetic field of the neutron star (Schwarm et al. 2017). Alternatively, reflection of X-rays from the atmosphere of the neutron star can also produce cyclotron absorption features (Poutanen et al. 2013). The complex shape of the cyclotron absorption feature depends on many factors. These include physical condition of the line-forming region, strength of the local magnetic field, nature of the accretion column, source luminosity and pulse-phase of an accreting X-ray pulsar (Nishimura 2003; Nishimura 2005; Nishimura 2013). From the measurement of centroid energy of the cyclotron absorption feature, the strength of the surface magnetic field of a neutron star can be obtained using the following equation
| (3) |
We assume that the observed cyclotron absorption feature at is associated with its fundamental line (), and considering a gravitational red-shift of at the surface of a typical neutron star having a mass of and a radius of 10 km. From the measurements of the centroid energy of keV for observation-1, and keV for observation-2, derived from the phase averaged spectrum using compTT model (Table 1), we could thus establish the strength of the magnetic field of the pulsar as G and G, respectively. The cyclotron line energies agree within their error limits, shows consistency during two observations even when the source luminosity changed by a factor of .
If all the potential energy of the accreted mass released during the outburst is converted into radiation then the luminosity can be expressed as,
| (4) |
where is the luminosity in units of erg s-1 and is the radius in units of cm, is the mass accretion rate in g s-1 and M is the mass of neutron star. The mass accretion rate can be calculated from the observed luminosity, which is derived by measurements of flux from spectral model for AstroSat spectrum (Table 1), and known distance of the star. The Cepheus X-4 luminosity during the AstroSat observations were estimated to be erg s-1 and erg s-1 respectively, in 3–80 keV energy band. This was derived using distance measurements of Gaia as kpc (Malacaria et al. 2020) and estimated flux from AstroSat observations (Table 1). The estimated value of during the AstroSat observations were g s-1 and g s-1 respectively. It is therefore inferred that the accretion process was intensively active during AstroSat observations.
The magnetospheric radius , of the neutron star can be expressed in terms of its mass accretion rate and strength of magnetic field of neutron star by the Equation-6.18, page 158 of Frank et al. 2002
| (5) |
where is the mass ratio of neutron star, is its mass accretion rate expressed in units of g s-1 and is magnetic moment of the neutron star expressed in units of G cm3. The magnetic moment ( of the neutron star for a dipole-like field configuration is given by , where is surface polar magnetic field strength and is the radius of the neutron star. From the AstroSat measurements of cyclotron resonance scattering feature, we have derived G, which gives for a 10 km radius of the neutron star. Thus, all these parameters are derived from observed values of neutron star magnetic field and source luminosity respectively from AstroSat observation.

The radius, where the spin angular velocity of neutron star is equal to the Keplerian angular velocity of matter, is defined as the co-rotation radius of an X-ray pulsar and can be expressed as
| (6) |
Using measured value of the spin period of the neutron star from AstroSat observations s and assuming a neutron star mass of , one can obtain the co-rotation radius for Cepheus X-4 as cm (Equation-6). Now, by applying the condition , that is equating Equation-5 and Equation-6 and utilizing Equation-4, one can derive the minimum luminosity (min) at which an X-ray pulsar turns off due to the centrifugal inhibition of accretion, so called the propeller effect, is given by (Illarionov & Sunyaev 1975)
| (7) |
where R, M, and are radius, mass, magnetic moment and spin period of the neutron star respectively. Using derived values of , and , one can obtain erg s-1 for Cepheus X-4. The pulsar luminosity must go down below this limiting value for the propeller effect to prevail. As a limiting case, corresponding to the minimum luminosity of erg s-1 below which the pulsar turns off due to propeller effect as derived above, the corresponding can be estimated as using Equation-4. Similarly, in the propeller regime where (where can be estimated using Equation-6), one can estimate the corresponding value of magnetic moment of the neutron star as (using Equation-5), which corresponds to magnetic field of G for a 10 km radius neutron star.
Many researchers have investigated this phenomenon of propeller effect over the period (Pringle & Rees 1972; Illarionov & Sunyaev 1975; Davies & Pringle 1981; Ikhsanov 2001; Shakura et al. 2012; Malacaria et al. 2020). It was suggested that the propeller phase of the pulsar can be divided into two sub-phases (a) a supersonic propeller phase or (b) a subsonic propeller phase (Davies & Pringle 1981). This classification was made depending on the angular velocity of the pulsar (). For the case of supersonic propeller phase , where is the inner boundary of the accretion disk and is the sound speed at the radius . Let us therefore consider these two cases of propeller regime separately for Cepheus X-4 and infer the most likely scenario based on observed value of .
(a) Supersonic Propeller Phase: The spin down rate during the supersonic propeller phase can be obtained using the equation derived by Ikhsanov 2004 and expressed as
| (8) |
Here is the relative velocity of the star and surrounding medium in the units of cm s-1. Using , G cm3 and g s-1 we get s s-1 ( Hz s-1) for the supersonic propeller case.
(b) Subsonic Propeller Phase: The spin down rate during the subsonic propeller phase is as derived by Ikhsanov 2004
| (9) |
where is the mass ratio of neutron star, is moment of inertia of the neutron star expressed in the units of g cm2 and is the luminosity of the pulsar in the subsonic propeller regime expressed by (Davies & Pringle 1981; Ikhsanov 2004).
| (10) |
Using these above parameters established for Cepheus X-4 in the propeller regime, the corresponding value of was established and found to be ( Hz s-1). This value is comparable to the observationally derived s s-1 ( Hz s-1) within underlying parameter uncertainty.
We also cross-verified the subsonic case described by Malacaria et al. 2020 and derived the as described by their Equation-12
| (11) |
Both of these estimates of showed consistency with the value derived value from observations favoring the case of subsonic propeller regime of the pulsar. The comparison of observed value with Equation-11, suggest that the value of dimensionless parameter would be = 1.8 for the case of Cepheus X-4. The parameter is a combination of dimensionless parameters (Shakura et al. 2014) and its derived values from observations were found to be between 5–10 for some of the other X-ray pulsars studied (Postnov et al. 2015). This result therefore suggest that the pulsar enters subsonic propeller regime after each outburst activity observed with 4–5 years interval and hence showed continuous slowing down of its spin period. Thus, using this established spin-down rate one can predict pulse-period of the pulsar for an epoch when the next outbursts would occur.
IV.2 Pulse Phase-averaged Spectrum
The cyclotron line energy was measured for Cepheus X-4 by various observatories during different outbursts observed over the long period of more than 30 years since its discovery in 1988 by Ginga. It was first measured by Ginga and then followed by RXTE, NuSTAR and most recently by AstroSat. The measurements of cyclotron line parameters from phase-averaged spectrum obtained during different outburst of the source are compiled in Table 3 along with observation epoch and the observed source flux. The Ginga spectral data were fitted by a combination of an absorbed power-law along with cyclotron resonance scattering (cyclabs) as its cutoff model (Mihara et al. 1991) and measured centroid line energy. While for rest of the measurements, spectral data were modeled by absorbed Fermi-Dirac cutoff model (Tanaka 1986) combined with the same cyclotron scattering (cyclabs) model. The use of different continuum and absorption line models affect measurements of cyclotron line parameters marginally. Therefore, for the purpose of comparison we report here the values obtained in previous studies, derived using the same model except for the Ginga, as tabulated in Table 3 along with respective references. The results from simultaneous Suzaku observation of 2014 outburst (Jaiswal et al. 2015) with NuSTAR was not considered here for comparison, since cyclotron feature in the spectrum was modeled employing gabs-model although its continuum was modeled using same Fermi-Dirac cutoff model.
| Observation | Telescope | MJD | Source flux (3–78 keV) | Cyclotron Line | Ref(c) | ||
|---|---|---|---|---|---|---|---|
| (erg cm-2 s-1) | Energy (keV) | Width (keV) | Depth () | ||||
| 1988 April | GINGA | 47263.5 | (b) | [1] | |||
| 2002 July | RXTE | 52450.7 | (b) | [4] | |||
| 2014 June | NuSTAR | 56827.38 | (a) | [5] | |||
| 2014 July | 56839.87 | (a) | |||||
| 2018 July | AstroSat | 58301.618 | [6] | ||||
| 2018 July | 58307.402 | ||||||
Note. — Errors quoted with 90% confidence range for each parameter.
(a) expressed in terms of absorption depth (d) related to optical depth .
(b) Corrected flux with some approximation in 3-78 keV energy band.
(c)References [1] Mihara et al. (1991) [4] McBride et al.(2007) [5] Vybornov et al.(2017) [6] Present Work


The centroid energy of the cyclotron line was plotted against the observed source flux as shown in Figure 11 (right-panel). It is evident from the plot that there are no specific trend observed with respect to the source flux or luminosity. This is in contrast to some of the other wind-fed X-ray pulsars like, GX 304–1 (Furst et al. 2015) and Vela-X-1 (La Parola et al. 2016) where they showed increase in line energy with increasing source luminosity. For other pulsars such as V0332+53 (Makishima et al. 1990), 4U 0115+63 (Mihara 1995) and SMC X-2 (Klus et al. 2014; Lutovinov et al. 2017) they showed decrease in line energy with increase in the source luminosity. In contrast to these variations, cyclotron line energy of Cen X-3 showed a long duration stability with an average at keV over the period of 14 years (Ji, L et al. 2019). Two observations by NuSTAR of Cepheus X-4 during 2014 showed increasing trend with source luminosity (Furst et al. 2015; Vybornov et al. 2017). However, when it is compared from other available measurements of Cepheus X-4, it did not show any such dependence on source luminosity as can be seen from Figure 11 (right-panel). We also plotted cyclotron line energy with respect to the time of observation, expressed in MJD as shown in Figure 11 (left-panel). The plot does not show any specific trend with time or its luminosity. However some significant variation in the cyclotron line energy was observed with respect to its average value keV during 2014 outburst when source flux was found below about erg cm-2 s-1 as can be seen in Figure 11 (right-panel). The average value of the cyclotron energy measurement is shown by the horizontal line. With respect to average value of cyclotron line energy, the AstroSat observation showed consistency during 2018 outburst, in contrast to NuSTAR second observation of 2014, where it showed decrease. Relatively large errors associated with the measurement by RXTE prohibit us to identify long term trend in between Ginga and NuSTAR observations and extent of variation more accurately. The flux measurement of RXTE in 3.5–10 keV energy band of erg cm-2 s-1 (McBride et al. 2007) and similarly for Ginga measurements of flux erg cm-2 s-1 in 2–20 keV are under-estimate of actual flux in equivalent energy band of NuSTAR and AstroSat. We, therefore, scaled these fluxes by a respective factor established by determining the ratios of fluxes from equivalent energy band using the AstroSat spectrum. This corrections approximate the corresponding fluxes from Ginga and RXTE in 3–78 keV energy band for comparison as given in Table 3. The errors on these estimates could only affect a marginal shift of this point along the X-axis corresponding to the actual flux. The large error associated with the RXTE measurement of cyclotron line energy, do not indicate any significant trend even when flux is known accurately, similarly, Ginga measurements is close to the average value and hence its accurate flux estimate would not lead to any possible trend.
The change in cyclotron line energy with luminosity for X-ray pulsars are due to the effect of change in the behavior of the line forming regions in the accretion column. It was shown by Becker et al. 2012 that when accreting X-ray pulsars attain a critical luminosity (Equation-12), then the radiation pressure in the accretion column decelerates in-falling matter, thus affecting height of the cyclotron line forming region. The physical model of Becker et al. 2012 also demonstrated that when the source luminosity is higher than the line forming region in the accretion column shift to higher heights from the neutron star surface due to dominant radiation pressure of its supercritical luminous X-ray pulsar. In contrast to this, when the source luminosity is below the , a sub-critical luminosity, the cyclotron line energy increases due to the consequence of dominant pressure of in-falling matter where the characteristic emission height decrease towards the surface of the neutron star. The sign of this dependence is thus opposite in the supercritical and sub-critical cases, hence creating the observed bimodal behavior for many X-ray pulsars.
| (12) |
The constant in Equation-12 accounts for certain uncertainties such as due to spin-averaging of the magnetospheric radius, effects of plasma shielding and other magnetospheric effects. Whereas the constant depends on the shape of the spectrum (Becker et al. 2012).
The studies of luminosity dependence for Cepheus X-4 from 2014 outburst data (Furst et al. 2015), suggested positive correlation with its luminosity. Vybornov et al. 2017 conducted pulse-to-pulse analysis of the same NuSTAR data and also demonstrated positive correlation with source luminosity during the short time scale. We compiled all the measurements of cyclotron line energy from phase averaged spectra in Table 3 and presented in Figure 11 (right-panel) for long term comparison. From these results, one can infer that there are no specific long term variation trend with respect to source luminosity or time except with an indication that below a certain source flux erg cm-2 s-1 the cyclotron line energy showed some variability. For higher than this flux, cyclotron line energy almost remained stable close to its average value at keV. Now, for Cepheus X-4 the critical source luminosity estimated using Equation-12 is erg s-1. The source luminosity during two AstroSat observations were estimated to be erg s-1 and erg s-1 respectively, for its distance of 10.2 kpc as reported from Gaia observations (Malacaria et al. 2020). Both of these values are below the estimated value of , which may have some uncertainty depending on the mass() and radius() of the neutron star and constants =0.1 and =1 as considered here. The AstroSat measurements should have shown a positive correlation in cyclotron line energy with source luminosity with increase by a factor of as per the physical model of Becker et al. 2012. But within its error limits, it showed almost similar and stable at its long term average value. The Ginga observation is higher than the critical luminosity, where as the first observation of NuSTAR is close to its critical luminosity. However, within the measurement errors cyclotron line energy shows almost stable and close to its long term average of keV rather than a negative correlation with source luminosity as predicted by the model. For more clarity, we further investigate physical parameters of accretion column and its implications.
The maximum height of the line forming region can be estimated by the equations described by Becker et al. 2007, for a super-critical case, and is given by
| (13) |
where where is polar cap or accretion column radius of the pulsar. The height of the bottom of the line-forming region is treated as the height of its thermal mound (Becker et al. 2007). The height-size depends on source luminosity (), the magnetic field (), mass () and radius () of the neutron star. Using the parameter values from Table 3 for Ginga and NuSTAR observation-1, the source luminosity were found to be erg s-1 and erg s-1 respectively for source distance of 10.2 kpc. Hence these observations can be treated as comparable to super-critical case within some approximation and their corresponding maximum height of line forming region can be estimated from above Equation-13 as 1.2 km and 1.1 km respectively.
The height of the line-forming region in the accretion column for sub-critical luminous accreting X-ray pulsars, can be estimated using Equation-14. For sub-critical luminous sources, the line forming height reduces with increase in source luminosity where as for super-critical luminous sources it increases with increase in source luminosity as can be seen from given equations (Becker et al. 2012)
| (14) |
For most of the accreting pulsars, the values of the parameters taken are and Thomson optical depth . Where as for other parameters of equations, values are obtained from the two AstroSat observations, we thus estimated the radius of accretion column and height of the line forming region above the thermal mound. Using measured values of G and erg s-1 for observation-1 and G and erg s-1 for observation-2, we estimate size of the line forming regions in accretion column for the sub-critical case, during the two AstroSat observations as m and m, respectively for the two observations. This indicate a difference of height of m between two observations.
The altitude, , of the radiation-dominated shock can be estimated in these cases using the expression of Becker et al. 2012
| (15) |
The respective shock heights during AstroSat observations are 2.3 km and 1.2 km, corresponding to two different luminosities. From these estimates, it suggests that during the first observation of the AstroSat at higher source luminosity, the line-forming region height of m and its shock height is located at 2.3 km altitude in the accretion column, which is about 6 times away from the neutron star surface. Therefore, there are less chance of any possible impact of shock region on the line forming region, that may cause change in its size and location. Hence, the cyclotron line energy remains almost stable similar to the values estimated at higher luminosities by NuSTAR and Ginga as can be seen in the Figure 11 (right-panel). For the second AstroSat observation at lower luminosity, size of the line forming region is relatively larger m and shock height is about 1.2 km, which is relatively in closer proximity. As there could be uncertainties involved with equation parameters, hence there is possibility of some impact of shock region with the line forming region at this lower luminosity, which possibly may cause some variations in the cyclotron line energy depending on whether it may affect its size or its location or both. However no such effect is seen for the observation-2, at lower source luminosity of Cepheus X-4 by AstroSat during 2018 outburst. Now, for the NuSTAR observation-2, for which the strength of magnetic field and source luminosity was measured as G and erg s-1 respectively. The corresponding height of the line forming region was determined from Equation-14 as m and shock height using Equation-15 of about 1.0 km are found to be in very close consistency considering parameters uncertainties involved. This may therefore, expected to cause some variation in cyclotron line energy due to possible interaction of shock region with the cyclotron line forming region. The physical model of Becker et al. 2012 for sub-critical luminosity predict that cyclotron line energy should decrease for NuSTAR observation-2. This is, therefore, possibly a very likely cause of sudden deviation or decrease of cyclotron line energy at keV during NuSTAR observation-2 from its average energy of keV. This is when compared with super-critical cases the altitude of shock heights for Ginga and NuSTAR observation-1 are found be about 10.3 km and 3.9 km as determined from Equation-15. These are much beyond the corresponding maximum heights of line forming regions of 1.2 km and 1.1 km as estimated above for a super-critical case. This is therefore the most possible reason that the cyclotron line energy of Cepheus X-4 remains stable for wide range of variation of its luminosity. Nishimura 2014 studied cyclotron line variation with source luminosity based on changes in polar cap dimensions, direction of propagation and changes of shock height with source luminosity. He successfully explained observed changes, for some of the wind-fed X-ray pulsars using his model. Interestingly, it was demonstrated that for a luminosity range of erg s-1 line forming region remains almost same in terms of its dimensions and location, which do not change considerably with luminosity this was particularly demonstrated for the X-ray pulsar X0115+63. This result is similar to the observations of Cepheus X-4, where it showed stability of cyclotron line energy for higher source luminosity.
IV.3 Pulse Phase-resolved Spectra
Pulse-phase resolved spectroscopy for Cepheus X-4 was first performed with Ginga observations during 1988 outburst, for studies of the physical condition of line forming regions. An absorbed power-law with cyclotron scattering cut-off model was applied to the spectral data (Mihara et al. 1991). It was subsequently followed up during 2014 outburst observed by NuSTAR, where an absorbed Fermi-Dirac cutoff model combined with a black-body, an Fe-emission line and a cyclotron absorption line was employed for studies (Bhargava et al. 2019). AstroSat observation of 2018 outburst of Cepheus X-4 was used for the most recent studies of phase resolved spectroscopy. A combined model defined by an absorbed compTT-model with a Gaussian for Fe-emission line along with a cyclotron absorption line defined by cyclabs-model was employed for 5-spectra derived from 5-different pulse phases for studies. Results obtained from the two AstroSat observations are presented along with its spin-pulse overlay in Figure 9, with the source luminosity differing by a factor . The AstroSat results are also compared with earlier results in the following discussion below.
The variation in spectral continuum and cyclotron line parameters were estimated over the pulse phase. This was done by measuring difference in the parameter range (maximum – minimum) and expressed in percentage with respect to its phase-averaged value shown in Table 1. The 1- error in percentage was determined by considering respective 1- error in 3 parameters considered. The parameter variation is significant, if the variation is found to be more than 3- confidence limit. Thus, variation in cyclotron line energy for two AstroSat observations were found as , %, the line-width as %, % and its optical-depth as %, % respectively. The variation in spectral parameters such as soft photon Wien temperature were found as %, % and plasma temperature as %, % and for its associated optical-depth as %, % respectively, for two AstroSat observations. This shows that only component of the spectral continuum defined by compTT-model, plasma optical-depth showed significant variation over the pulse phase for both AstroSat observations. While cyclotron line energy showed considerable and relatively higher variation for observation-2 than observation-1 for AstroSat, it is not statistically significant though. The cyclotron line-width showed considerable variation for two observations, whereas, the variation in line-depth was not statistically significant for both of the observations within error limits. This when compared to Ginga results, we find variation in line-energy of %, and in line-width as % whereas in its line optical-depth as %. The source luminosity was relatively much higher for Ginga (Mihara et al. 1991) as can be seen in the Table 3. It was noticed that the variation in line-width of the cyclotron line was though higher for two AstroSat observations, but the measurements errors were also relatively higher than that of the Ginga observation. The variation of the optical-depth of the cyclotron line during two AstroSat observations are though comparable to Ginga, but due to larger errors associated with AstroSat, we are not able to detect any significant change during these observations. The results from two NuSTAR observations in 2014, showed variations in cyclotron line energy of %, % when measurement for observation-2 with very large error was dis-regarded and next minimum was considered. The cyclotron line-width variation of %, % and optical-depth of %, %, were observed respectively for two observations of NuSTAR, at different source flux (or luminosity) as given in Table 3. As the pulse-phase was divided into 9 different phases for NuSTAR data, therefore, these variations are higher compared to AstroSat results, where pulse-phase was divided into 5 longer phase intervals and resultant variations were relatively lower due to effect of phase averaging. There could also be a marginal effect due to selection of different continuum model particularly for Ginga results. Therefore, direct comparison of these variations may not be appropriate. However, one can compare observed trend of these variations of cyclotron line parameters with pulse-phase. A similar trend of variation of the centroid energy of cyclotron line was noticed, for AstroSat 2018 data as that of NuSTAR 2014 observations. It remains almost stable within error limits except within the rising and the falling edge of the primary-pulse of AstroSat, where these variations are consistent with respect to NuSTAR observation-2 at lower source luminosity. The cyclotron line-width variations trend almost followed pulse intensity, for both the AstroSat observations. This variation from NuSTAR results was found to be very similar to observation-1 than that of observation-2. AstroSat observation of cyclotron line optical-depth variation for both observations are found almost stable with the spin-pulse intensity variation except in the pulse minima where it showed increasing trend. The optical-depths of cyclotron line for the AstroSat observation-2 showed marginally higher values for all the phases than the observation-1. The NuSTAR measurements of optical depth appeared to show variation with spin-phase for observation-1 within its large error limits, however for observation-2, during the rising phase of the secondary pulse, it remains almost same at relatively lower value. Thus, AstroSat phase resolved spectroscopy although showed overall a similar trend of variations except with distinct differences corresponding to certain phases where extent of relative variations are different.
Cepheus X-4 showed overall variation of 5–10% in cyclotron line-energy over the pulse-phase. In contrast to this, other sources such as Cen X-3 (Burderi et al. 2000; Suchy et al. 2008), Vela X-1 (La Barbara et al. 2003; Kreykenbohm et al. 2002), 4U 0115+63 (Heindl et al. 2004), GX 301–2 (Kreykenbohm et al. 2004; Suchy et al. 2012), Her X-1 (Voges et al. 1982; Soong et al. 1990; Klochkov et al. 2008) and GRO J2058+42 (Mukerjee et al. 2020), showed variation in their fundamental cyclotron line energy of about 10–30% over the pulse-phase. The variation in cyclotron features with pulse-phase may occur due to overall effect of superposition of a number of lines formed at different heights of line-forming region in its accretion column, affected by a large field gradient of neutron star magnetic field. Therefore, variation of the centroid energy and shape of the cyclotron absorption feature may be possible depending on orientation of the overall system and visibility of accretion column with respect to line of sight (Nishimura 2015). The variation in spectral continuum as well as in the cyclotron lines, may occur due to influence of the velocity of bulk motion of in-falling plasma in the line-forming regions as explained in the recent work by Nishimura 2019. As line forming regions are located near the walls of the accretion column of its cylindrical geometry and spectral continuum are formed above and around the accumulated mound close to surface of the neutron star. Therefore, based on the relative location of these two regions with respect to an observer line of sight, variation in the spectral continuum as well as variation in cyclotron-line parameters could be observed during certain pulse-phase depending on optimum conditions of the overall system such as velocity of the bulk motion of the in-falling matter, gravitational effects on the emitted radiation and local variation of its magnetic field (Nishimura 2019). The neutron star surface area where magnetic field is more intense, may produces a hotter region resulting in a relatively hotter plasma accumulation. These may cause a significant variation in the spectrum due to the interaction of accelerated high energy particles with soft photons which give rise to the process of Comptonization, resulting change in the spectral shape with pulse phase. It is therefore inferred that the observed phase dependent changes in the spectral features as well as in the parameters of the cyclotron line for Cepheus X-4 during AstroSat observation, could likely be due to such changes such as in the geometry, physical conditions in the accretion column, local magnetic field strength of the line producing region and the system orientation with respect to the observer line of sight during its spin phase, at a particular source luminosity.
The cyclotron line energy of Cepheus X-4 within 90% confidence limit showed variation with its pulse phase in a range of (28.5–32.9) keV. This indicate a variation in the magnetic field strength of (3.2–3.7) G over the pulse phase of the pulsar including the gravitational effect of its neutron star. The magnetic field strength derived from its spectrum for Cepheus X-4 is comparable to the magnitude of other X-ray pulsars, such as X-Persei ( keV) (Coburn et al. 2001), RX J0440.9+4431 ( keV) (Tsygankov et al. 2012), RX J0520.5-6932 ( keV) (Tendulkar et al. 2014) and Cen X-3 ( keV) (Ji, L et al. 2019). where energy values of their respective fundamental cyclotron absorption features are shown within parenthesis.
V Conclusion
Timing and spectral properties of Cepheus X-4 were studied during declining phase of 2018 outburst, using AstroSat observations at two different source luminosities. The pulsar was observed in spin-down phase during both the observations. Spin-period and spin-down rate of the pulsar were determined as s, Hz s-1 at MJD 58301.61850 and s, Hz s-1 at MJD 58307.40211 for two observations. Pulse-profiles derived at different energy bands covering 0.5–60 keV, showed pronounced and multiple structures at lower energies, and showed a variation in shape and pulse-fraction with energy. The RMS pulse fraction showed variations with energy and source luminosity. After certain higher luminosity of the source, pulse fraction showed overall decrease. Pulse-profiles derived from recent AstroSat observations were found to be similar in shape to those reported earlier from RXTE 1997 and NuSTAR 2014 observations. The pulsar between the outburst showed continuous spinning down at an average rate of Hz s-1 over last 30 years, due to its entry into subsonic propeller regime. Spectral measurements between 0.7–55 keV showed difference in its continuum for two different source luminosity for phase-averaged spectrum. The prominent cyclotron resonance scattering features with a peak absorption energy of keV and keV for FD-cutoff model and keV and keV for compTT-model were detected. The cyclotron line energy showed some deviations below a specific source luminosity, otherwise remained stable at an average value of 30.23 0.22 keV established from our studies. The pulse-phase dependent variations were observed in some of the parameters of spectral continuum and cyclotron line. These variations were more for the lower luminosity of the source. The detection of cyclotron line lead to determination of strength of its strong magnetic field of the neutron star. Therefore, using AstroSat observation, we could establish the variation of strength of magnetic field over the pulse-phase of the pulsar as (3.2–3.7) G. Further, follow up observation of the source during its rare outbursts would offer us scope for study spectral variability with source luminosity, variation of magnetic field strength with time and to probe nature of its accretion column and geometry where cyclotron lines are produced.
References
- Agrawal et al. (1997) Agrawal, P.C. et al. 1997, Journal of Korean Astronomical Society 29, S219
- Angelini et al. (1989) Angelini L., Stella L. & Parmar A. N., 1989, ApJ, 346, 906
- Antia et al. (2017) Antia, H. M. et al. 2017 ApJS, 231, 10
- Antia et al. (2020) Antia, H. M. et al. 2021 JA& A (in press) arXiv:21010751
- La Barbara et al. (2001) La Barbara, A., et al. 2001 ApJ, 553, 375
- La Barbara et al. (2003) La Barbara, A., et al. 2003 A&A, 400, 993
- Becker et al. (2007) Becker, P. A., & Wolff, M. T. 2007, ApJ, 654, 435
- Becker et al. (2012) Becker, P. A., Klochkov, D., Schonherr, G., Nishimura, O., Ferrigno, C., Caballero, I., Kretschmar, P., Wolff, M. T., Wilms, J., Staubert, R. 2012, A & A, 544, A123
- Beri et al. (2021) Beri, A. et al. 2021, MNRAS, 500,556B
- Bhargava et al. (2019) Bhargava, Y. et al. 2019, MNRAS, 482, 2902-2912
- Bildsten et al. (1997) Bildsten, L. et al. 1997, ApJS, 113, 367.
- Bonnet-Bidaud and Mouchet (1998) Bonnet-Bidaud J. M.and Mouchet M. 2005, A&A, 433, 1079.
- Burnard et al. (1983) Burnard, D. J., Arons, D. & Lee, S. M. 1983, ApJ, 266, 175.
- Coburn et al. (2001) Coburn, W., Heindl, W. A., Gruber, D. E., et al. 2001, ApJ, 552, 738
- Coburn et al. (2002) Coburn, W. et al. 2002, ApJ, 580, 394.
- Burderi et al. (2000) Burderi, L. et al. 2000, ApJ, 530, 429.
- Dai Hai-Lang et al. (2016) Dai, Hai-Lang, Liu, Xi-Wei, & Li Xiang-Dong. 2016 MNRAS, 457, 3889
- DeCesar et al. (2013) DeCesar, M. E., et al. 2013 APJ, 762, 61
- Davies & Pringle (1981) Davies, R. E. & Pringle, J. E.. 1981 MNRAS, 196, 209
- Doroshenko et al. (2010) Doroshenko, V. et al. 2010, A&A, 515, L1
- Dugair et al. (2013) Dugair, M. R., et al. 2013 MNRAS, 434, 2458
- Enoto et al. (2014) Enoto T. et al. 2014, ApJ, 786, 127
- Ferinelli et al. (2008) Ferinelli R. et al. 2008, ApJ, 680, 602
- Ferrigno et al. (2009) Ferrigno C. et al. 2009, A&A, 498, 852
- Finger et al. (1996) Finger, M. H., Wilson, R. B., & Harmon, B. A. 1996, ApJ, 459, 288
- Finger et al. (1998) Finger, M. H., 1998, Adv. Space Res. vol 22, No.7, 1007
- Frank et al. (2002) Frank, J., King, A., & Raine, D. J. 2002 Accretion Power in Astrophysics, pp. 398. ISBN 0521620538. Cambridge, UK: Cambridge University Press, February 2002
- Furst et al. (2015) Furst F. et al. 2015, ApJ, 806, L24-L29.
- Galloway (2000) Galloway, D. K. 2000, ApJ, 543, L137-140.
- Ghosh & Lamb (1979) Ghosh, P. $ Lamb, F. K. 1979, ApJ, 234, 296.
- Harrison et al. (2013) Harrison, F. A. et al. 2013, ApJ, 770, 103.
- Heindl et al. (1999) Heindl, W. A. et al. 1999, ApJ, 521, L49-53.
- Heindl et al. (2004) Heindl, W. A. et al. 2004, in AIP Conf. Proc.714, X-RAY TIMING 2003: Rossie and Beyond, ed. P. Kaaret, F. K. Lamb, & J. H. Swank (Melville, NY: AIP), 323
- Illarionov & Sunyaev (1975) Illarionov, A. F. & Sunyaev R. A. 1975, A&A 39, 185
- Ikhsanov (2001) Ikhsanov, N. R. 2001, A & A 368, L5
- Ikhsanov (2004) Ikhsanov, N. R. & Choi C. S. 2004, A & A 423, 1023
- Jaiswal et al. (2015) Jaiswal, G. K. et al. 2015, MNRAS, 453, L21-L25.
- Jaiswal et al. (2020) Jaiswal, G. K. et al. 2020, MNRAS, 498, Issue 4, 4830.
- Ji, L et al. (2019) Ji, L. et al. 2019, MNRAS, 484, 3797.
- Jun et al. (2012) Jun, L. et al. 2012, MNRAS, 423, 2854
- Klochkov et al. (2008) Klochkov, D. et al., 2008, A&A 482,907
- Klus et al. (2014) Klus, H., Ho, W. C. G., Coe, M. J., Corbet, R. H. D., & Townsend, L. J. 2014, MNRAS, 437, 3863
- Koyama et al. (1991) Koyama, K. et al., 1991, A&A 366,L19-L22
- Kreykenbohm et al. (2002) Kreykenbohm, I. et al., 2002, A&A 395, 129
- Kreykenbohm et al. (2004) Kreykenbohm, I. et al., 2004, A&A 427, 975
- Krimm et al. (2013) Krimm, H. A. et al., 2013, ApJSS 209, 14
- La Parola et al. (2016) La Parola, V., Cusumano, G., Segreto, A., & D Ai, A. 2016, MNRAS, 463, 185
- Lamb et al. (1973) Lamb, F. K., Pethick, C. J., & Pines, D. 1973, ApJ, 184, 271
- Lovelace et al. (1995) Lovelace, R. V. E. 1995, MNRAS, 275, 244
- Lutovinov et al. (2017) Lutovinov, A. A., Tsygankov, S. S., Krivonos, R. A., Molkov, S. V., & Poutanen, J. 2017, ApJ, 834, 209
- Maitra & Paul (2013) Maitra, C. & Paul, B. 2013, ApJ. 763, 79
- Maitra (2017) Maitra, C. 2017, J Ap. Astr., 38, 50
- Makishima et al. (1990) Makishima, K., Mihara, T., Ishida, M., et al. 1990, ApJ, 365, L59
- Malacaria et al. (2020) Malacaria C., Jenke P., 3 Robert O. J., Wilson-Hodge C. A., Cleveland W.H., ApJ,896,90, 2020
- McBride et al. (2007) McBride V. A. et al. 2007, A&A, 470, 1065-1070.
- Mihara (1995) Mihara, T. . 1995, Ph. D. Thesis, University of Tokyo, Japan.
- Mihara et al. (1991) Mihara, T. et al. 1991, ApJ, 379, L61-L64
- Mitsuda et al. (2007) Mitsuda, K. et al. 2007, PASJ, 59,1
- Molkov et al. (2019) Molkov, S., Lutovinov, A., Tsygankov, S., Mereminskiy, I., & Mushtukov, A. 2019, ApJL, 883, L11
- Mukerjee et al. (2000) Mukerjee, K., Agrawal, P. C. et al. 2000, A&A, 353, 239
- Mukerjee et al. (2001) Mukerjee, K., Agrawal, P. C. et al. 2001, ApJ, 548, 368
- Mukerjee et al. (2020) Mukerjee, K., Antia, H. M. & Katoch, T. 2020, ApJ, 897, 73
- Nelson et al. (2000) Nelson, R. W. et al. 2000, ApJ, 999, L1-L4
- Nishimura (2003) Nishimura, O. 2003, PASJ, 55,849
- Nishimura (2005) Nishimura, O. 2005, PASJ, 57, 769
- Nishimura (2013) Nishimura, O. 2013, PASJ, 65,84
- Nishimura (2014) Nishimura, O. 2014, ApJ, 781,30
- Nishimura (2015) Nishimura, O. 2015, ApJ, 807, 164
- Nishimura (2019) Nishimura, O. 2019, PASJ, 71(2), 42(1-9)
- Okazaki et al. (2001) Okazaki A. T. and Negueruela I. 2001, A&A, 377, 161
- Okazaki et al. (2002) Okazaki A. T., Bate M. R., Ogilvie G. I. and Pringle J. E. 2002, MNRAS, 337, 967
- Okazaki (2016) Okazaki A. T. 2016, APS Conference series, Vol 506, 1
- Parmar et al. (1989b) Parmar, A., et al. 1989, ApJ, 338, 359
- Parmar et al. (1989a) Parmar, A., et al. 1989, ApJ, 338, 373
- Paul et al. (2001) Paul, B., et al. 2001, A&A 370, 529
- Pravdo & Ghosh (2001) Pravdo, S. H. & Ghosh, P. 2001, ApJ 554, 383
- Poutanen et al. (2013) Poutanen, J., et al. 2013, ApJ 777, 115
- Postnov et al. (2015) Postnov, K. A., Mironov, A. I., Lutovinov, A. A., et al. 2015, MNRAS, 446, 1013
- Pringle & Rees (1972) Pringle, R. E., & Rees, M. J. 1972, A & A, 21, 1
- Qui et al. (2005) Qu L. J.. et al. 2005, ApJ, 629, L33-L36
- Rappaport et al. (2004) Rappaport, S. A., et al. 2004, ApJ 606, 436
- Reig (2011) Reig, P., 2011 Ap&SS 332, issue 1, p 1-29
- Riquelme et al. (2012) Riquelme, M. S., Torrejon, J. M., & Negueruela, I. 2012, A & A, 539, A114
- Rothschild et al. (1998) Rothschild R. E. et al. 1998, ApJ, 496, 538
- Schulz et al. (1995) Schulz, N.-S. et al. 1995, A&A 295,413-419
- Schwarm et al. (2017) Schwarm, F.-W. et al. 2017, A&A 601, A99
- Shakura et al. (2012) Shakura N.. Postnov K., Kochetkova A. Hjalmarsdotter, L., 2012, MNRAS, 420, 216
- Shakura et al. (2014) Shakura N.. Postnov K., Sidoli L., Paizis A., 2014, MNRAS, 442, 2325
- Singh et al. (2016) Singh, K. P., et al. 2016, Proceedings of the SPIE, Volume 9905, id. 99051E 10 pp.
- Soong & Swank (1989) Soong, Y., & Swank, J. H. 1989, Proc. 23rd ESLAB Symp. on Two Topics in X-ray Astronomy, eds. J. Hunt, & B. Battrick, ESASP 296..617S
- Soong et al. (1990) Soong, Y., et al. 1990, ApJ, 348, 641
- Sreehari et al. (2019) Sreehari, H., Ravishankar, B. T., Iyer, N. et al. 2019, MNRAS, 487, 928
- Sridhar et al. (2019) Sridhar, N., Bhattacharyya, S., Chandra, S., Antia, H. M. 2019, MNRAS, 487, 4221
- Staubert et al. (2019) Staubert, R., Trumper, J., Kendziorra, E., et al. 2019, A&A, 622, A61
- Suchy et al. (2008) Suchy, S., et al. 2008, ApJ, 675, 1487
- Suchy et al. (2011) Suchy, S., et al. 2011, ApJ, 733, 15
- Suchy et al. (2012) Suchy, S., et al. 2012, ApJ, 745, 124
- Sugizaki et al. (2017) Sugizaki M. et al. 2017, PASJ, vol 69, no 6, 100(1-22)
- Tanaka (1986) Tanaka, Y. 1986, in IAU Colloq. 89: Radiation Hydrodynamics in Stars and Compact Objects, eds. D. Mihalas & K.-H. A. Winkler, 198
- Tendulkar et al. (2014) Tendulkar, S. P. et al. 2014, ApJ, 795, 154
- Titarchuk (1994) Titarchuk, L. 1994, ApJ 434, 570
- Truemper et al. (1978) Truemper, L. et al. 1978, ApJ 219, L105-L110
- Tsygankov et al. (2012) Tsygankov, S. S. 2012, MNRAS, 421, 2407
- Ulmer et al. (1973) Ulmer, M.P. et al. 1973, ApJ 184, L117-L120
- Unger et al. (1992) Unger S. J., Norton A. J., Coe M. J., Letho H. J., 1992, MNRAS, 256, 725
- Varun et al. (2019) Varun et al. 2019, ApJ, 880, 61
- Voges et al. (1982) Voges, W. et al. 1982, ApJ, 263,803
- Vybornov et al. (2017) Vybornov, V. et al. 2017, A&A 601, A126
- Wang et al. (2014) Wang, D. H., Chen, L., Zhang, C. M., Lei, Y. J., and Qu, J. L., 2014, Astronomische Nachrichten 335, 168-177
- Wilson et al. (1999) Wilson, C. A., Finger, M. H. & Scott, D. 1999, ApJ 511,367-373
- Yoshida et al. (2017) Yoshida, Y. et al. 2017, ApJ 838, 30