Timing and spectral variability of high mass X-ray pulsar GX 301–2 over orbital phases observed by Insight-HXMT2021Timing and spectral variability of high mass X-ray pulsar GX 301–2 over orbital phases observed by Insight-HXMT–2
Abstract
We report the orbital X-ray variability of high mass X-ray binary (HMXB) GX 301–2. GX 301–2 undergone a spin up process in 2018–2020 with the period evolving from 685 s to 670 s. The energy resolved pulse-profiles of the pulsar in 1–60 keV varied from single peaked and sinusoidal shapes to multi-peaked across different orbital phases. Pulse fractions evolving over orbit had negative correlations with the X-ray flux. The broad-band X-ray energy spectrum of the pulsar can be described with a partial covering negative positive cutoff power-law continuum model. Near the periastron passage of the pulsar we found a strong variation in the additional column density (), which correlated with variation of the flux. Curves of growth for both Fe K and Fe K lines were plotted to investigate the distribution of matter around neutron star. We have also found the evidence of two cyclotron absorption lines in the phase-averaged spectra in GX 301–2, with one line of 30–42 keV and the other line varying in 48–56 keV. Both two line’s centroid energies show the similar relationship with X-ray luminosity: positive correlation in lower luminosity range, and negative relation above a critical luminosity of . We estimated the surface magnetic field of the neutron star in GX 301–2 at G. Two cyclotron line energies have a nearly fixed ratio of while having a low strength ratio (), suggesting that these two features may actually be one line.
Keywords:
stars: neutron – pulsars: individual: GX 301–2– X-rays: stars.1 Introduction
GX 301–2 is a high mass X-ray binary system consisting of a neutron star in a 41.5 d eccentric orbit with a donor star of early type known as Wray 977 (White & Swank 1984). The donor star is massive () having a size of and is at a distance of kpc (Kaper, van der Meer & Najarro 2006). Most recent Gaia measurement implies d=kpc (Bailer-Jones et al. 2018). The stellar wind of this B1 hypergiant companion star is rather dense () and slow (). This high stellar wind mass loss rate could propel the accretion rate onto the neutron star to an observed luminosity of . The luminosity of the Wolf-Rayet companion Wray 977 (Kaper et al. (2006) makes it among the most luminous stars in the Galaxy. The neutron star (NS) in this system has the mass of based on radial-velocity studies (Kaper et al. 2006) and is a rather slowly rotating pulsar (, Nabizadeh et al. 2019; Abarr et al. 2020; Mönkkönen et al. 2020), compared to majority of accreting X-ray pulsars.
The neutron star in GX 301–2 shows strong orbital variability as it traverses through its binary orbit. One of the hallmark characteristics of this system is the recurrence of a pre-periastron flare at the NS. A densely emanating gas stream from the companion hypergiant Wray 977 is recurrently intercepted by the NS shortly before every periastron passage (Leahy 1991; Leahy 2002; Leahy & Kostka 2008). It results in intense X-ray flares with a 25% increase in the X-ray luminosity (Pravdo et al. 1995; Pravdo & Ghosh2001). It is also evident that the continuum X-ray emissions of GX 301–2 modulated by the orbital period attain a peak around the orbital phase 1.4 d before the periastron (see Fig. 3 of Sato et al. 1986).
Leahy & Koska (2008) have studied a ten year long orbital light curve of GX 301–2 with RXTE. These studies reveal that a simple model consisting of a gas stream plus stellar wind accretion onto the NS could explain the substantial changes in the orbital light curve suggesting bright, medium and dim intensity levels across the orbit. The orbital phase dependence of the X-ray flare and flux variation in GX 301–2 has been studied previously with EXOSAT (Haberl 1991), CGRO/BATSE (Koh et al. 1997), ASCA (Endo et al. 2002), RXTE/ASM (Leahy 2002), RXTE/PCA (Mukherjee & Paul 2004), BeppoSAX (La Barbera et al. 2005), and recently with XMM-Newton and MAXI (Islam & Paul 2014), INTEGRAL (Doroshenko et al. 2010; Yu & Wang 2016).
The broad-band X-ray spectrum of GX 301–2 can be explained by various phenomenological models with a power law modified by cutoff at higher energy. At lower energy the spectrum of GX 301–2 gets heavily absorbed (Fürst et al. 2011). This is due to the presence of variable column density, (in the range of ) along the observers line of sight throughout the orbit, and thus indicating the accretion from clumpy stellar wind. To explain the low-energy part of the spectrum, previous studies (La Barbera et al. 2005; Mukherjee & Paul 2004) also used a partial covering component apart from the usual galactic absorption. At energies 6-7 , GX 301–2 also shows many fluorescent lines (Fürst et al. 2011; Zheng et al. 2020) with Fe K emission line at 6.4 being very bright and prominent at different orbital phases. From the ASCAobservations spanning across intermediate, apastron & periastron orbital phases of GX 301–2, Endo et al. (2002) noted a larger width of iron K line (i.e 40–80 eV). A pulsed Fe K line emission was also reported by Chandra observation near periastron (Liu et al. 2018).
In the accreting magnetized neutron star systems, the accretion flow is directed by magnetic field towards the small regions located close to the magnetic poles, where the kinetic energy of the material turns into heat, being emitted in the form of X-ray radiation. A strong magnetic field in the vicinity of NS surface quantizes the energy of electrons and consequently, the Compton scattering and free-free absorption become resonant at the cyclotron energy
| (1) |
and its harmonics, where is the field strength. The resonances result in cyclotron scattering features in the energy spectra of X-ray pulsars. At present, there are more than 30 X-ray pulsars with detected cyclotron scattering features (Staubert et al. 2019), with the fundamental cyclotron line energies from keV (Wang 2014). In most of them, only one cyclotron absorption line is reported.
The cyclotron resonant scattering feature (CRSF) of GX 301–2 around 40 keV was first discovered by Makishima & Mihara (1992) based on Ginga observations. However, the cyclotron line centroid energy in GX 301–2 shows large variations and deviations by different measurements. Based on RXTE data, Kreykenbohm et al. (2004) reported the variable cyclotron line with energies from keV according to the phase-resolved spectra. La Barbera et al. (2005) detected the CRSFs with the centroid energies from keV in different orbital phases with BeppoSAX observations. Doroshenko et al. (2010) detected a cyclotron scattering line at keV in GX 301–2 with INTEGRAL observations. Suzaku broadband spectroscopy on GX 301–2 showed the variations of CRSFs from keV (Suchy et al. 2012). Yu & Wang (2016) reported a variation of the line energy from keV with INTEGRAL/IBIS data. With high resolution spectroscopy by Nustar, Fürst et al. (2018) claimed that this reported broad feature is in fact two absorption lines, at keV and keV separately.
The Chinese hard X-ray modulation telescope (Insight-HXMT, Zhang et al. 2020) provides the high timing resolution and broad X-ray spectral studies on X-ray binaries. Since its launch on 15 June 2017, Insight-HXMT carried out frequent pointing observations on the source GX 301-2, covering the different orbital phases, which provided a chance for us to detailedly study the variations of pulse emission and spectral properties versus orbital phase. In §2, the Insight-HXMT observations and data analysis procedure are introduced. The pulse profiles and the characteristics are studied in §3, and variations of the spectral properties with different orbital phases are shown in §4. We discussed spectral variations and CRSFs in §5. Summary and conclusion are presented in §6.
2 X-ray Observations and data analysis
Insight-HXMT consists of three main detectors: the Low Energy X-ray Detector (LE, Chen et al. 2020), the Medium Energy X-ray Telescope (ME, Cao et al. 2020), and the High Energy X-ray Telescope (HE, Liu et al. 2020). HE contains 18 cylindrical NaI(Tl) / CsI(Na) detectors with a total detection area of 5000 cm2 in the energy range of 20–250 keV. ME is composed of 1728 Si-PIN detectors with a total detection area of 952 cm2 covering the range of 5–30 keV. LE uses Swept Charge Device (SCD) with a total detection area of 384 cm2 covering 1–15 keV. Insight-HXMT have carried out a series of performance verification tests by observing blank sky, standard sources, showing good calibration state and estimation of the instrumental background (Li et al. 2020).
GX 301–2 has been observed numerously by HE, ME and LE telescopes onboard Insight-HXMT satellite between August 3rd, 2017 and June 3rd, 2020 (i.e MJD: 57968 – 59003). These observations cover different orbital phases of the binary orbit (see Figure 1). A log of observations (information of OBSIDs) used in this paper is given in the table as the supplementary material. It should be noted that the LE telescope data of observations with OBSID:P0101309 have been analyzed and published by Ji et al. (2021), who have studied the source at 5.5–8.5 keV. In the following science analysis, we filtered data with the criterion: (1) pointing offset angle ; (2) pointing direction above Earth ; (3) geomagnetic cut-off rigidity value GeV; (4) time since SAA passage s and time to next SAA passage s; (5) for LE observations, pointing direction above bright Earth . The Insight-HXMT Data Analysis Software Package (HXMTDAS) V2.02 was used in this work.
We obtained the X-ray light curves of GX 301–2 in three energy bands: 1–10 keV, 10–30 keV and 30–60 keV (see Figure 2). The spin period of the neutron star in GX 301–2 is about 683 s. We made the barycentric correction of the light curves using the tool hxbary. For timing analysis, we corrected the photon arrival time for the binary motion, using ephemeris by Doroshenko et al. (2010). In the spectral analysis, we used well-calibrated energy bands of LE, ME and HE: 3–8.5 keV, 10–30 keV and 30–70 keV, respectively (Li et al. 2020). However, ME data in 21–24 keV was ignored due to the calibration uncertainties in this energy range. All uncertainties reported in this paper are at 90% confidence level. In the analysis and science presentation, we arranged all observations into two groups based on the orbital phase (Figure 1). For those having orbital phases in 0.2–0.9, we labeled them as apastron observations while others were labeled as periastron.
3 Timing Analysis and Pulse Profiles
The temporal analysis aims to derive the spin period of the neutron star in GX 301–2 at different observations. Then, one can obtain the pulse profiles for three energy bands (1–10 , 10–30 30–60 ). The periodic signal was searched by folding the light curves, determining the chi-square () of the folded light curve and the values versus the periods. The efsearch (a built-in function in HEAsoft) was used to search for the maximum of values. We have fitted the distribution with the theoretical distribution function given by Leahy et al. (1987). We have noticed that the sampling rate of our data was uneven. Consequently, the error was estimated from Equation 2 of Larsson (1996):
| (2) |
where the parameter a was taken to be the value derived by Monte Carlo simulation (i.e. 0.469). N is the total number of data points, A is the sinusoidal amplitude and T is the total time length for the data. The intrinsic spin period values of GX 301–2 in several OBSIDs are presented in Figure 3. The spin period of GX 301–2 varied with time, reflecting the typical behavior in the wind accretion system. In addition, from 2017 – 2020, the neutron star of GX 301–2 showed a long-term spin up from the period of s to 670 s.


The pulse profiles of GX 301–2 are obtained in three energy bands (i.e. 1–10 , 10–30 30–60 ) from observations of LE, ME & HE detectors respectively. There are 25 good OBSIDs in which at least one complete pulse profile could be constructed without any gaps. These pulse profiles are shown in Figure 4.

The pulse profiles changes with the energy bands. In hard X-ray bands above 10 keV, the neutron star generally shows double peaks, sometimes as sinusoidal shapes. In low energy band, the mini-peaks appeared in all orbital phases, which made the double peak features disappear in some orbital phases. The energy resolved pulse-profiles of pulsar are also seen to be varying from single peaked and sinusoidal shapes to multi-peaked across different orbital phases. To study the pulse profile properties over the orbital phase, we calculated the pulse fraction (defined as ) for all light curves and show the variation of versus orbital phase in Figure 5. It is interesting that the mean pulse fraction at the orbital phase 0.85 –0.99 was generally lower than that in other orbital phase for three energy bands, which is also consistent with the results reported by Endo et al. (2002) and Nabizadeh et al. (2019). The neutron star system approaching the periastron showed the X-ray flares, so that the pulse fraction may depend on the X-ray luminosity. In Figure 6, we also plotted the diagrams of three pulse fractions versus observed X-ray flux from 3 –70 keV. The pulse fractions in three energy bands show negative correlation with X-ray flux, higher X-ray flux with the lower pulse fraction values.
4 Spectroscopy over orbital phases
Insight-HXMT pointing observations covered different orbital phases of GX 301–2 (see Figure 1). To understand the spectral properties and variations over the orbit, we obtained and analyzed the broad band x-ray spectra for different orbital phases. The spectra from 3-70 keV obtained by LE, ME and HE detectors are analyzed here.
The continuum spectra of GX 301–2 have been studied extensively (e.g., Fürst et al. 2018; La Barbera et al. 2005, and references therein). The X-ray spectrum of GX 301–2 at 3 –70 keV can generally be described with a partial covered power-law model, corrected with a high energy cutoff. We implemented four kinds of phenomenological models to describe the continuum of GX 301–2 at first. Negative positive cutoff powerlaw or NPEX model (Mihara 1995), FDcut (Tanaka et al. 1986), HIGHECUT, newHcut (almost the same as highecut but being smoothed around the cutoff energy with a third-order polynomial; Burderi et al. 2000). We have smoothed the in-continuity of HIGHECUT with an additional Gabs component.
The models included two absorption components: one is the Galactic ISM absorption with the column density being fixed at cm-2. Another column density parameter is the partial covering photoelectric absorption in the binary system which is expected to vary with the orbital phases. We applied tbnew11 1 http://pulsar.sternwarte.uni-erlangen.de/wilms/research/tbabs/ for both two components.
In the range of 6 –7 keV, there exist complicated emission features in GX 301–2. These features are thought to be caused by fluorescence from neutral or ionized iron present in the material surrounding the neutron star. We added two Gaussian lines to fit the emission line features of Insight-HXMT spectra: Fe K (at keV) and Fe K ( keV) lines. Three parameters for these emission features were summarized in Table 1 including line centroid energy (), line width () and the equivalent width (). The Fe K line around 6.4 keV can be detected in all orbital phases, while the Fe K line around 7 keV could be detected by Insight-HXMT only in part of the pointing observations (also see Figure 8). In addition, as Ji et al. (2021) has confirmed, LE data is unable to constrain the line widths of the fluorescent lines. So, we fixed all these widths at 1 eV. Strong residuals at the lower energy side of Fe K sometime appeared in our data and can be explained by an extended Compton shoulder (CS) (Watanabe et al. 2003; Fürst et al. 2018; Ji et al. 2021). A box function was considered to describe this feature. However, in most of our observations, this feature is statistically insignificant and in principle, the energy resolution of LE telescope is not sufficient to fully resolve shape of the iron line complex. So, we did not fit this feature in the following analysis.
Absorption features around 30 –60 keV appeared in most of the observations, especially for those near the periastron passage. These features should be attributed to the cyclotron resonant scattering features (CRSF) of the magnetized accreting neutron star. We used a multiplicative absorption model with a Gaussian optical depth profile (Gabs in Xspec) to describe the cyclotron absorption line. In addition, a cross instrument calibration constant (CC) was added as the multiplicative components to calibrate the slight unequal flux between different telescopes of Insight-HXMT. Thus, the baseline model in our analysis can be described as:
| (3) |
With two Gabs components modeling the CRSFs, all of these models can obtain an acceptable fit in observations during the pre-periastron flare (see Table 2 and Figure 15). We found that NPEX provided the best description of the overall spectrum with more stable continuum parameters (i.e. photon index and cutoff energy) and lower CRSF errors in most of the cases. In addition, the high energy part of physical model compmag can be closely mimicked by the NPEX (Fürst et al. 2018). We also found that the parameter values of CRSF and NH2 have slight dependence on the continuum. In view of these premises and to compare our results with Fürst et al. (2018), we continued our analysis of CRSFs with the NPEX model for all pointing observations. Spectrum parameters obtained in different orbital phases are summarized in Figure 9. Flux is calculated from the unabsorbed model in different energy ranges and hardness is evaluated from the ratio of flux in 8 –20 keV over the one in 5 –8 keV, i.e. Flux8-20/Flux5-8. We have tried several kinds of hardness ratio (10 –20/3 –10, 30 –70/3 –5 etc.) and found that the definition has only a small effect on its behavior during the orbital motion.
We noticed wavy residuals between 10 and 30 keV in some observations and examined the possibility of the existence of another CRSF with the performance of Crab ratio test (see Figure 7). This ratio has the advantage of minimizing the effects due to the detector response and the uncertainties in the calibrations (Orlandini et al. 1998). We used observations that performed at the same month (i.e. April 2018), divided ME counts at each channel by Crab counts. Previously obtained continuum parameters were applied to fit this ratio while we alter the photon index to compensate for the factor. It was found that no prominent features appeared in 10–20 keV while a very narrow absorption feature was detected at keV. As we have already known that HXMT has large calibration uncertainty in 21–24 keV, this feature is more likely to be instrumental.
In Figure 8, we showed the spectra from 3–70 keV obtained by three detectors LE, ME and HE for different orbital phases. In some observations, after fitting the spectrum with the cyclotron absorption line around 52–55 keV, there still exist an absorption feature in lower energies around 33 keV). We confirmed that this feature can be fitted with another Gaussian absorption feature. We adopt Monte Carlo Markov Chain (MCMC) method to estimate the error and detect any parameter degeneration. During the primary run, each chain was generated using 200000 steps (20 walkers) with the first 10000 steps being burnt. We found that in different orbital phases, the energy ratio of these two lines are fluctuating around a constant while the corresponding MCMC contour illustrate no apparent degeneration between these two parameters (see Figure 12). Thus, it is reasonable to claim that the correlations are intrinsic of the system.
| Observations | P010130900104 | P010130900107 | P010130901801 | P020101228407 |
| NH2 ( cm-2) | ||||
| PCF | ||||
| Ecut (keV) | ||||
| EFeKα (keV) | ||||
| EqWFeKα (keV) | ||||
| EFeKβ (keV) | - | - | ||
| EqWFeKβ (keV) | - | - | ||
| Ecyc1 (keV) | ||||
| (keV) | ||||
| Strength1 | ||||
| Ecyc2 (keV) | - | - | ||
| (keV) | - | - | ||
| Strength2 | - | - | ||
| Flux erg s-1 cm-2 | ||||
| Hardness Ratio | ||||
| Reduced- (dof) | 1.1064 (287) | 1.1353 (287) | 0.9266 (292) | 0.7263 (292) |
We applied the NPEX with one or two absorption lines to fit all observed spectra from 3–70 keV based on Insight-HXMT observations. In the apastron phases, the S/N may be too low to distinguish the second line. In most situations, we took two cyclotron absorption lines in fittings. For some observations near the apastron, the S/N may be too low to distinguish two absorption lines (these features having very small strength), we took only one absorption line then. The model has given good fit to these spectra, with the reduced around 1 (see Table 1). All spectral parameters and their variations over the orbit are then collected and plotted in Figure 9. The spectral parameters really had some changes with orbital phases. X-ray flux and the intrinsic column density show nearly simultaneous variations over orbit, both of which have peaks around pre-periastron and post-periastron orbital phases as expected. The covering factor did not change within a narrow range . The cutoff energy keV and photon index did not show significant variation over orbit.
In all orbital phases, the Fe K line around 6.4 keV was detected, with the equivalent width evolving with the orbital phases. The iron line properties may be related to the column density in the accretion system, which will be discussed in §5.1. The cyclotron absorption lines were detected in the X-ray spectra of GX 301–2, which are at keV and sometimes, another line at keV was also reported. In addition, line energies of these two CRSFs have some correlations. We will discuss it in §5.2.


5 Discussions


5.1 Curve of growth
Theoretically, it is expected that the strength of spectral lines are positively correlated with the absorber optical depth. The equivalent width of Fe K line shows positive correlation with which has been generally known as the curve of growth (see Torrejon et al. 2010; Gimenez-Garcia et al. 2015). Here we can probe the relation between the column density and iron lines observed in GX 301–2. In §4, we have obtained spectral properties over the orbit including two iron lines at 6.4 keV and 7 keV, their equivalent widths, and the corresponding intrinsic absorption column density NH2 for each observation. is around the level of cm-2 at periastron orbital phases, and cm-2 at other phases. In Figure 11, we present the hydrogen column density versus the equivalent width (EqW) of both two iron lines: Fe K line and Fe K line.
For the case of GX 301–2, we confirmed a strong correlation, and a power-law fit in Figure 11 leads to
| (4) |
with the Pearson coefficient (PC) of 0.75.
In addition, we also obtained the equivalent width of the Fe K line in some observations of Insight-HXMT near the pre-periastron orbital phases. Thus we also plotted the of Fe K versus in Figure 11. We found the curve of growth of the Fe K line in GX 301–2. The correlation of versus is not so strong, the powerlaw fit in Figure 11 leads to
| (5) |
with the Pearson coefficient of 0.51.
The derived correlation between the equivalent width of Fe lines and intrinsic column density is not completely consistent with the early work by Ji et al. (2021). This is due to the larger sample and broader energy band (3–70 keV compared to 5.5–8.5 keV) we have adopted. In other high mass X-ray binaries, this relation was also reported (Torrejon et al. 2010; Gimenez-Garcia et al. 2015). GX 301–2 shows the similar behavior to that of other X-ray binaries (see the good example of IGR J16320-4751 in Gimenez-Garcia et al. 2015). From the left panel of Figure 11, at cm-2, increased to at cm-2. During the periastron flare, the curve of growth for GX 301–2 is in good agreement with the numerical simulation shown in Gimenez-Garcia et al. (2015). However, at apastron, our result showed a significant deviation from the spherical accretion scenario (EqW values are lower than the simulations, see Figure 11).
5.2 Cyclotron absorption line energies
GX 301–2 has been studied extensively, and the cyclotron absorption line energy varied in a wide range from keV based on previous observations. Insight-HXMT detected the cyclotron lines both in periastron and apastron orbital phases, where two cyclotron absorption lines with a Gaussian profile are reported, one line around keV, and the other around keV. Two possible absorption lines at keV and keV reported by NuSTAR (Fürst et al. 2018) were then confirmed by Insight-HXMT. This interpretation can explain the wide energy range and wild variability of the line parameters in previous study.
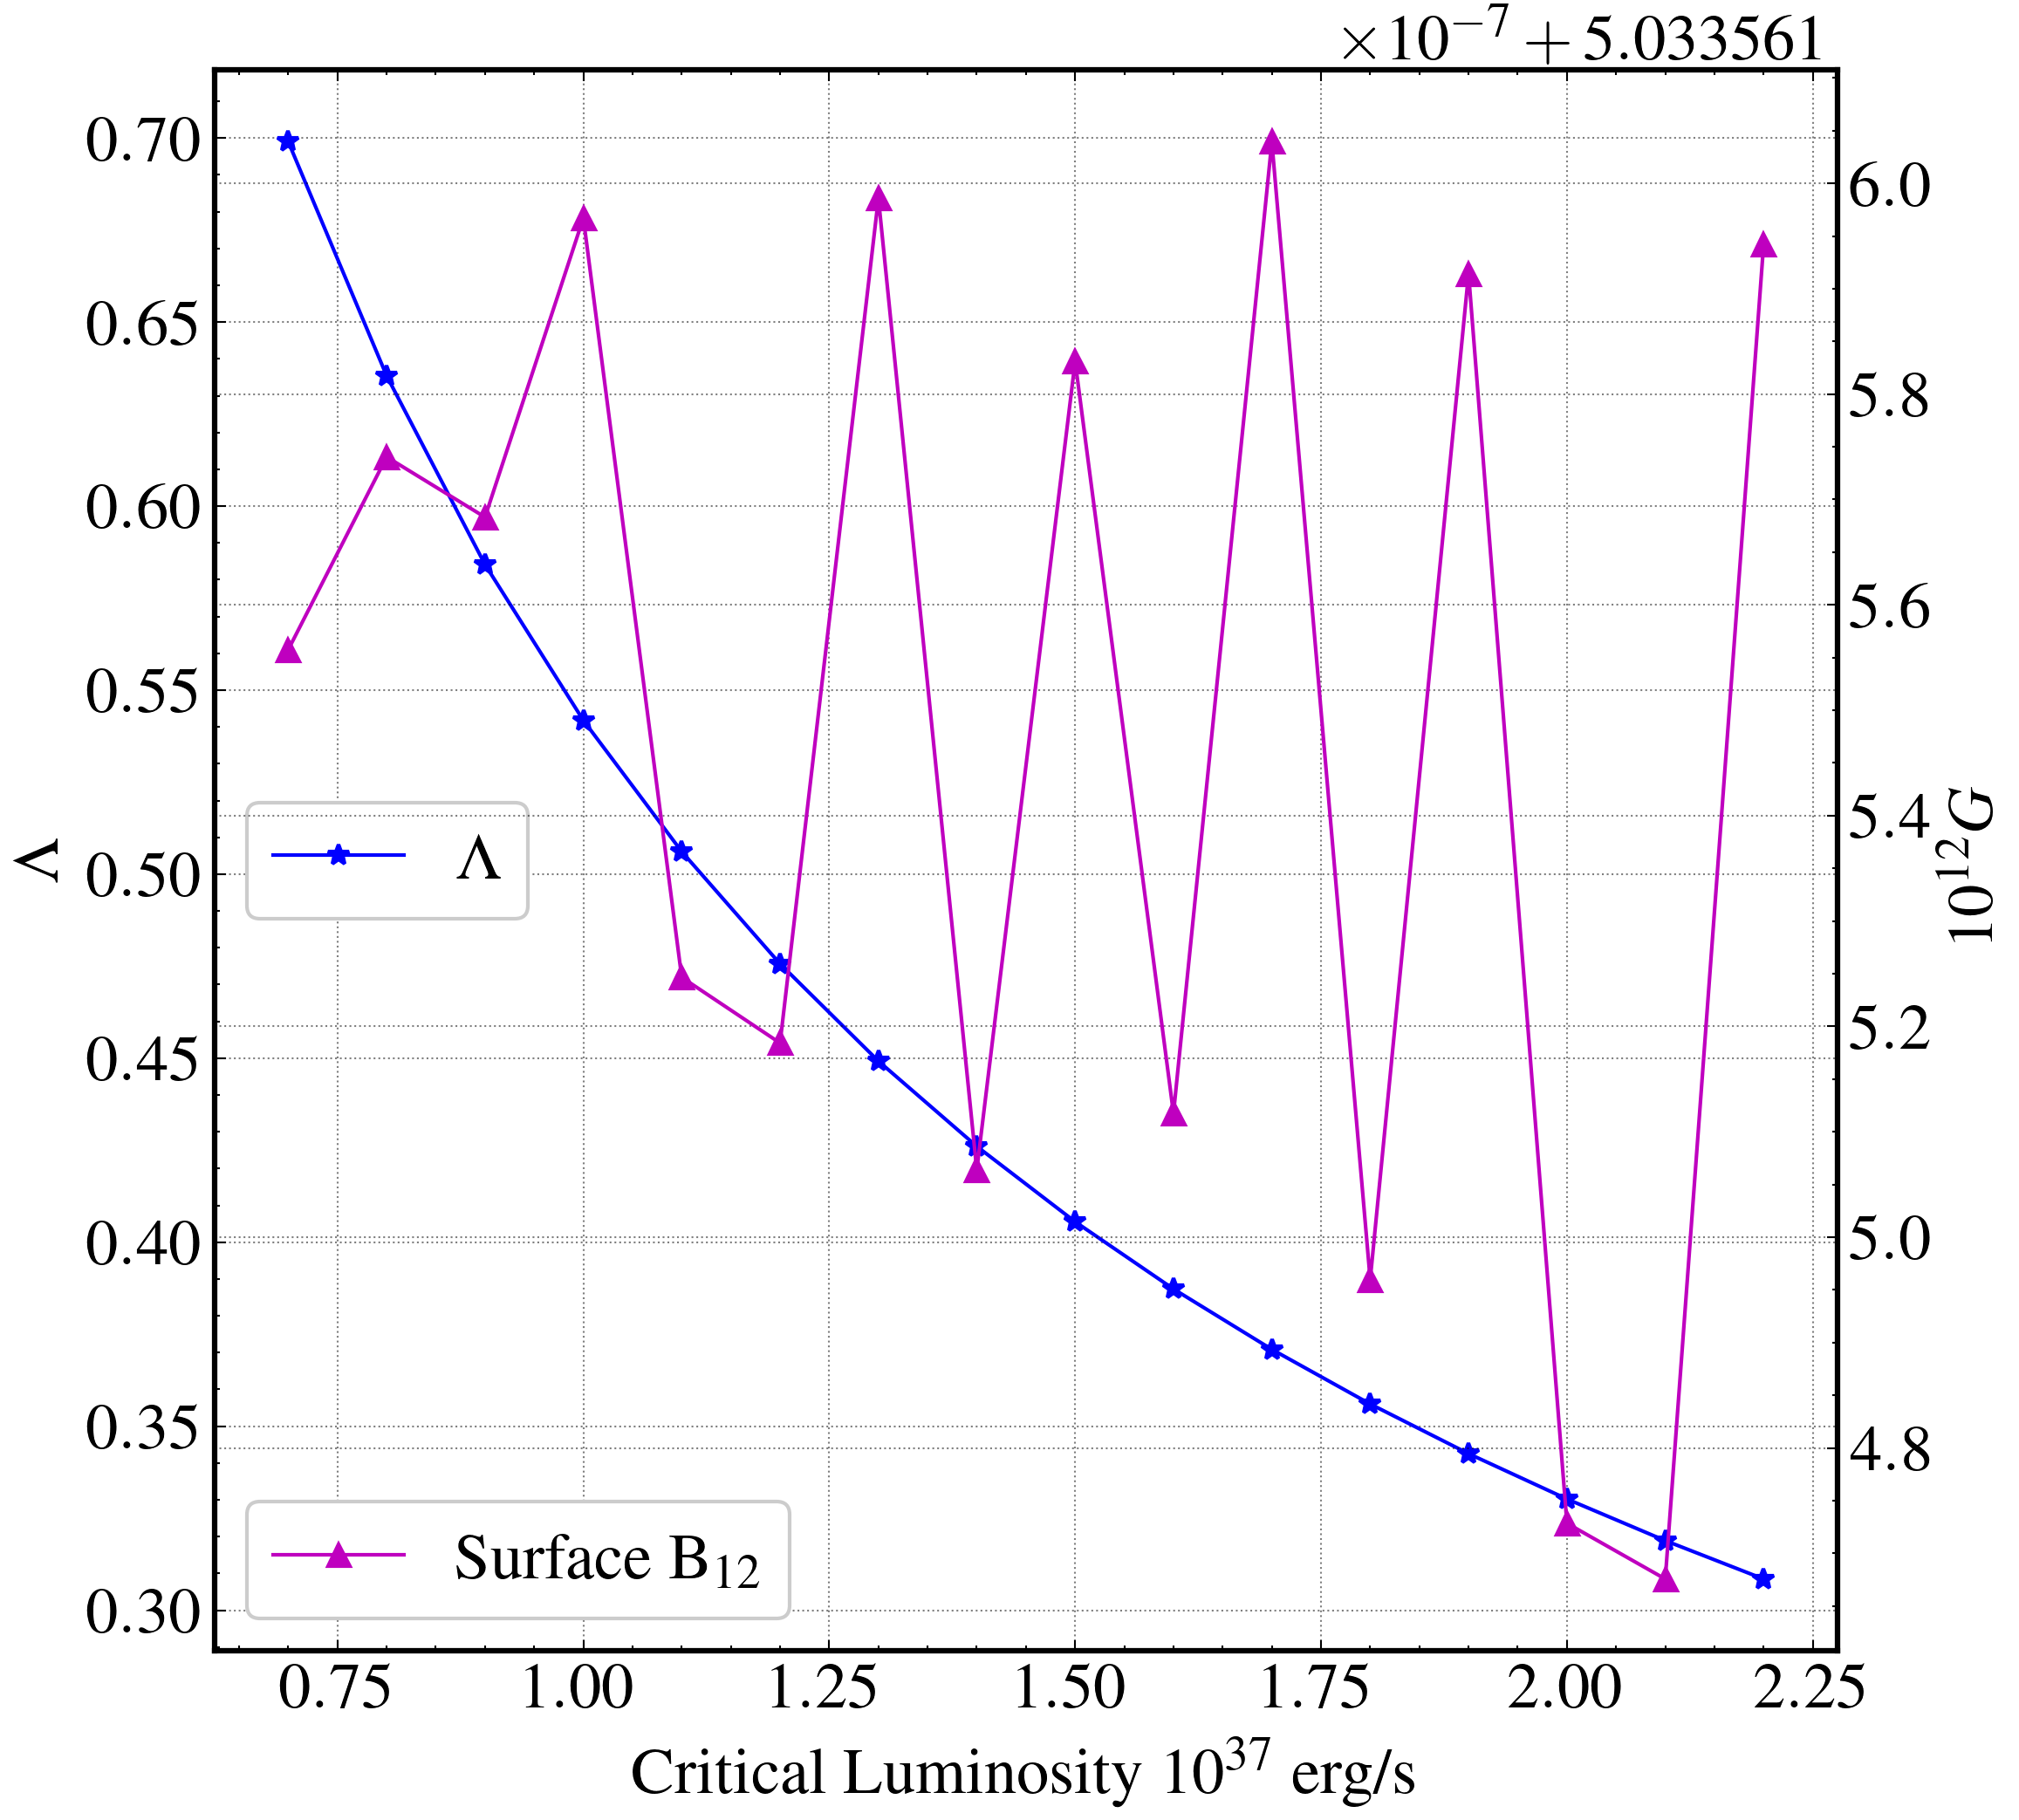
Combining about 40 pointing observation data, we analyze the CRSF line parameters systematically. From Figure 13, we found that the two centroid energies of CRSFs have a very strong linear correlation, indicating a fixed ratio between them. We confirmed the result is not due to the parameter degeneration during fitting process (see Figure 12). This ratio do not scale like 1 : 2 but is about 1 : 1.63, which is significantly greater than that derived by Fürst et al. (2018) but still too small compared to the value predicted by Mészáros (1992). It is suggested that there may exist two line forming regions (Fürst et al. 2018), situated at the surface of NS and 1.4 km above it respectively. This interpretation is based on the premise of Coulomb-radiation-dominated deceleration regime. The corresponding shock height can be calculated from Eq. (51) in Becker et al. (2012), assuming radius of the NS to be 10 km and a mass of 1.8, we have:
| (6) |
As the shock height should decrease with increasing luminosity, this regime will require a positive correlation of the CRSF energy with luminosity. This correlation was observed in low luminosity stage for both two CRSFs simultaneously (see left panel of Figure 13). Two forming region interpretation (Fürst et al. 2018) claimed that the higher energy absorption line around 50 keV was situated at the surface of NS, thus being unable to account for the strong correlation between the line energy and X-ray luminosity, unless the surface magnetic field of the neutron star also evolves during the orbital motion (should be impossible).
In addition, in more luminous range, we observed a negative correlation of the line centroid energy and X-ray luminosity for both two lines, which suggested the existence of a critical luminosity in GX 301–2. We have taken a broken powerlaw model to fit the relation of for both two lines. The cutoff luminosity is determined to be erg s-1 for the high energy line, and erg s-1 for the lower one (see left panel of Figure 13 for more details on the position of the determined critical luminosity in the fittings). Thus, we at first derived the critical luminosity in GX 301–2 from the X-ray observations. At critical luminosity, the radiation pressure at the base of neutron star accretion column can contribute significantly to the deceleration of infalling materials, which can defined as the function of the cyclotron absorption line energy (Becker et al. 2012):
| (7) |
where and are the mass and radius of neutron star, respectively; in the case of spherical accretion, and in disc accretion case (Becker et al. 2012; Harding et al. 1984).
Considering the uncertainty, we suggested the observed critical luminosity range in GX 301–2 of . Although during the spin-up event (MJD 58400-58600, only four available observations) GX 301–2 was considered having an accretion disc, observations in this stage still had only very low luminosity and thus low S/N for spectral analysis. Consequently, none of them were plotted on Figure 13. In a word, wind accretion may dominate the accretion process in our data, which generally should be a spherical symmetric process. According to Equation 7, given for spherical symmetric accretion, we found that the energy of the CRSF on the surface of neutron star reaches the range of keV, suggesting a surface magnetic field of G in GX 301–2. Thus the neutron star in GX 301–2 would be a strongly magnetized neutron star of typical magnetic field in the order of G (a little lower than the typical magnetar-like field suggested by Doroshenko et al. 2010). We concluded that the observed cyclotron absorption lines at energies of 30 – 56 keV are likely to be produced at the height cm above the star surface, supporting the existence of a tall accretion column structure during periastron flare.
However, such a CRSF emission area height actually contradicts with Equation 6, which indicates an emission height tenfold lower than what we have derived by the critical luminosity. This may make our interpretation self-contradicting. Here, we proposed another possibility that the parameter may not be 1, because the result in Figure 11 has shown significant deviation from isotropic. However, there is no any conclusive evidence that could prove the existence of disc accretion either. Consequently, assuming a dipole magnetic field structure, we did a numerical calculation to obtain possible , keeping the emission height derived by Becker et al. (2012) equal to the observed values (critical luminosity and CRSF centroid energy are derived from the broken powerlaw fitting in Figure 13), the corresponding results are shown in Figure 14. The values are generally less than 1 (wind accretion) but greater than 0.1 (disc accretion) while the best-fitting surface magnetic field stayed at G. This result implies a complicated accretion environment including a blending of wind and disc accretion.
We also compared our results with the model proposed by Mushtukov et al. (2015). Assuming and equal flux for X- and O-modes, the calculated critical luminosity for a NS with magnetic field of G is erg s-1, corresponding to =0.5 and 1.0 respectively (see Figure 7 of their paper). This result is also in good agreement with our observation. Considered the large uncertainty in and mixing polarization modes, the difference between their model and the one from Becker et al. (2012) may not be significant.
We noticed that in most of the orbital phases, especially that near the periastron (see Figure 9), the strength ratio of these CRSFs fluctuates around 0.05. This result indicates that we may observe only one line but with a significant deviation from a simple empirical function, which is due to the superposition of CRSFs in different forming regions with different heights (Nishimura 2015). Such deviations have also been theoretically predicted by Schwarm et al. (2017) with MC simulations. Future numerical simulations and more detailed comparison between observations and simulated results could probe the physical origin of the very broad absorption feature.
6 Summary and Conclusion
GX 301–2 is an interesting X-ray pulsars showing significant variation with the orbital phases both in light curves and spectral properties. Insight-HXMT has performed multiple pointing observations on this source covering different orbital phases, and found the timing and spectral variations over orbit in GX 301–2. The spin period of GX 301–2 showed variations, in addition, from 2017-2020, the neutron star of GX 301–2 undergone a long-term spin-up state with the period evolving from s to 670 s. The pulse profiles changed in three energy bands and also varied with orbital phases. Pulse fractions from the bands of 3- 60 keV showed negative correlation with the X-ray flux.
The spectral parameters evolved over orbit in GX 301–2. The X-ray flux correlates to the column density, showing peaks near the periastron and apastron orbital phases. The Fe K line was detected in all orbital phases. In some orbital phases, the Fe K line at keV was also detected. The curve of growth for both two iron fluorescence lines were obtained, their equivalent width have a positive correlation with the column density.
Two CRSFs at keV and keV in GX 301–2 were confirmed by the Insight-HXMT observations. The cyclotron line energies showed slight variation over orbit and strong correlation with each other, having a fixed ratio . The strength ratio between these two features stayed at during most of the phases. A simultaneous increase of line energy with X-ray luminosity for both two CRSFs was observed in low flux range, while in luminous states, both the two line energies showed a negative relation with the luminosity. The observed critical luminosity is around erg s-1. Thus, if wind accretion does dominate GX 301–2, we estimated the surface magnetic field of the neutron star in GX 301–2 as G. Another possibility is that GX 301–2 undergoes a blending of disc and wind accretion during periastron flare, with a magnetic field of G. The environment there is more complicated than we have postulated. In any case, GX 301–2 should be a highly magnetized neutron star, but its field is still lower than the typical field of magnetars (Doroshenko et al. 2010; Wang 2013). The observational phenomena indicated a strong coupling between two CRSFs. The two forming region interpretation proposed by Fürst et al. (2018) could not account for such a correlation between the line energies and luminosity. We proposed that we observed only one line but with a significant deviation from a simple empirical function. According to the observed critical luminosity, if wind accretion predominate, the line forming region may be high above the neutron star surface. The future simulated physical CRSF profile is expected to account for the strange line profile in GX 301–2.
Acknowledgments
We are grateful to the referee for the fruitful and constructive suggestions and comments to improve the manuscript. The work is supported by the NSFC (U1838103, 11622326, U1838201, U1838202), the National Program on Key Research and Development Project (Grants No. 2016YFA0400803, 2016YFA0400800). This work made use of data from the Insight-HXMT mission, a project funded by China National Space Administration (CNSA) and the Chinese Academy of Sciences (CAS).
Data Availability
Data that were used in this paper are from Institute of High Energy Physics Chinese Academy of Sciences(IHEP-CAS) and are publicly available for download from the Insight-HXMT website. To process and fit the spectrum and obtain folded light curves, this research has made use of XRONOS and FTOOLS provided by NASA.
References
- [Abarr, et al.2020] Abarr Q., et al., 2020, ApJ, 891, 70
- [Burderi2000] Burderi L., Di Salvo T., Robba N. R., La Barbera A., Guainazzi M., 2000, ApJ, 530, 429
- [Becker, et al.2012] Becker P. A. et al., 2012, A&A 544, A123
- [Bailer-Jones, et al.] Bailer-Jones C. A. L., Rybizki J., Fouesneau, M., Mantelet, G., Andrae R., 2018, AJ, 156, 58
- [cao et al.2020] Cao X. et al., 2020, Science China Physics, Mechanics, and Astronomy, 63, 249504
- [chen et al.2020] Chen Y., Cui, W., Li W. et al. 2020, Science China Physics, Mechanics, and Astronomy, 63, 249505
- [Doroshenko, et al.2010] Doroshenko V., Santangelo A., Suleimanov V., Kreykenbohm I., Staubert R., Ferrigno C., Klochkov D., 2010, A&A, 515, A10
- [Endo, et al.2002] Endo T., Ishida M., Masai K., Kunieda H., Inoue H., Nagase F., 2002, ApJ, 574, 879
- [Fürst, et al.2011] Fürst F. et al., 2011, A&A, 535, A9
- [Fürst, et al.2018] Fürst F. et al., 2018, A&A, 620, A153
- [Gimenez-Garcia, et al.2015] Gimenez-Garcia A. et al., 2015, A&A, 576, A108
- [harding1984] Harding A. K., Kirk J. G., Galloway D. J., Mészáros P. et al. 1984, ApJ, 278, 369
- [Haberl1991] Haberl F., 1991, ApJ, 376, 245
- [Ikhsanov & Finger2012] Ikhsanov N. R., Finger M. H., 2012, ApJ, 753, 1
- [Islam & Paul2014] Islam N., Paul B., 2014, MNRAS, 441, 2539
- [Ji, L. et al.] Ji L. et al., 2021, MNRAS, 501, 2522
- [Kaper, van der Meer & Najarro2006] Kaper L., van der Meer A., Najarro F., 2006, A&A, 457, 595
- [Koh, et al.1997] Koh D. T., et al., 1997, ApJ, 479, 933
- [Kreykenbohm, et al.2004] Kreykenbohm I., et al., 2004, A&A, 427, 975
- [La Barbera, et al.2005] La Barbera A., Segreto A., Santangelo A., Kreykenbohm I., Orlandini M., 2005, A&A, 438, 617
- [Larsson1996] Larsson S., 1996, A&A, 117, 197
- [Leahy1987] Leahy D. A., 1987, A&A, 180, 275
- [Leahy1991] Leahy D. A., 1991, MNRAS, 250, 310
- [Leahy2002] Leahy D. A., 2002, A&A, 391, 219
- [Leahy & Kostka2008] Leahy D. A., Kostka M., 2008, MNRAS, 384, 747
- [li et al. 2020] Li X., Tan Y. et al. 2020, Journal of High Energy Astrophysics, 27, 64
- [Liu, et al.2018] Liu J., Soria R., Qiao E., Liu J., 2018, MNRAS, 480, 4746
- [liu et al. 2020] Liu C. et al. 2020, Science China Physics, Mechanics, and Astronomy, 63, 249503
- [Mészáros1992] Mészáros, P. 1992, High-energy Radiation from Magnetized Neutron Stars (Chicago: University of Chicago Press)
- [mihara1995] Mihara, T. 1995, PhD thesis, Univ. of Tokyo
- [Makishima & Mihara 1992] Makishima, K., & Mihara, T. 1992, Magnetic Fields of Neutron Starss
- [Mönkkönen, et al.2020] Mönkkönen J., Doroshenko V., Tsygankov S. S., Nabizadeh A., Abolmasov P., Poutanen J., 2020, MNRAS, 494, 2178
- [Mukherjee & Paul2004] Mukherjee U., Paul B., 2004, A&A, 427, 567
- [mushtukov2015] Mushtukov A., Suleimanov V. F., Tsygankov S. S., Poutanen J., 2015, MNRAS, 447, 1847–1856
- [Nabizadeh, et al.2019] Nabizadeh A., Mönkkönen J., Tsygankov S. S., Doroshenko V., Molkov S. V., Poutanen J., 2019, A&A, 629, A101
- [Nishimura2015] Nishimura O., 2015, ApJ, 807, 164
- [Orlandini, et al.1998] Orlandini M. et al., 1998, ApJ, 500, 163-166
- [Orlandini, et al.2000] Orlandini M., dal Fiume D., Frontera F., Oosterbroek T., Parmar A. N., Santangelo A., Segreto A., 2000, AdSpR, 25, 417
- [Pravdo et al.1995] Pravdo S. H, Day C. S. R., Angelini L. et al., 1995, ApJ, 454, 872
- [Pravdo & Ghosh2001] Pravdo S. H., Ghosh P., 2001, ApJ, 554, 383
- [Sato, et al.1986] Sato N., Nagase F., Kawai N., Kelley R. L., Rappaport S., White N. E., 1986, ApJ, 304, 241
- [Staubert et al.2019] Staubert R. et al. 2019, A&A, 622, A61
- [Suchy, et al.2012] Suchy S., et al., 2012, ApJ, 745, 124
- [Schwarm, et al.2017] Schwarm F.-W, et al., 2017, A&A, 601, A99
- [Tanaka1987] anaka Y., 1986, IAU Colloq. 89: Radiation Hydrodynamics in Stars , Compact Objects, 255, 198
- [Torrejon et al.2010] Torrejon J. M., Schulz N. S., Nowak M. A., & Kallman T. R., 2010, ApJ, 715, 947
- [Tsygankov, et al.2004] Tsygankov S. S., Lutovinov A. A., Grebenev S. A., Gilfanov M. R., Sunyaev R. A., 2004, AstL, 30, 540
- [Wang2013] Wang, W., 2013, MNRAS, 432, 954
- [Wang2014] Wang, W., 2014, Research in Astronomy and Astrophysics, 14, 565
- [White & Swank1984] White N. E., Swank J. H., 1984, ApJ, 287, 856
- [Yu & Wang2016] Yu G. W., Wang W., 2016, Astronomical Research & Technology, 13, 11
- [zhang et al.2020] Zhang S.-N. et al. 2020, Science China Physics, Mechanics, and Astronomy, 63, 249502
- [Zheng, Liu & Gou2020] Zheng X., Liu J., Gou L., 2020, MNRAS, 491, 4802
Appendix A Different continuum models
| Models | FDcut | newHcut | highEcut | NPEX |
| NH2 ( cm-2) | 88.8 | 98 | 101 | |
| PCF | ||||
| 1.235 | 1.21 | 0.001 | 1.30 | |
| Efold (keV) | - | |||
| Ecut (keV) | 7.30 | |||
| EFeKα (keV) | 6.435 | |||
| EFeKβ (keV) | 6.773 | 7.1 | 7.08 | 7.08 |
| Ecyc1 (keV) | 35.1 | 39.4 | 31.7 | 31.9 |
| (keV) | 6.2 | 4.1 | ||
| Strength1 | 17.9 | 6.5 | 7.6 | |
| Ecyc2 (keV) | 49.3 | 51.6 | ||
| (keV) | 6.8 | 3.2 | 9.3 | |
| Strength2 | 48.0 | 16 | ||
| Reduced- (dof) | 0.8646 (269) | 0.8645 (270) | 0.8323 (267) | 0.8732 (272) |