The Hubble Tension Revisited:
Additional Local Distance Ladder Uncertainties
Abstract
In a recent paper, we investigated possible systematic uncertainties related to the Cepheid color-luminosity calibration method and their influence on the tension between the Hubble constant as inferred from distances to Type Ia supernovae and the cosmic microwave background as measured with the Planck satellite. Here, we study the impact of other sources of uncertainty in the supernova distance ladder, including Cepheid temperature and metallicity variations, supernova magnitudes and GAIA parallax distances. Using Cepheid data in 19 Type Ia supernova host galaxies from Riess et al. 2016, anchor data from Riess et al. 2016; Riess et al. 2019; Riess et al. 2021 and a set of re-calibrated Milky Way Cepheid distances, we obtain km/s/Mpc, from the Planck value. Excluding Cepheids with estimated color excesses mag to mitigate the impact of the Cepheid color-luminosity calibration, the inferred Hubble constant is km/s/Mpc, removing the tension with the Planck value.
Keywords:
Cepheid distance (217), Hubble constant (758), Type Ia supernovae (1728), Interstellar dust extinction (837)I Introduction
Cepheid stars are crucial in building up the distance ladder to Type Ia supernovae (SNIa) when estimating the Hubble constant . To be used as standard candles, Cepheids need to be calibrated with respect to fact that
- •
long period Cepheids are brighter,
- •
red Cepheids are dimmer,
- •
and Cepheids in high metallicity environments may be brighter.
The Cepheid color-luminosity (C-L) correlation may be understood as a combination of extrinsic dust extinction and intrinsic temperature variations (Pejcha & Kochanek 2012). Given the difficulty in separating these effects, Cepheids are usually calibrated using a phenomenological approach where a parameter, , corrects for both dust and intrinsic variations (Madore 1982). The correction can be applied to observed colors, as by the SH0ES team in e.g. Riess et al. 2016, or estimated color excesses, as in Follin & Knox 2018, derived by subtracting a model for the mean intrinsic Cepheid color. Regardless of which method is employed, it will by necessity correct for both extrinsic and intrinsic color variations since the observed color and estimated color excess only differ by a linear term depending on the Cepheid period. When assuming a global value for , the choice of calibration method is of minor importance since only the difference between Cepheid magnitudes in anchor and SNIa host galaxies matters for the inference. When allowing for the calibration parameter to vary between galaxies, motivated by the observed variation in dust properties (Mortsell et al. 2021), the choice of calibration can potentially make a difference. As demonstrated in Mortsell et al. 2021, using Wesenheit H-band magnitudes calibrated with respect to the observed color where a global is allowed to vary gives (in units of km/s/Mpc implied from now on), whereas calibrating using estimated color excesses with individual galactic yields , a tension with the value inferred from the cosmic microwave background (CMB) observations with the Planck satellite (Aghanim et al. 2020). Arguably being closest to a physical Cepheid model as presented in Pejcha & Kochanek 2012, throughout the paper, we will use the color excess calibration as our default method for investigation11 1 The SH0ES team have presented an updated Hubble constant value of ( Planck tension) using an, yet not publicly available, expanded SNIa and Cepheid data set (Riess et al. 2022). As in Mortsell et al. 2021, we here make use of the data from Riess et al. 2016; Riess et al. 2019; Riess et al. 2021 and Breuval et al. 2020..
We first point out that the Cepheid color excess distributions have substantial variations between galaxies, and that the inferred is sensitive to the introduction of color cuts in the data. Next, we investigate the impact of Cepheid temperature variations on the inferred uncertainty and discuss how systematic effects connected to the metallicity calibration may shift the inferred and increase the error budget. We express concerns about the reliability of the Milky Way (MW) Cepheid parallax distance calibration and show that the local Cepheid calibrated SNIa magnitude uncertainties may be underestimated. Finally, we combine the different systematic effects using Monte Carlo simulations and derive constraints on the Hubble constant.
II Method and Data
II.1 Cepheid Calibration
We use the Hubble Space Telescope (HST) near-infrared flux (), color calibrated using optical ( and ) data, to derive
| (1) |
Here, represents a proxy for the color excess , with the intrinsic Cepheid color. It is obtained by subtracting an estimate of the mean intrinsic colors, from the observed colors. We use mean intrinsic colors from Tammann et al. 2011, including the quoted uncertainties and a dispersion in the mean intrinsic Cepheid color between galaxies, from the difference between Large Magellanic Cloud (LMC) and MW Cepheids, see Table 1.
| Galaxy | |
|---|---|
| MW | |
| LMC, | |
| LMC, |
These colors are in good agreement with results in Pejcha & Kochanek 2012. We fit for the values of that minimize the scatter in .
The Wesenheit magnitude of the th Cepheid in the th galaxy, including the anchor galaxies MW, NGC 4258 and the Large Magellanic Cloud (LMC), is modeled as
| (2) |
with the Cepheid metallicity, the absolute Cepheid magnitude normalized to a period of days and Solar metallicity and the distance modulus to the th galaxy. We use separate P-L relations for short and long period Cepheids
| (3) |
where for Cepheids with periods days and for Cepheids with periods days.
II.2 Type Ia Supernovae
The apparent SNIa B-band peak magnitude in the th host, corrected for the width-luminosity and C-L relations using the SALT2 model (Guy et al. 2007), is modeled by
| (4) |
The errors on include the fitting uncertainty and a magnitude contribution to take into account the intrinsic SNIa dispersion added in quadrature (Riess et al. 2016; Mortsell et al. 2021).
II.3 Data and Parameter Fitting
For Cepheids in M31 and beyond, we use data from Table 4 in Riess et al. 2016. For Cepheids in the LMC, we use data in Table 2 in Riess et al. 2019. Data for MW Cepheids, including GAIA parallax measurements are from Table 1 in Riess et al. 2021.
20 double eclipsing binaries (DEBs) observed using long-baseline near-infrared interferometry give a distance to the LMC of mag (Paczynski 1996; Pietrzyński et al. 2019; Riess et al. 2019). Observations of mega-masers in Keplerian motion around its central super massive black hole give a distance to NGC 4258 of mag (Reid et al. 2019).
Type Ia SN B-band magnitudes are from Table 5 in Riess et al. 2016, derived using version 2.4 of SALT II (Betoule et al. 2014).
Given the observed Cepheid magnitudes , color excesses , periods , metallicities , together with the SNIa magnitudes , the anchor distances and the MW Cepheid parallaxes , we fit simultaneously for , , , the host galaxy distances , the anchor distances , the GAIA parallax offset , the Cepheid absolute magnitude and the SNIa absolute magnitude . For linear parameters, the fit can be made analytically. The exception is the ; since the uncertainties in the observed Cepheid colors are non-negligible, the uncertainties in the derived Wesenheit magnitudes will depend on the values of , requiring a non-linear treatment of these parameters using Markov chain Monte Carlo (MCMC) techniques, see Mortsell et al. 2021.
II.4 Default Results for Color excess Calibration
Using similar assumption as in Mortsell et al. 2021, allowing for to vary between galaxies, with weak flat prior constraints on their values , we obtain , in tension with the Planck value. For a fixed global value of , following Riess et al. 2016, we obtain (). These are the default results to which we will relate the impact of other systematic effects, the latter having the advantage of only including linearly fitted parameters, substantially reducing the computational cost when comparing different scenarios. Note that the error bars do not yet include the intrinsic Cepheid color scatter, see Section VIII.
III Color excess distributions and cuts
As discussed in Mortsell et al. 2021, the fact that Cepheid colors and periods are correlated (Tammann et al. 2011) may cause color selection effects related to the fact that longer period Cepheids are brighter. From Figure 1, showing the different distributions of the color excess , large variations between the different galaxies employed in the Cepheid distance calibration are evident.

This fact, possibly attributed to selection effects, may introduce systematic errors when comparing the derived Cepheid distances. MW are systematically redder compared to other anchors and SNIa host galaxies, and also have a strong correlation of long period Cepheids having larger color excesses. For each individual MW Cepheid, we compare the estimated color excess with three dimensional dust maps based on GAIA, Pan-STARRS 1 and 2MASS data where applicable (Green et al. 2019; Green 2018). The generally good agreement as shown in Figure 2 confirms that the majority of the color excess is due to interstellar dust extinction, but with room for contributions from circumstellar dust and intrinsic temperature variations.

Given that the statistical uncertainty contribution to is dominated by SNIa magnitude errors, one can afford to make rather severe cuts in the Cepheid data in order to minimize the impact of systematic effects, including color cuts to try to homogenize the different color excess distributions between galaxies.
Here, we investigate the impact on of mitigating the color calibration impact by removing the reddest Cepheids, most susceptible to dust extinction. In Figure 3, we show the fitted as a function of the cut in we apply, when calibrating using color excesses for individual in the range . We note that the size of the error bars do not significantly increase unless mag, and that the inferred drifts towards the Planck value when cutting out redder Cepheids.
The reason for to decrease when removing red Cepheids is that even after applying the color calibration of equation 1, in individual galaxies there are still left-over correlations between the and . This will be the case also when allowing for individual galactic since the fitted value will not only depend on the slope of the magnitude-color diagram, but also on its normalization. After color calibration, and tend to be anti-correlated in SNIa host galaxies and correlated in anchor galaxies, see Table 2. Removing Cepheids with large therefore increases the mean in SNIa host galaxies and decreases the mean in anchor galaxies. As discussed in Mortsell et al. 2021, both of these effects decrease the inferred . The exception is MW Cepheids that have and with slightly stronger anti-correlation than SNIa hosts. However, the fact that the MW Cepheid color excess distribution is heavily biased toward high values means that when applying a cut in mag, too few MW Cepheid will remain to contribute appreciably to the inferred .
| Galaxies | |
|---|---|
| MW | |
| LMC | |
| N4258 | |
| SNIa hosts |
Applying mag, motivated by this being the cut where statistical Cepheid uncertainties are still subdominant and we expect dust extinction not to dominate the Cepheid excess colors, we obtain for individually fitted . Assuming a fixed global value of , closer in line with the analysis in Riess et al. 2016, we obtain for the same color cut. As evident from Figure 1, this cut effectively removes all MW Cepheids.

IV Temperature variations
Given our inability to separate dust and Cepheid temperature color effects, we will here treat the temperature magnitude and color variations as an additional source of uncertainty, following the physical Cepheid model from Pejcha & Kochanek 2012. Denoting the mean temperature deviation for a specific Cepheid by , the absolute X-band magnitude will shift according to
| (5) |
where is the mean absolute magnitude at the specific period, color and metallicity. for a large range of filters are observationally constrained in Pejcha & Kochanek 2012, where also temperature variations are estimated to given the width of the Cepheid instability strip. The intrinsic color (ic) excess will accordingly be given by
| (6) |
For each Cepheid, we randomly assign a temperature from and adjust the H-magnitude and color excess according to
| (7) |
assuming and . The induced impact on the inferred is estimated generating random Monte Carlo samples, see Section VIII. Note that it makes sense treating the temperature color excess as noise for the dust color excess since the former is subdominant, with mag.
V Metallicities
We correct for possible metallicity effects on the luminosity using , where the bracket is a shorthand notation for
| (8) |
For the default case with , we infer .
In Riess et al. 2016, individual Cepheid metallicities are estimated using . For LMC Cepheids, a common value of was used. In Riess et al. 2019, this was updated to , also used in Mortsell et al. 2021, referring to Riess et al. 2016 having indicating the identification . However, since
| (9) |
this is only true if . As stated in Israelian et al. 1998, studies agree that [O/Fe] increase when [Fe/H] decrease from 0 to . Approximating this dependence to be linear, , we can write
| (10) |
Figure 3 in Amarsi et al. 2015 and figure 20 in Luck 2018 suggest that , with an uncertainty of order .
Subsequently, in Romaniello et al. 2022 iron and oxygen abundances of of 89 Cepheids in the LMC yielded an updated metallicity of , which we will use as our default value for Cepheids in the LMC when deriving our final results in Section VIII. When estimating the Cepheid metallicity from iron and oxygen abundances, state-of-art compilations differ by in the difference (Vagnozzi 2019). In von Steiger & Zurbuchen 2015, a value of is given, corresponding to which we will use as our default value, with an dispersion to take into account the uncertainty between Cepheid metallicities estimated from oxygen and iron abundances.
V.1 Impact on
The derived decreases slightly with decreasing the LMC metallicity. For a fixed value , shifting decreases the inferred Hubble constant with .
The inferred depends on as , and changing from to , we obtain for . A constant systematic shift in the Cepheid metallicities as inferred from iron and oxygen abundances can be parametrized by changing the assumed solar oxygen abundance. An increase will increase with . Shifting , for we get ( tension). The full impact on the inferred when allowing also for varying galactic is estimated using Monte Carlo techniques in Section VIII.
VI Milky Way Parallax Uncertainties
Trigonometric parallaxes potentially provide the most direct calibration of the Cepheid absolute magnitude, . We use data from Riess et al. 2021, with 68 MW Cepheids having estimated GAIA parallaxes. As described in Lindegren et al. 2021, there are systematic errors in the published GAIA parallax values, with the parallax bias depending on, for example, the magnitude, color and angular position of the source. Although the GAIA team provide tentative expressions for the parallax correction, given that these corrections are uncertain for sources as bright as the MW Cepheids used in this study, here, as well as in Riess et al. 2021, we will allow for the possibility of residual parallax biases to correct for. Possible systematic GAIA Cepheid parallax uncertainties were investigated using globular clusters in Vasiliev & Baumgardt 2021 and Maíz Apellániz et al. 2021. Based on MW Cepheid parallax uncertainties and metallicity effects, in Owens et al. 2022 and references therein, it was also concluded that the uncertainty in the derived Cepheid distance scale may be underestimated, suggesting a systematic error floor of .
For the th Cepheid in the MW,
| (11) |
where the distance modulii for each Cepheid is estimated using GAIA parallaxes, , according to
| (12) |
where is a residual parallax calibration offset that we fit for together with and by writing
| (13) |
effectively transforming into a linear parameter, and
| (14) |
Higher order terms, , are small and corrected for in an iterative manner. So far, with the exception that we fit for simultanously with all other parameters, this is similar to the approach in Riess et al. 2021. For the default case where we calibrate an individual extinction law for each galaxy in the interval , we obtain . For a fixed global value of , .
After correcting for a constant residual parallax offset in the GAIA data, we may have a residual that correlates with magnitude and color, see figure 4. For the magnitude, we have a negative Pearson correlation of and for the color a positive Pearson correlation .

We therefore also add corrections of the form
| (15) |
Using the MW as the sole anchor galaxy with a fixed , adding increases the Hubble constant from to . Adding also gives . The fact that a change in the parallax offset parameterization can induce a shift of introduces doubt about the uncertainty estimates.
An interesting possibility for calibrating MW Cepheid distances circumventing problems connected to their bright nature and variability is to employ Cepheids for which the distance can be estimated from the parallax of spatially resolved companions or their host open cluster. In Breuval et al. 2020, a sample of 36 MW Cepheids is constructed in this way, and assuming a fixed value for the GAIA calibration off-set, it was noted that the inferred is decreased comparing to the case of parallaxes measured from the Cepheids themselves. Here, we consider the impact of using the MW Cepheid sample from Breuval et al. 2020 when performing the full simultaneous parameter distance ladder fit, including the GAIA parallax off-set and assuming . The inferred Hubble constant, ( Planck tension), is slightly decreased compared to using the Cepheids in Riess et al. 2021, with slightly larger uncertainties given the smaller MW Cepheid sample size. The value is very similar to the result obtained when skipping MW Cepheids altogether in which case (), before taking other systematic uncertainties into account.
When allowing for individually fitted galactic , we obtain () using the Breuval et al. 2020 MW Cepheid sample, again neglecting additional systematic effects.
VII Supernova Magnitude Uncertainties
If we instead of fitting for a global absolute SNIa magnitude, fit for individual , we obtain one estimate of for each SNIa, see figure 5 for the case of a fixed global .

Apart from noting that only a subset of SNIae are in significant tension with the CMB result for , we also note that the scatter is slightly larger than expected given the individual error bars, possibly indicating underestimated SNIa magnitude uncertainties. Taking the full correlation between the inferred into account, the SNIa error bars should be increased by a factor of in order for the assuming the individual have their origin in a common value. Increasing the by this factor, for the default case we obtain , decreasing the Planck tension slightly to . Fitting galactic individual increases the scatter and the SNIa errors bars need to be increased by by a factor of . Fitting for a global value Hubble constant for default parameter values, gives ( tension). For a set of more restricted priors, with flat priors and Gaussian priors (Mortsell et al. 2021, see), the corresponding SNIa error factors are and respectively.
VII.1 Impact of Type Ia Supernova Data Set
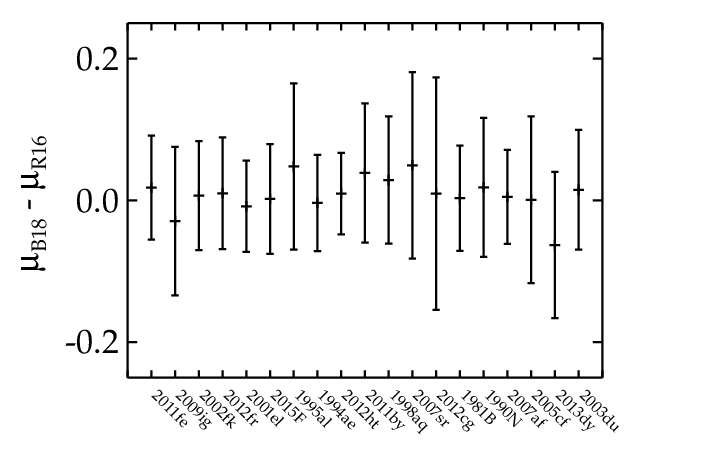
The fact that the statistical error on is dominated by SNIa data, and only a sub-set of the SNIa are in tension with the Planck may raise concerns about the reliability of the individual SNIa magnitude estimates. However, using the SNIa data set from Burns et al. 2018, gives very similar result, indicating that systematic effects related to the SNIa light curve fitting, stretch and color correction are subdominant, see figure 6 (assuming a fixed ). The possibility that Cepheid calibrated SNIae to a larger extent originate in star-forming environments, thus being dimmer compared to the average Hubble flow SNIae, may bias the Hubble constant measurements has been discussed in Rigault et al. 2015.
VIII Results Including Systematic Errors
Finally, we update the LMC metallicity to , rescale SNIa magnitude uncertainties, include metallicity uncertainties, as well as intrinsic color uncertainties and temperature variations by generating random Monte Carlo samples. Here, we use , . For approximate individual contributions to the error budget computed for the case of a fixed , see Table 3. The Hubble constant obtained in this case is ( Planck tension).
| Param | |
|---|---|
| Int color | |
| Int temperature | |
| Metallicity | |
| Metallicity | |
| SNIa error | |
| Total systematic |
Allowing for to vary between galaxies in the range , we get () with a GAIA residual parallax calibration offset of . Assuming flat priors we obtain () and for Gaussian priors ().
Calibrating MW Cepheid distances using companions and host cluster parallaxes following Breuval et al. 2020, we obtain () assuming , with , and () and () for and , respectively.
Applying a color excess cut, only using Cepheids for which mag, we obtain , for individually fitted , and assuming a fixed global value of following Riess et al. 2016. Using the re-calibrated MW Cepheid data set from Breuval et al. 2020, imposing mag, the inferred Hubble constant is .
We thus note that mitigating the color calibration impact by removing Cepheids for which dust extinction is expected to dominate the observed color excess, the inferred from supernovae agree with the Planck value regardless of Cepheid color calibration parameterization. Cutting out the blue Cepheid tail has to the opposite, although less pronounced, effect of increasing the inferred . Requiring mag, we obtain for .
IX Summary
In Mortsell et al. 2021, we investigated the sensitivity of the Hubble constant as inferred from SNIa distances to the choice of Cepheid color calibration method. Here, we complement this analysis by investigating the impact of Cepheid temperature variations, metallicity corrections, supernova magnitude uncertainties and Milky Way parallax systematics. The results are summarized in Figure 7 and Table 4.
| Calibration | Tension | |
|---|---|---|
| Ind gal | ||
| Ind gal | ||
| Ind gal | ||
| MW-B20 | ||
| MW-B20 | ||
| MW-B20 | ||
| Red cut MW-B20 |
Only using MW Cepheids for which distances can be estimated from companions and host cluster parallaxes (Breuval et al. 2020) and flat priors , we obtain , decreasing the difference with the Planck value to , and in good agreement with obtained calibrating the absolute SNIa magnitude using the tip of the red giant branch observations (Freedman et al. 2019). Using more restricted prior values for yield similar results, see Table 4.
A possible caveat with ours, and all other measurements using Cepheid calibrated distances, comes from the fact that the observed Cepheid color excess distribution have large variations across galaxies, and that the inferred Hubble constant is sensitive to color excess cuts in the data. Also applying a color excess cut to remove Cepheids for which dust extinction is expected to dominate the observed color excess, mag, we obtain .
We thus conclude that the current Hubble tension may be affected by systematic effects in the calibration of the local distance ladder, including MW Cepheid distances, as well as Cepheid selection biases.

References
- Aghanim et al. (2020) Aghanim, N., Akrami, Y., Ashdown, M., et al. 2020, A&A, 641, A6, doi: 10.1051/0004-6361/201833910
- Amarsi et al. (2015) Amarsi, A. M., Asplund, M., Collet, R., & Leenaarts, J. 2015, MNRAS: Letters, 454, L11–L15, doi: 10.1093/mnrasl/slv122
- Betoule et al. (2014) Betoule, M., Kessler, R., Guy, J., et al. 2014, A&A, 568, A22, doi: 10.1051/0004-6361/201423413
- Breuval et al. (2020) Breuval, L., Kervella, P., Anderson, R. I., et al. 2020, A&A, 643, A115, doi: 10.1051/0004-6361/202038633
- Burns et al. (2018) Burns, C. R., et al. 2018, ApJ, 869, 56, doi: 10.3847/1538-4357/aae51c
- Follin & Knox (2018) Follin, B., & Knox, L. 2018, MNRAS, 477, 4534–4542, doi: 10.1093/mnras/sty720
- Freedman et al. (2019) Freedman, W. L., Madore, B. F., Hatt, D., et al. 2019, ApJ, 882, 34, doi: 10.3847/1538-4357/ab2f73
- Green (2018) Green, G. M. 2018, The Journal of Open Source Software, 3, 695, doi: 10.21105/joss.00695
- Green et al. (2019) Green, G. M., Schlafly, E., Zucker, C., Speagle, J. S., & Finkbeiner, D. 2019, ApJ, 887, 93, doi: 10.3847/1538-4357/ab5362
- Guy et al. (2007) Guy, J., Astier, P., Baumont, S., et al. 2007, A&A, 466, 11, doi: 10.1051/0004-6361:20066930
- Israelian et al. (1998) Israelian, G., Lopez, R. J. G., & Rebolo, R. 1998, ApJ, 507, 805, doi: 10.1086/306351
- Lindegren et al. (2021) Lindegren, L., Bastian, U., Biermann, M., et al. 2021, å, 649, A4, doi: 10.1051/0004-6361/202039653
- Luck (2018) Luck, R. E. 2018, The Astronomical Journal, 156, 171, doi: 10.3847/1538-3881/aadcac
- Madore (1982) Madore, B. F. 1982, ApJ, 253, 575, doi: 10.1086/159659
- Maíz Apellániz et al. (2021) Maíz Apellániz, J., Pantaleoni González, M., & Barbá, R. H. 2021, A&A, 649, A13, doi: 10.1051/0004-6361/202140418
- Mortsell et al. (2021) Mortsell, E., Goobar, A., Johansson, J., & Dhawan, S. 2021, The Hubble Tension Bites the Dust: Sensitivity of the Hubble Constant Determination to Cepheid Color Calibration. https://arxiv.org/abs/2105.11461
- Owens et al. (2022) Owens, K. A., Freedman, W. L., Madore, B. F., & Lee, A. J. 2022, ApJ, 927, 8, doi: 10.3847/1538-4357/ac479e
- Paczynski (1996) Paczynski, B. 1996. https://arxiv.org/abs/astro-ph/9608094
- Pejcha & Kochanek (2012) Pejcha, O., & Kochanek, C. S. 2012, ApJ, 748, 107, doi: 10.1088/0004-637x/748/2/107
- Pietrzyński et al. (2019) Pietrzyński, G., Graczyk, D., Gallenne, A., et al. 2019, Nature, 567, 200–203, doi: 10.1038/s41586-019-0999-4
- Reid et al. (2019) Reid, M. J., Pesce, D. W., & Riess, A. G. 2019, ApJ, 886, L27, doi: 10.3847/2041-8213/ab552d
- Riess et al. (2021) Riess, A. G., Casertano, S., Yuan, W., et al. 2021, ApJ, 908, L6, doi: 10.3847/2041-8213/abdbaf
- Riess et al. (2019) Riess, A. G., Casertano, S., Yuan, W., Macri, L. M., & Scolnic, D. 2019, ApJ, 876, 85, doi: 10.3847/1538-4357/ab1422
- Riess et al. (2016) Riess, A. G., et al. 2016, ApJ, 826, 56, doi: 10.3847/0004-637X/826/1/56
- Riess et al. (2022) —. 2022, Astrophys. J. Lett., 934, L7, doi: 10.3847/2041-8213/ac5c5b
- Rigault et al. (2015) Rigault, M., Aldering, G., Kowalski, M., et al. 2015, The Astrophysical Journal, 802, 20, doi: 10.1088/0004-637x/802/1/20
- Romaniello et al. (2022) Romaniello, M., Riess, A., Mancino, S., et al. 2022, Astron. Astrophys., 658, A29, doi: 10.1051/0004-6361/202142441
- Tammann et al. (2011) Tammann, G. A., Reindl, B., & Sandage, A. 2011, A&A, 531, A134, doi: 10.1051/0004-6361/201016382
- Vagnozzi (2019) Vagnozzi, S. 2019, Atoms, 7, 41, doi: 10.3390/atoms7020041
- Vasiliev & Baumgardt (2021) Vasiliev, E., & Baumgardt, H. 2021, MNRAS, 505, 5978, doi: 10.1093/mnras/stab1475
- von Steiger & Zurbuchen (2015) von Steiger, R., & Zurbuchen, T. H. 2015, ApJ, 816, 13, doi: 10.3847/0004-637x/816/1/13