Contrastive Attention for Automatic Chest X-ray Report Generation
Abstract
Recently, chest X-ray report generation, which aims to automatically generate descriptions of given chest X-ray images, has received growing research interests. The key challenge of chest X-ray report generation is to accurately capture and describe the abnormal regions. In most cases, the normal regions dominate the entire chest X-ray image, and the corresponding descriptions of these normal regions dominate the final report. Due to such data bias, learning-based models may fail to attend to abnormal regions. In this work, to effectively capture and describe abnormal regions, we propose the Contrastive Attention (CA) model. Instead of solely focusing on the current input image, the CA model compares the current input image with normal images to distill the contrastive information. The acquired contrastive information can better represent the visual features of abnormal regions. According to the experiments on the public IU-X-ray and MIMIC-CXR datasets, incorporating our CA into several existing models can boost their performance across most metrics. In addition, according to the analysis, the CA model can help existing models better attend to the abnormal regions and provide more accurate descriptions which are crucial for an interpretable diagnosis. Specifically, we achieve the state-of-the-art results on the two public datasets.

1 Introduction
A medical report is a paragraph containing multiple sentences that describe both the normal and abnormal regions in the chest X-ray image. Chest X-ray images and their corresponding reports are widely used in clinical diagnosis Delrue et al. 2011. However, writing medical reports requires particular domain knowledge Goergen et al. 2013, and only experienced radiologists can accurately interpret chest X-ray images and note down corresponding findings in a coherent manner. An automatic chest X-ray report generation system Jing et al. 2018; Jing et al. 2019; Liu et al. 2021; Liu et al. 2019b can reduce the workload of radiologists and are in urgent need Brady et al. 2012; Delrue et al. 2011.
In recent years, several deep learning-based methods have been proposed Jing et al. 2018; Jing et al. 2019; Li et al. 2018; Li et al. 2019; Chen et al. 2020c; Liu et al. 2021 for automatic chest X-ray report generation; however, there are serious data deviation problems in the medical report corpus. For example, 1) the normal images dominate the dataset over the abnormal ones Shin et al. 2016; 2) given an input image, the normal regions usually dominate the image and their descriptions dominate the medical report Jing et al. 2019; Liu et al. 2021. Such data deviation may prevent learning-based methods from capturing the rare but important abnormal regions (e.g., lesion regions). As a result, the learning-based model tends to generate plausible general reports with no prominent abnormal narratives Jing et al. 2019; Li et al. 2018; Yuan et al. 2019. In clinical practice, accurate detection and depiction of abnormalities are more helpful in disease diagnosing and treatment planning. Therefore, existing learning-based methods may fail to assist radiologists in clinical decision-making Goergen et al. 2013.
To capture the abnormal regions from a chest X-ray image, a natural intuition is to compare it with normal images and identify the differences. As Figure 1 shows, given known normal images, it cloud be easier for models to learn and identify the suspicious abnormal regions (Red bounding boxes). Therefore, we propose the Contrastive Attention (CA) model (see Figure 2), which is based on the attention mechanism Bahdanau et al. 2015a; Vaswani et al. 2017. The CA model can be easily integrated into existing learning-based methods and enable them to better capture and describe the abnormalities. We build the CA model in the following three steps: 1) we first build a set of normal images which are all extracted from the training dataset; 2) we introduce the Aggregate Attention to prioritize normal images that are closer to the current input image, and filter out normal images that appear differently; 3) and we further introduce the Differentiate Attention to distill the common features between the input image and the refined normal images. Then, the acquired common features are subtracted from the visual features of the input image. In this manner, the residual visual features of the input image are treated as the contrastive information that captures the differentiating properties between input image and normal images.
We evaluate our approach on two datasets, including a widely-used benchmark IU-X-ray dataset Demner-Fushman et al. 2016 and a recently released large-scale MIMIC-CXR dataset Johnson et al. 2019. On both automatic metrics and human evaluations, existing methods equipped with the proposed Contrastive Attention model outperform baselines, which proves our argument and demonstrates the effectiveness of our approach.
Overall, the main contributions of our work are:
- •
We propose the Contrastive Attention model to capture and depict the abnormalities by comparing the input image with known normal images. The proposed approach can be easily incorporated into existing models to improve their performance.
- •
We evaluate our approach on two public datasets. After equipping our Contrastive Attention model, the baselines achieve up to 14% gain and 17% gain in BLEU-4 on the MIMIC-CXR and IU-X-ray datasets, respectively.
- •
More encouragingly, we achieve the state-of-the-art performance on the two public datasets, i.e., IU-X-ray and MIMIC-CXR. Moreover, we invite professional clinicians to conduct human evaluation to measure the effectiveness in terms of its usefulness for clinical practice.
2 Related Works
Image Captioning
Image captioning aims to understand the given images and generate corresponding descriptive sentences Chen et al. 2015. The task combines image understanding and language generation. In recent years, a large number of encoder-decoder based neural systems have been proposed for image captioning Cornia et al. 2020; Pan et al. 2020; Pei et al. 2019; Venugopalan et al. 2015; Vinyals et al. 2015; Xu et al. 2015; Rennie et al. 2017; Lu et al. 2017; Anderson et al. 2018; Liu et al. 2018; Liu et al. 2019a. However, the sentence generated by image captioning is usually short and describes the most prominent visual contents, which cannot fully represent the rich feature information of the image. Recently, visual paragraph generation Krause et al. 2017, which aims to generate long and coherent reports or stories to describe visual contents, has recently attracted increasing research interests. However, due to the data bias in the medical domain, the widely-used hierarchical LSTM in the visual paragraph generation does not perform very well in automatic chest X-ray report generation and is tend to produce normal reports Xue et al. 2018; Li et al. 2018; Jing et al. 2019; Yin et al. 2019.
Chest X-ray Report Generation
Inspired by the success of deep learning models on image captioning, a lot of encoder-decoder based frameworks have been proposed Jing et al. 2018; Jing et al. 2019; Liu et al. 2021; Liu et al. 2019b; Yuan et al. 2019; Xue et al. 2018; Li et al. 2018; Li et al. 2019; Li et al. 2020; Zhang et al. 2020a; Kurisinkel et al. 2021; Ni et al. 2020; Nishino et al. 2020; Chen et al. 2020c; Wang et al. 2021; Boag et al. 2019; Syeda-Mahmood et al. 2020; Yang et al. 2020; Lovelace and Mortazavi 2020; Zhang et al. 2020b; Miura et al. 2021. Specifically, Jing et al. 2018 proposed a hierarchical LSTM with the attention mechanism Bahdanau et al. 2015b; Xu et al. 2015; You et al. 2016. Yuan et al. 2019 further incorporated the medical concept to enrich the decoder with descriptive semantics. Xue et al. 2018 proposed a multimodal recurrent model containing an iterative decoder with visual attention to improve the coherence between sentences. Miura et al. 2021 proposed an Exact Entity Match Reward and an Entailing Entity Match Reward to improve the factual completeness and consistency of the generated reports, resulting in significant improvements on clinical accuracy. Jing et al. 2019; Li et al. 2018; Liu et al. 2019b and Zhang et al. 2020a; Li et al. 2019; Liu et al. 2021 introduced the reinforcement learning and medical knowledge graph for chest X-ray report generation, respectively. However, some errors occur in the generated reports of the existing methods, like duplicate reports, inexact descriptions, etc Xue et al. 2018; Yuan et al. 2019; Yin et al. 2019.
Contrastive Learning
The most related work to our contrastive attention mechanism is in the field of contrastive learning Chen et al. 2020a; He et al. 2020; Hénaff et al. 2020; Grill et al. 2020; Chen et al. 2020b; Radford et al. 2021; Jia et al. 2021, which learns similar/dissimilar image representations from data that are organized into similar/dissimilar image pairs. In image captioning, Dai and Lin 2017 introduced the contrastive learning to extract the contrastive information from additional images into the captioning models to improve the distinctiveness of the generated captions. Moreover, Song et al. 2018 and Duan et al. 2019 proposed the contrastive attention mechanism for person re-identification and summarization, respectively. Song et al. 2018 utilized a pre-provided person and background segmentation to learn features contrastively from the body and background regions, resulting they can be easily discriminated. Duan et al. 2019 contrastively attended to relevant parts and irrelevant parts of source sentence for abstractive sentence summarization. In this work, we leverage the contrastive information between the input image and the normal images to help models efficiently capture and describe the abnormalities for automatic chest X-ray report generation.
3 Approach
In Section 3.1, we formulate the automatic chest X-ray report generation problems; In Section 3.2, we introduce the Contrastive Attention in detail.
3.1 Problem Formulation
Given a chest X-ray image , the goal of automatic chest X-ray report generation is to generate a coherent report that addresses findings of . Most existing methods Jing et al. 2018 adopt the encoder-decoder frameworks, which normally include an image encoder He et al. 2016 and a report decoder Krause et al. 2017. The encoder-decoder framework can be formulated as:
| (1) |
The image encoder, e.g., ResNet He et al. 2016, aims to generate the visual features . The report decoder, e.g., Hierarchical LSTM Krause et al. 2017, is used to generate the report from . Specifically, in the Hierarchical LSTM, a paragraph-level LSTM first generates topic vectors to represent the sentences, then a sentence-level LSTM takes each topic vector as input to generate the corresponding sentence. As a result, the Hierarchical LSTM can better model a paragraph of multiple sentences (report) than a single LSTM Jing et al. 2018; Krause et al. 2017. Given the ground truth medical report provided by the radiologists for the input chest X-ray image, existing methods train the encoder-decoder frameworks by minimizing training loss, e.g., cross-entropy loss. Due to limited space, please refer to Huang et al. 2019; Jing et al. 2018 for detailed introduction.
In this paper, we adopt the ResNet-50 He et al. 2016 to extract the visual features, i.e., the output of the last convolutional layer is used as the visual information:
| (2) |
where denotes the input image, and which reduces the dimension from 2,048 to 11 1 For conciseness, all the bias terms of linear transformations in this paper are omitted.. Specifically, the is set to 512, resulting , where and . Moreover, we apply the average pooling to obtain the global visual feature:
| (3) |
After the above calculations, we obtain the visual feature vectors and the global visual feature vector .
3.2 Contrastive Attention
In this paper, we propose the Contrastive Attention to enable the models to capture the differentiating properties between the input image and normal images. To this end, we first collect a normality pool which consists of normal images randomly extracted from the training dataset, where denotes the global visual feature of extracted normal image. Then, as shown in Figure 2, the proposed Contrastive Attention introduces the Aggregate Attention and Differentiate Attention which aims to obtain the contrastive information between the input image and the normality pool .
Aggregate Attention
Since the images in the normality pool are all normal, there is no ranking order among these images. Therefore it’s natural to treat all normal images equally in capturing the contrastive information. However, as shown in Figure 3, we note that there are many noisy images in the normality pool (see the Purple boxes in Figure 3). For example, some normal images have different orientation information or rotation angles from the input image, we cannot direct compare these images with the input image. Therefore, these noisy images will bring noise information, preventing the Contrastive Attention from capturing accurate abnormal regions efficiently. Motivated by the above observations, we introduce Aggregate Attention to increase the weights of normal images that are close to the current input image and lower the weights of images that are not close to the current input image. As a result, the contrasting process could be improved. To implement the Aggregate Attention, we utilize the dot-product attention22 2 Our preliminary experiments show that using the dot-product attention Vaswani et al. 2017 could achieve better performance than the additive attention Bahdanau et al. 2015a; Xu et al. 2015; Lu et al. 2017 and bilinear attention Kim et al. 2018; You et al. 2016. Vaswani et al. 2017, which is defined as:
| (4) | ||||
where are learnable parameters. Given and , the acquired is then of the shape of , the function is conducted on each row of , resulting in . Then we apply Eq. (4) to and :
| (5) |
Since the attention mechanism is a function that computes the similarity of and each in , and is the attended vector for the . In this way, we can increase the weights of normal images that are similar to current image and lower the weights of the ones that are dissimilar.
Moreover, following Lin et al. 2017, we repeat the Aggregate Attention times with different learnable attention weights to further promote the performance of our approach, defined as follows:
| (6) | ||||
where stands for concatenation operation. In particular, for chest X-ray images, the result in Eq. (5) turns out to be the found normal images that are closest to the current entire input image. However, cannot capture those normal images that are closest to the input image only in a specific part rather than the entire image. Fortunately, through repeating the function in Eq. (5) times, our Aggregate Attention can efficiently find the closest normal images from parts.
Differentiate Attention
To learn the contrastive information between the input image and the closest normal images, we first attempt to capture their similarity, i.e., the common information, then we remove this similarity portion from the input image to obtain the contrastive information. To this end, we introduce the Differentiate Attention.
The first step is learning to summarize the common information between the information of current input image and the information of closest normal images . In implementation, we employ the same dot-product self-attention mechanism in Eq. (5) and average pooling operation to obtain the :
| (7) |
where denotes row-wise concatenation operation, then the is in the shape of and the function outputs a matrix in the shape of .
In this way, via such self-attention mechanism, we exploit the similarity between and to capture the significant common information. Next, to obtain the contrastive information , we remove (i.e., subtract) the common information from the input image :
| (8) |
At last, we update the original image features, i.e., and , with the contrastive information :
| (9) | ||||
| (10) |
where represents the ReLU activation function and is the matrix for linear transformation. The resulting and are used to replace the original image features in Eq. (1) and are then fed into existing models to generate coherent reports.
In our subsequent analysis, we show that the contrastive features indeed focus on the abnormal regions and provide a better starting point for downstream models.
| Settings | Methods | Dataset: MIMIC-CXR Johnson et al. 2019 | Dataset: IU-X-ray Demner-Fushman et al. 2016 | ||||||||||
|---|---|---|---|---|---|---|---|---|---|---|---|---|---|
| B-1 | B-2 | B-3 | B-4 | M | R-L | B-1 | B-2 | B-3 | B-4 | M | R-L | ||
| (a) | NIC Vinyals et al. 2015† | 0.290 | 0.182 | 0.119 | 0.081 | 0.112 | 0.249 | 0.352 | 0.227 | 0.154 | 0.109 | 0.133 | 0.313 |
| w/ Contrastive Attention | 0.317 | 0.200 | 0.127 | 0.089 | 0.120 | 0.262 | 0.368 | 0.232 | 0.166 | 0.118 | 0.144 | 0.323 | |
| (b) | Visual-Attention Xu et al. 2015† | 0.318 | 0.186 | 0.122 | 0.085 | 0.119 | 0.267 | 0.371 | 0.233 | 0.159 | 0.118 | 0.147 | 0.320 |
| w/ Contrastive Attention | 0.309 | 0.202 | 0.129 | 0.093 | 0.122 | 0.265 | 0.384 | 0.245 | 0.172 | 0.125 | 0.141 | 0.315 | |
| (c) | Spatial-Attention Lu et al. 2017† | 0.302 | 0.189 | 0.122 | 0.082 | 0.120 | 0.259 | 0.374 | 0.235 | 0.158 | 0.120 | 0.146 | 0.322 |
| w/ Contrastive Attention | 0.320 | 0.204 | 0.129 | 0.091 | 0.122 | 0.266 | 0.378 | 0.236 | 0.161 | 0.116 | 0.146 | 0.335 | |
| (d) | Att2in Rennie et al. 2017† | 0.314 | 0.199 | 0.126 | 0.087 | 0.125 | 0.265 | 0.410 | 0.257 | 0.173 | 0.131 | 0.149 | 0.325 |
| w/ Contrastive Attention | 0.327 | 0.205 | 0.132 | 0.095 | 0.124 | 0.271 | 0.442 | 0.281 | 0.200 | 0.150 | 0.171 | 0.344 | |
| (e) | Adaptive-Attention Lu et al. 2017† | 0.307 | 0.192 | 0.124 | 0.084 | 0.119 | 0.262 | 0.433 | 0.285 | 0.194 | 0.137 | 0.166 | 0.349 |
| w/ Contrastive Attention | 0.330 | 0.208 | 0.134 | 0.095 | 0.126 | 0.270 | 0.425 | 0.279 | 0.198 | 0.142 | 0.167 | 0.347 | |
| (f) | Up-Down Anderson et al. 2018† | 0.318 | 0.203 | 0.128 | 0.089 | 0.123 | 0.266 | 0.389 | 0.251 | 0.170 | 0.126 | 0.154 | 0.317 |
| w/ Contrastive Attention | 0.336 | 0.209 | 0.134 | 0.097 | 0.128 | 0.273 | 0.378 | 0.246 | 0.169 | 0.129 | 0.152 | 0.330 | |
| (g) | HLSTM Krause et al. 2017† | 0.321 | 0.203 | 0.129 | 0.092 | 0.125 | 0.270 | 0.435 | 0.280 | 0.187 | 0.131 | 0.173 | 0.346 |
| w/ Contrastive Attention | 0.352 | 0.216 | 0.145 | 0.105 | 0.139 | 0.276 | 0.453 | 0.290 | 0.203 | 0.153 | 0.178 | 0.361 | |
| (h) | HLSTM+att+Dual Harzig et al. 2019† | 0.328 | 0.204 | 0.127 | 0.090 | 0.122 | 0.267 | 0.447 | 0.289 | 0.192 | 0.144 | 0.175 | 0.358 |
| w/ Contrastive Attention | 0.323 | 0.202 | 0.130 | 0.102 | 0.138 | 0.277 | 0.464 | 0.292 | 0.205 | 0.149 | 0.176 | 0.364 | |
| (i) | Co-Attention Jing et al. 2018† | 0.329 | 0.206 | 0.133 | 0.095 | 0.129 | 0.273 | 0.463 | 0.293 | 0.207 | 0.155 | 0.178 | 0.365 |
| w/ Contrastive Attention | 0.351 | 0.213 | 0.148 | 0.106 | 0.147 | 0.270 | 0.486 | 0.311 | 0.223 | 0.178 | 0.187 | 0.372 | |
| (j) | Multi-Attention Huang et al. 2019† | 0.337 | 0.211 | 0.136 | 0.097 | 0.130 | 0.274 | 0.468 | 0.299 | 0.211 | 0.155 | 0.180 | 0.366 |
| w/ Contrastive Attention | 0.350 | 0.219 | 0.152 | 0.109 | 0.151 | 0.283 | 0.492 | 0.314 | 0.222 | 0.169 | 0.193 | 0.381 | |
| Methods | Dataset: MIMIC-CXR Johnson et al. 2019 | Dataset: IU-X-ray Demner-Fushman et al. 2016 | ||||||||||
|---|---|---|---|---|---|---|---|---|---|---|---|---|
| B-1 | B-2 | B-3 | B-4 | M | R-L | B-1 | B-2 | B-3 | B-4 | M | R-L | |
| HRGR-Agent Li et al. 2018 | - | - | - | - | - | - | 0.438 | 0.298 | 0.208 | 0.151 | - | 0.322 |
| CMAS-RL Jing et al. 2019 | - | - | - | - | - | - | 0.464 | 0.301 | 0.210 | 0.154 | - | 0.362 |
| SentSAT + KG Zhang et al. 2020a | - | - | - | - | - | - | 0.441 | 0.291 | 0.203 | 0.147 | - | 0.367 |
| Transformer Chen et al. 2020c | 0.314 | 0.192 | 0.127 | 0.090 | 0.125 | 0.265 | 0.396 | 0.254 | 0.179 | 0.135 | 0.164 | 0.342 |
| R2Gen Chen et al. 2020c | 0.353 | 0.218 | 0.145 | 0.103 | 0.142 | 0.277 | 0.470 | 0.304 | 0.219 | 0.165 | 0.187 | 0.371 |
| Contrastive Attention (Ours) | 0.350 | 0.219 | 0.152 | 0.109 | 0.151 | 0.283 | 0.492 | 0.314 | 0.222 | 0.169 | 0.193 | 0.381 |
4 Experiments
4.1 Datasets, Baselines and Settings
Datasets We use the widely-used benchmark IU-X-ray Demner-Fushman et al. 2016 dataset and the recently released large-scale MIMIC-CXR Johnson et al. 2019 datasets for evaluation.
IU-X-ray33 3 https://openi.nlm.nih.gov/ contains 3,955 radiology reports and 7,470 X-rays images. We use the widely-used splits in Chen et al. 2020c; Jing et al. 2019; Li et al. 2019; Li et al. 2018; Liu et al. 2021 for evaluation. There are 70%, 10% and 20% instances in training set, validation set and test set, respectively.
MIMIC-CXR44 4 https://physionet.org/content/mimic-cxr/2.0.0/ is the recently released largest dataset to date and consists of 377,110 chest X-ray images and 227,835 reports from 64,588 patients. Following Chen et al. 2020c; Liu et al. 2021, we use the official splits to report our results. Thus, there are 368,960 in the training set, 2,991 in the validation set and 5,159 in the test set. We convert all tokens of reports to lower-cases and remove the tokens whose frequency of occurrence in the training set is less than 10, resulting in 4k words.
Baselines We experiment with two lines of baselines that are originally designed for image captioning and chest X-ray report generation.
Image Captioning Baselines We experiment on six representative models: NIC Vinyals et al. 2015, Visual-Attention Xu et al. 2015, Spatial-Attention Lu et al. 2017, Att2in Rennie et al. 2017, Adaptive-Attention Lu et al. 2017 and Up-Down Anderson et al. 2018.
Chest X-ray Report Generation Baselines We conduct the experiment on four baselines consisting of HLSTM Krause et al. 2017; Jing et al. 2018, HLSTM+att+Dual Harzig et al. 2019, Co-Attention Jing et al. 2018 and Multi-Attention Huang et al. 2019.
Settings For our Contrastive Attention model, the model size is set to 512. Based on the average performance on the validation set, the in the Aggregate Attention is set to 6. For the normality pool, we randomly extract 1,000 normal images, i.e., , for both two datasets from their training set. To re-implement the baselines, following Jing et al. 2019; Li et al. 2019; Li et al. 2018; Liu et al. 2021, we adopt the ResNet-50 He et al. 2016 pre-trained on ImageNet Deng et al. 2009 and fine-tuned on CheXpert dataset Irvin et al. 2019 to extract the patch visual features with the dimension of each feature is 2,048, which will be projected to 512. Besides, we utilize paired images of a patient as the input for IU-X-ray and utilize single image as the input for MIMIC-CXR to ensure consistency with the experiment settings of previous works Chen et al. 2020c. For all baselines, since our focus is to provide explicit abnormal region features, which tends to improve existing baselines, we keep the inner structure of the baselines untouched and preserve the original parameter setting and training strategy.
| Metrics | vs. Models | Dataset: MIMIC-CXR Johnson et al. 2019 | Dataset: IU-X-ray Demner-Fushman et al. 2016 | ||||
|---|---|---|---|---|---|---|---|
| Baseline wins | Tie | ‘w/ CA’ wins | Baseline wins | Tie | ‘w/ CA’ wins | ||
| Fluency | HLSTM Krause et al. 2017† | 21 | 45 | 34 | 18 | 43 | 39 |
| Multi-Attention Huang et al. 2019† | 30 | 34 | 36 | 27 | 41 | 32 | |
| Comprehensiveness | HLSTM Krause et al. 2017† | 13 | 33 | 54 | 10 | 19 | 71 |
| Multi-Attention Huang et al. 2019† | 26 | 35 | 39 | 22 | 31 | 47 | |
| Faithfulness | HLSTM Krause et al. 2017† | 20 | 28 | 52 | 13 | 25 | 62 |
| Multi-Attention Huang et al. 2019† | 31 | 32 | 37 | 24 | 30 | 46 | |
4.2 Main Evaluation
Metrics We first perform the automatic evaluation to conduct a fair comparison. To measure performance, we adopt the widely-used evaluation toolkit Chen et al. 2015 to calculate the standard metrics: BLEU Papineni et al. 2002, METEOR Banerjee and Lavie 2005 and ROUGE-L Lin 2004. Specifically, BLEU and METEOR are originally designed for machine translation evaluation, while ROUGE is originally proposed for automatic evaluation of the extracted text summarization.
Results The results on the test set of MIMIC-CXR and IU-X-ray datasets are reported in Table 1. As we can see, our Contrastive Attention can successfully boost baselines with improvement up to 14% and 17% for MIMIC-CXR and IU-X-ray in terms of BLEU-4 score, respectively, where the Setting (g) achieves the greatest improvements. The results prove the effectiveness and generalization capabilities of our approach to a wide range of models.
Moreover, in Table 2, we choose five competitive models including the current state-of-the-art models, i.e., SentSAT + KG Zhang et al. 2020a and R2Gen Chen et al. 2020c, for comparison. For these competitive models, we directly report the results from the original paper. Table 2 shows that when our approach is applied to the Multi-Attention, we outperform these existing state-of-the-art models on major metrics on the IU-X-ray and MIMIC-CXR datasets, which further proves the effectiveness of our Contrastive Attention.
4.3 Clinical Efficacy
Metrics The metrics used in the Table 1 measure the match between the generated reports and ground truth reports, but are not specialized for the abnormalities in the reports. Therefore, to measure the accuracy of descriptions for clinical abnormalities, we follow Chen et al. 2020c to adopt the CheXpert labeler Irvin et al. 2019, which will label the given reports in 14 different categories related to thoracic diseases and support devices, to further report the clinical efficacy metrics. As a result, we can calculate the clinical efficacy scores by comparing the generated reports with ground truth reports in 14 different categories, producing the Precision, Recall and F1 scores.
Results The results are shown in Table 4. As we can see, our approach can boost the performance of baselines under all clinical efficacy metrics. The results prove our arguments and the effectiveness of our approach in boosting the baselines to correctly capture and depict the abnormalities. Specifically, our Multi-Attention w/ CA outperforms the R2Gen Chen et al. 2020c with relatively 6%, 9% and 10% margins in terms of Precision, Recall and F1 scores, respectively The superior clinical efficacy scores, which measure the accuracy of descriptions for clinical abnormalities, demonstrate that our approach can help existing models produce higher quality descriptions for clinical abnormalities.
| Methods | Clinical Efficacy Metrics | ||
|---|---|---|---|
| Precision | Recall | F1 | |
| NIC Vinyals et al. 2015 | 0.249 | 0.203 | 0.204 |
| AdaAtt Lu et al. 2017 | 0.268 | 0.186 | 0.181 |
| Att2in Rennie et al. 2017 | 0.322 | 0.239 | 0.249 |
| Up-Down Anderson et al. 2018 | 0.320 | 0.231 | 0.238 |
| Transformer Chen et al. 2020c | 0.331 | 0.224 | 0.228 |
| R2Gen Chen et al. 2020c | 0.333 | 0.273 | 0.276 |
| HLSTM Krause et al. 2017† | 0.307 | 0.225 | 0.228 |
| w/ Contrastive Attention | 0.340 | 0.269 | 0.274 |
| Multi-Attention Huang et al. 2019† | 0.336 | 0.257 | 0.265 |
| w/ Contrastive Attention | 0.352 | 0.298 | 0.303 |
| Settings | Methods | Attention Function | Dataset: IU-X-ray Demner-Fushman et al. 2016 | ||||||||||||
|---|---|---|---|---|---|---|---|---|---|---|---|---|---|---|---|
| Baseline: HLSTM Krause et al. 2017 | Baseline: Multi-Attention Huang et al. 2019 | ||||||||||||||
| B-1 | B-2 | B-3 | B-4 | M | R-L | B-1 | B-2 | B-3 | B-4 | M | R-L | ||||
| (a) | Baseline | - | - | 0.435 | 0.280 | 0.187 | 0.131 | 0.173 | 0.346 | 0.468 | 0.299 | 0.211 | 0.155 | 0.180 | 0.366 |
| (b) | w/ DA | dot-product attention | - | 0.447 | 0.284 | 0.195 | 0.138 | 0.176 | 0.357 | 0.479 | 0.306 | 0.215 | 0.162 | 0.184 | 0.373 |
| (c) | w/ DA + AA | 1 | 0.451 | 0.287 | 0.198 | 0.144 | 0.176 | 0.359 | 0.486 | 0.310 | 0.218 | 0.164 | 0.187 | 0.375 | |
| (f) | w/ DA + AA | dot-product attention | 2 | 0.451 | 0.285 | 0.199 | 0.146 | 0.175 | 0.359 | 0.488 | 0.312 | 0.219 | 0.165 | 0.189 | 0.377 |
| (g) | w/ DA + AA | 4 | 0.453 | 0.287 | 0.202 | 0.149 | 0.177 | 0.361 | 0.493 | 0.314 | 0.220 | 0.165 | 0.191 | 0.378 | |
| (h) | w/ DA + AA | 6 | 0.453 | 0.290 | 0.203 | 0.153 | 0.178 | 0.361 | 0.492 | 0.314 | 0.222 | 0.169 | 0.193 | 0.381 | |
| (i) | w/ DA + AA | 8 | 0.451 | 0.288 | 0.200 | 0.150 | 0.180 | 0.362 | 0.488 | 0.311 | 0.221 | 0.164 | 0.194 | 0.379 | |
| (j) | w/ DA + AA | 10 | 0.448 | 0.284 | 0.197 | 0.142 | 0.175 | 0.355 | 0.490 | 0.310 | 0.219 | 0.162 | 0.188 | 0.375 | |
4.4 Human Evaluation
Metrics For medical-related task, it is important to know (1) on what fraction of images with abnormalities did the system not mention the abnormality and (2) on what fraction of images the system described abnormality that does not exist according to doctors. To this end, we randomly select 200 samples from the IU-X-ray and MIMIC-CXR test sets, which are 100 samples from each dataset. Specifically, it is important to generate accurate reports (faithfulness) with comprehensive true abnormalities (comprehensiveness) and it is unacceptable to generate repeated sentences (fluency). Therefore, we invite several professional clinicians to compare our approach and baselines independently and evaluate the perceptual quality, including the fluency of generated reports, the comprehensiveness of generated true abnormalities and the faithfulness to the ground truth reports. The clinicians are unaware of which model generates these reports.
Results To conduct the human evaluation, we select a representative chest X-ray report generation baseline: HLSTM Krause et al. 2017 and a competitive chest X-ray report generation baseline: Multi-Attention Huang et al. 2019. The results in Table 3 show that our approach enjoys the obvious advantage in terms of the three aspects, i.e., fluency, comprehensiveness and faithfulness, meaning that the reports generated by the “Baseline w/ Contrastive Attention” are of higher clinical quality, which also proves the advantage of our approach in clinical practice. Especially, by using our proposed Contrastive Attention, the winning chances of models increased by maximum of points and points in terms of the comprehensiveness metric on the MIMIC-CXR and IU-X-ray datasets, respectively. It demonstrates the effectiveness of our approach in helping existing baselines generate more accurate abnormality descriptions, and thus improve the usefulness of models in better assisting radiologists in clinical decision-makings and reducing their workload.
Overall From the results of automatic and human evaluations, we can see that our proposed Contrastive Attention can provide a solid basis for describing chest X-ray images, especially for the abnormalities. As a result, our approach can successfully boost baselines and achieves new state-of-the-art results on the MIMIC-CXR and IU-X-ray datasets, which verifies the effectiveness of the proposed approach and indicates that our approach is less prone to the variations of model structures, hyper-parameters (e.g., learning rate and batch size), and learning paradigms.
5 Analysis
We conduct analysis on the benchmark IU-X-ray dataset to better understand our proposed approach.
5.1 Quantitative Analysis
We conduct the quantitative analysis on two representative models, i.e., HLSTM and Multi-Attention, to evaluate the contribution of each component.
Effect of Contrastive Attention Our Contrastive Attention consists of the Differentiate Attention (DA) and Aggregate Attention (AA). As shown in Table 5(b), the DA can promote the performance over all metrics. Especially for the HLSTM Krause et al. 2017, which does not incorporate the attention mechanism to allow more efficient use of the image features. We can see that an up to 5% gain in BLEU-4 score makes the “HLSTM w/ DA” an equally competitive model as the “HLSTM+att+Dual” model in Table 1(h). This indicates that the contrastive information extracted by the DA contains sufficient accurate abnormal information, which is vital in improving the performance of chest X-ray report generation. In other words, our approach can ease the design of the neural models for the task.
For the AA, it devotes to identifying the closest normal images and filtering out the noisy images, which can improve the contrasting process in the DA. As expected, Table 5(c) shows that the AA can consistently boost the performance of baselines under all metrics, which further demonstrates the effectiveness of our approach.
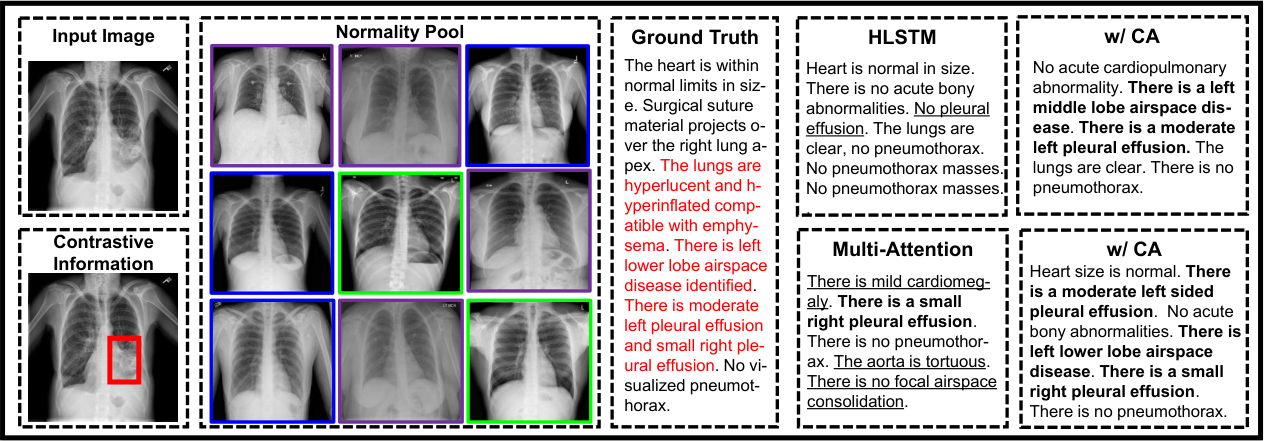
Effect of In this section, we analyze the effect of in our Aggregate Attention (see Eq. (6)). Table 5(f-j) shows that when is smaller than 6, the performance will increase with as increases. The reason may be that repeating the Aggregate Attention times with different learnable attention weights can encourage the model to identify the closest normal images from aspects, e.g., organs or tissues, i.e., if an aspect of the normal image is similar to the input image, it will be identified as the closest normal image. In this way, the Aggregate Attention can capture accurate and robust closest normal images from aspects. To verify this, we randomly visualize two attention weights of Aggregate Attention in Figure 3. As we can see, the Aggregate Attention can indeed identify the closest normal images from multiple aspects, e.g., ‘Bone/Clavicle’ (Blue boxes) and ‘Right Lung’ (Green boxes), which proves our arguments. Moreover, larger will bring noise, i.e., normal images that are not similar to the current input image, to the model and thus impair the performance.
5.2 Qualitative Analysis
In this section, we show the reports generated by the Baseline models, i.e., HLSTM and Multi-Attention, and the “Baseline w/ CA” models, and the visualization in Figure 3 to analyze the strength of our Contrastive Attention model intuitively. As we can see, for the HLSTM, it tends to produce repeated findings and normal findings, which results from the overwhelming normal findings in the dataset, i.e., data deviation Shin et al. 2016. For the Multi-Attention, with the help of attention mechanism, it can describe abnormalities, but some abnormalities are incorrect (Underlined text). The reason is that it is difficult for the Multi-Attention model to efficiently learn the medical expertise from the dataset with data deviation to correctly detect the abnormal regions. Since our Contrastive Attention model can efficiently capture the suspicious abnormal regions by contrasting the input images and normal images and transfer such power to the downstream models and datasets, we can thus help multiple baseline models to detect and describe comprehensive and accurate abnormalities. As a result, the “Baseline w/ CA” models can generate fluent and accurate reports supported with accurate abnormal descriptions, showing significant alignment with ground truth reports.
6 Conclusion
In this paper, we propose the Contrastive Attention model to capture abnormal regions by contrasting the input image and normal images for chest X-ray report generation. The experiments on two public datasets demonstrate the effectiveness of our approach, which can be easily incorporated into existing models to boost their performance under most metrics. The clinical efficacy scores and human evaluation further prove our arguments and the effectiveness of our approach in helping existing models capture and depict the abnormalities. Specifically, we achieve the state-of-the-art results on the two datasets with the best human preference, which could better assist radiologists in clinical decision-making and reduce their workload.
In the future, there are two potential ways to improve the contrastive attention. First, it may be better to perform the contrastive attention in path feature rather than global feature. Second, it may be better to utilize multiple feature maps from different convolutional layers rather than just the feature maps of last convolutional layer.
Acknowledgments
This work is partly supported by Beijing Academy of Artificial Intelligence (BAAI). We would like to sincerely thank the clinicians (Xiaoxia Xie, Jing Zhang, etc.) of the Harbin Chest Hospital in China for providing the human evaluation. We also sincerely thank all the anonymous reviewers and chairs for their constructive comments and suggestions. Xu Sun and Ping Zhang are the corresponding authors of this paper.
Ethical Considerations
In this work, we focus on helping several existing chest X-ray report generation systems better capture and describe the abnormalities. To this end, we provide a detailed human evaluation in Table 3 (Section 4.4) and an automatic evaluation in terms of clinical efficacy metrics in Table 4 (Section 4.3) to know (1) on what fraction of images with abnormalities did the system not mention the abnormality and (2) on what fraction of images the system described abnormality that does not exist according to doctors. The results show that our work can help existing systems generate more accurate descriptions for clinical abnormalities, improving the usefulness of existing systems in better assisting radiologists in clinical decision-makings and reducing their workload. In particular, for radiologists, given a large amount of medical images, the systems can automatically generate medical reports, the radiologists only need to make revisions rather than write a new report from scratch. This study uses the public MIMIC-CXR and IU-X-ray datasets. All protected health information was de-identified. De-identification was performed in compliance with Health Insurance Portability and Accountability Act (HIPAA) standards in order to facilitate public access to the datasets. Deletion of protected health information (PHI) from structured data sources (e.g., database fields that provide patient name or date of birth) was straightforward. All necessary patient/participant consent has been obtained and the appropriate institutional forms have been archived.
References
- Anderson et al. (2018) Peter Anderson, Xiaodong He, Chris Buehler, Damien Teney, Mark Johnson, Stephen Gould, and Lei Zhang. 2018. Bottom-up and top-down attention for image captioning and VQA. In CVPR.
- Bahdanau et al. (2015a) Dzmitry Bahdanau, Kyunghyun Cho, and Yoshua Bengio. 2015a. Neural machine translation by jointly learning to align and translate. In ICLR.
- Bahdanau et al. (2015b) Dzmitry Bahdanau, Kyunghyun Cho, and Yoshua Bengio. 2015b. Neural machine translation by jointly learning to align and translate. In ICLR.
- Banerjee and Lavie (2005) Satanjeev Banerjee and Alon Lavie. 2005. METEOR: an automatic metric for MT evaluation with improved correlation with human judgments. In IEEvaluation@ACL.
- Boag et al. (2019) William Boag, Tzu-Ming Harry Hsu, Matthew B. A. McDermott, Gabriela Berner, Emily Alsentzer, and Peter Szolovits. 2019. Baselines for chest x-ray report generation. In ML4H@NeurIPS.
- Brady et al. (2012) A. Brady, R. Ó. Laoide, Peter Mccarthy, and R. Mcdermott. 2012. Discrepancy and error in radiology: Concepts, causes and consequences. The Ulster Medical Journal, 81:3 – 9.
- Chen et al. (2020a) Ting Chen, Simon Kornblith, Mohammad Norouzi, and Geoffrey E. Hinton. 2020a. A simple framework for contrastive learning of visual representations. In ICML.
- Chen et al. (2020b) Xinlei Chen, Haoqi Fan, Ross B. Girshick, and Kaiming He. 2020b. Improved baselines with momentum contrastive learning. arXiv preprint arXiv:2003.04297.
- Chen et al. (2015) Xinlei Chen, Hao Fang, Tsung-Yi Lin, Ramakrishna Vedantam, Saurabh Gupta, Piotr Dollár, and C. Lawrence Zitnick. 2015. Microsoft COCO captions: Data collection and evaluation server. arXiv preprint arXiv:1504.00325.
- Chen et al. (2020c) Zhihong Chen, Yan Song, Tsung-Hui Chang, and Xiang Wan. 2020c. Generating radiology reports via memory-driven transformer. In EMNLP.
- Cornia et al. (2020) Marcella Cornia, Matteo Stefanini, Lorenzo Baraldi, and Rita Cucchiara. 2020. Meshed-memory transformer for image captioning. In CVPR.
- Dai and Lin (2017) Bo Dai and Dahua Lin. 2017. Contrastive learning for image captioning. In NIPS.
- Delrue et al. (2011) Louke Delrue, Robert Gosselin, Bart Ilsen, An Van Landeghem, Johan de Mey, and Philippe Duyck. 2011. Difficulties in the interpretation of chest radiography. Comparative Interpretation of CT and Standard Radiography of the Chest, pages 27–49.
- Demner-Fushman et al. (2016) Dina Demner-Fushman, Marc D. Kohli, Marc B. Rosenman, Sonya E. Shooshan, Laritza Rodriguez, Sameer K. Antani, George R. Thoma, and Clement J. McDonald. 2016. Preparing a collection of radiology examinations for distribution and retrieval. J. Am. Medical Informatics Assoc., 23(2):304–310.
- Deng et al. (2009) Jia Deng, Wei Dong, Richard Socher, Li-Jia Li, Kai Li, and Fei-Fei Li. 2009. Imagenet: A large-scale hierarchical image database. In CVPR.
- Duan et al. (2019) Xiangyu Duan, Hongfei Yu, Mingming Yin, Min Zhang, Weihua Luo, and Yue Zhang. 2019. Contrastive attention mechanism for abstractive sentence summarization. In EMNLP/IJCNLP.
- Goergen et al. (2013) Stacy K Goergen, Felicity J Pool, Tari J Turner, Jane E Grimm, Mark N Appleyard, Carmel Crock, Michael C Fahey, Michael F Fay, Nicholas J Ferris, Susan M Liew, et al. 2013. Evidence-based guideline for the written radiology report: Methods, recommendations and implementation challenges. Journal of medical imaging and radiation oncology, 57(1):1–7.
- Grill et al. (2020) Jean-Bastien Grill, Florian Strub, Florent Altché, Corentin Tallec, Pierre H. Richemond, Elena Buchatskaya, Carl Doersch, Bernardo Ávila Pires, Zhaohan Daniel Guo, Mohammad Gheshlaghi Azar, Bilal Piot, Koray Kavukcuoglu, Rémi Munos, and Michal Valko. 2020. Bootstrap your own latent: A new approach to self-supervised learning. arXiv preprint arXiv:2006.07733.
- Harzig et al. (2019) Philipp Harzig, Yan-Ying Chen, Francine Chen, and Rainer Lienhart. 2019. Addressing data bias problems for chest x-ray image report generation. In BMVC.
- He et al. (2020) Kaiming He, Haoqi Fan, Yuxin Wu, Saining Xie, and Ross B. Girshick. 2020. Momentum contrast for unsupervised visual representation learning. In CVPR.
- He et al. (2016) Kaiming He, Xiangyu Zhang, Shaoqing Ren, and Jian Sun. 2016. Deep residual learning for image recognition. In CVPR.
- Hénaff et al. (2020) Olivier J. Hénaff, Aravind Srinivas, Jeffrey De Fauw, Ali Razavi, Carl Doersch, S. M. Ali Eslami, and Aäron van den Oord. 2020. Data-efficient image recognition with contrastive predictive coding. In ICML.
- Huang et al. (2019) Xin Huang, Fengqi Yan, Wei Xu, and Maozhen Li. 2019. Multi-attention and incorporating background information model for chest x-ray image report generation. IEEE Access.
- Irvin et al. (2019) Jeremy Irvin, Pranav Rajpurkar, Michael Ko, Yifan Yu, Silviana Ciurea-Ilcus, Chris Chute, Henrik Marklund, Behzad Haghgoo, Robyn L. Ball, Katie S. Shpanskaya, Jayne Seekins, David A. Mong, Safwan S. Halabi, Jesse K. Sandberg, Ricky Jones, David B. Larson, Curtis P. Langlotz, Bhavik N. Patel, Matthew P. Lungren, and Andrew Y. Ng. 2019. Chexpert: A large chest radiograph dataset with uncertainty labels and expert comparison. In AAAI.
- Jia et al. (2021) Chao Jia, Yinfei Yang, Ye Xia, Yi-Ting Chen, Zarana Parekh, Hieu Pham, Quoc V. Le, Yun-Hsuan Sung, Zhen Li, and Tom Duerig. 2021. Scaling up visual and vision-language representation learning with noisy text supervision. In ICML.
- Jing et al. (2019) Baoyu Jing, Zeya Wang, and Eric P. Xing. 2019. Show, describe and conclude: On exploiting the structure information of chest x-ray reports. In ACL.
- Jing et al. (2018) Baoyu Jing, Pengtao Xie, and Eric P. Xing. 2018. On the automatic generation of medical imaging reports. In ACL.
- Johnson et al. (2019) Alistair E. W. Johnson, Tom J. Pollard, Seth J. Berkowitz, Nathaniel R. Greenbaum, Matthew P. Lungren, Chih-ying Deng, Roger G. Mark, and Steven Horng. 2019. MIMIC-CXR: A large publicly available database of labeled chest radiographs. arXiv preprint arXiv:1901.07042.
- Kim et al. (2018) Jin-Hwa Kim, Jaehyun Jun, and Byoung-Tak Zhang. 2018. Bilinear attention networks. In NeurIPS.
- Krause et al. (2017) Jonathan Krause, Justin Johnson, Ranjay Krishna, and Li Fei-Fei. 2017. A hierarchical approach for generating descriptive image paragraphs. In CVPR.
- Kurisinkel et al. (2021) Litton J Kurisinkel, Ai Ti Aw, and Nancy F. Chen. 2021. Coherent and concise radiology report generation via context specific image representations and orthogonal sentence states. In NAACL-HLT.
- Li et al. (2019) Christy Y. Li, Xiaodan Liang, Zhiting Hu, and Eric P. Xing. 2019. Knowledge-driven encode, retrieve, paraphrase for medical image report generation. In AAAI.
- Li et al. (2020) Mingjie Li, Fuyu Wang, Xiaojun Chang, and Xiaodan Liang. 2020. Auxiliary signal-guided knowledge encoder-decoder for medical report generation. arXiv preprint arXiv:2006.03744.
- Li et al. (2018) Yuan Li, Xiaodan Liang, Zhiting Hu, and Eric P. Xing. 2018. Hybrid retrieval-generation reinforced agent for medical image report generation. In NeurIPS.
- Lin (2004) Chin-Yew Lin. 2004. ROUGE: A package for automatic evaluation of summaries. In ACL.
- Lin et al. (2017) Zhouhan Lin, Minwei Feng, Cícero Nogueira dos Santos, Mo Yu, Bing Xiang, Bowen Zhou, and Yoshua Bengio. 2017. A structured self-attentive sentence embedding. In ICLR.
- Liu et al. (2019a) Fenglin Liu, Xuancheng Ren, Yuanxin Liu, Kai Lei, and Xu Sun. 2019a. Exploring and distilling cross-modal information for image captioning. In IJCAI.
- Liu et al. (2018) Fenglin Liu, Xuancheng Ren, Yuanxin Liu, Houfeng Wang, and Xu Sun. 2018. simnet: Stepwise image-topic merging network for generating detailed and comprehensive image captions. In EMNLP.
- Liu et al. (2021) Fenglin Liu, Xian Wu, Shen Ge, Wei Fan, and Yuexian Zou. 2021. Exploring and distilling posterior and prior knowledge for radiology report generation. In CVPR.
- Liu et al. (2019b) Guanxiong Liu, Tzu-Ming Harry Hsu, Matthew B. A. McDermott, Willie Boag, Wei-Hung Weng, Peter Szolovits, and Marzyeh Ghassemi. 2019b. Clinically accurate chest x-ray report generation. In MLHC.
- Lovelace and Mortazavi (2020) Justin R. Lovelace and Bobak Mortazavi. 2020. Learning to generate clinically coherent chest x-ray reports. In EMNLP (Findings).
- Lu et al. (2017) Jiasen Lu, Caiming Xiong, Devi Parikh, and Richard Socher. 2017. Knowing when to look: Adaptive attention via a visual sentinel for image captioning. In CVPR.
- Miura et al. (2021) Yasuhide Miura, Yuhao Zhang, Emily Bao Tsai, Curtis P. Langlotz, and Dan Jurafsky. 2021. Improving factual completeness and consistency of image-to-text radiology report generation. In NAACL-HLT.
- Ni et al. (2020) Jianmo Ni, Chun-Nan Hsu, Amilcare Gentili, and Julian J. McAuley. 2020. Learning visual-semantic embeddings for reporting abnormal findings on chest x-rays. In EMNLP (Findings).
- Nishino et al. (2020) Toru Nishino, Ryota Ozaki, Yohei Momoki, Tomoki Taniguchi, Ryuji Kano, Norihisa Nakano, Yuki Tagawa, Motoki Taniguchi, Tomoko Ohkuma, and Keigo Nakamura. 2020. Reinforcement learning with imbalanced dataset for data-to-text medical report generation. In EMNLP (Findings).
- Pan et al. (2020) Yingwei Pan, Ting Yao, Yehao Li, and Tao Mei. 2020. X-linear attention networks for image captioning. In CVPR.
- Papineni et al. (2002) Kishore Papineni, Salim Roukos, Todd Ward, and Wei-Jing Zhu. 2002. BLEU: a Method for automatic evaluation of machine translation. In ACL.
- Pei et al. (2019) Wenjie Pei, Jiyuan Zhang, Xiangrong Wang, Lei Ke, Xiaoyong Shen, and Yu-Wing Tai. 2019. Memory-attended recurrent network for video captioning. In CVPR.
- Radford et al. (2021) Alec Radford, Jong Wook Kim, Chris Hallacy, Aditya Ramesh, Gabriel Goh, Sandhini Agarwal, Girish Sastry, Amanda Askell, Pamela Mishkin, Jack Clark, Gretchen Krueger, and Ilya Sutskever. 2021. Learning transferable visual models from natural language supervision. arXiv preprint arXiv:2103.00020.
- Rennie et al. (2017) Steven J. Rennie, Etienne Marcheret, Youssef Mroueh, Jarret Ross, and Vaibhava Goel. 2017. Self-critical sequence training for image captioning. In CVPR.
- Shin et al. (2016) Hoo-Chang Shin, Kirk Roberts, Le Lu, Dina Demner-Fushman, Jianhua Yao, and Ronald M. Summers. 2016. Learning to read chest x-rays: Recurrent neural cascade model for automated image annotation. In CVPR.
- Song et al. (2018) Chunfeng Song, Yan Huang, Wanli Ouyang, and Liang Wang. 2018. Mask-guided contrastive attention model for person re-identification. In CVPR.
- Syeda-Mahmood et al. (2020) Tanveer F. Syeda-Mahmood, Ken C. L. Wong, Yaniv Gur, Joy T. Wu, Ashutosh Jadhav, Satyananda Kashyap, Alexandros Karargyris, Anup Pillai, Arjun Sharma, Ali Bin Syed, Orest B. Boyko, and Mehdi Moradi. 2020. Chest x-ray report generation through fine-grained label learning. In MICCAI.
- Vaswani et al. (2017) Ashish Vaswani, Noam Shazeer, Niki Parmar, Jakob Uszkoreit, Llion Jones, Aidan N. Gomez, Lukasz Kaiser, and Illia Polosukhin. 2017. Attention is all you need. In NIPS.
- Venugopalan et al. (2015) Subhashini Venugopalan, Huijuan Xu, Jeff Donahue, Marcus Rohrbach, Raymond J. Mooney, and Kate Saenko. 2015. Translating videos to natural language using deep recurrent neural networks. In HLT-NAACL.
- Vinyals et al. (2015) Oriol Vinyals, Alexander Toshev, Samy Bengio, and Dumitru Erhan. 2015. Show and tell: A neural image caption generator. In CVPR.
- Wang et al. (2021) Fuyu Wang, Xiaodan Liang, Lin Xu, and Liang Lin. 2021. Unifying relational sentence generation and retrieval for medical image report composition. IEEE Transactions on Cybernetics.
- Xu et al. (2015) Kelvin Xu, Jimmy Ba, Ryan Kiros, Kyunghyun Cho, Aaron C. Courville, Ruslan Salakhutdinov, Richard S. Zemel, and Yoshua Bengio. 2015. Show, attend and tell: Neural image caption generation with visual attention. In ICML.
- Xue et al. (2018) Yuan Xue, Tao Xu, L. Rodney Long, Zhiyun Xue, Sameer K. Antani, George R. Thoma, and Xiaolei Huang. 2018. Multimodal recurrent model with attention for automated radiology report generation. In MICCAI.
- Yang et al. (2020) Shaokang Yang, Jianwei Niu, Jiyan Wu, and Xuefeng Liu. 2020. Automatic medical image report generation with multi-view and multi-modal attention mechanism. In ICA3PP.
- Yin et al. (2019) Changchang Yin, Buyue Qian, Jishang Wei, Xiaoyu Li, Xianli Zhang, Yang Li, and Qinghua Zheng. 2019. Automatic generation of medical imaging diagnostic report with hierarchical recurrent neural network. In ICDM.
- You et al. (2016) Quanzeng You, Hailin Jin, Zhaowen Wang, Chen Fang, and Jiebo Luo. 2016. Image captioning with semantic attention. In CVPR.
- Yuan et al. (2019) Jianbo Yuan, Haofu Liao, Rui Luo, and Jiebo Luo. 2019. Automatic radiology report generation based on multi-view image fusion and medical concept enrichment. In MICCAI.
- Zhang et al. (2020a) Yixiao Zhang, Xiaosong Wang, Ziyue Xu, Qihang Yu, Alan L. Yuille, and Daguang Xu. 2020a. When radiology report generation meets knowledge graph. In AAAI.
- Zhang et al. (2020b) Yuhao Zhang, Derek Merck, Emily Bao Tsai, Christopher D. Manning, and Curtis Langlotz. 2020b. Optimizing the factual correctness of a summary: A study of summarizing radiology reports. In ACL.