A Large-Scale Benchmark for Food Image Segmentation
Abstract.
Food image segmentation is a critical and indispensible task for developing health-related applications such as estimating food calories and nutrients. Existing food image segmentation models are underperforming due to two reasons: (1) there is a lack of high quality food image datasets with fine-grained ingredient labels and pixel-wise location masks—the existing datasets either carry coarse ingredient labels or are small in size; and (2) the complex appearance of food makes it difficult to localize and recognize ingredients in food images, e.g., the ingredients may overlap one another in the same image, and the identical ingredient may appear distinctly in different food images.
In this work, we build a new food image dataset FoodSeg103 (and its extension FoodSeg154) containing 9,490 images. We annotate these images with 154 ingredient classes and each image has an average of 6 ingredient labels and pixel-wise masks. In addition, we propose a multi-modality pre-training approach called ReLeM that explicitly equips a segmentation model with rich and semantic food knowledge. In experiments, we use three popular semantic segmentation methods (i.e., Dilated Convolution based (Huang et al. 2019), Feature Pyramid based (Kirillov et al. 2019), and Vision Transformer based (Zheng et al. 2020)) as baselines, and evaluate them as well as ReLeM on our new datasets. We believe that the FoodSeg103 (and its extension FoodSeg154) and the pre-trained models using ReLeM can serve as a benchmark to facilitate future works on fine-grained food image understanding. We make all these datasets and methods public at https://xiongweiwu.github.io/foodseg103.html.
1. Introduction
Food computing has attracted increasing public attention in recent years, as it provides the core technologies for food and health-related research and applications. (David and Michael 2014; Boswell et al. 2018; Meyers et al. 2015; Thames et al. 2021). One of the important goals of food computing is to automatically recognize different types of food and profile their nutrition and calorie values. In computer vision, the related works include dish classification (Deng et al. 2019; Xu et al. 2015; Wang et al. 2019), recipe generation (Salvador et al. 2019a; Wang et al. 2020; H. Lee et al. 2020), and food image retrieval (Shimoda and Yanai 2017; Ciocca et al. 2017). Most of them focus on representing and analysing the food image as a whole, and do not explicitly localize or classify its individual ingredients—the visible components in the cooked food. We call the former food image classification and the latter food image segmentation. Between the two, food image segmentation is more complex as it aims to recognize each ingredient category as well as its pixel-wise locations in the food image. As shown in Figure 1, given an “hamburger” example image, a good segmentation model needs to recognize and mask out “beef”, “tomato”, “lettuce”, “onion” and “bread roll” ingredients.


Compared to semantic segmentation on general object images (Chen et al. 2015; Huang et al. 2019; Kirillov et al. 2019), food image segmentation is more challenging due to the large diversity in food appearances and the often imbalanced distribution of categories of ingredients. First, an ingredient cooked differently can vary a lot visually, e.g., “pineapples” cooked with meat in Figure 1 (a) versus the “pineapples” in a fruit platter in Figure 1 (b). Different ingredients may look very similar, e.g., “pineapples” cooked with meat cannot be easily distinguished from “potatoes” cooked with meat, as shown in Figures 1 (a) and (c) respectively. Second, food datasets usually suffer from imbalanced distribution—both food classes and ingredient classes often exist in long-tailed distributions. This is inevitable due to two reasons: 1) large number of food images are dominated by very few popular food classes while vast majority of food classes are unpopular; and 2) there is a selection bias in the construction of food image collection (Torralba and Efros 2011). We will elaborate the detailed distribution analysis in Section 3.
Existing food image datasets, such as ETH Food101 (Bossard et al. 2014), Recipe1M (Salvador et al. 2017), and Geo-Dish (Xu et al. 2015), mainly facilitate the research of dish classification or recipe generation. They do not have fine-grained ingredient masks or labels. UECFoodPix (Ege and Yanai 2019) and UECFoodPixComplete (Okamoto and Yanai 2021) are the only two public datasets for food image segmentation. However, their segmentation masks are annotated at dish level only. That is, each mask covers the region of an entire dish instead of that of food ingredients. We elaborate more dataset comparison in Section 3.3.
Dataset contribution: To facilitate fine-grained food image segmentation, we build a large-scale dataset called FoodSeg103, for which we have defined 103 ingredient classes and annotated 7,118 western food images using these labels together with the corresponding segmentation masks. Besides, we annotated an additional set of 2,372 images of Asian food which covers more diverse set of ingredients making these images more challenging than those in the main set (FoodSeg103). For this set, we defined 112 ingredient classes—55% overlap with the ingredient classes of the main set. In total, we annotated 154 classes of ingredients with around 60k masks (in the two datasets). We name the combined dataset as FoodSeg154. During the annotation, we carried out careful data selection, iterative refinement of labels and masks (to be further elaborated in Section 3.2), so as to guarantee high quality labels and masks in the dataset. Our annotation is thus expensive and time-consuming. In experiments, we use FoodSeg103 for in-domain training and testing, and use the additional set in FoodSeg154 for out-domain testing.
Model contribution: The source images of FoodSeg103 are from another existing food dataset Recipe1M (Salvador et al. 2017)—millions of images and cooking recipes, used for recipe generation. Each recipe contains not only “how to cook” but also “what ingredient to use”. In our work, we leverage these recipe information as auxiliary information to train semantic segmentation models. We call this multi-modality knowledge transfer and name our training method ReLeM. Specifically, ReLeM integrates food recipe data, in the format of language embedding, with the visual representation of the food image. In this way, it forces the visual representation of an ingredient appearing in different dishes to have their appearances “connected” in the feature space through a common language embedding (extracted from the ingredient’s label and its cooking instructions).
Experiment contribution: We validate our proposed ReLeM model by plugging it into the state-of-the-art semantic segmentation models such as CCNet (Huang et al. 2019), Sem-FPN (Kirillov et al. 2019) and SeTR (Zheng et al. 2020). In experiments, we compare ReLeM-variants with these baseline models using both convolutional networks and transformer backbones. Our experiments show that ReLeM is generic to be applied into multiple segmentation frameworks, and it helps to achieve significant accuracy improvement when incorporated into the SOTA CNN-based model CCNet. This validates that our knowledge transfer approach works more efficient on stronger models—a characteristic preferred by the multimedia community.
Our contributions are thus three-fold. i) We build a large-scale food image segmentation dataset called FoodSeg103 (and its extension FoodSeg154). It can facilitate a promising and challenging benchmark for the task of semantic segmentation in food images. ii) We propose a knowledge transfer approach ReLeM that utilizes the multi-modality information of recipe datasets. It can be incorporated into different semantic segmentation methods to boost the model performance. iii) We conduct extensive experiments that reveal the challenges of segmenting food on our FoodSeg103 dataset, and validate the efficiency of our ReLeM based on multiple baseline methods.
2. Related Works
Food Image Datasets. In recent years, the scale of food-related datasets has grown rapidly. For example, Bossard et al (Bossard et al. 2014) built one large-scale food dataset ETH Food101, which contains 101 classes with 1,000 images per class. Matsuda et al. (Matsuda and Yanai 2012) constructed a Japanese food dataset UEC Food100 with 15K images in 100 dish categories. In comparison, ISIA Food500 (Min et al. 2020) contains nearly 400k food images in 500 categories, which is the largest food image recognition. In addition, there are also recipe-related datasets. Salvador et al. (Salvador et al. 2017) built the Recipe1M, with nearly 900k images and 1 million recipes, which is widely used in multi-modal learning between images and recipes. Based on Recipe1M, an even larger dataset Recipe1M+ (Marin et al. 2019) was constructed with more than 13 millions of food images. However, these datasets are mainly built to support food recognition and recipe generation research rather than food image segmentation, so they do not segment food images into multiple masks and labels of ingredient . UECFoodPix (Ege and Yanai 2019) and UECFoodPixComplete (Okamoto and Yanai 2021) are the only two datasets for food image segmentation, which contains 10,000 images with more than 100 categories. Nevertheless, their annotation are limited to dish-wise masks so they cannot be used for ingredient segmentation.
In this paper, we built FoodSeg103 dataset with 7,118 images and more than 40k masks covering 103 food ingredients. In addition, we have collected another image set for Asian food with 2,372 images (for cross-domain evaluation of the models). Combining the main set and the Asian set, we get the FoodSeg154 with nearly 10k images and 60k ingredient masks. To our best knowledge, FoodSeg154 is the first and the largest ingredient-level dataset for fine-grained food image segmentation. Dataset is a key step in developing deep learning based methods. We hope our dataset can inspire more efforts for the task of food image segmentation.


Semantic Segmentation in Images. Deep learning based semantic segmentation is a super hot topic in recent years. Fully convolutional neural network (FCN) (Long et al. 2015) is the first semantic segmentation framework based on deep convolutional neural networks. It predicts pixel-wise masks by replacing the fully connected layers with convolution layers and achieves a clear margin of improvement on the model performance. Chen et al. (Chen et al. 2015) proposed DeepLab which applies dilated convolutional layers in vanilla FCN. The trained model is more effective as the dilation mechanism enlarges the receptive fields while maintaining a high resolution in feature maps. Chen et al (Chen et al. 2017) proposed the DeepLab v2, which adds an ASPP module to integrate features of different dilation rates. To further include contextual cues, PSPNet (Zhao et al. 2017) proposed a PPM module that aggregates the contextual information using different-size pooling layers. Wang et al. (Wang et al. 2018) proposed the non-local networks to encode the relationship between each pair of pixels in the feature map. Based on the non-local networks, CCNet (Huang et al. 2019) adopted a criss-cross attention layer to significantly economize the computation costs of calculating attentions. Most recently, vision transformer (attention-based) (Dosovitskiy et al. 2021; Vaswani et al. 2017) was adapted to tackle semantic segmentation problems in (Zheng et al. 2020). recently and achieves state-of-the-art results (Zheng et al. 2020). In this paper, we conduct extensive experiments on our dataset using three representative semantic segmentation methods: CCNet (Huang et al. 2019), FPN (Kirillov et al. 2019) and SeTR (Zheng et al. 2020). We also plug the proposed ReLeM into these methods to show its general efficiency.
3. Food Image Segmentation Dataset
FoodSeg103 is a subset of FoodSeg154, and the latter includes an additional subset of Asian food images and annotations. Some example images and their annotations can be found in Figure 2. In FoodSeg103, we have defined 103 ingredient categories and assigned these category labels as well as the segmentation masks to 7,118 images. The images are from an existing recipe dataset called Recipe1M (Salvador et al. 2017). For the additional subset in FoodSeg154, we specially collect 2,372 images of Asian food which is of larger diversity than the Western food in FoodSeg103. We use this subset to evaluate the domain adaptation performance of our food image segmentation models. We release FoodSeg103 to facilitate public research, but currently we cannot make the Asian food set public due to the confidentiality of the images.
3.1. Collecting Food Images
We use FoodSeg103 as an example to elaborate the dataset construction process. We elaborate the image source, category compilation and image selection as follows. Source: We used Recipe1M (Salvador et al. 2017; Marin et al. 2019) as our source dataset. This dataset contains 900k images with cooking instructions and ingredient labels, which are used for food image retrieval and recipe generation tasks. Categories: First, we counted the frequency of all ingredient categories in Recipe1M. While there are around 1.5k ingredient categories (Salvador et al. 2019b), most of them are not easy to be masked out from images. Hence, we kept only the top 124 ingredient categories (with further refinement, this number became 103) and assigned ingredients with the “others” category when they do not fall under the above 124 categories. Finally, we grouped these categories into 14 superclass categories, e.g., “Main” (i.e., main staple) is a superclass category covering more fine-grained categories such as “noodle” and “rice”. Images: In each fine-grained ingredient category, we sampled Recipe1M images based on the following two criteria: 1) the image should contain at least two ingredients (with the same or different categories) but not more than 16 ingredients; and 2) the ingredients should be visible in the images and easy-to-annotate. Finally, we obtained 7,118 images to annotate masks.


3.2. Annotating Ingredient Labels and Masks
Given the above images, the next step is to annotate segmentation masks, i.e., the polygons covering the pixel-wise locations of different ingredients. This effort includes the mask annotation and mask refinement steps. Annotation: We engaged a data annotation company to perform mask annotation, a laborious and painstaking job. For each image, a human annotator first identifies the categories of ingredients in the image, tags each ingredient with the appropriate category label and draws the pixel-wise mask. We asked the annotators to ignore tiny image regions (even if it may contain some ingredients) with area covering less than 5% of the whole image. Refinement: After receiving all masks from the annotation company, we further conducted an overall refinement. We followed three refinement criteria: 1) correcting mislabeled data; 2) deleting unpopular category labels that are assigned to less than 5 images, and 3) merging visually similar ingredient categories, such as orange and citrus. After refinement, we reduced the initial set of 125 ingredient categories to 103. Figure 5 shows some examples refined by us. The annotation and refinement works took around one year.
We show some data examples in Figure 2. In Figure 2 (a), we give some easy cases where the boundaries of ingredients are clear and the image compositions are not complex. In Figure 2 (b) and (c), we show some difficult cases with overlapped ingredient regions and complex compositions in the images. Figure 3 shows the distributions of fine-grained ingredient categories and superclass categories. Figures 3(a) and 3(c) show partial statistics for small subsets of categories due to page limit. The complete statistics will be published when releasing the dataset.


3.3. Comparing with Food Image Datasets
Food Image Datasets. We summarize the comparison results in Table 1. We only include datasets that are mainly used for food recognition tasks. They contain images and dish-level labels, and therefore they do not have any ingredient-level annotations. Recipe1M and Recipe1M+ include ingredient labels for each images but not the segmentation masks. Notably, there are two datasets for food image segmentation: UECFoodPix (Ege and Yanai 2019) and UECFoodPixComplete (Okamoto and Yanai 2021). Below, we compare these two with our datasets FoodSeg103 and FoodSeg154 in detail.
Food Image Segmentation Datasets. UECFoodPix and UECFoodPixComplete (UECFoodPixComp.) are two public datasets for food image segmentation, with 10k images and 102 dish categories. Detailed comparison numbers are given in Table 2. We highlight three advantages of our FoodSeg103 and FoodSeg154: 1) the number of pixel-wise masks of FoodSeg (40k and 60k) is significantly larger than UEC dataset (only 10k); 2) the annotation mask in UECFoodPix and UECFoodPixComp covers entire dish but not ingredients (dish components), while our FoodSeg154 and FoodSeg103 have ingredient-wise masks, which better capture the characteristic of the food. Illustrative comparisons are given in Figure 4.
In Table 2, we not only present the statistic numbers but also evaluate FoodSeg103, UECFoodPix and UECFoodPixComplete using deeplabv3+ as a baseline model. The last row of the table shows that FoodSeg103 serves as a more challenging benchmark for semantic segmentation. Moreover, fine-grained ingredient annotations in our datasets are more useful for analyzing food nutrition and estimating calories in health-related applications.
| Dataset | Year | Type | #Dish | #Ingr. | Images |
| PFID (Chen et al. 2009) | 2009 | CLS | 101 | 0 | 4,545 |
| Food50 (Joutou and Yanai 2009) | 2010 | CLS | 50 | 0 | 5,000 |
| Food85 (Hoashi et al. 2010) | 2010 | CLS | 85 | 0 | 5,500 |
| UEC Food100 (Matsuda and Yanai 2012) | 2012 | CLS | 100 | 0 | 14,361 |
| UEC Food256 (Kawano and Yanai 2014) | 2014 | CLS | 256 | 0 | 25,088 |
| ETH Food-101 (Bossard et al. 2014) | 2014 | CLS | 101 | 0 | 101,000 |
| UPMC Food-101 (Wang et al. 2015) | 2015 | CLS | 101 | 0 | 90,840 |
| Geo-Dish (Xu et al. 2015) | 2015 | CLS | 701 | 0 | 117,504 |
| Sushi-50 (Qiu et al. 2019) | 2019 | CLS | 50 | 0 | 3,963 |
| FoodX-251 (Kaur et al. 2019) | 2019 | CLS | 251 | 0 | 158,846 |
| ISIA Food-200 (Min et al. 2019) | 2019 | CLS | 200 | 0 | 197,323 |
| FoodAI-756 (Sahoo et al. 2019) | 2019 | CLS | 756 | 0 | 400,000 |
| Recipe1M (Salvador et al. 2017) | 2017 | Recipe | 0 | 1488 | 1M |
| Recipe1M+ (Marin et al. 2019) | 2019 | Recipe | 0 | 1488 | 14M |
| UECFoodPix (Ege and Yanai 2019) | 2019 | SEG | 102 | 0 | 10,000 |
| UECFoodPixComp. (Okamoto and Yanai 2021) | 2020 | SEG | 102 | 0 | 10,000 |
| FoodSeg103 | 2021 | SEG | 730 | 103 | 7,118 |
| FoodSeg154 | 2021 | SEG | 730 | 154 | 9,490 |
| Statistics | FoodSeg103 | FoodSeg154 | UECFood | UECFoodComp. |
|---|---|---|---|---|
| # Dish | 730 | 730 | 102 | 102 |
| # Ingr. | 103 | 154 | 0 | 0 |
| # images | 7,118 | 9,490 | 10,000 | 10,000 |
| # masks | 42,097 | 59,773 | 14,011 | 16,060 |
| mean image width | 771 pixels | 776 pixels | 442 pixels | 442 pixels |
| mean image height | 647 pixels | 656 pixels | 349 pixels | 349 pixels |
| mIoU@deeplabv3+ | 34.2 | N.A. | 41.6 | 55.5 |
4. Food Image Segmentation Framework

As shown in Figure 6, our food image segmentation framework contains two modules. One is the recipe learning module (ReLeM) to incorporate recipes in the form of language embedding into the visual representation of a food image. We call this approach multi-modality knowledge transfer. In this approach, we explicitly force the visual representations of the same ingredient appearing in different dishes to be “connected” in the feature space through the common language embedding (extracted from the ingredient label and its cooking instructions), so as to handle the high variance of the ingredient appearing in different dishes. The other module of our framework is the encoder-decoder based image segmentation. Its encoder is initialized using the one trained by ReLeM, and its decoder is randomly initialized and trained with the segmentation masks. We next introduce the two modules in detail.
Food image segmentation can be viewed as a special type of semantic segmentation (Lin et al. 2017; Zheng et al. 2020). It is more difficult than normal image segmentation due to: 1) the ingredient cooked with different methods can vary a lot by appearances, and 2) ingredient distribution is inevitably long-tailed making the data very sparse for ingredients in the long tail. Given a food image, the Segmenter identifies the ingredient categories and also mask out the corresponding pixels for each category (class). The common metrics for measuring Segmenter’s performance include mIoU (mean IoU over each class), mACC (mean accuracy over all classes) and aAcc (over all pixels), See Figure 7 for more details of IoU and accuracy (Acc) calculation.


4.1. Recipe Learning Module (ReLeM)
Overview. We propose ReLeM to reduce the large intra-variance of ingredients caused by different cooking methods mentioned in the recipes. Specifically, our training method integrates the recipe information into the visual representation of the corresponding image. Assume an ingredient in two different images are cooked in different methods. The visual representations of the ingredients from vision encoder are denoted as and , where and have significant difference in the visual space. ReLeM aims to reduce this difference according to its word embedding of the cooking instructions of the two recipes and respectively in the language space.
| (1) |
where is the vision decoder in the Segmenter (elaborated in Section 4.2).
Our ReLeM is optimized by using two loss terms: cosine similarity loss between features, and semantic loss (distance) between the text representation and the visual representation of the same image:
| (2) |
| (3) |
where denotes whether and are from the same recipe. and denote the semantic class of and respectively, and is the margin parameter, which is set to 0.1. As Recipe1M does not contain specific semantic labels (i.e., dish names), we define 2,000 semantic labels for it by selecting the most frequent dish names appeared in its recipe titles.
Preprocessing. Each recipe contains ingredients and cooking instructions. Some preprocessing steps are required to encode ingredients and instructions from raw text into the fixed length vectors before they are fed into the text encoder. Specifically, we first extract useful ingredient and instruction texts from the raw recipe data by removing redundant words. For each ingredient, we learn a word2vec (Mikolov et al. 2013) representation using a bi-directional LSTM. As the sequence of instructions can be long, it is difficult for LSTM to encode them, due to the gradient vanishing issue. Following a previous work (Salvador et al. 2017), we encode the instructions with a skip-instructions (Kiros et al. 2015) to generate the feature vectors with a fixed length.
Text Encoder. The text encoder is a general module to extract text knowledge from ingredient labels and cooking instructions. We use two types of text encoders: LSTM-based encoder and transformer-based encoder. For LSTM-based, we use a bi-directional LSTM to encode ingredient features and a LSTM to encode instruction features. For transformer-based model, we use two light-weight transformers, each of which contains 2 transformer layers with 4-head self-attention modules.
Vision Encoder. The vision encoder used in ReLeM aims to extract the visual knowledge from the input image, and the weights will initialize the vision encoder in the segmenter. In this paper, two vision encoders are used: ResNet-50 (He et al. 2016) based on convolutional neural network and ViT-16/B (Dosovitskiy et al. 2021) based on vision transformers.
4.2. Image Segmentation Module (Segmenter)
Our framework follows the standard paradigm of semantic segmentation, where the input image is first encoded in a vision encoder, and then goes through a vision decoder for mask prediction. The existing segmentation models can be roughly divided into three groups, based on the different designs of encoder and decoder: Dilation based, Feature Pyramid Networks (FPN) based and Transformer based.



Dilation based. Dilation convolution layers aim to enlarge the receptive fields without sacrificing the resolution, as shown in Figure 8 (a). In its decoder, only the last-layer feature maps are used for prediction (Huang et al. 2019; Chen et al. 2017), as shown in Figure 9 (a).
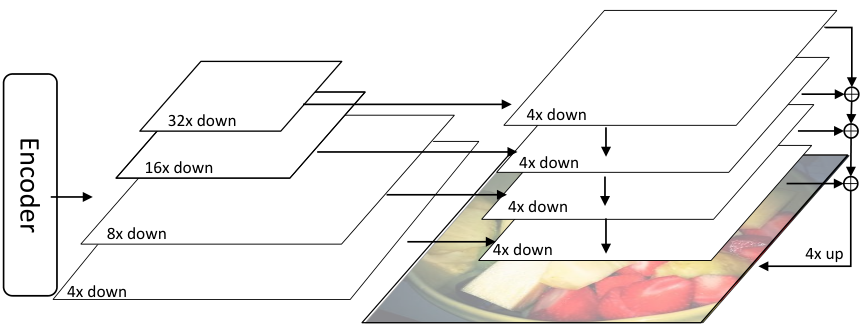
FPN based. FPN integrates feature maps in different layers by the lateral connection. The shallow-layer image representation is enhanced by integrating the feature maps generated in deep layers, as shown in Figure 8 (b). In its decoder, a set of feature pyramids are merged together followed with a mask predictor, as shown in Figure 9 (b).
Transformer based. Transformer is based on attention, which suits semantic segmentation tasks well—-the contextual information is important in segmenting objects. Moreover, the receptive fields can be enlarged via attention mechanism (Zheng et al. 2020; Vaswani et al. 2017). The transformer-based model reshapes the image into a sequence of regions and then encodes them by a sequence of attention modules, as shown in Figure 8 (c). Its decoder predicts segmentation masks on the last-layer feature maps, as shown in Figure 9(c).
In this paper, we conduct experiments using three representative frameworks of these three types, respectively, i.e., CCNet (Dilation) (Huang et al. 2019), FPN (Kirillov et al. 2019) and SeTR (Transformer) (Zheng et al. 2020). Note that the encoder of Segmenter is pre-trained by our ReLeM. With LSTM and transformer-based text encoding, we arrive at 6 different ReLeM models, i.e., ReLeM- CCNet, FPN, SeTR LSTM, Transformer. We use the standard pixel-wise cross-entropy loss to optimize segmentation models.
5. Experiments
We conduct extensive experiments on our dataset FoodSeg103 and implement our proposed ReLeM by incorporating three baseline methods of semantic segmentation. Below, we first elaborate the experimental settings and the results of an ablation study. Then, we show the performance gaps of the top model in the typical semantic segmentation task and our food image segmentation task. We also evaluate the model adaptability using the Asian food data splits in our FoodSeg154. Lastly, we provide some qualitative results of our best segmentation models.
5.1. Implementation Details
Dataset Settings In our experiments, we use FoodSeg103 for in-domain training and testing, and use the additional Asian food set for out-domain testing. We randomly divide FoodSeg103 dataset into two splits: training set and testing set, according to the 7:3 ratio. Our training set contains 4,983 images with 29,530 ingredient masks, while testing set contains 2,135 images with 12,567 ingredient masks. For ReLeM training, we use the training set of Recipe1M+ to learn the recipe representations (with test images in FoodSeg103 hidden from training).
Segmenter Settings We conduct experiments based on two types of vision encoders: ResNet-50 (He et al. 2016) based on convolutional neural networks, and ViT-16/B (Dosovitskiy et al. 2021) based on vision transformer. ResNet-50 is initialized from the pre-training model on ImageNet-1k (Deng et al. 2009), which is widely used in multiple vision tasks (Krizhevsky et al. 2012; Ren et al. 2015; Chen et al. 2017). ViT-16/B (Dosovitskiy et al. 2021) is a transformer-based model, which is initialized from the pre-training model on ImageNet-21k. ViT-16/B contains 12 transformer encoders with 12-head self-attention modules. We use the bilinear interpolation method to reinitialize the pre-trained positional embedding. In this paper, we use three types of segmentors: CCNet (Huang et al. 2019), FPN (Kirillov et al. 2019) and SeTR (Zheng et al. 2020). CCNet and FPN are based on ResNet-50, while SeTR is based on ViT-16/B. Notably, SeTR extracts feature maps from transformer encoders, followed by two sets of convolution layers for prediction. Other components of the segmentors follow the default settings with random initialization.
ReLeM Settings We use two types of vision encoders in ReLeM: ResNet-50 and ViT-16/B, which follow the same setting as Segmenter. In text preprocessing step, we use the skip-instruction models from the pre-trained weights in (Marín et al. 2021).
Learning Parameters of Segmenter Each image will be resized into a fixed size of pixels with a ratio range from 0.5 to 2.0. A patch is cropped from the resized images, and random horizontal flipping and color jitter are applied. We trained the models with 80k iterations based on 8 images per batch, and optimized the models by SGD solvers, with a momentum as 0.9 and weight decay as 0.0005. For CCNet and FPN, we set the initial learning rate to 1e-3, while for SeTR we set initial learning rate to 1e-3. According to the general settings (Wang et al. 2021; Huang et al. 2019), the learning rate is decayed by a power of 0.9 according to the polynomial decay schedule. For simplicity, we do not apply hard negative mining during training, and our framework is based on the widely used platform mmsegmentation (Contributors 2020). All experiments were conducted on 4 Tesla-V100 GPU cards.
Learning Parameters of ReLeM Each input image are resized into a size of pixels and a patch is cropped from the resized images as the input of the vision encoder. The model is trained for 720 epochs and each batch contains 160 images. We use Adam solver (Kingma and Ba 2015) to optimize the models, with a learning rate of 1e-4, Here we follow a two-stage optimization strategy. We first freeze the weights of the vision encoder and optimize the text encoder. After the text encoder converges, we start to train the vision encoder and freeze the parameters of the text encoder.


5.2. Results and Observations
The experiment results of CCNet, FPN and SeTR on FoodSeg103 are shown in Table 3.
| Methods | mIoU | mAcc | Model Size |
|---|---|---|---|
| CCNet (Huang et al. 2019) (ResNet-50) | 35.5 | 45.3 | 381M |
| ReLeM-CCNet (LSTM) | 36.8 | 47.4 | 381M |
| ReLeM-CCNet (Transformer) | 36.0 | 46.5 | 381M |
| FPN (Kirillov et al. 2019) (ResNet-50) | 27.8 | 38.2 | 218M |
| ReLeM-FPN (LSTM) | 29.1 | 39.8 | 218M |
| ReLeM-FPN (Transformer) | 28.9 | 39.7 | 218M |
| SeTR (Zheng et al. 2020), (ViT-16/B) | 41.3 | 52.7 | 723M |
| ReLeM-SeTR (LSTM) | 43.9 | 57.0 | 723M |
| ReLeM-SeTR (Transformer) | 43.2 | 55.7 | 723M |
The Segmenters of all CCNet, FPN and SeTR achieve significant improvements when incorporating with either LSTM-based or transformer-based ReLeM (1.3%, 1.3% and 2.6% improvement). This confirms that ReLeM is effective in enhancing both convolution based and transformer based semantic segmentation models. Besides, we can see that the performance of using LSTM-based ReLeM is consistently superior than using transformer-based ReLeM across all the model configurations.
5.3. Comparing FoodSeg103 with Cityscapes
We compare the food image segmentation task with conventional semantic segmentation to compare the degree of difficulty of the two types of segmentation tasks. We include three types of state-of-the-art segmentation algorithms, CCNet, SeTR and FPN. They are evaluated on FoodSeg103 and Cityscapes (Cordts et al. 2016) datasets. Cityscapes contains around 5,000 images captured on the streets of German cities, and 20 types of objects as segmentation targets. As we can see from Table 4, all baseline methods achieve satisfactory results on Cityscapes, but suffer significant performance drops on our FoodSeg103. This indirectly shows the greater level of difficulty in the food image segmentation problem.
| Methods | Cityscapes | FoodSeg103 | gap |
|---|---|---|---|
| CCNet | 79.0 | 35.0 | 34.0 |
| Sem-FPN | 74.5 | 27.8 | 46.7 |
| SeTR | 77.9 | 41.3 | 36.6 |
| Methods | mIoU | mAcc | aAcc |
|---|---|---|---|
| CCNet | 28.6 | 47.8 | 78.9 |
| ReLeM-CCNet | 29.2 | 47.5 | 79.3 |
| CCNet-Finetune | 41.3 | 53.8 | 87.7 |
| ReLeM-CCNet-Finetune | 47.1 | 59.5 | 85.5 |
| FPN | 21.9 | 41.7 | 75.5 |
| ReLeM-FPN | 22.9 | 42.3 | 77.0 |
| FPN-Finetune | 27.1 | 38.0 | 82.6 |
| ReLeM-FPN-Finetune | 30.8 | 40.7 | 78.9 |
5.4. Qualitative Examples
In Figure 10, we show some qualitative results of using CCNet and ReLeM-CCNet on the testing set of FoodSed103. The first two rows clearly show that ReLeM-CCNet produces more accurate and detailed predictions than the vanilla CCNet, demonstrating the effectiveness of ReLeM. In the last row, we show a failure case. It is actually a hard example with no clear boundaries among different ingredients.
5.5. Cross-Domain Evaluation
We conduct an out-domain model evaluation using the Asian food data set in FoodSeg154. With the model trained on FoodSeg103, we adapt it to the subset of FoodSeg154, the Asian food data set. Specifically, the Asia food set is evenly divided into the training and testing splits. We fine-tune the trained model on the training set and then run the model on the testing data. In Table 5, we show the performances of three models trained with the following settings: 1) without ReLeM, 2) with ReLeM and 3) with ReLeM and fine-tuned on the training split of the Asian food set. For the first two settings, we only evaluate the 62 classes in Asian food set overlapped with FoodSeg103, and for the last setting, we evaluate 112 classes (all). From the results in Table 5, we observe that using ReLeM consistently outperforms baselines in both cases—with and without model fine-tuning on the training split of Asian food data.
6. Conclusions
We construct a large-scale image dataset FoodSeg103 (and its extension FoodSeg154) for food image segmentation research. We use around 10k images and annotate 60k segmentation masks in total, covering highly diverse appearances among 154 ingredients. In addition, we propose a multi-modality based pre-training method ReLeM, and validate its effectiveness by incorporating three baseline semantic segmentation methods and conducting extensive experiments on the FoodSeg103, i.e., using the typical setting, as well as on the FoodSeg154, i.e., using the challenging cross-domain setting.
7. Acknowledgement
This research is supported by the National Research Foundation, Singapore under its International Research Centres in Singapore Funding Initiative. Any opinions, findings and conclusions or recommendations expressed in this material are those of the author(s) and do not reflect the views of National Research Foundation, Singapore. It is also partially supported by A*STAR under its AME YIRG Grant (Project No. A20E6c0101).
References
- (1)
- Bossard et al. (2014) Lukas Bossard, Matthieu Guillaumin, and Luc Van Gool. 2014. Food-101–mining discriminative components with random forests. In ECCV. 446–461.
- Boswell et al. (2018) Rebecca G Boswell, Wendy Sun, Shosuke Suzuki, and Hedy Kober. 2018. Training in cognitive strategies reduces eating and improves food choice. PNAS (2018), E11238–E11247.
- Chen et al. (2015) Liang-Chieh Chen, George Papandreou, Iasonas Kokkinos, Kevin Murphy, and Alan L Yuille. 2015. Semantic image segmentation with deep convolutional nets and fully connected crfs. In ICLR.
- Chen et al. (2017) Liang-Chieh Chen, George Papandreou, Iasonas Kokkinos, Kevin Murphy, and Alan L Yuille. 2017. Deeplab: Semantic image segmentation with deep convolutional nets, atrous convolution, and fully connected crfs. TPAMI (2017), 834–848.
- Chen et al. (2009) Mei Chen, Kapil Dhingra, Wen Wu, Lei Yang, Rahul Sukthankar, and Jie Yang. 2009. PFID: Pittsburgh fast-food image dataset. In ICIP. 289–292.
- Ciocca et al. (2017) Gianluigi Ciocca, Paolo Napoletano, and Raimondo Schettini. 2017. Learning CNN-based features for retrieval of food images. In ICIAP. 426–434.
- Contributors (2020) MMSegmentation Contributors. 2020. MMSegmentation: OpenMMLab Semantic Segmentation Toolbox and Benchmark. https://github.com/open-mmlab/mmsegmentation.
- Cordts et al. (2016) Marius Cordts, Mohamed Omran, Sebastian Ramos, Timo Rehfeld, Markus Enzweiler, Rodrigo Benenson, Uwe Franke, Stefan Roth, and Bernt Schiele. 2016. The Cityscapes Dataset for Semantic Urban Scene Understanding. In CVPR.
- David and Michael (2014) Tilman David and Clark Michael. 2014. Global diets link environmental sustainability and human health. Nature (2014), 518–22.
- Deng et al. (2009) Jia Deng, Wei Dong, Richard Socher, Li-Jia Li, Kai Li, and Li Fei-Fei. 2009. Imagenet: A large-scale hierarchical image database. In CVPR.
- Deng et al. (2019) Lixi Deng, Jingjing Chen, Qianru Sun, Xiangnan He, Sheng Tang, Zhaoyan Ming, Yongdong Zhang, and Tat Seng Chua. 2019. Mixed-dish recognition with contextual relation networks. In Proceedings of ACM international conference on Multimedia. 112–120.
- Dosovitskiy et al. (2021) Alexey Dosovitskiy, Lucas Beyer, Alexander Kolesnikov, Dirk Weissenborn, Xiaohua Zhai, Thomas Unterthiner, Mostafa Dehghani, Matthias Minderer, Georg Heigold, Sylvain Gelly, Jakob Uszkoreit, and Neil Houlsby. 2021. An Image is Worth 16x16 Words: Transformers for Image Recognition at Scale. In ICLR.
- Ege and Yanai (2019) Takumi Ege and Keiji Yanai. 2019. A New Large-scale Food Image Segmentation Dataset and Its Application to Food Calorie Estimation Based on Grains of Rice. In MADiMa. 82–87.
- H. Lee et al. (2020) Helena H. Lee, Ke Shu, Palakorn Achananuparp, Philips Kokoh Prasetyo, Yue Liu, Ee-Peng Lim, and Lav R Varshney. 2020. RecipeGPT: Generative pre-training based cooking recipe generation and evaluation system. In WWW. 181–184.
- He et al. (2016) Kaiming He, Xiangyu Zhang, Shaoqing Ren, and Jian Sun. 2016. Deep Residual Learning for Image Recognition. In CVPR. 770–778.
- Hoashi et al. (2010) Hajime Hoashi, Taichi Joutou, and Keiji Yanai. 2010. Image recognition of 85 food categories by feature fusion. In ISM. 296–301.
- Huang et al. (2019) Zilong Huang, Xinggang Wang, Lichao Huang, Chang Huang, Yunchao Wei, and Wenyu Liu. 2019. CCNet: Criss-Cross Attention for Semantic Segmentation. In ICCV. 603–612.
- Joutou and Yanai (2009) Taichi Joutou and Keiji Yanai. 2009. A food image recognition system with multiple kernel learning. In ICIP. 285–288.
- Kaur et al. (2019) Parneet Kaur, Karan Sikka, Weijun Wang, Serge J. Belongie, and Ajay Divakaran. 2019. FoodX-251: A Dataset for Fine-grained Food Classification. In CVPRW.
- Kawano and Yanai (2014) Yoshiyuki Kawano and Keiji Yanai. 2014. Automatic expansion of a food image dataset leveraging existing categories with domain adaptation. In ECCV. 3–17.
- Kingma and Ba (2015) Diederik P. Kingma and Jimmy Ba. 2015. Adam: A Method for Stochastic Optimization. In ICLR.
- Kirillov et al. (2019) Alexander Kirillov, Ross Girshick, Kaiming He, and Piotr Dollár. 2019. Panoptic feature pyramid networks. In CVPR. 6399–6408.
- Kiros et al. (2015) Ryan Kiros, Yukun Zhu, Ruslan Salakhutdinov, Richard S Zemel, Antonio Torralba, Raquel Urtasun, and Sanja Fidler. 2015. Skip-thought vectors. arXiv preprint arXiv:1506.06726 (2015).
- Krizhevsky et al. (2012) Alex Krizhevsky, Ilya Sutskever, and Geoffrey E Hinton. 2012. ImageNet Classification with Deep Convolutional Neural Networks. In NeurIPS.
- Lin et al. (2017) Tsung-Yi Lin, Piotr Dollár, Ross Girshick, Kaiming He, Bharath Hariharan, and Serge Belongie. 2017. Feature Pyramid Networks for Object Detection. In CVPR.
- Liu et al. (2021) Ze Liu, Yutong Lin, Yue Cao, Han Hu, Yixuan Wei, Zheng Zhang, Stephen Lin, and Baining Guo. 2021. Swin Transformer: Hierarchical Vision Transformer using Shifted Windows. arXiv preprint arXiv:2103.14030 (2021).
- Long et al. (2015) Jonathan Long, Evan Shelhamer, and Trevor Darrell. 2015. Fully convolutional networks for semantic segmentation. In CVPR. 3431–3440.
- Marin et al. (2019) Javier Marin, Aritro Biswas, Ferda Ofli, Nicholas Hynes, Amaia Salvador, Yusuf Aytar, Ingmar Weber, and Antonio Torralba. 2019. Recipe1M+: A Dataset for Learning Cross-Modal Embeddings for Cooking Recipes and Food Images. TPAMI (2019), 187–203.
- Marín et al. (2021) Javier Marín, Aritro Biswas, Ferda Ofli, Nicholas Hynes, Amaia Salvador, Yusuf Aytar, Ingmar Weber, and Antonio Torralba. 2021. Recipe1M+: A Dataset for Learning Cross-Modal Embeddings for Cooking Recipes and Food Images. TPAMI (2021), 187–203.
- Matsuda and Yanai (2012) Yuji Matsuda and Keiji Yanai. 2012. Multiple-food recognition considering co-occurrence employing manifold ranking. In ICPR. 2017–2020.
- Meyers et al. (2015) Austin Meyers, Nick Johnston, Vivek Rathod, Anoop Korattikara, Alex Gorban, Nathan Silberman, Sergio Guadarrama, George Papandreou, Jonathan Huang, and Kevin P Murphy. 2015. Im2Calories: towards an automated mobile vision food diary. In ICCV. 1233–1241.
- Mikolov et al. (2013) Tomas Mikolov, Kai Chen, Greg Corrado, and Jeffrey Dean. 2013. Efficient estimation of word representations in vector space. arXiv preprint arXiv:1301.3781 (2013).
- Min et al. (2019) Weiqing Min, Linhu Liu, Zhengdong Luo, and Shuqiang Jiang. 2019. Ingredient-Guided Cascaded Multi-Attention Network for Food Recognition. In Proceedings of ACM international conference on Multimedia. 1331–1339.
- Min et al. (2020) Weiqing Min, Linhu Liu, Zhiling Wang, Zhengdong Luo, Xiaoming Wei, and Xiaolin Wei. 2020. ISIA Food-500: A Dataset for Large-Scale Food Recognition via Stacked Global-Local Attention Network. In Proceedings of ACM international conference on Multimedia. 393–401.
- Okamoto and Yanai (2021) Kaimu Okamoto and Keiji Yanai. 2021. UEC-FoodPIX Complete: A Large-scale Food Image Segmentation Dataset. In MADiMa.
- Qiu et al. (2019) Jianing Qiu, Frank P.-W. Lo, Yingnan Sun, Siyao Wang, and Benny Lo. 2019. Mining Discriminative Food Regions for Accurate Food Recognition. In BMVC.
- Ren et al. (2015) Shaoqing Ren, Kaiming He, Ross Girshick, and Jian Sun. 2015. Faster R-CNN: Towards Real-Time Object Detection with Region Proposal Networks. In NeurIPS.
- Sahoo et al. (2019) Doyen Sahoo, Wang Hao, Shu Ke, Xiongwei Wu, Hung Le, Palakorn Achananuparp, Ee-Peng Lim, and Steven C. H. Hoi. 2019. FoodAI: Food Image Recognition via Deep Learning for Smart Food Logging. In KDD. 2260–2268.
- Salvador et al. (2019a) Amaia Salvador, Michal Drozdzal, Xavier Giro-i Nieto, and Adriana Romero. 2019a. Inverse cooking: Recipe generation from food images. In CVPR. 10453–10462.
- Salvador et al. (2019b) Amaia Salvador, Michal Drozdzal, Xavier Giro-i Nieto, and Adriana Romero. 2019b. Inverse Cooking: Recipe Generation From Food Images. In CVPR. 10453–10462.
- Salvador et al. (2017) Amaia Salvador, Nicholas Hynes, Yusuf Aytar, Javier Marin, Ferda Ofli, Ingmar Weber, and Antonio Torralba. 2017. Learning cross-modal embeddings for cooking recipes and food images. In CVPR. 3020–3028.
- Shimoda and Yanai (2017) Wataru Shimoda and Keiji Yanai. 2017. Learning food image similarity for food image retrieval. In BigMM. 165–168.
- Thames et al. (2021) Quin Thames, Arjun Karpur, Wade Norris, Fangting Xia, Liviu Panait, Tobias Weyand, and Jack Sim. 2021. Nutrition5k: Towards Automatic Nutritional Understanding of Generic Food. In CVPR.
- Torralba and Efros (2011) Antonio Torralba and Alexei A Efros. 2011. Unbiased look at dataset bias. In CVPR. 1521–1528.
- Vaswani et al. (2017) Ashish Vaswani, Noam Shazeer, Niki Parmar, Jakob Uszkoreit, Llion Jones, Aidan N Gomez, Ł ukasz Kaiser, and Illia Polosukhin. 2017. Attention is All you Need. In NeurIPS, I. Guyon, U. V. Luxburg, S. Bengio, H. Wallach, R. Fergus, S. Vishwanathan, and R. Garnett (Eds.).
- Wang et al. (2020) Hao Wang, Guosheng Lin, Steven CH Hoi, and Chunyan Miao. 2020. Structure-Aware Generation Network for Recipe Generation from Images. In ECCV. 359–374.
- Wang et al. (2021) Wenhai Wang, Enze Xie, Xiang Li, Deng-Ping Fan, Kaitao Song, Ding Liang, Tong Lu, Ping Luo, and Ling Shao. 2021. Pyramid vision transformer: A versatile backbone for dense prediction without convolutions. arXiv preprint arXiv:2102.12122 (2021).
- Wang et al. (2018) Xiaolong Wang, Ross Girshick, Abhinav Gupta, and Kaiming He. 2018. Non-local neural networks. In CVPR. 7794–7803.
- Wang et al. (2015) Xin Wang, Devinder Kumar, Nicolas Thome, Matthieu Cord, and Frederic Precioso. 2015. Recipe recognition with large multimodal food dataset. In ICME. 1–6.
- Wang et al. (2019) Yunan Wang, Jing-jing Chen, Chong-Wah Ngo, Tat-Seng Chua, Wanli Zuo, and Zhaoyan Ming. 2019. Mixed dish recognition through multi-label learning. In Proceedings of the 11th Workshop on Multimedia for Cooking and Eating Activities. 1–8.
- Xiao et al. (2018) Tete Xiao, Yingcheng Liu, Bolei Zhou, Yuning Jiang, and Jian Sun. 2018. Unified perceptual parsing for scene understanding. In ECCV. 418–434.
- Xu et al. (2015) Ruihan Xu, Luis Herranz, Shuqiang Jiang, Shuang Wang, Xinhang Song, and Ramesh Jain. 2015. Geolocalized modeling for dish recognition. IEEE Transactions on Multimedia (2015), 1187–1199.
- Zhao et al. (2017) Hengshuang Zhao, Jianping Shi, Xiaojuan Qi, Xiaogang Wang, and Jiaya Jia. 2017. Pyramid scene parsing network. In CVPR. 2881–2890.
- Zheng et al. (2020) Sixiao Zheng, Jiachen Lu, Hengshuang Zhao, Xiatian Zhu, Zekun Luo, Yabiao Wang, Yanwei Fu, Jianfeng Feng, Tao Xiang, Philip HS Torr, et al. 2020. Rethinking Semantic Segmentation from a Sequence-to-Sequence Perspective with Transformers. arXiv preprint arXiv:2012.15840 (2020).
Appendix: More Details of FoodSeg103 and FoodSeg154
7.1. Statistics
Image Collection. For FoodSeg103, we first shuffle all the images and randomly select 70% images (4983 images) as training set and the left 30% images as testing set. For Asian Set, we randomly sample 50% images (1186 images) for each dish class, and the left 50% are used for testing. The basic information of training and testing set is listed in Table 6, and the more detailed statistic can be found in Table 9. In our experiments, we use FoodSeg103 for in-domain training and testing, and use the additional Asian set for out-domain evaluation.
Structure of FoodSeg103 FoodSeg103 contains 103 ingredient categories which belong to 15 super categories. In Figure 12, we show the dataset structure of FoodSeg103, where the inner circle plots the names of super classes, and the outer circle plots the corresponding ingredient categories.
7.2. Visualization
Visualization of FoodSeg103. In Figure 11, we show more visualization examples of the source image and its corresponding mask annotation in FoodSeg103.
7.3. Analysis on Transformer-based Models
Vision Transformers have been intensively studied recently, and a bunch of new algorithms have been proposed. The new proposed vision transformers have achieved significantly better performance than conventional CNN-based models in multiple vision tasks. In this section, we explore the performance of applying vision transformers into food image segmentation task. We adopt the vision transformers: ViT (Dosovitskiy et al. 2021), Swin (Liu et al. 2021) and PVT (Wang et al. 2021) as segmentation encoders. We follow the default design of decoders, where FPN is used in PVT models and UperNet (Xiao et al. 2018) is used in Swin models. For ViT models, we use the two default settings in SeTR: Naive and MLA, as decoders. All the models are trained with the default learning settings with 80k iterations.
The results are shown in Table 8. ReLeM-variants show consistent improvement on both PVT and ViT-Naive models (0.7% and 2.6% improvement). However, in ViT-MLA model, the baseline shows better performance. In MLA decoder, feature maps from different level transformer encoders are integrated for final prediction. In ReLeM, however, only the last feature map is extracted for recipe learning. We argue ReLeM can also learn strong multi-level representation by extracting feature maps of different levels for recipe learning, and we leave it as the future work. In addition, larger backbones cannot guarantee improvement and may even hurt the performances (44.5% vs 45.1% in ViT, and 41.2% vs 41.6% in Swin). Besides, Swin achieves much better performance than ViT in other vision tasks (Liu et al. 2021), but in food image segmentation, the performance of Swin is much worse than ViT models, even with more parameters. These results show that food image segmentation task is more challenging and naively boosting the power of backbone cannot guarantee performance gain. Finally, decoders play important roles in transformer-based segmenters, but few efforts have been made to design a food-aware decoders, which is also an important research problem in the future.
| # Images | # Ingredients | |||||||
|---|---|---|---|---|---|---|---|---|
| Datasets | Train | Test | Total | Train | Test | Total | ||
| FoodSeg103 | 4,983 | 2,135 | 7,118 | 29,530 | 12,567 | 42,097 | ||
| Asian Set | 1,186 | 1,186 | 2,372 | 8,795 | 8,881 | 17,676 | ||
| FoodSet154 | 6,169 | 3,321 | 9,490 | 38,325 | 21,448 | 59,773 | ||
| S-classes | Number | S-classes | Number | S-classes | Number |
|---|---|---|---|---|---|
| Dessert | 3913 | Meat | 4956 | Soy | 148 |
| Beverage | 844 | Condiment | 1543 | Vegetable | 15719 |
| Nut | 912 | Seafood | 920 | Fungus | 592 |
| Egg | 424 | Soup | 121 | Salad | 23 |
| Fruit | 6007 | Main | 5634 | Others | 341 |
| Encoder | Decoder | mIoU | mAcc | Model Size |
|---|---|---|---|---|
| PVT-S | FPN | 31.3 | 43.0 | 202M |
| ReLeM-PVT-S | FPN | 32.0 | 44.1 | 202M |
| ViT-16/B | Naive | 41.3 | 52.7 | 723M |
| ReLeM-ViT-16/B | Naive | 43.9 | 57.0 | 723M |
| ViT-16/B | MLA | 45.1 | 57.4 | 711M |
| ReLeM-ViT-16/B | MLA | 43.3 | 55.9 | 711M |
| ViT-16/L | MLA | 44.5 | 56.6 | 2.4G |
| Swin-S | Uper | 41.6 | 53.6 | 931M |
| Swin-B | Uper | 41.2 | 53.9 | 1.4G |

| FoodSeg103 | Asian Set | FoodSeg154 | ||||||||
|---|---|---|---|---|---|---|---|---|---|---|
| Class Id | Class Name | Train | Test | Total | Train | Test | Total | |||
| 1 | candy | 58 | 43 | 101 | 0 | 0 | 101 | |||
| 2 | egg tart | 8 | 6 | 14 | 0 | 0 | 14 | |||
| 3 | french fries | 190 | 87 | 277 | 95 | 83 | 455 | |||
| 4 | chocolate | 158 | 59 | 217 | 0 | 0 | 217 | |||
| 5 | biscuit | 393 | 122 | 515 | 4 | 1 | 520 | |||
| 6 | popcorn | 37 | 11 | 48 | 0 | 0 | 48 | |||
| 7 | pudding | 5 | 1 | 6 | 0 | 0 | 6 | |||
| 8 | ice cream | 927 | 401 | 1328 | 48 | 50 | 1426 | |||
| 9 | cheese butter | 461 | 198 | 659 | 19 | 14 | 692 | |||
| 10 | cake | 535 | 213 | 748 | 0 | 0 | 748 | |||
| 11 | wine | 117 | 50 | 167 | 15 | 19 | 201 | |||
| 12 | milkshake | 107 | 32 | 139 | 0 | 0 | 139 | |||
| 13 | coffee | 136 | 62 | 198 | 8 | 12 | 218 | |||
| 14 | juice | 157 | 64 | 221 | 71 | 72 | 364 | |||
| 15 | milk | 48 | 36 | 84 | 5 | 4 | 93 | |||
| 16 | tea | 29 | 6 | 35 | 15 | 6 | 56 | |||
| 17 | almond | 268 | 74 | 342 | 0 | 0 | 342 | |||
| 18 | red beans | 46 | 27 | 73 | 0 | 0 | 73 | |||
| 19 | cashew | 44 | 43 | 87 | 0 | 0 | 87 | |||
| 20 | dried cranberries | 79 | 55 | 134 | 0 | 0 | 134 | |||
| 21 | soy | 41 | 18 | 59 | 0 | 0 | 59 | |||
| 22 | walnut | 100 | 81 | 181 | 0 | 0 | 181 | |||
| 23 | peanut | 16 | 20 | 36 | 93 | 95 | 224 | |||
| 24 | egg | 321 | 103 | 424 | 162 | 161 | 747 | |||
| 25 | apple | 195 | 80 | 275 | 29 | 49 | 353 | |||
| 26 | date | 14 | 3 | 17 | 51 | 43 | 111 | |||
| 27 | apricot | 39 | 18 | 57 | 0 | 0 | 57 | |||
| 28 | avocado | 104 | 35 | 139 | 9 | 19 | 167 | |||
| 29 | banana | 160 | 101 | 261 | 0 | 0 | 261 | |||
| 30 | strawberry | 745 | 391 | 1136 | 3 | 4 | 1143 | |||
| 31 | cherry | 474 | 140 | 614 | 0 | 0 | 614 | |||
| 32 | blueberry | 559 | 218 | 777 | 0 | 0 | 777 | |||
| 33 | raspberry | 108 | 59 | 167 | 0 | 0 | 167 | |||
| 34 | mango | 80 | 25 | 105 | 0 | 0 | 105 | |||
| 35 | olives | 98 | 44 | 142 | 0 | 0 | 142 | |||
| 36 | peach | 137 | 29 | 166 | 0 | 0 | 166 | |||
| 37 | lemon | 609 | 263 | 872 | 106 | 99 | 1077 | |||
| FoodSeg103 | Asian Set | FoodSeg154 | ||||||||
|---|---|---|---|---|---|---|---|---|---|---|
| Class Id | Class Name | Train | Test | Total | Train | Test | Total | |||
| 38 | pear | 55 | 21 | 76 | 0 | 0 | 76 | |||
| 39 | fig | 51 | 9 | 60 | 0 | 0 | 60 | |||
| 40 | pineapple | 205 | 81 | 286 | 32 | 37 | 355 | |||
| 41 | grape | 189 | 48 | 237 | 0 | 0 | 237 | |||
| 42 | kiwi | 69 | 21 | 90 | 0 | 0 | 90 | |||
| 43 | melon | 44 | 7 | 51 | 0 | 0 | 51 | |||
| 44 | orange | 283 | 110 | 393 | 54 | 48 | 495 | |||
| 45 | watermelon | 68 | 18 | 86 | 0 | 0 | 86 | |||
| 46 | steak | 987 | 483 | 1470 | 0 | 0 | 1470 | |||
| 47 | pork | 646 | 261 | 907 | 0 | 0 | 907 | |||
| 48 | chicken duck | 1160 | 508 | 1668 | 0 | 0 | 1668 | |||
| 49 | sausage | 372 | 93 | 465 | 32 | 34 | 531 | |||
| 50 | fried meat | 209 | 118 | 327 | 0 | 0 | 327 | |||
| 51 | lamb | 85 | 34 | 119 | 0 | 0 | 119 | |||
| 52 | sauce | 1124 | 419 | 1543 | 19 | 15 | 1577 | |||
| 53 | crab | 19 | 11 | 30 | 38 | 37 | 105 | |||
| 54 | fish | 348 | 138 | 486 | 103 | 126 | 715 | |||
| 55 | shellfish | 77 | 27 | 104 | 37 | 40 | 181 | |||
| 56 | shrimp | 211 | 89 | 300 | 51 | 54 | 405 | |||
| 57 | soup | 92 | 29 | 121 | 0 | 0 | 121 | |||
| 58 | bread | 1698 | 738 | 2436 | 49 | 40 | 2525 | |||
| 59 | corn | 411 | 170 | 581 | 29 | 35 | 645 | |||
| 60 | hamburg | 7 | 1 | 8 | 0 | 0 | 8 | |||
| 61 | pizza | 83 | 22 | 105 | 0 | 0 | 105 | |||
| 62 | hanamaki baozi | 22 | 14 | 36 | 0 | 0 | 36 | |||
| 63 | wonton dumplings | 10 | 10 | 20 | 165 | 149 | 334 | |||
| 64 | pasta | 171 | 59 | 230 | 18 | 3 | 251 | |||
| 65 | noodles | 337 | 140 | 477 | 811 | 836 | 2124 | |||
| 66 | rice | 655 | 277 | 932 | 294 | 306 | 1532 | |||
| 67 | pie | 563 | 246 | 809 | 20 | 17 | 846 | |||
| 68 | tofu | 111 | 37 | 148 | 73 | 57 | 278 | |||
| 69 | eggplant | 34 | 9 | 43 | 38 | 12 | 93 | |||
| 70 | potato | 1041 | 400 | 1441 | 110 | 111 | 1662 | |||
| 71 | garlic | 143 | 29 | 172 | 40 | 36 | 248 | |||
| 72 | cauliflower | 237 | 100 | 337 | 43 | 32 | 412 | |||
| 73 | tomato | 1404 | 687 | 2091 | 124 | 100 | 2315 | |||
| 74 | kelp | 4 | 5 | 9 | 0 | 0 | 9 | |||
| FoodSeg103 | Asian Set | FoodSeg154 | ||||||||
|---|---|---|---|---|---|---|---|---|---|---|
| Class Id | Class Name | Train | Test | Total | Train | Test | Total | |||
| 75 | seaweed | 16 | 10 | 26 | 29 | 29 | 84 | |||
| 76 | spring onion | 285 | 113 | 398 | 556 | 561 | 1515 | |||
| 77 | rape | 59 | 23 | 82 | 360 | 429 | 871 | |||
| 78 | ginger | 25 | 12 | 37 | 24 | 34 | 95 | |||
| 79 | okra | 35 | 9 | 44 | 31 | 18 | 93 | |||
| 80 | lettuce | 748 | 338 | 1086 | 245 | 230 | 1561 | |||
| 81 | pumpkin | 114 | 25 | 139 | 0 | 0 | 139 | |||
| 82 | cucumber | 568 | 267 | 835 | 234 | 203 | 1272 | |||
| 83 | white radish | 56 | 34 | 90 | 63 | 52 | 205 | |||
| 84 | carrot | 1407 | 670 | 2077 | 156 | 143 | 2376 | |||
| 85 | asparagus | 325 | 139 | 464 | 24 | 23 | 511 | |||
| 86 | bamboo shoots | 8 | 7 | 15 | 0 | 0 | 15 | |||
| 87 | broccoli | 966 | 427 | 1393 | 35 | 49 | 1477 | |||
| 88 | celery stick | 233 | 91 | 324 | 36 | 35 | 395 | |||
| 89 | cilantro mint | 1045 | 466 | 1511 | 323 | 320 | 2154 | |||
| 90 | snow peas | 103 | 49 | 152 | 6 | 16 | 174 | |||
| 91 | cabbage | 139 | 39 | 178 | 25 | 13 | 216 | |||
| 92 | bean sprouts | 35 | 20 | 55 | 34 | 34 | 123 | |||
| 93 | onion | 732 | 304 | 1036 | 85 | 103 | 1224 | |||
| 94 | pepper | 552 | 242 | 794 | 189 | 191 | 1174 | |||
| 95 | green beans | 237 | 125 | 362 | 40 | 37 | 439 | |||
| 96 | French beans | 360 | 168 | 528 | 39 | 34 | 601 | |||
| 97 | king oyster mushroom | 12 | 3 | 15 | 0 | 0 | 15 | |||
| 98 | shiitake | 185 | 106 | 291 | 167 | 205 | 663 | |||
| 99 | enoki mushroom | 9 | 5 | 14 | 25 | 31 | 70 | |||
| 100 | oyster mushroom | 11 | 4 | 15 | 0 | 0 | 15 | |||
| 101 | white button mushroom | 195 | 62 | 257 | 35 | 26 | 318 | |||
| 102 | salad | 12 | 11 | 23 | 0 | 0 | 23 | |||
| 103 | other ingredients | 230 | 111 | 341 | 667 | 738 | 1746 | |||
| 104 | water | 0 | 0 | 0 | 2 | 4 | 6 | |||
| 105 | goji berry | 0 | 0 | 0 | 33 | 50 | 83 | |||
| 106 | ribs | 0 | 0 | 0 | 148 | 135 | 283 | |||
| 107 | tripe | 0 | 0 | 0 | 31 | 36 | 67 | |||
| 108 | meat slices | 0 | 0 | 0 | 135 | 170 | 305 | |||
| 109 | minced meat | 0 | 0 | 0 | 95 | 69 | 164 | |||
| 110 | pork belly | 0 | 0 | 0 | 87 | 76 | 163 | |||
| 111 | pork intestine | 0 | 0 | 0 | 16 | 16 | 32 | |||
| 112 | pork skin | 0 | 0 | 0 | 33 | 15 | 48 | |||
| 113 | blood | 0 | 0 | 0 | 4 | 4 | 8 | |||
| 114 | pork liver | 0 | 0 | 0 | 26 | 16 | 42 | |||
| 115 | shredded pork | 0 | 0 | 0 | 25 | 34 | 59 | |||
| FoodSeg103 | Asian Set | FoodSeg154 | ||||||||
|---|---|---|---|---|---|---|---|---|---|---|
| Class Id | Class Name | Train | Test | Total | Train | Test | Total | |||
| 116 | chicken legs/duck legs | 0 | 0 | 0 | 65 | 62 | 127 | |||
| 117 | meat skewers | 0 | 0 | 0 | 48 | 51 | 99 | |||
| 118 | chicken feet | 0 | 0 | 0 | 32 | 33 | 65 | |||
| 119 | barbecued pork | 0 | 0 | 0 | 125 | 102 | 227 | |||
| 120 | beef ball | 0 | 0 | 0 | 81 | 60 | 141 | |||
| 121 | poultry meat | 0 | 0 | 0 | 235 | 234 | 469 | |||
| 122 | barbecued pork sauce | 0 | 0 | 0 | 69 | 73 | 142 | |||
| 123 | caviar | 0 | 0 | 0 | 24 | 22 | 46 | |||
| 124 | curry sauce | 0 | 0 | 0 | 0 | 11 | 11 | |||
| 125 | satay sauce | 0 | 0 | 0 | 36 | 45 | 81 | |||
| 126 | chili sauce | 0 | 0 | 0 | 99 | 95 | 194 | |||
| 127 | ketchup | 0 | 0 | 0 | 35 | 21 | 56 | |||
| 128 | salad sauce | 0 | 0 | 0 | 16 | 20 | 36 | |||
| 129 | basil sauce | 0 | 0 | 0 | 30 | 25 | 55 | |||
| 130 | garlic sauce | 0 | 0 | 0 | 8 | 8 | 16 | |||
| 131 | cuttlefish | 0 | 0 | 0 | 4 | 3 | 7 | |||
| 132 | squid | 0 | 0 | 0 | 32 | 31 | 63 | |||
| 133 | fish cakes | 0 | 0 | 0 | 78 | 100 | 178 | |||
| 134 | fish Ball | 0 | 0 | 0 | 220 | 205 | 425 | |||
| 135 | fish tofu | 0 | 0 | 0 | 27 | 26 | 53 | |||
| 136 | fried fish | 0 | 0 | 0 | 76 | 66 | 142 | |||
| 137 | small dried fish | 0 | 0 | 0 | 73 | 71 | 144 | |||
| 138 | yut yiao | 0 | 0 | 0 | 46 | 56 | 102 | |||
| 139 | porridge | 0 | 0 | 0 | 36 | 55 | 91 | |||
| 140 | fried banana leaves | 0 | 0 | 0 | 23 | 32 | 55 | |||
| 141 | rice cake | 0 | 0 | 0 | 16 | 14 | 30 | |||
| 142 | yuba | 0 | 0 | 0 | 27 | 29 | 56 | |||
| 143 | fried tofu | 0 | 0 | 0 | 11 | 24 | 35 | |||
| 144 | beancurd puff | 0 | 0 | 0 | 26 | 33 | 59 | |||
| 145 | preserved vegetable | 0 | 0 | 0 | 7 | 17 | 24 | |||
| 146 | salted vegetables | 0 | 0 | 0 | 32 | 25 | 57 | |||
| 147 | pea seedlings | 0 | 0 | 0 | 13 | 15 | 28 | |||
| 148 | kai lan | 0 | 0 | 0 | 6 | 11 | 17 | |||
| 149 | lotus root | 0 | 0 | 0 | 26 | 26 | 52 | |||
| 150 | amaranth | 0 | 0 | 0 | 23 | 16 | 39 | |||
| 151 | millet spicy | 0 | 0 | 0 | 64 | 65 | 129 | |||
| 152 | bitter gourd | 0 | 0 | 0 | 16 | 17 | 33 | |||
| 153 | daylily | 0 | 0 | 0 | 1 | 5 | 6 | |||
| 154 | agaric | 0 | 0 | 0 | 33 | 42 | 75 | |||
| - | Summary | 29530 | 12567 | 42097 | 8795 | 8881 | 59773 | |||
