The Gaia-ESO survey: Mixing processes in low-mass stars traced by lithium abundance in cluster and field starsThanks: Based on observations collected with the FLAMES instrument at VLT/UT2 telescope (Paranal Observatory, ESO, Chile), for the Gaia- ESO Large Public Spectroscopic Survey (188.B-3002, 193.B-0936, 197.B-1074).Tables 2, A.2 and A.3’ are only available in electronic form at the CDS via anonymous ftp to cdsarc.u-strasbg.fr (130.79.128.5) or via http://cdsweb.u-strasbg.fr/cgi-bin/qcat?J/A+A/
Abstract
Aims. We aim to constrain the mixing processes in low-mass stars by investigating the behaviour of the Li surface abundance after the main sequence. We take advantage of the data from the sixth internal data release of Gaia-ESO, idr6, and from the Gaia Early Data Release 3, edr3.
Methods. We select a sample of main sequence, sub-giant, and giant stars in which Li abundance is measured by the Gaia-ESO survey, belonging to 57 open clusters with ages from 120 Myr to about 7 Gyr and to Milky Way fields, covering a range in [Fe/H] between and dex. We study the behaviour of the Li abundances as a function of stellar parameters. We infer the masses of giant stars in clusters from the main-sequence turn-off masses, and for field stars through comparison with stellar evolution models using a maximum-likelihood technique. We compare the observed Li behaviour in field giant stars and in giant stars belonging to individual clusters with the predictions of a set of classical models and of models with mixing induced by rotation and thermohaline instability.
Results. The comparison with stellar evolution models confirms that classical models cannot reproduce the lithium abundances observed in the metallicity and mass regimes covered by the data. The models that include the effects of both rotation-induced mixing and thermohaline instability account for the Li abundance trends observed in our sample, in all metallicity and mass ranges. The differences between the results of the classical models and of the rotation models largely differ (up to 2 dex), making lithium the best element to constrain stellar mixing processes in low-mass stars. We discuss the nature of a sample of Li-rich stars.
Conclusions. We demonstrate that the evolution of the surface abundance of Li in giant stars is a powerful tool to constrain theoretical stellar evolution models, allowing us to distinguish the impact of different mixing processes. For stars with well-determined masses, we find a better agreement between observed surface abundances and models with rotation-induced and thermohaline mixings, the former dominating during the main sequence and the first phases of the post-main sequence evolution and the latter after the bump in the luminosity function.
Key Words.
Stars: abundances, Stars: evolution, Galaxy: open clusters and associations: general1 Introduction
Big Bang nucleosynthesis produced mostly H and He, together with a small amount of the lithium-7 isotope (Coc et al. 2004; Galli & Palla 2013; Olive 2013; Pitrou et al. 2018, hereafter Li; e.g.). However, the Li that one observes in the present-time Universe is only in part the one originally produced during the Big Bang, as its abundance is modified by a number of constructive and destructive processes which make Li one of the elements with the most complex history (e.g. Matteucci et al. 1995; Romano et al. 2001; Travaglio et al. 2001; Prantzos 2012; Bensby & Lind 2018; Grisoni et al. 2019; Randich et al. 2020; Smiljanic 2020; Randich & Magrini 2021, and references therein).
One of the difficulties in tracing the history of cosmic Li is that, with the exception of the early pre-main sequence (PMS) phases, stars rarely exhibit the original Li with which they formed. This fragile element is destroyed by proton captures in stellar interiors when the temperature is of the order of 2.5 106 K or higher. Depending on the mass and metallicity of the star, photospheric Li can be significantly depleted already on the pre-main sequence (PMS), during the proto-stellar accretion phase (Tognelli et al. 2020) and along the Hayashi track, and/or on the main sequence (MS), due to several mechanisms that have the potential to transport the photospheric material into hotter layers where Li can be burned: atomic diffusion, overshooting, rotation-induced mixing, internal gravity waves and other types of magneto-hydrodynamical instabilities that are not included in the so-called classical evolution models (Michaud 1986; Charbonneau & Michaud 1990; Schramm et al. 1990; Richard et al. 1996; Deliyannis et al. 2000; Denissenkov & Tout 2003; Talon & Charbonnel 2010; Eggenberger et al. 2012; Castro et al. 2016; Somers & Pinsonneault 2016; Baraffe et al. 2017; Deal et al. 2021; Dumont et al. 2021).
After the MS, convection sinks inside the stars bringing material that has been partially nuclear-processed in the stellar interior to the surface. This enriches the external layers in 13C, 14N and 3,4He, and dilutes Li. According to the classical model by Iben 1967, during this so-called first dredge-up event (FDU), the surface Li abundance decreases by a factor from 30 to 60, depending on the stellar mass and metallicity. Starting from the present interstellar medium abundance of A(Li)11 1 A(Li)=log()+12, where X and A are the mass fraction and the atomic mass = 3.3 dex (Asplund et al. 2009, the value found in Solar System meteorites and considered the reference limit for Population I dwarf stars; ), the Li abundance of red giant stars is thus expected to decrease at least down to a value A(Li)1.5 dex. Models that include some of the above-mentioned transport processes already acting on the MS predict lower post-FDU values of lithium abundances. These models better agree with the observations of subgiant and giant stars (Brown et al. 1989; Balachandran 1995; Palacios et al. 2003; Mallik et al. 2003; Pasquini et al. 2004; Lèbre et al. 2006a; Gonzalez et al. 2009; Anthony-Twarog et al. 2009; Charbonnel et al. 2020, i.e., that Li depletion appears at hotter effective temperature and is larger than in classical models; see e.g.).
Finally, classical models do not predict any decreasing trend of Li abundance in the subsequent evolutionary phases, although Li is observed to drop again after the luminosity bump on the red giant branch (Charbonnel et al. 1998; Gratton et al. 2000; Lind et al. 2009, RGB; e.g.). This is likely caused by the activation of thermohaline (double diffusive) instability, which could also affect carbon and nitrogen abundances (Charbonnel & Zahn 2007; Denissenkov et al. 2009; Charbonnel & Lagarde 2010; Lattanzio et al. 2015; Sengupta & Garaud 2018a; Henkel et al. 2017, e.g.).
While some non-classical stellar models manage to reproduce the main Li trends described above, they still suffer from serious shortcomings. For example, they fail to simultaneously reproduce the internal rotation profiles of sub-giant and giant stars as depicted by asteroseismology (Marques et al. 2013; Ceillier et al. 2013; Eggenberger et al. 2017; Eggenberger et al. 2019, e.g.). In addition, different prescriptions for thermohaline mixing are required to explain the surface abundance of Li and C in low-metallicity bright red-giant stars (Angelou et al. 2015; Henkel et al. 2017, e.g.). The difficulty is that macroscopic magnetic hydrodynamic (MHD) transport processes act on a broad range of spatial and time scales which cannot be handled numerically when computing secular evolution (Mathis 2013, e.g.). One-dimensional (1D) stellar models thus rely on simplified prescriptions for, e.g., turbulence and magneto-hydrodynamic instabilities that are, in the best case, ”educated” from numerical and laboratory experiments which are however still far from reproducing stellar interior conditions (Richard & Zahn 1999; Palmerini et al. 2011; Prat & Lignières 2013; Prat et al. 2015; Garaud & Kulenthirarajah 2016; Mathis et al. 2018; Sengupta & Garaud 2018b; Garaud 2021, e.g.).
In this framework, observations of large samples of stars with available Li abundances provide fundamental constraints to models. However, most studies focused on field stars, including only small numbers of star clusters (Lambert et al. 1980; Balachandran 1990; Pasquini et al. 2004; Lind et al. 2009; Smiljanic et al. 2009; Canto Martins et al. 2011, see. e.g.). So far, a homogeneous analysis of Li in both field and cluster populations is missing, even in large spectroscopic surveys, such as the GALactic Archaeology with HERMES survey (Buder et al. 2020, GALAH).
In the present work, we take advantage of the Gaia-ESO database (Gilmore et al. 2012; Randich et al. 2013) for the sixth internal data release (idr6), which includes homogeneously-determined Li abundances in stars of open clusters and in the field. With these data, we investigate the Li abundance evolution after the MS over a large range of [Fe/H] and stellar masses. In particular, for clusters metallicity and age, and consequently the masses of their stars at the main sequence turn-off (MSTO) and RGB, can be estimated more accurately than for field stars, therefore they allow a more accurate comparison with the results of theoretical models. In addition, the observed star clusters are usually younger than field stars, allowing us to map higher mass ranges.
The paper is structured as follows. In Sect. 2 we present the abundance analysis and the sample selection. In Sect. 3, we compare the Gaia-ESO idr6 results with other catalogues. In Sect. 4, we study the behaviour of Li abundances along the RGB in field stars with masses determined with a maximum-likelihood method using a large and homogeneous grid of stellar models, and in members of individual star clusters. We compare our data with model predictions and discuss the impact of rotation-induced mixing and thermohaline instability. In Sect. 5, we identify Li-rich giants, discuss their properties and the effect of stellar rotation. Finally, in Sect. 6 we give our summary and conclusions.
2 Abundance analysis and sample selection
2.1 Li abundance determination
We use data from idr6 of the Gaia-ESO Survey, derived from both the UVES spectra with resolving power R47,000 and spectral range 480.0680.0 nm, and the GIRAFFE HR15N spectra (R19,000), covering the wavelength range 647679 nm. Both types of spectra have been reduced and analysed by the Gaia-ESO consortium. The data reduction and analysis process have been described in several papers (Sacco et al. 2014; Smiljanic et al. 2014; Jackson et al. 2015; Lanzafame et al. 2015, see, e.g.); we recall here the main steps. The pipelines for data reduction, as well as radial and rotational velocity determinations, are run at INAF-Arcetri for UVES (Sacco et al. 2014) using the FLAMES-UVES ESO public pipeline, and at the Cambridge Astronomy Survey Unit (CASU) for GIRAFFE. The spectral analysis is shared among different working groups (WGs), to which spectra are assigned on the basis of the stellar-type, instrument, and setup. The data discussed in the present paper have been analysed by WG10, WG11, and WG12 which are in charge of the analysis of the UVES and GIRAFFE spectra of F-G-K (and M for WG12) stars both in the field of the Milky Way (MW) and in open clusters. The spectra in each WG are analysed with a strategy based on multiple pipelines, as described in Worley et al. (in preparation), Smiljanic et al. 2014 and Lanzafame et al. 2015 for WG10, WG11 and WG12, respectively. Finally, the results from the different WGs are homogenised using a database of calibrators, e.g., benchmark stars and open/globular clusters selected following the calibration strategy by Pancino et al. 2017 and adopted for the homogenisation by WG15 (Hourihane et al. in preparation). The recommended parameters and abundances are distributed in the idr6 catalogue, which includes those used in the present work: atmospheric stellar parameters , , and/or , the surface gravity index based on the ratios of high-gravity and low-gravity lines in the spectral region 675.0-678.0 nm and defined in Damiani et al. 2014, metallicity [Fe/H], lithium abundances (measurements or upper limits), radial velocities (RVs), and projected equatorial rotational velocities (vi).
The lithium abundance is measured from the doublet lines at 670.8 nm. At the resolution of GIRAFFE, this line is blended with the nearby FeI line at 670.74 nm, but the two components can be well separated in UVES. In idr6, the Li abundances from both UVES and Giraffe spectra were derived in a homogeneous way. Lithium equivalent widths (EWs) were measured by gaussian fitting of the lithium doublet components and the FeI line, and then converted into abundances using a set of ad hoc curves of growth (Franciosini et al., in prep.), specifically derived for the Gaia-ESO survey with a grid of synthetic spectra computed as in de Laverny et al. 2012 and Guiglion et al. 2016 and based on the MARCS model atmospheres in the following ranges: K, , [Fe/H] and A(Li). In the case of GIRAFFE, where only the total blended LiFe EW can be measured, the Li-only EW was first computed by applying a correction for the Fe blend, measured on the same synthetic spectra used to derive the curves of growth. When the line is not visible (or just barely visible), an upper limit to the EW, equal to the uncertainty, or to the measured EW if higher, is given.
The Gaia-ESO abundances are determined in the Local Thermodynamic Equilibrium (LTE) approximation. We estimate the typical effect on Li abundances introduced by the LTE approximation in 1D hydrostatic atmospheres following Wang et al. 2021, who compute a 3D NLTE Li grid spanning the parameter range for FGK-type dwarfs and giants. The 3D NLTE corrections can increase or decrease A(Li) by a few tenths of a dex in the typical ranges of parameters of our sample of giant stars. We compute them for the sample of stars for which all stellar parameters are available, using the code and grids provided by Wang et al. 2021. In Figs. 1 and 2, we show the effect of the correction (A(Li)3D-NLTE-A(Li)1D-LTE)) in the Kiel diagram, and as a function of for field stars and open clusters, respectively. For both samples the effect is within 0.1 dex, depending on , and almost negligible for MSTO stars and for giant stars hotter than 4200 K. In the next sections, we adopt the 1D LTE Gaia-ESO Li abundances, available also for stars for which log g has not been determined.


2.2 Sample selection
The present work analyses the Gaia-ESO idr6 sample of MS, sub-giant, and giant stars with available Li determination, focusing on the post-MS evolution of lithium surface abundances. The spectral ranges of the HR15N and U580 setups allow us to measure the Li doublet lines. In particular, the GIRAFFE setup HR15N is dedicated in Gaia-ESO to the study of stars in open clusters. However, since the target selection of member stars in clusters observed with GIRAFFE is unbiased and inclusive, many non-member contaminants, including in particular giant stars, are present in the Gaia-ESO database. The contamination by distant field giants is even more important in the field of view of the youngest star clusters, due to the similar colours and hence position in the Colour-Magnitude diagrams that were used for target selection. We take advantage of this favourable configuration to build a large sample of high-resolution spectra of field and cluster stars with Li measurements in a wide range of metallicity. We broadly define giant stars as those with K and (or , if is not available), then the remaining sample includes sub-giants (with K and , although the limits are difficult to determine precisely) and MS stars.
2.2.1 The open cluster sample
The Gaia-ESO idr6 contains 86 open clusters (Randich et al. 2018, 87 considering the two clusters in NGC2451A ans B,), including also calibration ones and those retrieved from the ESO archive. Our analysis considers 57 clusters (over 62) with age Myr hosting evolved giant stars in which lithium abundance is available, considering our constraints on stellar parameters and Li abundances. We excluded five clusters, in which no giant stars were observed or with a very poor membership (e.g. Loden 165). The histogram of the age distribution of the selected clusters, determined homogeneously by Cantat-Gaudin et al. 2020 is shown in Fig. 3. The cluster parameters are presented in Table 3, including: cluster name, age, distance, and galactocentric radius from CG20, mean radial velocity (RV) and [Fe/H] from the UVES members in Gaia-ESO idr6, MSTO mass derived from the Parsec isochrones that were used by CG20 for age determination (Bressan et al. 2012) and the selected isochrones.
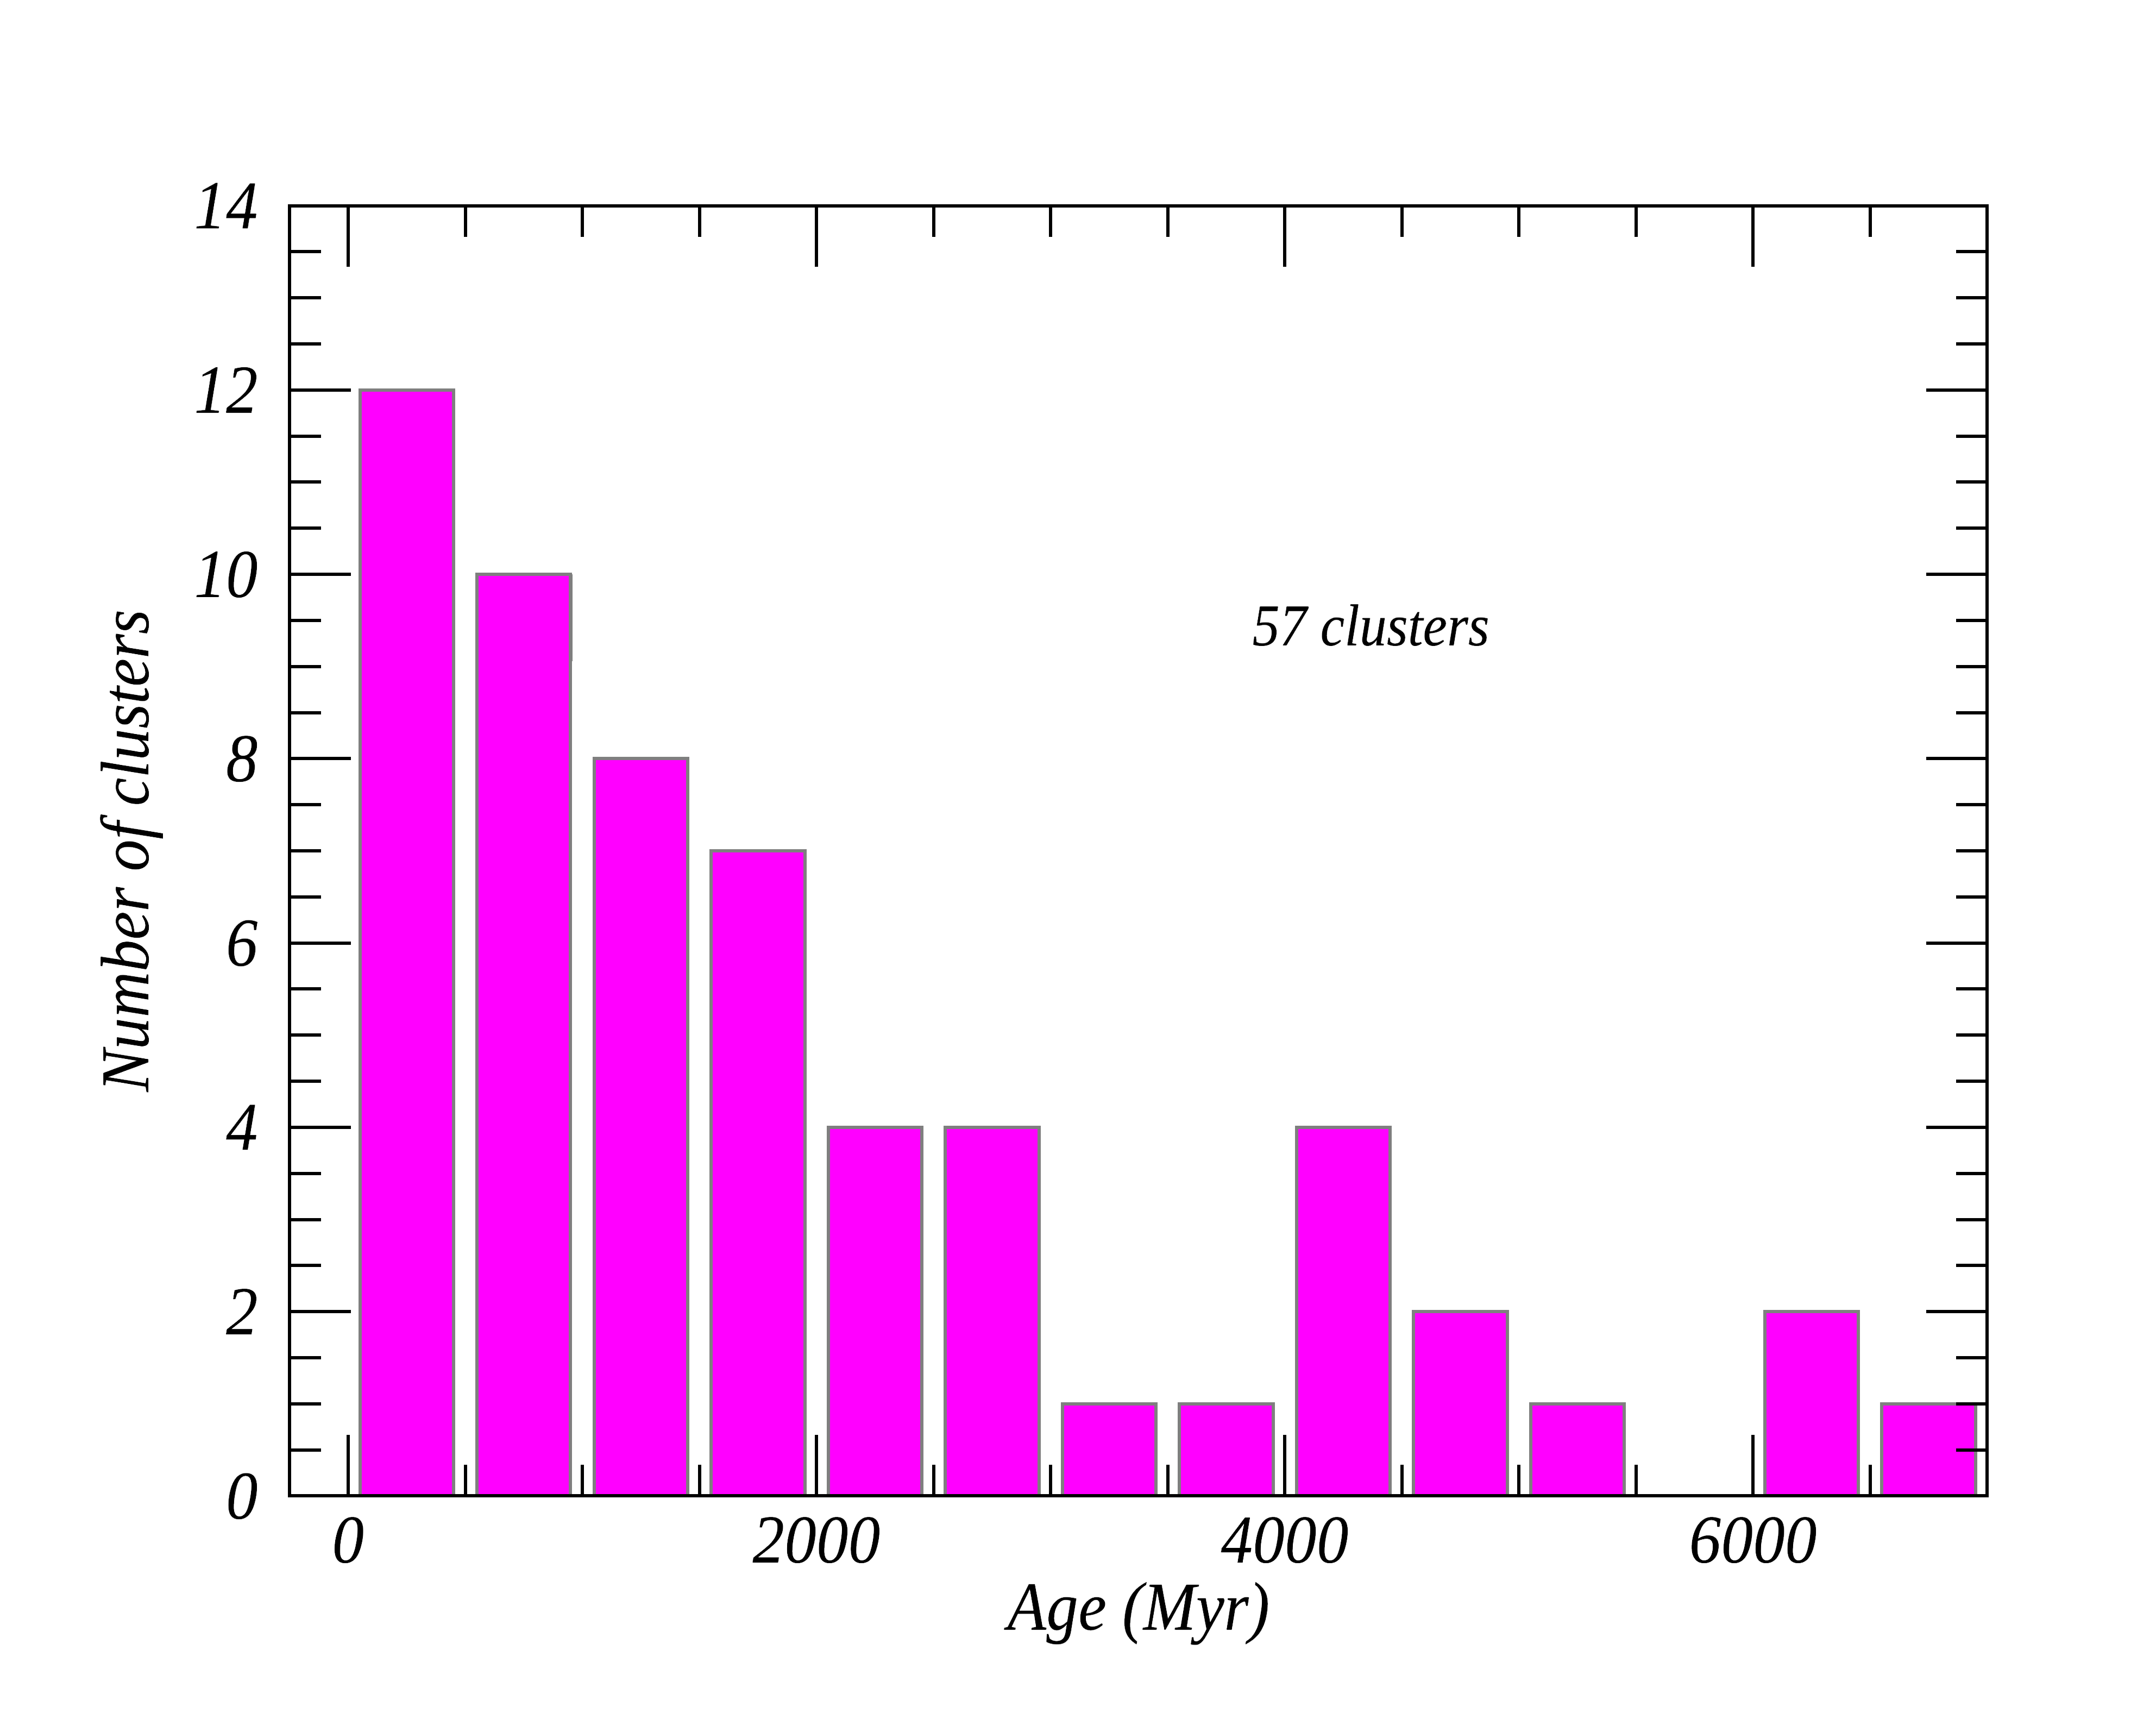
The ages of our sample clusters span from 120 Myr to about 7 Gyr. For the clusters containing more than 20 targets, the selection of member stars was done by performing a simultaneous fit of the Gaia-ESO RVs and of the parallaxes and proper motions from Gaia edr3 (Gaia Collaboration et al. 2021). To this aim, we extended the method described by Franciosini et al. 2018 and Roccatagliata et al. 2018, adding the RV as fourth (independent) parameter. For each cluster, the distribution was fitted with two multivariate Gaussians, one for the cluster and one for the field, taking measurement errors and the Gaia covariance matrix into account. When strong contamination from the field is present, we first discarded the objects located at more than 5- from a first-guess average centroid for the cluster parallax and proper motions. Gaia astrometry was used in the fit only if the Renormalised Unit Weight Error (RUWE), a statistical indicator of the quality of the data, is . An example of the fit is shown in Fig. 4 for the case of NGC 2158. We then computed a membership probability for each star in the usual way, i.e. dividing the cluster distribution by the total one, and selected as members the objects with . For the remaining clusters with less than 20 targets, to which the above method cannot be applied, we first derived the peak and standard deviation of the RV distribution, and selected stars within 2- of the peak. We then computed the average parallax and proper motion and the corresponding standard deviations for the selected stars, and we further excluded those differing more than 2- from the average values. We compared the present selection with the one of CG20, finding in general an excellent agreement. With our selection we can add some members among the fainter stars or in crowded fields for which CG20 do not provide a membership probability.
We made a further selection, based on the errors on the stellar parameters (error()100 K, error()0.2, error([Fe/H])0.15), and including only stars with measured lithium abundances with error on A(Li) lower than 0.25 dex or upper limits. We relaxed the selection on the error on A(Li) for Li-rich giant stars, defined, as in Casey et al. 2016 and Smiljanic et al. 2018, as stars with 3800 K5000 K, – or 0.98 and log(L/L⊙)1 dex for star selected as giants based on their index – and A(Li)2.0 dex, for which we do not apply any error cut. The Hertzsprung-Russell diagram (hereafter HRD) and the Kiel () diagram of the selected members of open clusters are displayed in Fig. 5. The final number of considered cluster members is 4212 (see Table 1), of which about 18% are giant stars. The stellar parameters, A(Li) (measurements and upper limits) and MSTO masses for the adopted sample of cluster stars are given in Table 4.

2.2.2 The field star sample
For the sample of field stars, we select stars in two different ways, depending on the WG that analysed them. The first selection allows us to identify the observed field stars as non-members of young clusters with age120 Myr, which are analysed by WG12. To select them, we inverted the selection applied by Bravi et al. 2018, keeping stars with K and either , for those observed with GIRAFFE, or for those observed with UVES. For 4800 K5400 K we selected stars with , while for stars with 4800 K we adopted the selection to avoid contamination by the coolest MS and PMS stars. The selections in the versus and versus diagrams are illustrated in the top and bottom panels of Fig. 6, respectively. In the figure, we also indicate the Li-rich red giant stars with A(Li)2.0 dex.

The second selection criterion allows us to pick: i) field stars which are non-members of the old and intermediate-age open clusters (age120 Myr): in this selection, we take into account all stars not selected as cluster members on the basis of their radial velocities, proper motions, and parallaxes; and ii) the stars observed in the Gaia-ESO field samples, by selecting the GES_FLD keywords related to the field stars (GES_MW for general Milky Way fields, GES_MW_BL for fields in the direction of the Galactic bulge, GES_K2 for stars observed in Kepler2 (K2) fields, GES_CR for stars observed in CoRoT fields). We combined the two samples of field stars, performing a further selection on stellar parameter uncertainties as done for the sample of stars in open clusters. The results of the selection are shown in Fig. 7, where Li-rich giant stars are also indicated.
| Sample | Stars with A(Li) | Detections |
|---|---|---|
| Gaia-ESO idr6 | 38090 | 27256 |
| Gaia-ESO idr6 + Gaia dr3 | 37940 | 27142 |
| Field stars | 7369 | 3866 |
| Cluster members | 4212 | 3497 |

To improve the quality of the sample, we cross-matched our catalogue with Gaia edr3 and selected only stars for which the parallaxes have uncertainties within 10%. For them, we computed the stellar luminosity using the geometric distances from Bailer-Jones et al. 2020 and the Gaia edr3 magnitudes, converted into V magnitudes using the and colours. We computed the bolometric magnitudes using the bolometric corrections BC(K), based on the VK colours22 2 K magnitudes are obtained from the 2MASS catalog (Skrutskie et al. 2006), from the tables provided by Alonso et al. 1999 for dwarf and giant stars. We used bolometric corrections based on colour instead of more recent calibrations, as the one of Casagrande & VandenBerg 2018, based on stellar parameters, in order to provide corrections independent of stellar parameters, which can have considerably large uncertainties, especially for the GIRAFFE spectra, since the spectral range of HR15N is not optimised to derive precise atmospheric parameters, and to be able to apply them also to stars for which we have instead of . We adopted the reddening values from the 3D extinction map of Green et al. 2019, extracting E(B-V) in the line-of-sight and at the distance of each star, when available, and from the 2D extinction map of Schlegel et al. 1998 in the remaining cases. As expected, E(B-V) from Schlegel et al. 1998 is typically larger than E(B-V) from Green et al. 2019, the latter being integrated over larger distances. We take as an estimate of E(B-V) the minimum of the two values, which is equivalent to using Green et al. 2019 when it is available, and exclude stars with E(B-V)1. For Li-rich giant stars, we relaxed the selection on parallax, removing the cuts on the parallax relative error, to avoid losing some of them. The final sample for which we have high-quality luminosities from Gaia, with error on lower than 0.15 dex, contains 7368 stars, of which about 56% are giant stars (see Table 1). The stellar parameters (including ), A(Li) (measurements and upper limits) and masses for the adopted sample of field stars are given in Table 5.
The histogram of the distribution of [Fe/H] for the field stars is shown in Fig 8. The peak of the metallicity distribution function (MDF) is at [Fe/H], with a tail of lower metallicity stars down to [Fe/H], and of higher metallicity stars reaching [Fe/H]. In the insert of Fig 8 we highlight the low metallicity tail of the MDF: there are some stars with [Fe/H] and a few ones below [Fe/H].

3 Comparison with other catalogues

Gaia-ESO idr6 has 676 stars in common with GALAH dr3 (Buder et al. 2020) with available Li abundances in both surveys. These stars belong to several different groups (not all being part of the selection discussed in the present paper): the open clusters Ori, 25 Ori and Cha I, NGC 2243, NGC 2516, IC 4665, M 67, NGC 6253, Rup 147, Rup 7, Trumpler 20, the globular clusters NGC 362 and NGC 104, several Milky Way field stars (mainly turn-off stars), and stars in the CoRoT and K2 fields. Among the sample of stars in common, we select a sub-sample of 135 stars, with high quality A(Li) in both surveys: for Gaia-ESO we take only Li measurements with error lower than 0.25 dex and for which we can compute NLTE corrections following Wang et al. 2021 for a meaningful comparison with GALAH NLTE Li abundances; from GALAH we consider Li abundances with flag_sp=0 and flag_li_fe=0 (quality flags that indicate the good quality of the spectral analysis and of the A(Li) determination, respectively), and error lower than 0.25 dex. We recall that not all of the 135 stars are used in the present work, but they are included here for a general comparison between the two surveys. The comparison is shown in Fig. 9, with the abundances colour-coded by the Gaia-ESO uncertainties. The lithium abundances in the two surveys agree very well. There is some scatter in the comparison, but in most cases the agreement between Gaia-ESO and GALAH is within 0.25 dex.
We also compare stars in common between Gaia-ESO idr6, to which we apply the NLTE corrections from Wang et al. 2021, and the AMBRE sample of Guiglion et al. 2016, considering the Li abundances corrected by NLTE effects (Lind et al. 2009) available in Guiglion et al. 2016. The agreement is quite good, with a small offset towards higher A(Li) in the Guiglion et al. 2016 sample.
4 Post-MS lithium evolution: comparison with stellar model predictions
The results of the recent studies using Gaia and large spectroscopic surveys (Deepak & Reddy 2019; Deepak et al. 2020; Charbonnel et al. 2020; Kumar & Reddy 2020; Yan et al. 2021, e.g.) have been instructive for the understanding of the Li post-MS evolution. With the present work, we provide additional information for a better understanding of the macroscopic magnetic hydrodynamic (MHD) transport processes acting along the evolution of low- and intermediate-mass stars at different metallicities. With the Gaia-ESO results, we can indeed expand the analysis to a larger sample of stars in different metallicity ranges, thus investigating the Li evolution from the MSTO to the RGB sequence in different conditions. In particular, the combination of field stars and of members of open clusters allow us to cover a larger range of stellar masses, from the lowest masses in the field and in the old clusters, to the highest masses in the young open clusters.
In the following sections, we compare our results with a set of stellar models from Lagarde et al. 2012. The models are computed with the stellar-evolution code STAREVOL (v3.00). The mechanisms included for the transport of chemicals are: i) the standard mechanism due to convection; ii) the thermohaline double-diffusive instability (so-called thermohaline mixing) that is expected to develop in low-mass stars along the RGB at the luminosity bump and in intermediate-mass stars on the early-AGB; it takes place when, in the external part of the hydrogen-burning shell around the degenerate stellar core, there is an inversion in the mean molecular weight gradient in a thermalised medium (Charbonnel & Zahn 2007; Charbonnel & Lagarde 2010); iii) rotation-induced mixing “ à la Zahn” with the vertical and horizontal turbulent coefficients from Talon & Zahn 1997 and Zahn 1992 respectively, computed considering, at the zero-age MS (ZAMS), a rotational velocity equal to 30% of the critical one, which means typical velocities on the MS between 90 and 137 km s-1. In our comparison, we consider both the classical models, in which only mixing due to convection is applied, and the models in which the effect of rotation-induced mixing and thermohaline mixing are included. We recall that these kinds of models are also crucial to explain the behaviour of Li abundance during MS. Among the various considered additional mechanisms, both rotation (Sestito & Randich 2005, see) and overshooting mixing (Christensen-Dalsgaard et al. 2011; Zhang 2012) have been introduced to reproduce the observational properties of the clusters and at the same time the properties of the Sun. However, for low mass solar-type stars with relatively extended convective envelopes, hydrodynamic processes induced by rotation, as, for instance, meridional circulation and shear mixing, predict large rotation gradients within the interior, needing, e.g., internal gravity waves or other mechanisms, as penetrative convection, tachocline mixing, and additional turbulence, to explain both the rotation profile and the surface abundance of lithium in solar-type stars of various ages (Talon & Charbonnel 2005; Dumont et al. 2021, see).
4.1 Li evolution in field stars
Since stellar masses play a fundamental role also during the post-main sequence evolution, we estimate them to compare with the appropriate theoretical models from Lagarde et al. 2012. Masses of field stars are computed using a maximum-likelihood technique described in Charbonnel et al. 2020, and adapted from Valle et al. 2014, comparing , luminosity, and [Fe/H] of individual stars to the theoretical evolutionary tracks of Lagarde et al. 2012. The errors on the three parameters are taken into account to estimate the uncertainty on the stellar mass. In Fig. 10 we show the HR diagram of our sample of giant and sub-giant field stars (see Section 2.2 for a definition), divided in four metallicity bins, and overlaid on the corresponding evolutionary tracks from Lagarde et al. 2012. Most of our stars are located in the ascending and upper parts of the RGB and in the clump.

In Fig. 11, we show the evolution of A(Li) as a function of the effective temperature in three mass bins: , , and . Each mass bin is further divided in the four metallicity bins: [Fe/H], [Fe/H], [Fe/H], and [Fe/H]. In the panels, we show both sub-giant and giant stars. When available in our samples, we include also MSTO stars (at the corresponding mass and metallicity) with K which might have preserved their initial Li as expected in the classical models. We compare the observations with the theoretical predictions of the models of Lagarde et al. 2012 (classical and with thermohaline and rotation-induced mixings).
We see in Fig. 11 that the Li surface evolution predicted by classical models is very similar for stars of different masses and metallicities. In that case, the surface Li depletion is only due to the FDU, which starts at around 5600 K. Since for low-mass stars the maximum depth reached by the base of the convective envelope during the FDU is almost independent of the stellar mass, A(Li) reaches similar values for all models of same metallicity: A(Li) dex at solar metallicity, and A(Li) dex for the sub-solar models at [Fe/H]. These values are in agreement with previous theoretical studies (Iben 1967, starting e.g. with the early work of). After the end of the FDU (around 5000 to 4500 K, depending on the mass and metallicity), the convective envelope withdraws in mass, and no more surface Li depletion is expected.
As already mentioned in the introduction (see references to previous studies in Sect. 1), and as evidenced in Fig. 11, these classical predictions do not reproduce the observed Li behaviour. Indeed, for the masses and metallicities explored here, Li depletion starts earlier (i.e., at higher ) on the subgiant branch than predicted by the classical models, and is more efficient. Additionally, the second depletion episode that occurs in stars with masses below after the so-called RGB luminosity bump (at 4200 K, i.e., when the H-burning shell has passed the chemical discontinuity left behind by the FDU) is not predicted either by the classical stellar evolution theory.
The Li data for field stars presented in Fig. 11 thus confirm the need of including in stellar evolution models rotation-induced mixing over the entire mass and metallicity range considered, as well as thermohaline mixing in low-mass stars that pass through the RGB bump before igniting He in their degenerate core at the tip of the RGB. On one hand, rotation-induced mixing changes the abundances profile in the stellar interiors already during the main sequence, enlarging the size of the Li-free region. As a consequence, compared to classical predictions, surface Li depletion starts earlier (i.e., at higher ), and lower Li abundances are predicted after the end of the FDU (Palacios et al. 2003; Charbonnel et al. 2020).
Figure 11 clearly shows that rotating models reproduce the Li abundance from the MSTO on, whatever the mass and metallicity ranges. On the other hand, the introduction in the models of the thermohaline double diffusive instability as proposed by Charbonnel & Zahn 2007 reconciles the theoretical predictions with the Li data in the brightest and coolest RGB stars. Indeed, when these low-mass evolved stars pass the RGB bump, this instability develops between the base of the convective envelope and the Li-burning regions, because of the mean molecular weight inversion resulting from the 3He(3He, 2p)4He reaction in the Hydrogen burning shell.
As already shown with other samples from the literature (Charbonnel & Zahn 2007; Charbonnel & Lagarde 2010; Lagarde et al. 2015; Charbonnel et al. 2020), this explains the second drop of the surface Li abundance highlighted by the Gaia-ESO field star data shown in Fig. 11. Inside stars more massive than , however, the thermohaline instability does not set in because they do not pass through the RGB bump, as they ignite central helium-burning earlier in non-degenerate conditions. For this mass range (panels in the right column of Fig. 11) the lowest Li abundances observed are well explained by rotation alone, as discussed before.
Last but not least, we see in Fig. 11 that there is a conspicuous number of giant stars with an anomalously high A(Li) with respect to the general trend discussed above. Some of them, from the previous Gaia-ESO data releases, have been studied in detail by Casey et al. 2016 and Smiljanic et al. 2018. We discuss them in Sect. 5.

4.2 Li evolution in open clusters
Lithium abundances in open clusters provide an effective way to probe mixing processes in stars of different masses and metallicity, following them along the different evolutionary sequences. Since the ages of open clusters can be derived with good accuracy from the isochrone fitting of their whole evolutionary sequence, we can estimate the masses of their evolved stars by assuming them to be those of the MSTO stars. Moreover, high-resolution spectra provide a detailed chemical composition for the cluster, which has usually a high level of homogeneity (De Silva et al. 2006; Carrera & Martínez-Vázquez 2013; Bovy 2016; Liu et al. 2016, see, e.g.).
In this way, stars in open clusters might effectively serve to study the changes in Li abundance during post-MS evolution, in samples with similar masses and metallicity. Several works have been dedicated to the study of the evolution of Li abundance along specific parts of the colour-magnitude diagrams (CMD) of open clusters. Some works (Randich et al. 2002; Randich et al. 2007; Smiljanic et al. 2010; Canto Martins et al. 2011; Pace et al. 2012; Anthony-Twarog et al. 2018; Deliyannis et al. 2019) studied Li abundance in MS, sub-giant stars, and RGB stars in several open clusters, finding that non-standard mixing processes are needed to explain the observed trends. Other papers focused on Li in RGB stars and on the occurrence of Li-rich giants in open clusters (Anthony-Twarog et al. 2013; Monaco et al. 2014; Delgado Mena et al. 2016; Krolikowski et al. 2016; Aguilera-Gómez et al. 2016; Carlberg et al. 2015; Carlberg et al. 2016, see e.g.).
In this work, we present a large sample of stars, members of 57 open clusters, with 0.12 Gyrages 7 Gyr, spanning from the inner disc to the outer Galaxy, with RGC in the range 6–20 kpc, and with metallicities 0.44 dex[Fe/H] dex.
In Figs. 12 and 13 we plot A(Li) versus for the 34 clusters of our sample in which A(Li) was measured in, at least, six giant stars. When possible, for clusters with ages between 120 and 2000 Myr we indicate the initial A(Li) that we derive from the analysis of upper MS stars located on the blue side of the so-called Li dip, following the methodology described in Randich et al. 2020. For NGC 2420 and NGC 2243, given their ages, stars on the blue side of the dip are located at the upper TO (François et al. 2013, see also). Since they may have started to experience some post-MS Li dilution, the measured Li is possibly a lower limit to their initial value. We compare the observations with the evolutionary tracks from the models of Lagarde et al. 2012, as for the field stars. For each cluster we select the most appropriate model in terms of stellar mass, using the MSTO masses in Table 3. We adopt models at solar metallicity for all clusters, since the cluster [Fe/H] are closer to the solar ones than to the next metallicity in the grid of Lagarde et al. 2012.


In Fig. 12, for the youngest cluster NGC 6067 (age=130 Myr), the RGB stars reach A(Li)1 dex, in between the tracks of the classical model and the model with rotation at 4 (these models have been scaled of dex in A(Li) to match the initial Li of the cluster). In slightly older clusters with 190 Myrage400 Myr, namely NGC 6259, NGC 6705 and NGC 3532, the lithium in RGB stars reaches A(Li)1–1.2 dex, following the track of 3 , in between the classical ones and those with rotation. For the clusters in Fig. 12 with age in the range 400 Myrage1400 Myr, from NGC 6802 to NGC 6005, in the RGB stars A(Li) settles between 0 dex and 1 dex. These clusters are compared with tracks of 2 stars, where the effects of both rotation-induced mixing and thermohaline instability are required to reproduce the decline of A(Li) with decreasing . Clusters ages in the interval 1400 Myrage6800 Myr are compared with tracks for 1.5 stars (starting from NGC 4437 in Fig. 12 to Berkeley 36 in Fig. 13). For all these clusters, the data are also better reproduced by the models including the effects of rotation-induced mixing and thermohaline instability. Starting from clusters with age1500 Myr (NGC 2158), A(Li) in RGB stars reaches lower values, down to A(Li) dex, due to the increasing efficiency of the thermohaline instability. However for the lowest-mass range, corresponding to ages 4000 Myr, the comparison should be taken with caution. Indeed in the Lagarde et al. 2012 models the transport of angular momentum is driven by meridional circulation and turbulence only, while an additional transport is required to explain the internal rotation profile of low-mass stars, both on the MS (see references in Dumont et al. 2021, for the case of the Sun and solar-type stars) and along the red giant branch (e.g. Eggenberger et al. 2019, and references therein). For this reason, for the oldest clusters we compare the observations with the model for 1.5 .
In Fig. 14, we compare the predictions of the stellar evolutionary models with the cluster data, binned by age. This allows us to re-introduce the cluster member stars that were not included in Figs. 12 and 13 because these clusters are too sparsely populated, and to have statistically significant samples in each age bin. We reach the same conclusions as in Sect. 4.1. In the highest mass regime, corresponding to 120age400 Myr, the most important effect is rotation, which produces earlier and larger Li depletion than predicted by the classical model. In the clusters with 400 Myrage1200 Myr, the rotation-induced mixing is needed to explain the behaviour of the lithium surface abundance in subgiant and giant stars, while, as the age increases (hence the stellar mass decreases), the effect of the thermohaline mixing starts to play a role and can explain, together with the rotation-induced mixing, the further decrease in A(Li) for ages1200 Myr. This effect is even stronger at ages4000 Myr.

5 Lithium-rich giant stars
In this section we discuss Li-rich giant stars found both in open clusters and in the field. We recall the adopted definition of Li-rich giants: A(Li)2.0 dex, 3800 K5000 K, 3.5 or 1 dex and 0.98. While red giant stars should have usually a lower Li surface abundance than in the previous evolutionary phases (see, however, Kumar et al. 2020, and Magrini et al. (in prep.)), some of them present a clear Li overabundance with respect to the bulk. A number of possible processes have been considered in the literature to explain the Li enrichment in these rare stars. Some works call for Li production thanks to deep internal transport processes (Sackmann & Boothroyd 1999; Palacios et al. 2001; Cassisi et al. 2016, e.g.). The Li enrichment has been also attributed to possible external pollution, such as planet engulfment or pollution by a binary companion (Holanda et al. 2020, see, for instance, the case of Li-rich K giant) or to magnetic activity (Gonçalves et al. 2020). The ingestion of a planet or a companion brown dwarf can indeed contribute to increase the angular momentum of the system, producing additional Li (Alexander 1967; Siess & Livio 1999; Denissenkov & Weiss 2000; Carlberg et al. 2010; Aguilera-Gómez et al. 2016; Delgado Mena et al. 2016, see, e.g.). The possible effects include an increase in the Li surface abundance, a change in the global metallicity and in rotational velocity (Casey et al. 2016, see, e.g.). Recently, several works show pollution of Be and Li in white dwarfs, likely due to accretion of icy exomoons that formed around giant exoplanets or of other rocky bodies in exoplanetary systems (Klein et al. 2021; Doyle et al. 2021; Kaiser et al. 2021). Other works, as Jorissen et al. 2020, found that the binary frequency appears normal among the Li-rich giants, excluding a causal relationship between Li enrichment and binarity.
5.1 Lithium-rich giant stars and their evolutionary status
The recent discovery of large samples of Li-rich giants indicates that they are not restricted just to the luminosity bump on the RGB for the low-mass stars, or its equivalent on the early-AGB for intermediate mass stars that ignite central He burning in non-degenerate conditions (Charbonnel & Balachandran 2000), but they are also found along the RGB and in the red clump (Alcalá et al. 2011; Kumar et al. 2011; Lebzelter et al. 2012; Carlberg et al. 2016; Smiljanic et al. 2018; Deepak & Reddy 2019; Charbonnel et al. 2020; Kumar & Reddy 2020; Martell et al. 2020; Yan et al. 2021, see, e.g). The works of Kumar & Reddy 2020; Yan et al. 2021; Singh et al. 2021; Deepak & Lambert 2021, combining the results from asteroseismic and spectroscopic surveys, suggested that a high fraction of the Li-rich giants belong to the red clump central He-burning phase, confirming a previous idea presented by Kumar et al. 2011. Similar results were obtained by Casey et al. 2019 where 80% of their sample stars have likely helium-burning cores.
About 2% of our giant stars in the field are Li-rich stars (considering as a reference sample giants in the same temperature range of the Li-rich ones), while the percentage of Li-rich stars in open clusters is lower, 0.5%. These numbers agree with those found in several other surveys, which have reported the discovery of Li-rich giants in proportion of 1–2% of their total sample (Brown et al. 1989; Charbonnel & Balachandran 2000; Lèbre et al. 2006b; Kumar et al. 2011; Casey et al. 2016; Smiljanic et al. 2018; Deepak & Reddy 2019; Charbonnel et al. 2020, see, e.g.).
In the field sample, we find 71 Li-rich giant stars, selected both with the criterion based on the gravity index (21 stars) and with the surface gravity (50 stars). They are listed in Table 2, where we present their properties: their CNAME, GES field, SETUP, the stellar parameters, vi, A(Li) measured in the present work, and detection in previous works. Among the 50 stars selected through their , we recovered 35 of the 40 Li-rich giants presented in Casey et al. 2016 and Smiljanic et al. 2018. The remaining 5 stars have A(Li) slightly below 2.0 dex in idr6, and thus they do not appear in our list of Li-rich giants with A(Li)2.0 dex. The sample contains stars in the direction of the Bulge, 23 stars in the Corot fields (3 new discoveries) and one in the Kepler2 field, and stars in the field of several open clusters, but non-members.
In Fig. 15 we show their location in the Kiel diagram, displaying only those with available . In our data, there is no immediate correspondence of Li-rich stars with the position of the red clump, but instead we see a distribution around three main locations: the red giant branch luminosity bump, the core He-burning stages, or the early-asymptotic giant branch, as discussed for a sub-sample of these stars in Smiljanic et al. 2018. As discussed by these authors, one of the CoRoT target, 101167637 (CNAME=19265193+0044004) is a confirmed He-core burning clump giant. Their full characterisation with asteroseismology would thus be necessary to reliably determine the evolutionary status of each Li-rich star.

The three Li-rich giants detected as members of open clusters are listed in Table 3, in which we give their properties: CNAME, the host cluster, the setup used to measure A(Li), stellar parameters, vi, and A(Li), and are shown in Fig. 15 with a different symbol. They belong to Trumpler 5, Berkeley 21, and NGC 2158. The star in Trumpler 5 was first identified by Monaco et al. 2014 who attributed the Li enrichment to internal production, occurred at the red clump or in the immediately preceding phases. The star in Berkeley 21 was discovered by Hill & Pasquini 1999, who measured its high Li content, relating it to internal processes, but not discarding the possibility of an accretion from external sources. The Li-rich giant in NGC 2158 is, to our knowledge, a new detection. Two of the three Li-rich stars are located close to the RC, and one of them at the beginning of the RGB luminosity bump. They do not have an enhanced rotational velocity, as would be expected if the Li-enrichment were related, e.g., to planet engulfment (see, e.g. Privitera et al. 2016, and the discussion in Sec 5.2).
| CNAME | Field | SETUP | log g | [Fe/H] | vi | A(Li) | Other detection | |
|---|---|---|---|---|---|---|---|---|
| 06490710-2359450 | Be75 (non member) | HR15N | 499360 | 2.90.2 | -0.290.05 | 7.0 | 2.190.08 | – |
| 18182698-3242584 | Bulge | U580 | 434030 | 2.060.06 | 0.060.05 | 9.0 | 3.680.05 | Smiljanic et al. 2018 |
| 18181062-3246291 | Bulge | U580 | 458030 | 2.370.05 | 0.060.05 | 8.0 | 2.010.05 | Smiljanic et al. 2018 |
| 18033785-3009201 | Bulge | U580 | 448030 | 2.480.05 | 0.130.05 | 8.0 | 3.610.04 | Smiljanic et al. 2018 |
| CNAME | Clusters | SETUP | log g | [Fe/H] | vi | A(Li) | Other detection | |
|---|---|---|---|---|---|---|---|---|
| 06364020+0929478 | Trumpler5 | U580 | 496030 | 2.500.05 | -0.370.04 | 7.0 | 4.080.05 | Monaco et al. 2014 |
| 05514200+2148497 | Be21 | U580 | 452030 | 2.250.05 | -0.180.04 | 7.0 | 3.010.06 | Hill & Pasquini 1999 |
| 06072443+2400524 | NGC2158 | HR15N | 494060 | 2.80.2 | -0.170.06 | 7.0 | 2.700.09 | – |
5.2 Li abundance and rotational velocity
The relation between rotation and lithium abundance in evolved stars is not yet completely established (Wallerstein et al. 1994; de Medeiros et al. 1997; De Medeiros et al. 2000; de Laverny et al. 2003; Mallik et al. 2003, see, e.g.). As discussed in Smiljanic et al. 2018, fast rotation during the giant phase cannot be explained by single star evolution and might be related to planet engulfment (Alexander 1967; Carlberg et al. 2009; Carlberg et al. 2010; Casey et al. 2016; Privitera et al. 2016; Anthony-Twarog et al. 2020). Following Privitera et al. 2016, the planet engulfment might have an important effect of the Li abundances, even for a limited portion of the giant life. However, the effect is difficult to disentangle from other processes that can modify the Li abundance, since Li is a fragile element, easily destroyed, and subject to other mechanisms of production during the red giant phase. Delgado Mena et al. 2016 looked for Li-rich giants in a sample of clusters where planets have been searched, deriving A(Li) abundances in 12 open clusters. They studied the relationship between vi and A(Li), finding that the giant stars with higher A(Li) have higher rotation velocities than the Li-depleted stars. However, they found also that the relation might reflect the different evolutionary status of their sample stars, with the hottest stars having higher rotation rates.
For our sample of giant stars, both in field and in clusters, we seek possible correlations between A(Li) and the projected rotational velocities. In a conservative way, we consider fast-rotating giant stars those with vi 10 km s-1. In our sample, the instrumental limit prevents us to measure vi7 km s-1, thus for them we can provide only an upper limit. The results are shown in Fig. 16, where we plot A(Li) as a function of the projected rotational velocity for giants with 3800 K5000 K and 3.5, both Li-rich (A(Li)2) and normal ones. The samples of giant stars observed by De Medeiros et al. 2000 and by Delgado Mena et al. 2016 are over-plotted for comparison. We notice a trend of increasing A(Li) with increasing vi. However, for 10 km svi30 km s-1 we observe both stars with A(Li) above and below 2.0 dex. Many Li-rich stars have low vi, including the three Li-rich stars in open clusters, indicating that the preferential way to produce Li enrichment in giant stars is related to some specific phases of stellar evolution, as shown in Fig. 15, and that the correlation with the projected rotational velocity indicates that lithium enrichment by engulfment is an occasional effect.

6 Summary and conclusions
We exploit a sample of giant stars with Li measurements in Gaia-ESO idr6 to investigate the evolution of A(Li) from the MSTO to the giant phase. We combine the Gaia-ESO data with Gaia edr3 to obtain the distances and stellar luminosities. We compare our lithium abundances with literature values, finding a good agreement.
We select MS, sub-giant, and giant stars which are member stars of open clusters and field stars. We study the general trends of lithium abundances after the MS. Since stellar masses play a fundamental role during the post-main sequence evolution, we select samples of stars with reliable measurements of stellar masses: member stars of open clusters (age120 Myr) and field stars with masses derived from isochrone fitting. Our data probe, with a homogeneous analysis, lithium abundances and stellar parameters for stars having a wide range of stellar masses, covered thanks to the sample of young and intermediate-age open clusters (with TO masses from 1.1 to 4.5 ) not usually available in surveys that account only for field stars.
We compare our results with the set of stellar models of Lagarde et al. 2012, in which the effect of rotation-induced mixing and thermohaline instability are included. The comparison between our data and model results confirm the strong impact of the rotation-induced mixing, already in massive stars. The lower mass giant stars, both in clusters and in the field, provide also support to the necessity of a mixing process in advanced phases of stellar evolution, which might be thermohaline mixing. We confirm the agreement between data and models with rotation-induced and thermohaline mixing in the whole mass and metallicity ranges.
We discuss the properties of our Li-rich sample of stars, including both field stars and a few members of open clusters. They are distributed around three main locations in the Kiel diagram: the red giant branch luminosity bump, the core-He burning stages, or the early-asymptotic giant branch. Their full characterisation with asteroseismology would be necessary to establish a unique link with the evolutionary status of each stars. Finally, we investigate possible effects of the residual stellar rotation, after the MS, during the giant phase. We find few stars with vi10 km s-1, and their Li abundance is in line with the other stars in the same evolutionary state. We do not find any conclusive correlation between Li-rich stars and projected rotational velocity.
Acknowledgements.
We thank the referee for her/his careful reading of the paper, and for comments, which improved the quality of the work and its presentation. Based on data products from observations made with ESO Telescopes at the La Silla Paranal Observatory under programme ID 188.B-3002. These data products have been processed by the Cambridge Astronomy Survey Unit (CASU) at the Institute of Astronomy, University of Cambridge, and by the FLAMES/UVES reduction team at INAF/Osservatorio Astrofisico di Arcetri. These data have been obtained from the Gaia-ESO Survey Data Archive, prepared and hosted by the Wide Field Astronomy Unit, Institute for Astronomy, University of Edinburgh, which is funded by the UK Science and Technology Facilities Council. This work was partly supported by the European Union FP7 programme through ERC grant number 320360 and by the Leverhulme Trust through grant RPG-2012-541. We acknowledge the support from INAF and Ministero dell’ Istruzione, dell’ Università’ e della Ricerca (MIUR) in the form of the grant ”Premiale VLT 2012”. The results presented here benefit from discussions held during the Gaia-ESO workshops and conferences supported by the ESF (European Science Foundation) through the GREAT Research Network Programme. LM, GC, SR, MVdS acknowledge the funding from MIUR Premiale 2016: MITiC. MVdS, LM and AV thank the WEAVE-Italia consortium. LM acknowledge the funding from the INAF PRIN-SKA 2017 program 1.05.01.88.04. NL acknowledges the ”Programme National de Physique Stellaire” (PNPS) and the ”Programme National Cosmology et Galaxies (PNCG)” of CNRS/INSU co-funded by CEA and CNES. CVV and LM thank the COST Action CA18104: MW-Gaia. LS acknowledges financial support from the Australian Research Council (discovery Project 170100521) and from the Australian Research Council Centre of Excellence for All Sky Astrophysics in 3 Dimensions (ASTRO 3D), through project number CE170100013. TB acknowledges financial support by grant No. 2018-04857 from the Swedish Research Council. EDM acknowledges the support from Fundação para a Ciência e a Tecnologia (FCT) through the research grants UIDB/04434/2020 and UIDP/04434/2020 and by the Investigador FCT contract IF/00849/2015. FJE acknowledges financial support from the Spanish MINECO/FEDER through the grant AYA2017-84089 and MDM-2017-0737 at Centro de Astrobiología (CSIC-INTA), Unidad de Excelencia María de Maeztu, and from the European Union’s Horizon 2020 research and innovation programme under Grant Agreement no. 824064 through the ESCAPE - The European Science Cluster of Astronomy & Particle Physics ESFRI Research Infrastructures project. ASB acknowledges the financial support of the STFC. E.D.M. acknowledges the support from Fundação para a Ciência e a Tecnologia (FCT) through national funds and from FEDER through COMPETE2020 by the grant UIDB/04434/2020 & UIDP/04434/2020 and by the Investigador FCT contract IF/00849/2015.References
- Aguilera-Gómez et al. (2016) Aguilera-Gómez, C., Chanamé, J., Pinsonneault, M. H., & Carlberg, J. K. 2016, ApJ, 833, L24
- Alcalá et al. (2011) Alcalá, J. M., Biazzo, K., Covino, E., Frasca, A., & Bedin, L. R. 2011, A&A, 531, L12
- Alexander (1967) Alexander, J. B. 1967, The Observatory, 87, 238
- Alonso et al. (1999) Alonso, A., Arribas, S., & Martínez-Roger, C. 1999, A&AS, 140, 261
- Angelou et al. (2015) Angelou, G. C., D’Orazi, V., Constantino, T. N., et al. 2015, MNRAS, 450, 2423
- Anthony-Twarog et al. (2018) Anthony-Twarog, B. J., Deliyannis, C. P., Harmer, D., et al. 2018, AJ, 156, 37
- Anthony-Twarog et al. (2013) Anthony-Twarog, B. J., Deliyannis, C. P., Rich, E., & Twarog, B. A. 2013, ApJ, 767, L19
- Anthony-Twarog et al. (2020) Anthony-Twarog, B. J., Deliyannis, C. P., & Twarog, B. A. 2020, AJ, 160, 75
- Anthony-Twarog et al. (2009) Anthony-Twarog, B. J., Deliyannis, C. P., Twarog, B. A., Croxall, K. V., & Cummings, J. D. 2009, AJ, 138, 1171
- Asplund et al. (2009) Asplund, M., Grevesse, N., Sauval, A. J., & Scott, P. 2009, ARA&A, 47, 481
- Bailer-Jones et al. (2020) Bailer-Jones, C. A. L., Rybizki, J., Fouesneau, M., Demleitner, M., & Andrae, R. 2020, arXiv e-prints, arXiv:2012.05220
- Balachandran (1990) Balachandran, S. 1990, ApJ, 354, 310
- Balachandran (1995) Balachandran, S. 1995, Mem. Soc. Astron. Italiana, 66, 387
- Baraffe et al. (2017) Baraffe, I., Pratt, J., Goffrey, T., et al. 2017, ApJ, 845, L6
- Bensby & Lind (2018) Bensby, T. & Lind, K. 2018, A&A, 615, A151
- Bovy (2016) Bovy, J. 2016, ApJ, 817, 49
- Bravi et al. (2018) Bravi, L., Zari, E., Sacco, G. G., et al. 2018, A&A, 615, A37
- Bressan et al. (2012) Bressan, A., Marigo, P., Girardi, L., et al. 2012, MNRAS, 427, 127
- Brown et al. (1989) Brown, J. A., Sneden, C., Lambert, D. L., & Dutchover, Edward, J. 1989, ApJS, 71, 293
- Buder et al. (2020) Buder, S., Sharma, S., Kos, J., et al. 2020, arXiv e-prints, arXiv:2011.02505
- Cantat-Gaudin et al. (2020) Cantat-Gaudin, T., Anders, F., Castro-Ginard, A., et al. 2020, A&A, 640, A1
- Canto Martins et al. (2011) Canto Martins, B. L., Lèbre, A., Palacios, A., et al. 2011, A&A, 527, A94
- Carlberg et al. (2016) Carlberg, J. K., Cunha, K., & Smith, V. V. 2016, ApJ, 827, 129
- Carlberg et al. (2009) Carlberg, J. K., Majewski, S. R., & Arras, P. 2009, ApJ, 700, 832
- Carlberg et al. (2015) Carlberg, J. K., Smith, V. V., Cunha, K., et al. 2015, ApJ, 802, 7
- Carlberg et al. (2010) Carlberg, J. K., Smith, V. V., Cunha, K., Majewski, S. R., & Rood, R. T. 2010, ApJ, 723, L103
- Carrera & Martínez-Vázquez (2013) Carrera, R. & Martínez-Vázquez, C. E. 2013, A&A, 560, A5
- Casagrande & VandenBerg (2018) Casagrande, L. & VandenBerg, D. A. 2018, MNRAS, 479, L102
- Casey et al. (2019) Casey, A. R., Ho, A. Y. Q., Ness, M., et al. 2019, ApJ, 880, 125
- Casey et al. (2016) Casey, A. R., Ruchti, G., Masseron, T., et al. 2016, MNRAS, 461, 3336
- Cassisi et al. (2016) Cassisi, S., Salaris, M., & Pietrinferni, A. 2016, A&A, 585, A124
- Castro et al. (2016) Castro, M., Duarte, T., Pace, G., & do Nascimento, J. D. 2016, A&A, 590, A94
- Ceillier et al. (2013) Ceillier, T., Eggenberger, P., García, R. A., & Mathis, S. 2013, A&A, 555, A54
- Charbonneau & Michaud (1990) Charbonneau, P. & Michaud, G. 1990, ApJ, 352, 681
- Charbonnel & Balachandran (2000) Charbonnel, C. & Balachandran, S. C. 2000, A&A, 359, 563
- Charbonnel et al. (1998) Charbonnel, C., Brown, J. A., & Wallerstein, G. 1998, A&A, 332, 204
- Charbonnel & Lagarde (2010) Charbonnel, C. & Lagarde, N. 2010, A&A, 522, A10
- Charbonnel et al. (2020) Charbonnel, C., Lagarde, N., Jasniewicz, G., et al. 2020, A&A, 633, A34
- Charbonnel & Zahn (2007) Charbonnel, C. & Zahn, J. P. 2007, A&A, 467, L15
- Christensen-Dalsgaard et al. (2011) Christensen-Dalsgaard, J., Monteiro, M. J. P. F. G., Rempel, M., & Thompson, M. J. 2011, MNRAS, 414, 1158
- Coc et al. (2004) Coc, A., Vangioni-Flam, E., Descouvemont, P., Adahchour, A., & Angulo, C. 2004, ApJ, 600, 544
- Damiani et al. (2014) Damiani, F., Prisinzano, L., Micela, G., et al. 2014, A&A, 566, A50
- de Laverny et al. (2003) de Laverny, P., do Nascimento, J. D., J., Lèbre, A., & De Medeiros, J. R. 2003, A&A, 410, 937
- de Laverny et al. (2012) de Laverny, P., Recio-Blanco, A., Worley, C. C., & Plez, B. 2012, A&A, 544, A126
- de Medeiros et al. (1997) de Medeiros, J. R., Do Nascimento, J. D., J., & Mayor, M. 1997, A&A, 317, 701
- De Medeiros et al. (2000) De Medeiros, J. R., do Nascimento, J. D., J., Sankarankutty, S., Costa, J. M., & Maia, M. R. G. 2000, A&A, 363, 239
- De Silva et al. (2006) De Silva, G. M., Sneden, C., Paulson, D. B., et al. 2006, AJ, 131, 455
- Deal et al. (2021) Deal, M., Richard, O., & Vauclair, S. 2021, A&A, 646, A160
- Deepak & Lambert (2021) Deepak & Lambert, D. L. 2021, arXiv e-prints, arXiv:2104.11741
- Deepak et al. (2020) Deepak, Lambert, D. L., & Reddy, B. E. 2020, MNRAS, 494, 1348
- Deepak & Reddy (2019) Deepak & Reddy, B. E. 2019, MNRAS, 484, 2000
- Delgado Mena et al. (2016) Delgado Mena, E., Tsantaki, M., Sousa, S. G., et al. 2016, A&A, 587, A66
- Deliyannis et al. (2019) Deliyannis, C. P., Anthony-Twarog, B. J., Lee-Brown, D. B., & Twarog, B. A. 2019, AJ, 158, 163
- Deliyannis et al. (2000) Deliyannis, C. P., Pinsonneault, M. H., & Charbonnel, C. 2000, in IAU Symposium, Vol. 198, The Light Elements and their Evolution, ed. L. da Silva, R. de Medeiros, & M. Spite, 61
- Denissenkov et al. (2009) Denissenkov, P. A., Pinsonneault, M., & MacGregor, K. B. 2009, ApJ, 696, 1823
- Denissenkov & Tout (2003) Denissenkov, P. A. & Tout, C. A. 2003, MNRAS, 340, 722
- Denissenkov & Weiss (2000) Denissenkov, P. A. & Weiss, A. 2000, A&A, 358, L49
- Doyle et al. (2021) Doyle, A. E., Desch, S. J., & Young, E. D. 2021, ApJ, 907, L35
- Dumont et al. (2021) Dumont, T., Palacios, A., Charbonnel, C., et al. 2021, A&A, 646, A48
- Eggenberger et al. (2019) Eggenberger, P., Deheuvels, S., Miglio, A., et al. 2019, A&A, 621, A66
- Eggenberger et al. (2012) Eggenberger, P., Haemmerlé, L., Meynet, G., & Maeder, A. 2012, A&A, 539, A70
- Eggenberger et al. (2017) Eggenberger, P., Lagarde, N., Miglio, A., et al. 2017, A&A, 599, A18
- François et al. (2013) François, P., Pasquini, L., Biazzo, K., Bonifacio, P., & Palsa, R. 2013, A&A, 552, A136
- Franciosini et al. (2018) Franciosini, E., Sacco, G. G., Jeffries, R. D., et al. 2018, A&A, 616, L12
- Fu et al. (2018) Fu, X., Bressan, A., Marigo, P., et al. 2018, MNRAS, 476, 496
- Gaia Collaboration et al. (2021) Gaia Collaboration, Brown, A. G. A., Vallenari, A., et al. 2021, A&A, 649, A1
- Galli & Palla (2013) Galli, D. & Palla, F. 2013, ARA&A, 51, 163
- Garaud (2021) Garaud, P. 2021, arXiv e-prints, arXiv:2103.08072
- Garaud & Kulenthirarajah (2016) Garaud, P. & Kulenthirarajah, L. 2016, ApJ, 821, 49
- Gilmore et al. (2012) Gilmore, G., Randich, S., Asplund, M., et al. 2012, The Messenger, 147, 25
- Gonçalves et al. (2020) Gonçalves, B. F. O., da Costa, J. S., de Almeida, L., Castro, M., & do Nascimento, J. D., J. 2020, MNRAS, 498, 2295
- Gonzalez et al. (2009) Gonzalez, O. A., Zoccali, M., Monaco, L., et al. 2009, A&A, 508, 289
- Gratton et al. (2000) Gratton, R. G., Sneden, C., Carretta, E., & Bragaglia, A. 2000, A&A, 354, 169
- Green et al. (2019) Green, G. M., Schlafly, E., Zucker, C., Speagle, J. S., & Finkbeiner, D. 2019, ApJ, 887, 93
- Grisoni et al. (2019) Grisoni, V., Matteucci, F., Romano, D., & Fu, X. 2019, MNRAS, 489, 3539
- Guiglion et al. (2016) Guiglion, G., de Laverny, P., Recio-Blanco, A., et al. 2016, A&A, 595, A18
- Henkel et al. (2017) Henkel, K., Karakas, A. I., & Lattanzio, J. C. 2017, MNRAS, 469, 4600
- Hill & Pasquini (1999) Hill, V. & Pasquini, L. 1999, A&A, 348, L21
- Holanda et al. (2020) Holanda, N., Drake, N. A., & Pereira, C. B. 2020, MNRAS, 498, 77
- Iben (1967) Iben, Icko, J. 1967, ApJ, 147, 624
- Jackson et al. (2015) Jackson, R. J., Jeffries, R. D., Lewis, J., et al. 2015, A&A, 580, A75
- Jorissen et al. (2020) Jorissen, A., Van Winckel, H., Siess, L., et al. 2020, A&A, 639, A7
- Kaiser et al. (2021) Kaiser, B. C., Clemens, J. C., Blouin, S., et al. 2021, Science, 371, 168
- Klein et al. (2021) Klein, B., Doyle, A. E., Zuckerman, B., et al. 2021, arXiv e-prints, arXiv:2102.01834
- Krolikowski et al. (2016) Krolikowski, D. M., Steinhauer, A. J., Deliyannis, C. P., Twarog, B. A., & Anthony-Twarog, B. J. 2016, in American Astronomical Society Meeting Abstracts, Vol. 227, American Astronomical Society Meeting Abstracts #227, 240.30
- Kumar & Reddy (2020) Kumar, Y. B. & Reddy, B. E. 2020, Journal of Astrophysics and Astronomy, 41, 49
- Kumar et al. (2020) Kumar, Y. B., Reddy, B. E., Campbell, S. W., et al. 2020, Nature Astronomy, 4, 1059
- Kumar et al. (2011) Kumar, Y. B., Reddy, B. E., & Lambert, D. L. 2011, ApJ, 730, L12
- Lagarde et al. (2012) Lagarde, N., Decressin, T., Charbonnel, C., et al. 2012, A&A, 543, A108
- Lagarde et al. (2015) Lagarde, N., Miglio, A., Eggenberger, P., et al. 2015, A&A, 580, A141
- Lambert et al. (1980) Lambert, D. L., Dominy, J. F., & Sivertsen, S. 1980, ApJ, 235, 114
- Lanzafame et al. (2015) Lanzafame, A. C., Frasca, A., Damiani, F., et al. 2015, A&A, 576, A80
- Lattanzio et al. (2015) Lattanzio, J. C., Siess, L., Church, R. P., et al. 2015, MNRAS, 446, 2673
- Lèbre et al. (2006a) Lèbre, A., de Laverny, P., Do Nascimento, J. D., J., & de Medeiros, J. R. 2006a, A&A, 450, 1173
- Lèbre et al. (2006b) Lèbre, A., de Laverny, P., Do Nascimento, J. D., J., & de Medeiros, J. R. 2006b, A&A, 450, 1173
- Lebzelter et al. (2012) Lebzelter, T., Uttenthaler, S., Busso, M., Schultheis, M., & Aringer, B. 2012, A&A, 538, A36
- Lind et al. (2009) Lind, K., Primas, F., Charbonnel, C., Grundahl, F., & Asplund, M. 2009, A&A, 503, 545
- Liu et al. (2016) Liu, F., Asplund, M., Yong, D., et al. 2016, MNRAS, 463, 696
- Mallik et al. (2003) Mallik, S. V., Parthasarathy, M., & Pati, A. K. 2003, A&A, 409, 251
- Marques et al. (2013) Marques, J. P., Goupil, M. J., Lebreton, Y., et al. 2013, A&A, 549, A74
- Martell et al. (2020) Martell, S., Simpson, J., Balasubramaniam, A., et al. 2020, arXiv e-prints, arXiv:2006.02106
- Mathis (2013) Mathis, S. 2013, Transport Processes in Stellar Interiors, ed. M. Goupil, K. Belkacem, C. Neiner, F. Lignières, & J. J. Green, Vol. 865, 23
- Mathis et al. (2018) Mathis, S., Prat, V., Amard, L., et al. 2018, A&A, 620, A22
- Matteucci et al. (1995) Matteucci, F., D’Antona, F., & Timmes, F. X. 1995, A&A, 303, 460
- Michaud (1986) Michaud, G. 1986, ApJ, 302, 650
- Monaco et al. (2014) Monaco, L., Boffin, H. M. J., Bonifacio, P., et al. 2014, A&A, 564, L6
- Olive (2013) Olive, K. A. 2013, in American Institute of Physics Conference Series, Vol. 1560, American Institute of Physics Conference Series, ed. B. Fleming, 314–321
- Pace et al. (2012) Pace, G., Castro, M., Meléndez, J., Théado, S., & do Nascimento, J. D., J. 2012, A&A, 541, A150
- Palacios et al. (2001) Palacios, A., Charbonnel, C., & Forestini, M. 2001, A&A, 375, L9
- Palacios et al. (2003) Palacios, A., Talon, S., Charbonnel, C., & Forestini, M. 2003, A&A, 399, 603
- Palmerini et al. (2011) Palmerini, S., Cristallo, S., Busso, M., et al. 2011, ApJ, 741, 26
- Pancino et al. (2017) Pancino, E., Lardo, C., Altavilla, G., et al. 2017, A&A, 598, A5
- Pasquini et al. (2004) Pasquini, L., Randich, S., Zoccali, M., et al. 2004, A&A, 424, 951
- Pitrou et al. (2018) Pitrou, C., Coc, A., Uzan, J.-P., & Vangioni, E. 2018, Phys. Rep, 754, 1
- Prantzos (2012) Prantzos, N. 2012, A&A, 542, A67
- Prat & Lignières (2013) Prat, V. & Lignières, F. 2013, A&A, 551, L3
- Prat et al. (2015) Prat, V., Lignières, F., & Lagarde, N. 2015, in SF2A-2015: Proceedings of the Annual meeting of the French Society of Astronomy and Astrophysics, 419–422
- Privitera et al. (2016) Privitera, G., Meynet, G., Eggenberger, P., et al. 2016, A&A, 593, A128
- Randich et al. (2013) Randich, S., Gilmore, G., & Gaia-ESO Consortium. 2013, The Messenger, 154, 47
- Randich & Magrini (2021) Randich, S. & Magrini, L. 2021, Frontiers in Astronomy and Space Sciences, 8, 6
- Randich et al. (2020) Randich, S., Pasquini, L., Franciosini, E., et al. 2020, A&A, 640, L1
- Randich et al. (2002) Randich, S., Primas, F., Pasquini, L., & Pallavicini, R. 2002, A&A, 387, 222
- Randich et al. (2007) Randich, S., Primas, F., Pasquini, L., Sestito, P., & Pallavicini, R. 2007, A&A, 469, 163
- Randich et al. (2018) Randich, S., Tognelli, E., Jackson, R., et al. 2018, A&A, 612, A99
- Richard & Zahn (1999) Richard, D. & Zahn, J.-P. 1999, A&A, 347, 734
- Richard et al. (1996) Richard, O., Vauclair, S., Charbonnel, C., & Dziembowski, W. A. 1996, A&A, 312, 1000
- Roccatagliata et al. (2018) Roccatagliata, V., Sacco, G. G., Franciosini, E., & Randich, S. 2018, A&A, 617, L4
- Romano et al. (2001) Romano, D., Matteucci, F., Ventura, P., & D’Antona, F. 2001, A&A, 374, 646
- Sacco et al. (2014) Sacco, G. G., Morbidelli, L., Franciosini, E., et al. 2014, A&A, 565, A113
- Sackmann & Boothroyd (1999) Sackmann, I. J. & Boothroyd, A. I. 1999, ApJ, 510, 217
- Schlegel et al. (1998) Schlegel, D. J., Finkbeiner, D. P., & Davis, M. 1998, ApJ, 500, 525
- Schramm et al. (1990) Schramm, D. N., Steigman, G., & Dearborn, D. S. P. 1990, ApJ, 359, L55
- Sengupta & Garaud (2018a) Sengupta, S. & Garaud, P. 2018a, ApJ, 862, 136
- Sengupta & Garaud (2018b) Sengupta, S. & Garaud, P. 2018b, ApJ, 862, 136
- Sestito & Randich (2005) Sestito, P. & Randich, S. 2005, A&A, 442, 615
- Siess & Livio (1999) Siess, L. & Livio, M. 1999, MNRAS, 308, 1133
- Singh et al. (2021) Singh, R., Reddy, B. E., Campbell, S. W., Bharat Kumar, Y., & Vrard, M. 2021, arXiv e-prints, arXiv:2104.12070
- Skrutskie et al. (2006) Skrutskie, M. F., Cutri, R. M., Stiening, R., et al. 2006, AJ, 131, 1163
- Smiljanic (2020) Smiljanic, R. 2020, Mem. Soc. Astron. Italiana, 91, 142
- Smiljanic et al. (2018) Smiljanic, R., Franciosini, E., Bragaglia, A., et al. 2018, A&A, 617, A4
- Smiljanic et al. (2009) Smiljanic, R., Gauderon, R., North, P., et al. 2009, A&A, 502, 267
- Smiljanic et al. (2014) Smiljanic, R., Korn, A. J., Bergemann, M., et al. 2014, A&A, 570, A122
- Smiljanic et al. (2010) Smiljanic, R., Pasquini, L., Charbonnel, C., & Lagarde, N. 2010, A&A, 510, A50
- Somers & Pinsonneault (2016) Somers, G. & Pinsonneault, M. H. 2016, ApJ, 829, 32
- Talon & Charbonnel (2005) Talon, S. & Charbonnel, C. 2005, A&A, 440, 981
- Talon & Charbonnel (2010) Talon, S. & Charbonnel, C. 2010, in IAU Symposium, Vol. 268, Light Elements in the Universe, ed. C. Charbonnel, M. Tosi, F. Primas, & C. Chiappini, 365–374
- Talon & Zahn (1997) Talon, S. & Zahn, J. P. 1997, A&A, 317, 749
- Tognelli et al. (2020) Tognelli, E., Prada Moroni, P. G., Degl’Innocenti, S., Salaris, M., & Cassisi, S. 2020, A&A, 638, A81
- Travaglio et al. (2001) Travaglio, C., Randich, S., Galli, D., et al. 2001, ApJ, 559, 909
- Valle et al. (2014) Valle, G., Dell’Omodarme, M., Prada Moroni, P. G., & Degl’Innocenti, S. 2014, A&A, 561, A125
- Wallerstein et al. (1994) Wallerstein, G., Bohm-Vitense, E., Vanture, A. D., & Gonzalez, G. 1994, AJ, 107, 2211
- Wang et al. (2021) Wang, E. X., Nordlander, T., Asplund, M., et al. 2021, MNRAS, 500, 2159
- Yan et al. (2021) Yan, H.-L., Zhou, Y.-T., Zhang, X., et al. 2021, Nature Astronomy, 5, 86
- Zahn (1992) Zahn, J. P. 1992, A&A, 265, 115
- Zhang (2012) Zhang, Q. S. 2012, MNRAS, 427, 1441
Appendix A
| id | Cluster | Age | Distance | RGC | RV | [Fe/H] | MSTO | Parsec (Ageiso, Ziso) |
|---|---|---|---|---|---|---|---|---|
| (Myr) | (pc) | (kpc) | (km s-1) | (dex) | () | (Gyr, Z) | ||
| 1 | NGC6067 | 130 | 1880 | 6.8 | -39.40.2 | 0.030.16 | 4.5 | (0.13, 0.0145) |
| 2 | NGC6709 | 190 | 1040 | 7.6 | -112 | -0.030.03 | 3.8 | (0.2, 0.013) |
| 3 | Rup7 | 230 | 5850 | 13.1 | 771 | -0.240.04 | 3.4 | (0.24, 0.007) |
| 4 | NGC6192 | 240 | 1740 | 6.7 | -8.10.7 | -0.080.08 | 3.5 | (0.24, 0.011) |
| 5 | NGC6259 | 270 | 2310 | 6.2 | -341 | 0.170.06 | 3.5 | (0.26, 0.019) |
| 6 | Berkeley30 | 295 | 5380 | 13.3 | 472 | -0.080.13 | 3.2 | (0.3, 0.009) |
| 7 | NGC6705 | 310 | 2200 | 6.5 | 341 | 0.020.05 | 3.3 | (0.3, 0.015) |
| 8 | NGC4815 | 370 | 3295 | 7.1 | -29.90.4 | 0.040.16 | 3.0 | (0.38, 0.015) |
| 9 | NGC3532 | 400 | 500 | 8.2 | 51 | -0.010.06 | 2.9 | (0.4, 0.013) |
| 10 | NGC6281 | 510 | 540 | 7.8 | -61 | -0.080.16 | 2.6 | (0.52, 0.011) |
| 11 | NGC2324 | 540 | 4210 | 12.1 | 413 | -0.170.02 | 2.5 | (0.54, 0.009) |
| 12 | Pismis18 | 575 | 2860 | 6.9 | -27.80.7 | 0.140.04 | 2.6 | (0.58, 0.019) |
| 13 | NGC6802 | 660 | 2750 | 7.1 | 11.60.8 | 0.140.04 | 2.5 | (0.66, 0.019) |
| 14 | NGC6633 | 690 | 420 | 8.0 | -291 | -0.060.11 | 2.3 | (0.7, 0.011) |
| 15 | Trumpler23 | 710 | 2590 | 6.3 | -621 | 0.210.03 | 2.5 | (0.7, 0.021) |
| 16 | Pismis15 | 870 | 2560 | 8.6 | 34.80.5 | 0.040.04 | 2.2 | (0.88, 0.015) |
| 17 | NGC3960 | 870 | 2345 | 7.7 | -221 | -0.060.16 | 2.2 | (0.88, 0.011) |
| 18 | NGC5822 | 910 | 850 | 7.7 | -282 | 0.010.02 | 2.2 | (0.92, 0.015) |
| 19 | NGC2660 | 930 | 2790 | 9.0 | 22.00.3 | -0.050.04 | 2.1 | (0.94, 0.011) |
| 20 | Melotte71 | 980 | 2140 | 9.9 | 501 | -0.100.03 | 2.1 | (0.98, 0.011) |
| 21 | NGC2355 | 1000 | 1940 | 10.1 | 36.20.5 | -0.090.03 | 2.1 | (1.0, 0.011) |
| 22 | NGC2477 | 1120 | 1440 | 8.9 | 81 | 0.140.04 | 2.1 | (1.12, 0.019) |
| 23 | Berkeley81 | 1150 | 3310 | 5.9 | 47.90.6 | 0.220.06 | 2.1 | (1.15, 0.023) |
| 24 | NGC6583 | 1200 | 2050 | 6.3 | -1.90.9 | 0.220.01 | 2.0 | (1.2, 0.023) |
| 25 | NGC6005 | 1260 | 2380 | 6.5 | -241 | 0.210.04 | 2.0 | (1.25, 0.023) |
| 26 | Berkeley73 | 1410 | 6160 | 13.8 | 97.00.3 | -0.260.04 | 1.7 | (1.42, 0.007) |
| 27 | Berkeley44 | 1440 | 2860 | 7.0 | -9.10.5 | 0.220.10 | 1.9 | (1.45, 0.023) |
| 28 | NGC4337 | 1440 | 2450 | 7.5 | -18.90.2 | 0.250.02 | 1.9 | (1.45, 0.023) |
| 29 | NGC2158 | 1550 | 4300 | 12.6 | 272 | -0.160.05 | 1.7 | (1.54, 0.009) |
| 30 | Tom2 | 1620 | 9320 | 15.6 | 1221 | -0.240.08 | 1.7 | (1.62, 0.007) |
| 31 | NGC2506a | 1660 | 3190 | 10.6 | 84.1 | -0.34 | 1.6 | (1.66, 0.007) |
| 32 | Rup134 | 1660 | 2250 | 6.1 | -41.10.6 | 0.270.04 | 1.8 | (1.65, 0.023) |
| 33 | Berkeley75 | 1700 | 8300 | 14.7 | 1241 | -0.350.05 | 1.6 | (1.7, 0.005) |
| 34 | NGC2420 | 1740 | 2590 | 10.7 | 74.10.8 | -0.160.07 | 1.7 | (1.7, 0.005) |
| 35 | Col110 | 1820 | 2180 | 10.3 | 37.20.3 | -0.100.05 | 1.7 | (1.82, 0.011) |
| 36 | NGC2141 | 1860 | 5180 | 13.3 | 26.00.8 | -0.060.07 | 1.6 | (1.86, 0.11) |
| 37 | Trumpler20 | 1860 | 3390 | 7.2 | -40.20.9 | 0.130.04 | 1.5 | (1.86, 0.019) |
| 38 | Berkeley21 | 2140 | 6420 | 14.7 | 0.90.9 | -0.210.04 | 1.5 | (2.14, 0.009) |
| 39 | NGC2425 | 2400 | 3580 | 10.9 | 103.50.7 | -0.170.18 | 1.5 | (2.4, 0.009) |
| 40 | Berkeley22 | 2450 | 6220 | 14.3 | 952 | -0.280.08 | 1.4 | (2.46, 0.007) |
| 41 | Berkeley25 | 2450 | 6780 | 13.8 | 1361 | -0.300.12 | 1.4 | (2.46, 0.007) |
| 42 | Cz24 | 2700 | 3980 | 12.3 | 22.10.5 | -0.120.04 | 1.4 | (2.7, 0.011) |
| 43 | Berkeley31 | 2820 | 7180 | 15.1 | 56.90.8 | -0.310.04 | 1.3 | (2.82, 0.007) |
| 44 | Cz30 | 2880 | 6650 | 13.8 | 81.50.3 | -0.320.01 | 1.3 | (2.88, 0.007) |
| 45 | Berkeley29 | 3090 | 12600 | 20.6 | 25.80.3 | -0.390.11 | 1.3 | (3.0, 0.005) |
| 46 | NGC6253 | 3230 | 1650 | 6.9 | -29.20.9 | 0.330.10 | 1.5 | (3.2, 0.029) |
| 47 | Haf10 | 3800 | 3410 | 10.8 | 87.80.9 | -0.110.03 | 1.2 | (3.8, 0.011) |
| 48 | Trumpler5 | 4260 | 3050 | 11.2 | 511 | -0.350.04 | 1.1 | (4.2, 0.007) |
| 49 | M67 | 4260 | 900 | 8.7 | 34.10.6 | -0.020.09 | 1.2 | (4.2, 0.013) |
| 50 | NGC2243 | 4360 | 3720 | 10.6 | 59.80.3 | -0.440.09 | 1.1 | (4.4, 0.005) |
| 51 | ESO92_05 | 4470 | 12440 | 12.8 | 61.40.4 | -0.290.07 | 1.1 | (4.4, 0.007) |
| 52 | Berkeley20 | 4790 | 8730 | 16.3 | 78.90.3 | -0.370.07 | 1.1 | (4.8, 0.005) |
| 53 | Berkeley32 | 4900 | 3070 | 11.1 | 105.90.6 | -0.280.08 | 1.1 | (4.8, 0.009) |
| 54 | Berkeley39 | 5620 | 3970 | 11.5 | 58.60.8 | -0.140.05 | 1.1 | (5.6, 0.009) |
| 55 | NGC6791 | 6310 | 4230 | 7.9 | -481 | 0.320.18* | 1.1 | (6.4, 0.019) |
| 56 | Col261 | 6310 | 2850 | 7.3 | -251 | -0.050.07 | 1.1 | (6.4, 0.019) |
| 57 | Berkeley36 | 6760 | 4360 | 11.7 | 62.60.9 | -0.220.11 | 1.0 | (6.8, 0.009) |
| id | Cluster | Teff | log g | [Fe/H] | A(Li) | UL | log(L/L⊙) | Mass (MSTO) | |
|---|---|---|---|---|---|---|---|---|---|
| (K) | (dex) | (dex) | (M⊙) | ||||||
| 05323677+0011048 | Br20 | 485030 | 2.700.05 | -0.320.06 | -0.02 | 1 | 1.640.04 | – | 1.1 |
| 05323896+0011203 | Br20 | 438030 | 1.810.06 | -0.430.06 | -0.63 | 1 | 2.130.03 | – | 1.1 |
| 05512981+2143071 | Br21 | 674060 | 4.30.2 | -0.370.05 | 2.300.25 | 0 | 1.290.06 | – | 1.5 |
| 05515964+2144121 | Br21 | 624080 | 4.10.2 | -0.280.08 | 2.41 | 1 | 0.80.1 | – | 1.5 |
| id | GES_FLD | Teff | log g | [Fe/H] | A(Li) | UL | log(L/L⊙) | Mass | |
|---|---|---|---|---|---|---|---|---|---|
| (K) | (dex) | (dex) | (M⊙) | ||||||
| 00000009-5455467 | GES_MW_00_01 | 606030 | 3.940.05 | -0.550.05 | 2.340.03 | 0 | 0.250.02 | – | 0.80.1 |
| 00000302-6002570 | GES_MW_00_01 | 578030 | 4.040.05 | -0.310.04 | 2.010.03 | 0 | 0.370.01 | – | 0.90.1 |