The 6H states studied in the reaction and evidence of extremely correlated character of the 5H ground state
Abstract
The extremely neutron-rich system 6H was studied in the direct H transfer reaction with a MeV secondary 8He beam. The measured missing mass spectrum shows a broad bump at MeV above the 3H+ decay threshold. This bump can be interpreted as a broad resonant state in 6H at MeV. The population cross section of such a presumably -wave state (or may be few overlapping states) in the energy range from 4 to 8 MeV is b/sr in the angular range . The obtained missing mass spectrum is practically free of the 6H events below 3.5 MeV ( b/sr in the same angular range). The steep rise of the 6H missing mass spectrum at MeV allows to derive the lower limit for the possible resonant-state energy in 6H to be MeV. According to the paring energy estimates, such a MeV resonance is a realistic candidate for the 6H ground state (g.s.). The obtained results confirm that the decay mechanism of the 7H g.s. (located at 2.2 MeV above the 3H+ threshold) is the “true” (or simultaneous) emission. The resonance energy profiles and the momentum distributions of fragments of the sequential 6HH(g.s.)+H+ decay were analyzed by the theoretically-updated direct four-body-decay and sequential-emission mechanisms. The measured momentum distributions of the 3H fragments in the 6H rest frame indicate very strong “dineutron-type” correlations in the 5H ground state decay.
I Introduction
One of the important trends of the modern experimental nuclear physics, taking advantages of the radioactive ion beam techniques, is the expansion of our knowledge on nuclear systems located further beyond the proton and neutron driplines. An important motivation here is the quest for the limits of of nuclear structure existence: how far should we go beyond the driplines before coming to situation when resonant structures become completely “dissolved in continuum”?
Recently, reliable spectroscopic information was obtained on the extreme neutron-rich system 7H produced in the 2H(8He,3He)7H reaction Bezbakh et al. 2020; Muzalevskii et al. 2021. The 6H population in the 2H(8He,4He)6H reaction, which makes the subject of the present work, is a natural byproduct of the above-mentioned experiment.
Experimental information on the 6H resonant states is very limited. The authors of Ref. Aleksandrov et al. 1984 reported a value MeV (energy above the 3H+ decay threshold) for the 6H state produced in the 7Li(7Li,8B)6H reaction. This result was confirmed (with some reservations) in the 9Be(11B,14O)6H reaction Belozyorov et al. 1986, giving 6H ground-state resonance energy MeV. The search for 6H in the 6Li(,) reaction was carried out in Parker et al. 1990; Seth and Parker 1991. No low-lying resonant states were identified, which led the authors to conclusion that their results cast serious doubt on the existence of the 6H resonance in the MeV unbound region. The observation of the 6H resonant states at , , , MeV, populated in the 9Be(,H reaction, and , , , MeV states in the 11B(,HeH reaction was reported in Ref. Gurov et al. 2007. There was no indication of the resonant state at 2.6-2.9 MeV in this work. The 6H g.s. energy MeV was determined in the 8He(12C,14N)6H reaction Caamaño et al. 2008. Our results are in contradiction with Aleksandrov et al. 1984; Belozyorov et al. 1986; Caamaño et al. 2008 and are majorly in agreement with Parker et al. 1990; Gurov et al. 2007. We demonstrate in this work that it is likely that the discussion about the actual position of the 6H g.s. is not finished yet, and it should be continued.

The search for the 6H resonant states is an exciting challenge in itself, however, here we face two important questions related also to our understanding of neighboring systems.
(i) What are the decay mechanisms of the 7H ground ( MeV) and excited ( MeV) states? This is defined by the spectra of its subsystems, see Fig. 1. For example, it could be either the true 7HH+ decay, or sequential 7HH(g.s.)+, or, else, the 7HH(g.s.)+ decay, depending on the ground state energies of 5H and 6H. While for the 4H and 5H there are some relatively reliable data, the spectrum of 6H is very uncertain.
(ii) What is the decay mechanism of the 6H ground state? Intuitive vision of the situation, also confirmed by the theoretical estimates of this work, tells us that the 6H g.s. decay is likely to have a sequential 6HH(g.s.)+H+ character. Therefore, by studying the 6H decay, we may also gain access to the decay properties of the 5H ground state. The momentum distributions of the 3H fragment, measured in our experiment, can be interpreted by assuming an unexpectedly strong “dineutron” correlation character of the 5H ground state decay. The sequential 6HH(g.s.)+H+ decay has never been studied before, and interpretation of the data required extensive model studies and discussions of this decay mechanism. Our results highlight the potential of the sequential 6HH(g.s.)+H+ decay as an important source of information about the intermediate 5H system.
The data of this work obtained in the double 4He-3H coincidences have quite large statistics (among available data only for the 9Be(,H reaction Gurov et al. 2007 statistics is better), and it allows for a good MM energy resolution for the 6H spectrum and careful treatment of the backgrounds. The consistent MM picture was obtained in the triple 4He-3H- coincidence data, which provide much smaller statistical confidence, but which can be seen as practically background free. Thus, the derived from our data detailed information on the low-energy spectrum of 6H, shed light on the above-mentioned problems.
II Experiment
The experiment was performed in the Flerov Laboratory of Nuclear Reactions (JINR, Dubna) at the recently commissioned ACCULINNA-2 fragment-separator coupled to the U-400M heavy ion cyclotron Fomichev et al. 2018. Recently the 7H studies were carrid out in the 2H(8He,3He)7H reaction Bezbakh et al. 2020; Muzalevskii et al. 2021. The information on 6H is naturally present in the data of these experiments due to a “satellite” 2H(8He,4He)6H reaction. The 7H experiments were discussed in detail in Ref. Muzalevskii et al. 2021, and we only briefly sketch here the information important for understanding of the 6H data.


The 6H system was produced in the 2H(8He,4He)6H reaction. The secondary 8He beam was produced by the MeV 11B primary beam fragmentation on 1 mm Be target. The 8He beam with intensity of pps at MeV and beam purity interacted with the deuterium nuclei in the cryogenic gas target, see Fig. 2. The target was 4 mm thick with 6 m thick entrance and exit stainless steel windows. Being cooled down to 27 K, it had a thickness of . The secondary beam diagnostics, made with the pair of thin ToF plastics and the pair of position-sensitive chambers Kaminski et al. 2020, provided the determination of the hit position on the target and the time-of flight measurement made for every individual beam ion with accuracy 1.8 mm and 280 ps, respectively.
The experimental setup, discussed in detail in Ref. Muzalevskii et al. 2021, involved four “sideway” -- telescopes detecting the recoil nuclei (4He in this experiment) emitted from the cryogenic deuterium gas target in angular range in laboratory system. The 20 m thick, mm2 single-side Si front detector of the telescope had 16 strips. Next to this detector was the 1 mm thick, mm2 double-side Si strip detector having behind another 1 mm thick veto detector. The “central” telescope, assigned for the registration of the 3H fragments, originating from the 6H decay, consisted of the 1.5 mm thick mm2 double-side Si strip detector followed by the array of CsI(Tl) scintillators. The charged particles, namely the “fast” decay tritons (with lab. energy MeV) or Li isotopes (in the case of the reference 2H(10Be,4He) reaction), were registered in the narrow forward cone , with good angular () and energy () resolutions.
The typical identification plots obtained with these detector telescopes are illustrated in Fig. 3. A good quality of the helium isotopes’ identification is found, see panel (a), where the green dots show the coincidences with “fast” tritons as well. The central telescope performance is illustrated in Fig. 3 (b) giving as example the calibration 2H(10Be,4He)8Li reaction study. All hydrogen and lithium isotopes are obviously well separated here.


The setup also included a neutron wall consisting of 48 stilbene-crystal modules where each 50-mm thick crystal was 80 mm in diameter Bezbakh et al. 2018. The neutron wall was located near zero angle at a m distance from the deuterium target, see Fig. 2 (a). The neutron spectrometer involved into the triple 4He-3H- coincidences has a good - separation provided by the so called pulse-shape analysis method Bezbakh et al. 2018, see Fig. 4.

The dedicated measurement with the MeV secondary 10Be beam (produced from the MeV 15N primary beam) was performed to provide independent calibration of the setup, see Section II.2.
II.1 The Monte-Carlo simulations
Complete Monte-Carlo (MC) simulations of the experimental setup for the H reaction were performed. The 6H MM resolution of the experiment MeV was determined in different kinematical ranges, see Table 1 for details. The maximum efficiencies (at MeV) of the double 4He-3H and triple 4He-3H- coincidence detection were and , respectively. The setup efficiency as function of MM and the reaction center-of-mass angle, , is demonstrated in Fig. 12 (a). Important qualitative results of these studies are like follows.
(i) In the MM energy range of interest MeV the setup efficiency is both high and monotonous. The largest variation of efficiency is quite modest, e.g. .
(ii) At about the setup efficiency abruptly drops down. Therefore, the data interpretation for becomes problematic due to the high sensitivity to details of possible efficiency correction procedures.
The detailed MC simulations of the theoretically-motivated 6H MM spectra (see Fig. 12) and the isolated 6H resonance, expected according to Refs. Aleksandrov et al. 1984; Belozyorov et al. 1986; Caamaño et al. 2008 at MeV (see Fig. 13), have been performed, as well as MC studies of the calibration 2H(10Be,4He)8Li reaction (see Fig. 5).
| 5 | 10 | 15 | 20 | |
|---|---|---|---|---|
| 1.7 | 1.3 | 1.0 | 0.8 | |
| 1.7 | 1.5 | 1.3 | 1.0 | |
| 1.4 | 1.2 |
II.2 The neutron-unstable 8Li spectrum populated in the 2H(10Be,4He)8Li reaction
Dedicated test experiment was performed with the 10Be beam for the setup calibration. The known neutron-unstable 8Li states were populated in the 2H(10Be,4He)8Li reaction. The - plots viewed in the case where the MeV 10Be nuclei bombarded the deuterium gas target were even more filled in their 4He loci than in the case of the 8He projectiles. However, by imposing the 4He-Li coincidence condition this background was strongly reduced. The first two particle-stable states of 8Li (corresponding to the 4He-8Li coincidence events) were found to be poorly populated in this reaction. The first neutron-unstable resonant state, known to be at the excitation energy of MeV www, is well seen in the 4He-7Li coincidence events in Fig. 5. The energy of this state is measured with 250-keV error, but also, is well interpreted by assuming that the next 8Li state with MeV is populated with relative probability, as predicted in the FRESCO calculations.

III The 6H data
The 4He-3H coincidence data (4650 events in total) obtained in the H reaction are shown in Fig. 6. The setup of experiment Muzalevskii et al. 2021 was optimized for the 7H search in the H reaction, and, therefore, it was not optimal for the 6H studies. For that reason a relatively narrow center-of-mass (c.m.) angular range was available for the 4He recoils originating from the 2H(8He,4He)6H reaction, see Fig. 6 (b). Background conditions were quite poor for these recoils because of random coincidences with alphas originating from other intense reaction channels. This background can be seen in Fig. 6 (a) as the strong population of the plane beyond the kinematical limit for the 2H(8He,4He)6H reaction ( is the 3H energy in the 6H c.m. frame). The background in the low-energy part of the MM spectrum can be drastically reduced by gating the data in the kinematically allowed range on the plane. This selection results in 3850 events shown by red dots in Fig. 6 (b). The 6H MM spectrum derived from these events [blue histogram in Fig. 6 (c)] shows a rise in the region beginning at MeV and going up to MeV, where the spectrum remains flat within the energy range extending up to MeV. The rate of this rise, coming to the flat top, matches well the shape characteristic for relatively broad -wave resonant states, as can be expected for 6H. This rate is much faster than one may expect in situation without resonant contributions [for example, the 4-body phase volume case is illustrated by the orange dotted curve in Fig. 6 (c)]. This specific shape of the MM spectrum allows us to claim that there is a resonance state, or a group of overlapping resonance states in 6H located at MM energy MeV.

The 6.8 MeV bump can be made more visible by limiting the reaction c.m. angular range as , see the gray histogram in Fig. 6 (c). All the MM spectra gated by some bands with show no resonating behavior, only monotonous growth up to MeV [for example, see the red histogram in Fig. 6 (c)]. Partly this is due to the setup efficiency in the MeV energy range, which rapidly degrades at and comes to zero at . In contrast, the energy range MeV for is strongly boosted due to the setup geometry. This effect is well illustrated in Figs. 6 (b) and 12 (a).
III.1 The 6H c.m. angular distribution
The cross section of the 2H(8He,4He)6H reaction populating the expected low-lying resonant states of 6H was calculated using the FRESCO code for momentum transfer. The calculations are analogous to those performed in Muzalevskii et al. 2021 for the 2H(8He,3He)7H reaction with the “standard” parameter set. The obtained center-of-mass cross section is shown in Fig. 7. The cross section features a broad peak at about , the rapid fall after , and the diffraction minimum around .
In paper Muzalevskii et al. 2021 the “standard” parameter set for FRESCO calculations was modified to explain the experimentally observed missing population in the angular range , which was assumed to correspond to the diffraction minimum of the 2H(8He,3He)7H reaction. The “standard” parameter set predicted this diffraction minimum at . Strong absorption or extreme peripheral character of the reaction were suggested in Muzalevskii et al. 2021 to explain the low-angle shift of the diffraction minimum. One may expect that such a parameter modification is needed also for the 2H(8He,4He)6H reaction calculations. However, both (i) the situation observed in Fig. 7 with diffraction minimum at about and (ii) the hypothetic situation of the diffraction minimum shifted to smaller c.m. angles are qualitatively consistent with the observed in Fig. 6 (c) absence of the 6.8 MeV bump in the experimental MM spectrum for : the angular range may correspond either to diffraction minimum for the cross section, or to the right slope of its low-angle forward peak.

III.2 “Direct” empty target subtraction

The background contribution can be further reduced by taking into account the empty target (deuterium gas out) data, see Fig. 8. The empty target measurement collected around of the beam integral providing 280 events in total and 190 events within the “energy triangle” of Fig. 8 (a).

Let’s first use two simple procedures of the “direct” background subtraction of the scaled empty target data. In the first case the total spectra are the subject of subtraction, see Fig. 8 (c), black diamonds. Alternatively, the empty target spectrum is subtracted in the kinematical limits and (gray circles). The two features should be pointed here:
(i) The subtraction spectra in the energy range MeV are consistent with each other and consistent with the 6.8 MeV bump position as seen in the spectrum without any background subtraction.
(ii) In both cases we get quite a low limit for the population of the MeV energy range (the corresponding limits are events and events). This point also is further discussed in Section V.1.
So, the both direct subtraction methods produce consistent results and indicate that we understand the nature of the apparatus-induced backgrounds in our experiment. However, because of the low statistics of the empty target data the bin size was to be set to quite a large value of 3 MeV. Despite the large bin size, the statistical error bars produced by the two used procedures are quite large and do not allow detailed quantitative conclusions. For that reason a more stable background subtraction procedure is developed, which is based on the smooth approximation of the empty target background data.
III.3 “Advanced” empty target subtraction

This subtraction procedure is based on assumption that the empty target contribution is sufficiently smooth in the kinematical space. The empty target data histogram in the plane is shown in Fig. 9 (a). This background has two components: the flat component, weakly depending on energy, and the relatively narrow “ridge” at small values. It was approximated by a smooth analytical function, see Fig. 9 (b), and then a MC procedure was used to subtract it from the data. The subtraction results obtained with the empty-target data normalized to the 8He incoming beam flux are shown in Fig. 10. The motivation for the use of complicated “two-dimensional” background subtraction procedure and important conclusions obtained as a result of this procedure are emphasized by the following two issues.
(i) One may see in Figs. 10 (c,d) that the subtraction procedure reduces to zero the contributions in the kinematically forbidden ranges for the MM ranges and . This is a good indication that the background subtraction procedure is reasonably well “calibrated” for the energy region of interest.
(ii) The energy distribution in Fig. 10 (b) is flat, and there is no considerable event concentration in the kinematically allowed range . If there is a flat background distribution in the plane for MeV, then, evidently, the corresponding background contribution to the MM spectrum with the physical kinematical selection should be linear at . This is actually taking place, and, as a result, the whole 6H spectrum is effectively reduced to zero in the MM range MeV, see Fig. 10 (a).
The 6.8 MeV bump is clearly seen in the empty-target-corrected MM spectrum in Fig. 10 (a) with an average cross section of b/sr being deduced for the c.m. angular range . This reasonably large cross section is consistent with the resonant population mechanism. This value is also in a very good agreement with the cross section obtained by FRESCO calculations, see Fig. 7. The steep rise of the spectrum at MeV and the broad left tail of the 6.8 MeV bump provide together an indication that another 6H state may be located at about 4.5 MeV, see the discussion of Figs. 12 (c) and (d) in Section III.5 below. No indication on the MeV state (the 6H ground state, as suggested in Refs. Aleksandrov et al. 1984; Belozyorov et al. 1986; Caamaño et al. 2008) is found.
III.4 Neutron coincidence data
Practically background-free 6H data can be obtained by requesting coincidence with one of the neutrons emitted in the 6H decay. The data on the 4He-3H- coincidence events (130 in total) from the H reaction are shown in Fig. 11. The background level of this spectrum can be estimated as from the “kinematical triangles” build for the 3H and neutron emitted by 6H, see Figs. 11 (a) and (b). The c.m. angular distribution of the 4He-3H- coincidence events is shown in Fig. 11 (d). There is evidence that there is a peak at 6.8 MeV in Fig. 11 (d), where indication on the 4.5 MeV structure can be also found. There is no evidence of possible 2.6 MeV state in Fig. 11: just one event is found in the 1.5 MeV energy bin around MeV compared to the total 14 events within the MeV MM energy range, assigned to the broad 6.8 MeV peak.

It is important to note that the neutron coincidence MM spectrum is nicely described by the same curves as the empty-target-subtracted MM spectrum, see Fig. 12. This statement is, of course, valid within the much larger statistical uncertainty of the neutron coincidence data.
III.5 6H spectrum interpretation
It should be carefully specified why and in which sense we speculate above about the 6.8 MeV (and moreover, about the 4.5 MeV) states.
Possible interpretations of the low-energy 6H spectrum are illustrated in Fig. 12. In this figure the empty-target-corrected 4He-3H coincidence spectrum of Fig. 10 (a) and the 4He-3H- coincidence spectrum of Fig. 11 (d) are also corrected for the experimental efficiency by a MC procedure. For consistency, the neutron coincidence spectrum in Fig. 12 (d) has the same cutoff.

The 4-body 3H+++ and 2-body 5H+ phase volumes (orange dotted curves) illustrate the possible profiles of nonresonant “physical backgrounds” in Figures 12 (b) and (c). We may see that such “standard” backgrounds have profiles which can not explain the strong population of the MeV MM range. Some resonant contributions are also needed.
The resonant cross section behavior at MeV is approximated by the conventional Lorentz-like profiles
“corrected” for the energy dependence of the width defined by Eq. (3) below.
The interpretation with a single broad resonant peak is given in Fig. 12 (b), see the black solid curve. In these estimates we use the width MeV for the MeV resonant state, see Fig. 16. This width value is likely to be the upper limit for the 6H resonant state, because the upper-limit parameters are used in the estimates. For example, the maximum single-particle reduced width is used in Eq. (4) for the 5H- channel. For this interpretation there is some indication for underestimation of the spectrum in the low-energy region MeV. For a smaller width of the MeV resonant state or for a higher resonant energy selection, this underestimation becomes larger and is regarded as not acceptable.
Statistically, the deep in the experimental spectrum around MeV may be regarded as not very significant. The “smooth” description of the data without explicit resonant bump [see Fig. 12 (b), black dashed curve] has value only somewhat larger than unity. This is much worse than in the “broad peak” interpretation [black solid curve in Fig. 12 (b)], but statistically this is an acceptable value for the criterion. However, for such a “smooth” fit we still need a resonant state at MeV. For the “smooth” description of the data also the resonance energy values MeV are acceptable. However, higher resonance energy values MeV are not acceptable due to the systematic underestimation of the low-energy data. Thus, the MeV resonance energy can be regarded as an upper limit resonant energy admissible for the data interpretation with a single broad state.
One may find in Fig. 12 (b), (c) that for the 6H MM spectrum in the MeV energy range up to of the population cross section can be related to “physical background” connected with low-energy tail of the higher excitations. For that reason the lower limit given for the uncertainty of the population cross section should be extended as b/sr.
III.6 Where is 6H ground state?
Important feature of our data is the nonobservation of the 6H ground state at MeV, as proposed in the earlier works Aleksandrov et al. 1984; Belozyorov et al. 1986; Caamaño et al. 2008. To quantify this fact we performed complete MC simulations for the isolated ground state assuming the MeV resonance energy and angular distribution predicted by calculations of Fig. 7. The MC simulations of our setup efficiency, see Fig. 12 (a), show that this energy and angular range are the most favorable for such a resonant state identification. Fig. 13 illustrates, which limits on the population of the MeV resonance are imposed by our data. One can see that even without any background subtraction this cross section limit should be set as b/sr. Such a value is essentially smaller than b/sr both observed around 6.8 MeV bump and predicted by calculations for angular momentum transfer. It is clear that whatever is the applied background subtraction procedure, the actual cross section limit should be smaller anyhow. With the direct empty target subtraction procedure the cross section limit is obtained as b/sr, see Fig. 8 (c). According to the advanced subtraction procedure the population is practically zero at MeV, see Fig. 10 (a). By assuming that the three events, appearing at MeV, could be attributed to such a state, the cross section limit of its population is set as b/sr.

Here it is natural to ask the question: “What is the lowest resonant energy admissible by our data?”. We imply that the population rate for such a state should be comparable for several possible low-lying states of 6H populated by the angular momentum transfer. It is discussed in the theoretical estimates of Section IV that much smaller widths of the low-lying 6H states are possible than it is assumed in Fig. 12 (b). For the MeV resonance with a smaller width (e.g., MeV) the interpretation with two states, illustrated in Fig. 12 (c,d), is preferable. The low-energy slope of the cross section can be described by a resonant state with energy as low as MeV. This resonant contribution should be interpreted as the lowest-energy resonant state in 6H with reasonably large population cross section, which can be consistent with our data.
Generally, one should keep in mind that more than two overlapping 6H states may actually be expected in this energy range. Therefore, the “two-state situation” in reality could mean “more than one state”. The ground state situation of 6H is further discussed in Section V
IV True and sequential decay of 6H

The simplest idea about the character of the 4-body decay is based on the phase volume (p.v.) approximation. The decay of such or analogous character is often discussed as “true 4-body decay”: there are no regions in the momentum space which are emphasized by some forms of nuclear dynamics. The phase space of the 4-particle system can be defined by the three energies corresponding to the three Jacobi vectors in momentum space
| (1) |
The one-dimensional phase-volume energy distribution can be obtained by integrating the phase space (1) over the two variables
| (2) |
This expression for the energy distribution is evidently the same for any of the three Jacobi vectors. Therefore, it defines the single-particle energy distributions both for 3H and fragments emitted in the 6H decay.
A more realistic scenario of the decay of 6H can be sequential process: the emission of one neutron, which may lead to the population of the 5H ground state. For theoretical modelling of the 6H sequential decay via the 5H g.s. we employ the generalization of the R-matrix-type expression, which was previously actively used for the two-nucleon emission estimates in Refs. Grigorenko and Zhukov 2007; Grigorenko et al. 2009; Olsen et al. 2013; Brown et al. 2015; Grigorenko and Zhukov 2015:
| (3) | |||||
The width dependence can be parameterized as
| (4) |
For MeV this results in MeV, which is consistent with the data Korsheninnikov et al. 2001; Golovkov et al. 2004; Golovkov et al. 2005. The neutron width can be defined by the standard R-matrix expression
| (5) |
where is penetrability as a function of the decay energy in the 5H+ channel and its “channel radius” . The Lorentz-type profiles used in Eq. (3) for the 6H estimates are shown in Fig. 14 (a). They correspond to the following parameters: MeV, MeV, fm, and . The phase shift in the 3H- channel, which can be associated with in Eq. (5), is shown in Fig. 14 (b): this can be seen as reasonably consistent with phase shifts of the lowest states of 4H. The energy distributions between the 5H(g.s.) and neutron, calculated by Eq. (3), are illustrated in Fig. 15 (b) for two 6H decay energies.
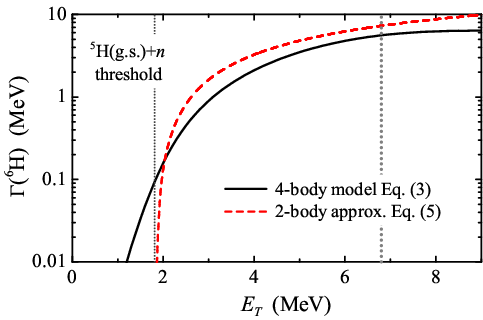
The 6H decay widths, estimated by Eq. (3), is shown in Fig. 16, together with a trivial estimate of the -wave neutron emission on the 5H(g.s.) threshold made by Eq. (5). For the states with and 6.8 MeV the corresponding width values 3 and 5.5 MeV are obtained. One may see that in proximity of the 5H(g.s.)- threshold the width provided by the 4-body expression (3) differs qualitatively from that evaluated by (5). At higher energies the difference becomes not so large. The 4-body expression provides result which is somewhat smaller than the 2-body one (some part of the 5H continuum strength described by a broad state remains outside the 6H decay energy window).

One should also note that the 6H g.s. may have quite low spectroscopic factor of the +5H(g.s.) configuration. This idea comes as analogy with the 7He g.s. situation, which can also be seen as a hole in the neutron subshell from the shell model point of view. The respective neutron spectroscopic factors of are typically derived or predicted for the 7He g.s. (e.g. Renzi et al. 2016; Fortune 2018, and Refs. therein). Therefore, the widths provided in Fig. 16 are expected to be the upper limit estimates for the widths, and one cannot exclude that the actual widths of the 6H resonant states are much smaller. The widths may be around MeV, as assumed in Fig. 12 (c,d).
IV.1 Energy distributions of the decay products
Though Eq. (3) can be seen as a very simplistic model of the emission in 6H, it may provide some exclusive information, never considered carefully before: the energy distributions of the decay products of 6H may be calculated for more complicated dynamical assumptions than phase volume.
For these calculations an additional input is required: the energy distribution 3H++ inside the 5H subsystem. Here we employ the following three qualitatively different model distributions.
(i) “3-b. p.v.” — three-body phase volume assumption about the decay of the 5H g.s. (the standard uncorrelated assumption).
(ii) “realistic” — the 5H g.s. energy distribution inspired by the experimental data Golovkov et al. 2005.
(iii) “dineutron” — the highly correlated dineutron decay of the 5H ground state.
These cases are illustrated in Fig. 15 (a). It should be understood, what the above mentioned “inspired by experiment” assumption means: the energy distribution for 5H was reconstructed in Golovkov et al. 2005 in the energy range around the g.s. position (see Figs. 10 and 11 in Golovkov et al. 2005). However, it is demonstrated in Golovkov et al. 2005 that the contribution of the broad doublet of excited 5H states (located around MeV) is large or even dominant in the 5H g.s. energy region ( MeV). For that reason we can only guess or try to predict theoretically Shul’gina et al. 2000; Grigorenko et al. 2004; Grigorenko 2004 what is the actual 5H g.s. decay energy distribution.
| Models: | 4-body p.v. | 3-body p.v. | realistic | dineutron | experiment | |||||
|---|---|---|---|---|---|---|---|---|---|---|
| ranges (MeV) | th. | bias | th. | bias | th. | bias | th. | bias | 4He-3H | 4He-3H- |
| 1/3 | 0.30 | 0.29 | 0.28 | 0.33 | 0.30 | 0.43 | 0.39 | 0.42(3) | 0.49(7) | |
| 1/3 | 0.28 | 0.27 | 0.24 | 0.31 | 0.26 | 0.39 | 0.33 | 0.33(2) | 0.24(8) | |
By using the inputs from Figs. 14 and 15 we obtain the energy distributions of the neutrons and 3H fragments in the 6H rest frame, see Fig. 17 and Fig. 18, respectively. The estimated neutron distributions all have a pronounced bimodal shape connected with the assumed sequential 6HH(g.s.)+H+ mechanism of the decay. Unfortunately, the single-neutron distribution is relatively weakly sensitive to the decay mechanism of 5H, and the energy resolution of the neutron spectrum in Fig. 11 is not sufficient to make practical use of this information. In contrast, the 3H energy distribution demonstrates strong sensitivity to the correlations in the 5H intermediate system.

To make the above considerations quantitative, the 3H energy distributions of Figs. 18 (a,b) were used in MC simulations, which allowed us to take into account the bias of our experimental setup. The resulting distributions are shown in Figs. 18 (c,d), and the numerical information about the 3H energy distributions is provided in Table 2.

The experimental energy distributions for the 3H fragment in the 6H c.m. system for the 4He-3H and 4He-3H- coincidence events are shown in Fig. 18 (e,f). These distributions are consistent with each other within the available statistics in the energy ranges MeV and MeV. One may conclude from Fig. 18 and Table 2 that the preferable interpretation of the data suggests the extremely correlated emission of two neutrons from the 5H(g.s.) intermediate system.
V Discussion
In this Section we are going further argument that the 6.8 MeV bump and cross section rise at 4.5 MeV are likely to represent the actual ground and first excited state (states), while the 2.6 MeV ground state, which is broadly accepted now in the literature, has actually a very limited experimental support.
V.1 Does the 2.6 MeV state exist in the 6H?
The vision that the 2.6 MeV ground state energy of 6H is solidly established is quite widespread. We have to point here that this misleading impression is partly supported by some problem of data representation in the NNDC database. Namely, in NNDC page for the 6H level scheme one gets information that the ground state population was taking place in all the five available reactions — three in papers Aleksandrov et al. 1984; Belozyorov et al. 1986; Caamaño et al. 2008 and two in Gurov et al. 2007. Such a broad experimental support may look impressive. However, if one opens the corresponding evaluation pdf files at NNDC www for the 6H population in pion absorption reactions “B” and “D” (based on Ref. Gurov et al. 2007), then it is easy to find out that the presumed 6H g.s. at 2.6 MeV is actually not populated in these reactions. The lowest-energy state, as obtained in this work, has energies 6.6(7) MeV for the 9Be(,H reaction and 7.3(10) MeV for the 11B(,HeH reaction. These values are evidently in a nice agreement with our 6.8(5) MeV bump.
The spectra shown in Ref. Gurov et al. 2007 have good statistics (thousands of events), comparable to statistics obtained in our experiment. The shapes of the MM spectra are qualitatively the same as our MM spectrum: the energy region under MeV is poorly populated; then, there is a kink or bump in the spectra at about MeV; at higher energy the spectrum is reasonably flat. Actually, two reasonably consistent sets of excited states are additionally claimed in Ref. Gurov et al. 2007: , , MeV, populated in the 9Be(,H reaction, and , MeV states populated in the 11B(,HeH reaction. We observe some oscillation in this energy range in our spectrum with statistical significance analogous to that of Ref. Gurov et al. 2007; however, we consider this statistical significance as insufficient to claim additional states in the spectrum of 6H.
The studies of the 6Li(,)6H reaction provided no evidence for low-lying resonant states of 6H Parker et al. 1990; Seth and Parker 1991. The authors performed the dedicated search for the 2.6 MeV ground state and found that “… In the missing mass region MeV confidence upper limits of nb/sr for the production cross section were set.” This limit should be compared to the typical expected 6H g.s. population cross section of nb/sr for this reaction. If we look directly at the missing mass spectrum of the 6Li(,H reaction in Parker et al. 1990, then some evidence for a kink in the spectrum can be seen at MeV, where the typical resonant population cross section of nb/sr is achieved. So, this data can be seen as being in qualitative agreement with our result: there is no expressed bump in the cross section, but the typical resonant cross section is achieved at energies consistent with our MeV value.
Let’s now have some critical review of the experiments in which the 2.6 MeV g.s. was observed.
The 6H resonant state was reported for the first time in Ref. Aleksandrov et al. 1984. It gives the g.s. energy MeV for the 6H state produced in the 7Li(7Li,8B)6H reaction. Actually a broad structure with MeV is observed, which statistically is quite convincing ( events). The data is strongly contaminated with various backgrounds ( in the region of resonance bump, according to Aleksandrov et al. 1984). Mechanism of this reaction is a complicated “bidirectional” transfer . Now we can point that 7Li(7Li,H(g.s.) can be responsible for the formation of this bump, where the excited states located somewhat above the 8B+ threshold are populated (for example, the or 20.7 MeV states). This is the much “easier” reaction (just transfer) and something like an order of the magnitude higher population cross section may be expected for it. The authors of Aleksandrov et al. 1984 avoided this interpretation, as “… the 5H nucleus is known not to exist”. Now the low-lying resonant g.s. of 5H with MeV is solidly established and its population seem to be very favourable scenario for this reaction.
The MeV bump was claimed to be observed in the 9Be(11B,14O)6H reaction in Ref. Belozyorov et al. 1986. There are problematic issues concerning this experiment. (i) Marginal statistics and large backgrounds ( events are spread on the top of of expected background events). (ii) The obtained events are actually spread in a much narrower energy range MeV than in Aleksandrov et al. 1984. Point (ii) is probably partly connected with fact that the kinematical cut-off for the 9Be(11B,14O)6H reaction in Belozyorov et al. 1986 is taking place at MeV leading to unknown strong distortions of the MM spectrum in the region of expected 6H resonance peak. (iii) The ground state of the neighboring 5H nuclide was not observed in Ref. Belozyorov et al. 1986 in the analogous 9Be(11B,15O)5H reaction (otherwise providing on average a reliable 10-fold larger statistics than 6H data).
The 6H g.s. energy of MeV was claimed in Caamaño et al. 2008 basing on the events which could originate from the 8He(12C,14N)6H reaction. The problem is that there was no channel identification in Caamaño et al. 2008, which can reliably distinguish among the 12N, 13N, and 14N recoils, and, consequently, among the 7H, 6H, and 5H products. Assignment for each of these products was solely based on assumption that only the low-lying near-threshold ground state is populated in each case. Specifically for 6H in Caamaño et al. 2008 there are five events spread from 0 to 7.5 MeV excitation in the MM spectrum and only three events located between 1.5 to 5.5 MeV were assigned as belonging to 6H g.s. resonance. This kind of data, taken without interpretation, actually can be considered as not contradicting to our data.
So, we can see that the MeV state has very questionable support in experimental data. All the experiments Aleksandrov et al. 1984; Belozyorov et al. 1986; Caamaño et al. 2008 in which it was observed have important experimental problems (statistical significance, channel identification, etc.). In contrast, in experiments with large statistics, clear channel identification and background treatment (Refs. Parker et al. 1990; Gurov et al. 2007 and our data) one gets the first expressed lowest-energy feature at MeV. It is, of course, not impossible, that the MeV state was specifically poorly populated in the reactions of Ref. Parker et al. 1990; Gurov et al. 2007 and our reaction. However, such suggestion is quite unnatural, as there should be several excited states of 6H (all populated by the same as the ground state) within several MeV of excitation. All of them are expected to be populated comparably with the ground state, while here we find the 6.8 MeV bump, having typical for direct single-step transfer reactions cross sections (e.g. b/sr in our reaction).
We suggest to consider the location of 6H g.s. as an open question and provide below some theoretical arguments supporting the g.s. prescription based on the data of our work.
V.2 Analogies among He and H excitation spectra
Let us consider the energy level evolution from 5He (with the assumed configuration of one neutron particle in the subshell) to 7He (one neutron hole in the subshell), see Figure 19. The ground state of 7He becomes more bound, than that in 5He. The experimental status of the state in 7He is not well established (see e.g. Renzi et al. 2016), however, it seems to have higher excitation energy than the state in 5He. Moreover, it is highly likely that there is the state in 7He, built on the excitation of 6He Korsheninnikov et al. 1999; Wuosmaa et al. 2008, which, evidently, has no counterpart in 5He.

If we consider evolution from 5He to 4H, than the spin-orbit doublet is replaced by a quadruplet of states due to split induced by the 3H spin. If we extend the 5He-7He analogy of Fig. 19 to the 6H states, then two effects are expected.
(i) Following the 7He vs. 5He analogy, we expect that the 6H g.s. is more bound than the 4H ground state. This assumption is true if the 4.5 MeV state really exists in 6H.
(ii) In the range MeV we expect six states of 6H. So, it is highly likely that the broad 6.8 MeV structure is actually a superposition of several overlapping states, which are populated in unknown proportions and could not be resolved in the inclusive (no correlation) experiment. It still makes sense to distinguish the 4.5 MeV state, as the lowest energy resonance, which is allowed by our data, and, thus, is a candidate to represent the 6H ground state.
V.3 Paring energy
As we have mentioned in Introduction, the 6H g.s. position was suggested to be at MeV in Refs. Aleksandrov et al. 1984; Belozyorov et al. 1986; Caamaño et al. 2008. However, now the g.s. energies are known for 5H ( MeV Korsheninnikov et al. 2001; Golovkov et al. 2005; the MeV value from Wuosmaa et al. 2017 is practically consistent with this value) and 7H ( MeV Muzalevskii et al. 2021; we regard the MeV value from Caamaño et al. 2008 as much less reliable). Based on these values, the energy reported in Aleksandrov et al. 1984; Belozyorov et al. 1986; Caamaño et al. 2008 for the 6H ground state, would mean the lack of the neutron pairing effect in the even-neutron nucleus 7H (experimental paring energy appears to be MeV compared with MeV expected in analogy with the 7He-8He pair). Hence, we conclude that the results reported in Refs. Aleksandrov et al. 1984; Belozyorov et al. 1986; Caamaño et al. 2008 are not compatible with the standard pairing assumption. The 6H ground state suggested in this work at MeV precisely fits the pairing energy systematics.
V.4 Strong correlation observed in pion double charge exchange
The search for 6H in the 6Li(,) reaction provided no g.s. identification in the MeV range Parker et al. 1990. However, the authors have pointed in a dedicated paper Seth and Parker 1991 that the peculiar behavior of the low-energy 6H missing mass spectrum can be understood as connected with the presence of strongly correlated configuration in the 6H continuum considered as 3H++. We should emphasize that this observation is actually consistent with the observation of the strong - correlation in the 6H decay made in this work, and in 5H decay in Ref. Golovkov et al. 2005.
VI Conclusions
The 6H spectrum was populated in this work in the H transfer reaction. The broad bump in the 6H MM spectrum at MeV is reliably identified in the data with the population cross section b/sr in the angular range. This is reasonably large cross section, consistent with the resonant population mechanism. This bump can be interpreted as a broad ( MeV) resonant state at MeV. Actually this could be either a single state or a set of broad overlapping -wave states, as expected from analogy with the known 4H spectrum. Observation of such a states(s) is consistent with the data of Ref. Gurov et al. 2007, concerning the lowest 6H state.
We have found no evidence of the MeV state in 6H, which was reported in the pioneering work Aleksandrov et al. 1984 and has got support in Belozyorov et al. 1986; Caamaño et al. 2008. The cross section limit b/sr is set for the population of possible states with MeV. Also the existence of the 6H g.s. at MeV is hardly consistent, due to the pairing energy argument, with the observation of the 7H g.s. at 2.2(5) MeV Muzalevskii et al. 2021. There is no sensible structural argument explaining why the population of the possible MeV ground state could be suppressed in a very “simplistic” H transfer reaction and not observed in our data, while the 6H spectrum at MeV is well populated. Therefore, we suggest that position of the 6H g.s. is not yet established, and discussion of this issue should be continued.
The broad bump in the 6H MM spectrum at MeV can also be interpreted as overlap of two relatively narrow states. Such an interpretation of the experimental spectrum allows us to establish MeV, as the low-energy limit for the 6H ground state energy admissible by our data. According to the energy systematics and the paring energy arguments, resonance with such an energy is a good candidate for the 6H ground state.
The low-energy limit of the 6H g.s. position, established as MeV, confirms that the decay mechanism of the 7H g.s. (located at 2.2 MeV above the 3H+ threshold Muzalevskii et al. 2021) is the “true” (or simultaneous) emission. Thus, the 7H is the first confirmed case of nucleus possessing this exclusive few-body dynamics of decay.
The momentum distribution of the 3H decay fragments was reconstructed in the 6H rest frame. In this work the theoretical studies of the four-body sequential 6HH(g.s.)+H+ decays were performed for the first time. Within the assumption of the 6H sequential decay we have found that our data provide evidence that an extremely strong “dineutron-type” correlation is realized in the decay of the 5H ground state. More accurate measurements are needed for more solid conclusions. However, a potentially powerful approach for extracting information about the nuclear decay dynamics is already illustrated in our work.
It is clear that our work paves a way to more detailed studies of the H reaction, which would be able to provide unequivocal results on the excitation spectrum of 6H.
Acknowledgements.
This work was partly supported by the Russian Science Foundation grant No. 22-12-00054. I.A.M. was supported by the Student Grant Foundation of the Silesian University in Opava, Grant No. SGF/2/2020, which was realized within the EU OPSRE project entitled “Improving the quality of the internal grant scheme of the Silesian University in Opava”, No. CZ. The authors are grateful to Prof. M.S. Golovkov for help in the work and useful remarks. We acknowledge the interest and support of this activity from Profs. Yu.Ts. Oganessian and S.N. Dmitriev.References
- Bezbakh et al. (2020) A. A. Bezbakh, V. Chudoba, S. A. Krupko, S. G. Belogurov, D. Biare, A. S. Fomichev, E. M. Gazeeva, A. V. Gorshkov, L. V. Grigorenko, G. Kaminski, O. A. Kiselev, D. A. Kostyleva, M. Y. Kozlov, B. Mauyey, I. Mukha, I. A. Muzalevskii, E. Y. Nikolskii, Y. L. Parfenova, W. Piatek, A. M. Quynh, V. N. Schetinin, A. Serikov, S. I. Sidorchuk, P. G. Sharov, R. S. Slepnev, S. V. Stepantsov, A. Swiercz, P. Szymkiewicz, G. M. Ter-Akopian, R. Wolski, B. Zalewski, and M. V. Zhukov, Phys. Rev. Lett. 124, 022502 (2020).
- Muzalevskii et al. (2021) I. A. Muzalevskii, A. A. Bezbakh, E. Y. Nikolskii, V. Chudoba, S. A. Krupko, S. G. Belogurov, D. Biare, A. S. Fomichev, E. M. Gazeeva, A. V. Gorshkov, L. V. Grigorenko, G. Kaminski, O. Kiselev, D. A. Kostyleva, M. Y. Kozlov, B. Mauyey, I. Mukha, Y. L. Parfenova, W. Piatek, A. M. Quynh, V. N. Schetinin, A. Serikov, S. I. Sidorchuk, P. G. Sharov, N. B. Shulgina, R. S. Slepnev, S. V. Stepantsov, A. Swiercz, P. Szymkiewicz, G. M. Ter-Akopian, R. Wolski, B. Zalewski, and M. V. Zhukov, Phys. Rev. C 103, 044313 (2021).
- Aleksandrov et al. (1984) D. Aleksandrov, E. Ganza, Yu.A.Glukhov, B.G.Novatsky, A.A.Ogloblin, and D.N.Stepanov, Yad. Fiz. 39, 513 (1984).
- Belozyorov et al. (1986) A. Belozyorov, C. Borcea, Z. Dlouhy, A. Kalinin, R. Kalpakchieva, N. H. Chau, Y. Oganessian, and Y. Penionzhkevich, Nuclear Physics A 460, 352 (1986).
- Parker et al. (1990) B. Parker, K. K. Seth, and R. Soundranayagam, Physics Letters B 251, 483 (1990).
- Seth and Parker (1991) K. K. Seth and B. Parker, Phys. Rev. Lett. 66, 2448 (1991).
- Gurov et al. (2007) Y. Gurov, B. Chernyshev, S. Isakov, V. S. Karpukhin, S. Lapushkin, I. V. Laukhin, V. A. Pechkurov, N. O. Poroshin, and V. Sandukovsky, The European Physical Journal A 32, 261 (2007).
- Caamaño et al. (2008) M. Caamaño, D. Cortina-Gil, W. Mittig, H. Savajols, M. Chartier, C. E. Demonchy, B. Fernández, M. B. G. Hornillos, A. Gillibert, B. Jurado, O. Kiselev, R. Lemmon, A. Obertelli, F. Rejmund, M. Rejmund, P. Roussel-Chomaz, and R. Wolski, Phys. Rev. C 78, 044001 (2008).
- Korsheninnikov et al. (2001) A. A. Korsheninnikov, M. S. Golovkov, I. Tanihata, A. M. Rodin, A. S. Fomichev, S. I. Sidorchuk, S. V. Stepantsov, M. L. Chelnokov, V. A. Gorshkov, D. D. Bogdanov, R. Wolski, G. M. Ter-Akopian, Y. T. Oganessian, W. Mittig, P. Roussel-Chomaz, H. Savajols, E. A. Kuzmin, E. Y. Nikolskii, and A. A. Ogloblin, Phys. Rev. Lett. 87, 092501 (2001).
- Golovkov et al. (2004) M. S. Golovkov, L. V. Grigorenko, A. S. Fomichev, S. A. Krupko, Y. T. Oganessian, A. M. Rodin, S. I. Sidorchuk, R. S. Slepnev, S. V. Stepantsov, G. M. Ter-Akopian, R. Wolski, M. G. Itkis, A. A. Bogatchev, N. A. Kondratiev, E. M. Kozulin, A. A. Korsheninnikov, E. Y. Nikolskii, P. Roussel-Chomaz, W. Mittig, R. Palit, V. Bouchat, V. Kinnard, T. Materna, F. Hanappe, O. Dorvaux, L. Stuttgé, C. Angulo, V. Lapoux, R. Raabe, L. Nalpas, A. A. Yukhimchuk, V. V. Perevozchikov, Y. I. Vinogradov, S. K. Grishechkin, and S. V. Zlatoustovskiy, Phys. Rev. Lett. 93, 262501 (2004).
- Golovkov et al. (2005) M. S. Golovkov, L. V. Grigorenko, A. S. Fomichev, S. A. Krupko, Y. T. Oganessian, A. M. Rodin, S. I. Sidorchuk, R. S. Slepnev, S. V. Stepantsov, G. M. Ter-Akopian, R. Wolski, M. G. Itkis, A. S. Denikin, A. A. Bogatchev, N. A. Kondratiev, E. M. Kozulin, A. A. Korsheninnikov, E. Y. Nikolskii, P. Roussel-Chomaz, W. Mittig, R. Palit, V. Bouchat, V. Kinnard, T. Materna, F. Hanappe, O. Dorvaux, L. Stuttgé, C. Angulo, V. Lapoux, R. Raabe, L. Nalpas, A. A. Yukhimchuk, V. V. Perevozchikov, Y. I. Vinogradov, S. K. Grishechkin, and S. V. Zlatoustovskiy, Phys. Rev. C 72, 064612 (2005).
- Fomichev et al. (2018) A. S. Fomichev, L. V. Grigorenko, S. A. Krupko, S. V. Stepantsov, and G. M. Ter-Akopian, The European Physical Journal A 54, 97 (2018).
- Kaminski et al. (2020) G. Kaminski, B. Zalewski, S. Belogurov, A. Bezbakh, D. Biare, V. Chudoba, A. Fomichev, E. Gazeeva, M. Golovkov, A. Gorshkov, L. Grigorenko, D. Kostyleva, S. Krupko, I. Muzalevsky, E. Nikolskii, Y. Parfenova, P. Plucinski, A. Quynh, A. Serikov, S. Sidorchuk, R. Slepnev, P. Sharov, P. Szymkiewicz, A. Swiercz, S. Stepantsov, G. Ter-Akopian, and R. Wolski, Nuclear Instruments and Methods in Physics Research Section B: Beam Interactions with Materials and Atoms 463, 504 (2020).
- Bezbakh et al. (2018) A. A. Bezbakh, S. G. Belogurov, R. Wolski, E. M. Gazeeva, M. S. Golovkov, A. V. Gorshkov, G. Kaminski, M. Y. Kozlov, S. A. Krupko, I. A. Muzalevky, E. Y. Nikolskii, E. V. Ovcharenko, R. S. Slepnev, G. M. Ter-Akopian, A. S. Fomichev, P. G. S. V. Chudoba, and V. N. Schetinin, Instruments and Experimental Techniques 61, 631 (2018).
- (15) NNDC database: http://www.nndc.bnl.gov/ .
- Grigorenko and Zhukov (2007) L. V. Grigorenko and M. V. Zhukov, Phys. Rev. C 76, 014009 (2007).
- Grigorenko et al. (2009) L. V. Grigorenko, T. D. Wiser, K. Mercurio, R. J. Charity, R. Shane, L. G. Sobotka, J. M. Elson, A. H. Wuosmaa, A. Banu, M. McCleskey, L. Trache, R. E. Tribble, and M. V. Zhukov, Phys. Rev. C 80, 034602 (2009).
- Olsen et al. (2013) E. Olsen, M. Pfützner, N. Birge, M. Brown, W. Nazarewicz, and A. Perhac, Phys. Rev. Lett. 110, 222501 (2013).
- Brown et al. (2015) K. W. Brown, R. J. Charity, L. G. Sobotka, L. V. Grigorenko, T. A. Golubkova, S. Bedoor, W. W. Buhro, Z. Chajecki, J. M. Elson, W. G. Lynch, J. Manfredi, D. G. McNeel, W. Reviol, R. Shane, R. H. Showalter, M. B. Tsang, J. R. Winkelbauer, and A. H. Wuosmaa, Phys. Rev. C 92, 034329 (2015).
- Grigorenko and Zhukov (2015) L. V. Grigorenko and M. V. Zhukov, Phys. Rev. C 91, 064617 (2015).
- Renzi et al. (2016) F. Renzi, R. Raabe, G. Randisi, D. Smirnov, C. Angulo, J. Cabrera, E. Casarejos, T. Keutgen, A. Ninane, J. L. Charvet, A. Gillibert, V. Lapoux, L. Nalpas, A. Obertelli, F. Skaza, J. L. Sida, N. A. Orr, S. I. Sidorchuk, R. Wolski, M. J. G. Borge, and D. Escrig, Phys. Rev. C 94, 024619 (2016).
- Fortune (2018) H. T. Fortune, Eur. Phys. J. A 54, 51 (2018).
- Shul’gina et al. (2000) N. B. Shul’gina, B. V. Danilin, L. V. Grigorenko, M. V. Zhukov, and J. M. Bang, Phys. Rev. C 62, 014312 (2000), 4 pages.
- Grigorenko et al. (2004) L. V. Grigorenko, N. K. Timofeyuk, and M. V. Zhukov, Eur. Phys. J. A 19, 187 (2004).
- Grigorenko (2004) L. V. Grigorenko, Eur. Phys. J. A 20, 419 (2004).
- Korsheninnikov et al. (1999) A. A. Korsheninnikov, M. S. Golovkov, A. Ozawa, E. A. Kuzmin, E. Y. Nikolskii, K. Yoshida, B. G. Novatskii, A. A. Ogloblin, I. Tanihata, Z. Fulop, K. Kusaka, K. Morimoto, H. Otsu, H. Petrascu, and F. Tokanai, Phys. Rev. Lett. 82, 3581 (1999).
- Wuosmaa et al. (2008) A. H. Wuosmaa, J. P. Schiffer, K. E. Rehm, J. P. Greene, D. J. Henderson, R. V. F. Janssens, C. L. Jiang, L. Jisonna, J. C. Lighthall, S. T. Marley, E. F. Moore, R. C. Pardo, N. Patel, M. Paul, D. Peterson, S. C. Pieper, G. Savard, R. E. Segel, R. H. Siemssen, X. D. Tang, and R. B. Wiringa, Phys. Rev. C 78, 041302 (2008).
- Wuosmaa et al. (2017) A. H. Wuosmaa, S. Bedoor, K. W. Brown, W. W. Buhro, Z. Chajecki, R. J. Charity, W. G. Lynch, J. Manfredi, S. T. Marley, D. G. McNeel, A. S. Newton, D. V. Shetty, R. H. Showalter, L. G. Sobotka, M. B. Tsang, J. R. Winkelbauer, and R. B. Wiringa, Phys. Rev. C 95, 014310 (2017).