∎
A numerical characterisation of unconfined strength of weakly consolidated granular packs and its effect on fluid-driven fracture behaviour.
Abstract
Soft or weakly-consolidated sand refers to porous materials composed of particles (or grains) weakly held together to form a solid but that can be easily broken when subjected to stress. These materials do not behave as conventional brittle, linear elastic materials and the transition between these two regimes cannot usually be described using poro-elastic models. Furthermore, conventional geotechnical sampling techniques often result in the destruction of the cementation and recovery of sufficient intact core is, therefore, difficult. This paper studies a numerical model that allows us to introduce weak consolidation in granular packs. The model, based on the open source project, simply adds an attractive contribution to particles in contact. This simple model allow us to reproduce key elements of the behaviour of the stress observed in compacted sands and clay, as well as in poorly consolidated sandstones. The paper finishes by inspecting the effect of different consolidation levels in fluid-driven fracture behaviour. Numerical results are compared against experimental results on bio-cemented sandstones.
Keywords:
Soft Sand, Fracturing, Flow channels, Resolved CFD-DEM, unconfined compressive strength, Bio-cemented sandstones1 Introduction
Soft sands are granular materials in which particles are weakly held together resulting in very low stiffness. Mechanisms that hold particles together include weak grain-to-grain cementation, external compressing forces and the physical interlocking arising from the irregular shape of the grains. Many engineering applications, such as groundwater remediation, slope stabilisation, hydrocarbon extraction, or in situ leaching from mining, involve soft-sands and thus, the ability to predict their response to fluid injection is of great importance.
These materials usually have low unconfined compressive strength and high permeability, although the literature lacks precise definitions for these ranges. They are intermediate between soils and rocks, sharing common characteristics with both Collins2009; Sitar1980. Therefore, their behaviour is expected to be in-between sand and competent sandstone Nakagawa. An encompassing description for them is poorly-consolidated weakly-cemented sandstones: They have low strength and stiffness, poor core integrity and stress dependent porosity and permeability.
Experimental evidence has shown that fluid-driven fractures in soft sands are often shaped as flow channels (narrow paths presenting higher permeability than the matrix) with some degree of branching huang2012granular; johnsen2006pattern; Konstantinou2020b; chang2004hydraulic; Chang2003. Elasto-plastic deformation likely plays a significant role in soft sand fracture initiation and propagation. Although it is frequently assumed that shear mechanisms dominate the fracture tip dynamics, it is not clear whether tensile fracturing takes place. The mode of failure is particularly important as it is seen to describe the fracturing behaviour. In cohesionless sands, tensile stress cannot be transmitted and therefore failure shear occurs, however in soft rocks of low strength, dislocation of particles along with pure fractures might take place. Some authors, identified this and linked the mode of failure with the unconfined compressive strength (UCS) of the host rock Olson2011. It is therefore particularly important to test materials across various strengths in order to examine this transition in behaviour from pure shear failure to pure tensile failure. The research on this topic remains very limited. The majority of the aforementioned studies makes use of cohesionless sand zhang2013coupled; johnsen2006pattern; huang2012granular; Chang2003; chang2004hydraulic; Pater2007; Dong2010; Dong2008; Xu2010; Konstantinou2020b whose “softness” derives from inter-locking due to the particle shape, without cementation between the grains.
Contrary to the case of rock specimens, with virtually limitless quantities of a material for testing purposes, of any shape and size, obtaining soft rocks samples is particularly challenging: Conventional geotechnical sampling techniques often result in destruction of the cementation and recovery of sufficient intact core is, therefore, difficult. In addition, material properties are expected to change upon chemical and mechanical degradation. As a consequence, good information about the stress-strain behaviour is rare Sitar1980. The task of generating artificial specimens that closely resemble the engineering properties of natural geological formations has been central in the fields of soil and rock mechanics Maccarini1987; Wygal1963; Vogler2017; Whiffin2004; Konstantinou2020b; Konstantinou2020.
Konstantinou et al. Konstantinou2020, used a bio-cementation technique termed as microbially induced carbonate precipitation () to generate artificially cemented rocks with mechanical and physical properties closely resembling those of natural weakly cemented carbonate sandstones. Those properties were well defined and reproducible. This technique involves the use of urease-producing bacterial strains which are flushed through the granular material together with a cementation solution supply consisting of urea and a calcium source. As a result, calcium carbonate precipitates bonding the particles Whiffin2004; DeJong2006. The method allows for control of the cementation level and, therefore, materials of various strengths can be produced. The preparation of such samples is, nevertheless, time consuming and weaker samples are harder to obtain because of practical limitations such as disaggregation at the grain scale during extraction from the molds.
This paper uses a discrete element method () to model soft sands/poorly consolidated sandstones. The model, although simple, successfully reproduces key elements characteristic of fracture development in these materials. Numerical results are compared against those obtained experimentally via .
The structure of this work is as follows: Section 2 presents the experimental technique and the main experimental observations relevant to the present study. The numerical model is described in Sec. 3. Section 4, addresses the preparation of the “numerical” probes and the results for the stress-strain tests on them. The results are discussed in the context of the information provided by the experimental evidence. To finish, preliminary results of the effect of the consolidation on the hydraulic fracture response of these materials (Sec. 5) is analysed.
2 Bio-cemented sandstones
The experimental samples used in this work are weakly cemented carbonate sandstones. They were created using microbially induced carbonate precipitation () following the experimental protocol presented in Konstantinou2020; Konstantinou2020b. The authors have conducted a parametric study to characterise the engineering properties of these bio-treated products across a range of cementation levels (from about to mass concentration of calcium carbonate). The main properties considered are unconfined compressive strength () and porosity.
The tests were performed on oven-dried cylindrical specimens (diameter of mm, height mm) across various cementation levels. The base material used for these experiments was a uniformly graded coarse sand with an average particle size of mm (), for which there is very limited data in the literature as most studies use fine graded sands. The samples were prepared and tested according to Measurements2004. The loading was displacement-controlled with a rate of mm/min. Examples of stress strain curves obtained for low and high cementation levels are shown in Fig. 1 (a).


Figure 1 (b-c) shows the characteristic modes of failures obtained during unconfined compression tests. At very low cementations (up to 3 %, corresponding to UCSs of less than 200 kPa) the specimens disaggregated at the grain scale during the compression test because they were very weak. For cementation levels of 3% to 8%, corresponding to UCS values of to kPa, the specimens showed a characteristic axial splitting mode. At degrees of cementation above 8%, shearing along a single plain was evident.
Figure 2 shows a microCT image for an sample. The distribution of the cementation within the granular network and the location of the carbonate crystals on the grain surfaces can be observed. The enhancement of strength is attributed to the amount of cementation that is present at the contact points between particles. This is because the strength is transmitted to the particles via those contact points, and any addition of carbonate crystals results in a higher strength at the macro-scale level. The carbonate crystals themselves appear to be of the same size, much smaller compared to the size of the grains; however, they accumulate as the amount of cementation increases generating clusters. A detailed discussion on this is presented by Konstantinou2020; Konstantinou2020b.

Figure 3 shows the behaviour of the unconfined compressive strength () of the bio-cemented coarse sands as a function of the calcium carbonate in the sample Konstantinou2020b; Konstantinou2020.

The varies from about kPa to kPa, which is a similar range to that found in natural weakly cemented sandstones reported in the literature. The lower boundary of this range is, nevertheless, still uncertain, as weaker samples are harder to obtain, because of practical limitations.
3 Numerical model
We use the molecular dynamics of soft-spheres, discrete element method () model, provided by the goniva2012influence open source project. It implements a Hertz potential brilliantov1996model to model a “repulsive” force (due to volume exclusion) between two particles in contact and a simplified Johnson-Kendall-Roberts () johnson1971surface; johnson1996continuum to model particle-particle cohesion (adhesion). The normal component of the repulsive force has a restoring term (that depends on , with the linear overlap between the particles) and a dissipative term (proportional to the normal component of the relative velocity). The tangential component also implements an elastic shear force, with a “history” effect that accounts for the tangential displacement between the particles during the time they are in contact, and a damping/viscous force, proportional to the tangential component of the relative velocity. The tangential (frictional) force is limited using , where is the friction coefficient.
The “cohesive” component, consists of adding an attractive normal force to hold together two particles in contact. Here is the cross sectional area of the overlap between the particles and (in units of Pa) is called the cohesion energy density. This will be the control parameter for varying the system strength throughout this paper.
For a static sample (particle velocities equal to zero) the normal force for two particles in contact can then be written as:
| (1) |
where is the linear overlap between the two particles in contact, (Nm-2) is the Young’s modulus, () is the Poisson’s ratio. The model also uses a friction coefficient and a restitution coefficient . The low value selected for the restitution coefficient helps to reach a static configuration sooner (by dissipating energy faster), but it does not affect the system dynamics. (Details of the model implementation can be found at SKRL.)
It is possible to see that this can reach positive (cohesion dominant) and negative (compression dominant) values, and that there will be an inter-play between the “stress” and cohesion in the system (and that will be discussed in Sec. 5).
4 Stress-strain test
The grains are spheres with diameters distributed as a truncated Gaussian distribution (mm with mean diameter mm and a standard deviation mm.)
Cylinders of cm height and cm diameter (formed by grains) were constructed to perform the stress-strain tests. The protocol followed to create these probes is presented in Fig. 4.
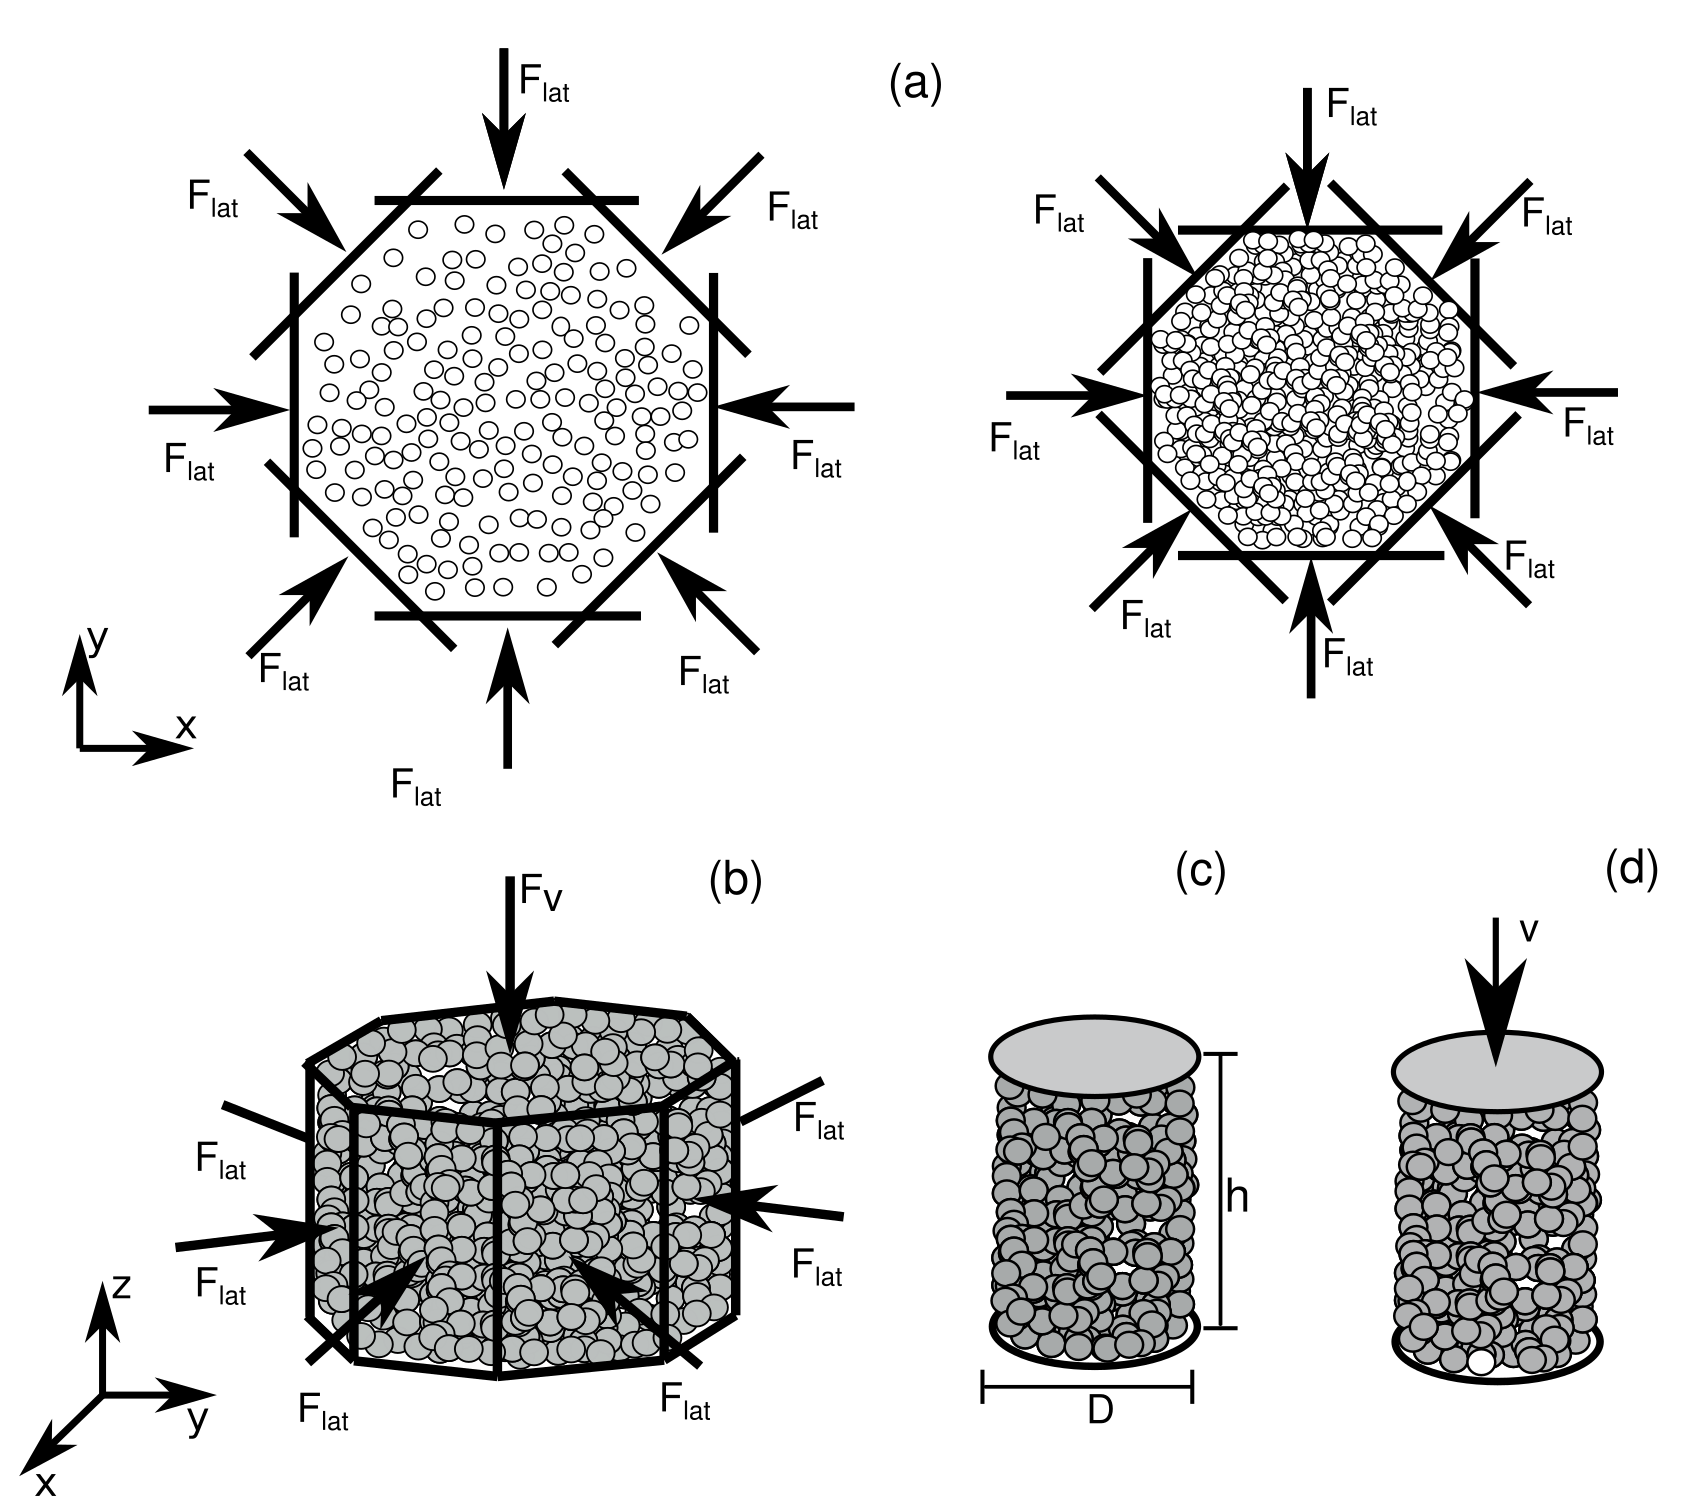
Initially, a loose configuration of spherical, non-cohesive () grains, is placed between two parallel plates separated by a constant distance (cm) in the vertical () direction. These grains are laterally compressed (in the plane) using piston-like walls applying a constant lateral force until a mechanically stable configuration is reached (Fig. 4 (a)). This methodology was chosen to reduce stress anisotropy and minimise the creation of preferential stress directions in the system. Once a mechanically stable configuration is reached, “cementation” is incorporated to the system by setting a value to the parameter . During this step the piston-like walls keep applying and the upper wall applies a constant vertical force (N) (Fig. 4 (b)). The system is allowed to relax under this condition until a new equilibrium state is achieved. All lateral walls are removed at this stage and a cylindrical core of cm diameter is obtained by “deleting” particles outside that region (Fig. 4 (c)).
The system is again allowed to relax before the stress-strain test starts. For the test, the upper horizontal wall moves at a constant speed (mms-1) (Fig. 4 (d)), inducing deformation to the probe. The force acting on the wall due to the grains is measured and plotted against the strain (with being the time in seconds).
Each complete test takes, depending on the cementation level of the sample (), between one to three days (running on processors on Imperial College Research Computing Service (see DOI: 10.14469/hpc/2232)). It is worth noting that this limitation in computational time, was chosen about ten times faster than that recommended in the literature Measurements2004 and results may be slightly affected by this. In order to achieve lower strength levels, consistent with subsurface situations but hard to achieve experimentally, gravity was not considered, preventing that the sample breaks under its own weight.
Figure 5 shows, in the left column, the characteristic stress-strain curves for three different degrees of cementation (increasing from bottom to top). The same figure shows, in the right column, the fracture behaviour for the corresponding probes.

Key elements observed experimentally, are presented in these results. One such behaviour is the effect known as post-peak strain softening. It can be observed in Fig. 5 (c) (and to a smaller extent in Fig. 5 (b)), as a soft decay in the stress supported for the system after the maximum strength value is achieved. This behaviour has been reported as characteristic of cemented soils and clayriman2014predicting; abdulla1997behavior and attributed to the re-orientation of the sliding surfaces creating a residual shear strength (the lowest possible) culshaw2017material.
It can also be noticed that a transition occurs as the material strength increases. This continuum deformation gives place to a more sudden “brittle-like” fracturing process (Fig. 5 (a)). This type of behaviour can be compared with that displayed in Fig. 1 (c), corresponding to moderate cementation levels in the samples (kPa), where an axial splitting mode was observed. At lower strengths or equivalently lower cementation levels, disaggregation at the grain scale was observed in the UCS experiments. This behaviour is mapped to the behaviour of the numerical setup where, expansion of the cylinder (consistent with Reynolds’dilatancy reynolds1885lvii) is observed near the failure point. The focus on lower strengths or cementation levels, which were not possible in the experimental part because specimens of such low cohesion break when extracting from the mould, is one of the objectives of this study.
To assess the impact of the initial condition on the resulting strength of the sample, three different values were investigated for the confining force .
The inset of Fig. 6 shows for these different initial conditions as a function of the model parameter (Eq. (1)).

In order to scale these results as a function of a more meaningful parameter, we define the density of contacts in the system :
| (2) |
with the mean coordination number of the system and the corresponding packing fraction ().
Figure 6 shows as a function of for the same systems than in the inset. This parameter clearly gives a good agreement. Figure 7 contains a snapshot of an slice of the numerical probes. Here, the overlap between particles gives a cohesive force as playing a similar role to the calcium carbonated bonds in samples (Fig. 2).

5 Hydraulic fractures
In this section, we use the cohesion model presented above to study the behaviour of fluid-driven fractures created in quasi-two-dimensional Hele-Shaw cells.
Initial configurations are created following the protocol presented in section 3, but compressing loose grains between two parallel plates having a constant separation mm (in the vertical direction). The effective cell diameter is cm, (the cell is in fact octagonal). A central inlet of radius mm, is created during the compaction process by preventing particles from occupying the cylindrical region in the centre of the cell (using a wall-like constraint). After reaching a static configuration (fig. 4 (c)) all the walls in the system were fixed in position. The volume of the cell is not allowed to change during fluid injection.
Fluid injection is simulated using the kloss2012models; gago2020spatially open source software. This software couples with , computational fluid dynamics () model to simulate spatially resolved solid-fluid interaction. We simulate an incompressible fluid with viscosity cP, density km-3. As this model needs to resolve the movement of the fluid around the solid interface a fine mesh is required (of at least four grid-blocks per particle diameter kloss2012models). A mesh refinement of of the mean particle diameter was chosen.
Fluid is injected from the central inlet at a constant pressure while the outlet (the external cell perimeter) is considered to be open to the atmosphere (). Figure 8 shows characteristic patterns of the fracture behaviour for different injection pressures (increasing from left to right), and consolidation levels (increasing from top to bottom).

These patterns show that the fracture patterns corresponding to more consolidated systems (bottom) tend to present more branched-like behaviour than those of unconsolidated ones (top). This finding is not surprising: weaker materials spend more of the input energy in permanent deformation, while stiffer materials open up defects, those defects (or voids) increases the local pressure and “self-drive” the fracture development. This kind of behaviour is consistent with experimental observations.
Figure 9 (top) shows the fracture patterns obtained experimentally for an unconsolidated system with fine sand for three different values of the injection pressure (increasing from left to right). The system was constrained by the boundary walls and the injection was from the bottom to the top. The borehole inlet was 1 cm away from the observation window (placed at the top). For the test with the lower applied inlet pressure, the fluid infiltrates through the permeable granular matrix without any visible fractures being induced. For the other two tests, where the inlet pressure was higher, particle rearrangement (grain dislocation) is observed resulting in an opening or borehole expansion. As in Fig. 8 (top and middle), the fracture area is “symmetrically” distributed around the fluid inlet. Although the sand is cohesionless, it possesses some strength due to interlocking of the particles. Figure 9 (bottom) shows a test before and after a fracture was obtained on bio-cemented coarse sands with a kPa. This experimental setup differs from the one used in unconsolidated sand as no walls were used to constrain the specimen (the specimen possesses strength that is higher than any potential reaction from the walls). Multiple crack-like fractures can be observed (bottom right) without any evidence of grain dislocation or borehole expansion. The damage was extensive and was produced in a very small time window. These patterns are similar to those in Fig. 8 (bottom).


In order to assess the effect of consolidation level in the development of the hydraulic fractures, a series of numerical experiments were performed. A combination of confining stress (obtained by varying in Fig. 4 (a)) and material (obtained with different values of ) were considered. Material stress is defined as in gago2020stress as the average value of the trace of the compressive stress tensor of the particles in the system:
| (3) |
where is the particle index and the sum runs over all the particles in contact with the particle , is the particle volume, () is the component in the direction of the vector connecting the centre of the particle with the centre of the particle and is the component of the contact force. Only positive contact forces (repulsive net force in Eq. (1)) are considered in this definition.
As Eq. (1) shows there is an interplay between stress and strength values in this model: The addition of a “cohesive” component decreases the “compressive” component. Fig. 10 demonstrates this interplay.

The value of was obtained through the power-law relation presented in Fig. 6.
Fig. 11 shows the fracture area for the numerical experiments, as a function of the inlet pressure for samples with different cohesion level-s and the same compressive stress (represented by the horizontal lines in Fig. 10).

Fracture area was measured using the protocol explained in Ref. gago2020fluid. In short, the particle positions were mapped onto a cubic grid and each grid-block was set with a value in the range proportional to the amount of it covered by a particle. Only the slice of the grid was considered (this is represented in Fig. 8). Grid-blocks containing a fraction of particle smaller than were taken as fluid. To ignore the pore size volumes, only clusters of such grid-blocks, bigger than units were considered as a “fracture”. The fracture area as a function of was defined as the difference between the amount of those grid-blocks before and after the fluid injection.
This figure shows that, as expected, fractures in more consolidated materials require higher pressure to initiate, although, as has been discussed in gago2020stress, the effective stress also strongly influenced fracture development. Curves corresponding to lower show a clear deviation for a change of consolidation of kPa, while for intermediate stress/cohesion this deviation is less evident ( kPa and kPa)). This deviation becomes evident again for higher stress and jumping from to a small, non-zero value. A more systematic analysis of this dependence needs to be carried out.
6 Conclusions
We presented a discrete element method that allows for modelling key elements of the behaviour under stress of soft sands. We have compared the numerical results with experimental results obtained on bio-cemented sandstones. Although the range of strength for the numerical specimens are on the “weaker” end of the experimental samples, both overlap for moderate strength, allowing a proper validation of the model. The model is successful in reproducing shear-failure, observed experimentally for materials with moderate strength (kPa) and characteristic branched-like fracture patterns driven by fluid-injection. The model expands the experimentally possible strength values to an even lower range which could not be achieved in the experiments. In this lower range, the model is able to account for the post-peak strain softening, characteristic of compacted sands. Since it is believed that any transition in the hydraulic fracturing behaviour will occur in this lower region, the results presented here are encouraging that the method presented can help towards a better understanding of this transition. A more systematic analysis of the fracture behaviour with consolidation/stress dependence, with special emphasis on the soft-brittle transitional values will be addressed in future work.
Acknowledgements.
The authors would like to acknowledge the funding and technical support from bp through the bp International Centre for Advanced Materials (bp-ICAM) which made this research possible. Simulations were performed at the Imperial College Research Computing Service (see DOI: 10.14469/hpc/2232).References
- [1] Brian D. Collins and Nicholas Sitar. Geotechnical Properties of Cemented Sands in Steep Slopes. Journal of Geotechnical and Geoenvironmental Engineering, 135(10):1359–1366, 2009.
- [2] Nicholas Sitar, G Wayne Clough, and Robert G Bachus. Behavior of weakly cemented soil slopes under static and seismic loading conditions. Technical report, U.S. Geological Survey, 1980.
- [3] S Nakagawa and L R Myer. Mechanical and acoustic properties of weakly cemented granular rocks. In The 38th U.S. Symposium on Rock Mechanics (USRMS), pages 1–8, Washington, DC, 2001.
- [4] Haiying Huang, Fengshou Zhang, Patrick Callahan, and Joseph Ayoub. Granular fingering in fluid injection into dense granular media in a hele-shaw cell. Physical review letters, 108(25):258001, 2012.
- [5] Øistein Johnsen, Renaud Toussaint, Knut Jørgen Måløy, and Eirik Grude Flekkøy. Pattern formation during air injection into granular materials confined in a circular hele-shaw cell. Physical Review E, 74(1):011301, 2006.
- [6] Charalampos Konstantinou. Hydraulic fracturing of artificially generated soft sandstones. PhD thesis, University of Cambridge, 2021.
- [7] Hong Chang. Hydraulic fracturing in particulate materials. PhD thesis, Georgia Institute of Technology, 2004.
- [8] H Chang, LN Germanovich, R Wu, JC Santamarina, and PE Dijk. Hydraulic fracturing in cohesionless particulate materials. In AGU Fall Meeting Abstracts, volume 2003, pages H51B–03, 2003.
- [9] Jon Edward Olson, Jon Holder, Mehran Hosseini, et al. Soft rock fracturing geometry and failure mode in lab experiments. In SPE Hydraulic Fracturing Technology Conference. Society of Petroleum Engineers, 2011.
- [10] Fengshou Zhang, Branko Damjanac, and Haiying Huang. Coupled discrete element modeling of fluid injection into dense granular media. Journal of Geophysical Research: Solid Earth, 118(6):2703–2722, 2013.
- [11] Cornelis J de Pater, Yufei Dong, Bahman Bohloli, et al. Experimental study of hydraulic fracturing in sand as a function of stress and fluid rheology. In SPE hydraulic fracturing technology conference. Society of Petroleum Engineers, 2007.
- [12] Yufei Dong. Hydraulic fracture containment in sand. 2010.
- [13] Y Dong, CJ De Pater, et al. Observation and modeling of the hydraulic fracture tip in sand. In The 42nd US Rock Mechanics Symposium (USRMS). American Rock Mechanics Association, 2008.
- [14] B Xu, Y Yuan, RCK Wong, et al. Modeling of the hydraulic fractures in unconsolidated oil sands reservoir. In 44th US Rock Mechanics Symposium and 5th US-Canada Rock Mechanics Symposium. American Rock Mechanics Association, 2010.
- [15] Marciano Maccarini. Laboratory Studies of a Weakly Bonded Artificial Soil. PhD thesis, Imperial College of Science and Technology, 1987.
- [16] R. J. Wygal. Construction of Models that Simulate Oil Reservoirs. Society of Petroleum Engineers Journal, 3(04):281–286, 1963.
- [17] D. Vogler, S. D.C. Walsh, E. Dombrovski, and M. A. Perras. A comparison of tensile failure in 3D-printed and natural sandstone. Engineering Geology, 226:221–235, 2017.
- [18] Victoria S Whiffin. Microbial CaCO3 Precipitation for the Production of Biocement. PhD thesis, Murdor University, 2004.
- [19] Charalampos Konstantinou, Giovanna Biscontin, Ning-Jun Jiang, and Kenichi Soga. Application of microbially induced carbonate precipitation (MICP) to form bio-cemented artificial sandstone. Journal of Rock Mechanics and Geotechnical Engineering, 13(3):Accepted Paper, 2021.
- [20] Jason T. DeJong, Michael B. Fritzges, and Klaus Nüsslein. Microbially induced cementation to control sand response to undrained shear. Journal of Geotechnical and Geoenvironmental Engineering, 132(11):1381–1392, 2006.
- [21] ASTM. Compressive Strength and Elastic Moduli of Intact Rock Core Specimens under Varying States of Stress and Temperatures. Stress: The International Journal on the Biology of Stress, pages 4–11, 2004.
- [22] Christoph Goniva, Christoph Kloss, Niels G Deen, Johannes AM Kuipers, and Stefan Pirker. Influence of rolling friction on single spout fluidized bed simulation. Particuology, 10(5):582–591, 2012.
- [23] Nikolai V Brilliantov, Frank Spahn, Jan-Martin Hertzsch, and Thorsten Pöschel. Model for collisions in granular gases. Physical review E, 53(5):5382, 1996.
- [24] Kenneth Langstreth Johnson, Kevin Kendall, and AD Roberts. Surface energy and the contact of elastic solids. Proc. R. Soc. Lond. A, 324(1558):301–313, 1971.
- [25] KL Johnson. Continuum mechanics modeling of adhesion and friction. Langmuir, 12(19):4510–4513, 1996.
- [26] www.cfdem.com/media/dem/docu/manual.html.
- [27] A Riman, S Sadek, and S Najjar. Predicting the behavior of sand columns in soft clays using hypoplastic finite element modeling. In Publication Name: Numerical Methods in Geotechnical Engineering-Proceedings of the 8th European Conference on Numerical Methods in Geotechnical Engineering, NUMGE 2014; Conference Title: 8th European Conference on Numerical Methods in Geotechnical Engineering, NUMGE 2014; Conference Date: 18 June 2014 through 20 June 2014; Conference Location: Delft; Publication Year: 2014; Volume: 1; Pages:(565-570);. Taylor and Francis-Balkema;, 2014.
- [28] Ali A Abdulla and Panos D Kiousis. Behavior of cemented sands—i. testing. International Journal for Numerical and Analytical Methods in Geomechanics, 21(8):533–547, 1997.
- [29] MG Culshaw, David Christopher Entwisle, DP Giles, Thomas Berry, A Collings, VJ Banks, and LJ Donnelly. Material properties and geohazards. Geological Society, London, Engineering Geology Special Publications, 28(1):599–740, 2017.
- [30] Osborne Reynolds. Lvii. on the dilatancy of media composed of rigid particles in contact. with experimental illustrations. The London, Edinburgh, and Dublin Philosophical Magazine and Journal of Science, 20(127):469–481, 1885.
- [31] Christoph Kloss, Christoph Goniva, Alice Hager, Stefan Amberger, and Stefan Pirker. Models, algorithms and validation for opensource dem and cfd–dem. Progress in Computational Fluid Dynamics, an International Journal, 12(2-3):140–152, 2012.
- [32] Paula A Gago, Ali Q Raeini, and Peter King. A spatially resolved fluid-solid interaction model for dense granular packs/soft-sand. Advances in Water Resources, 136:103454, 2020.
- [33] Paula A Gago, Charalampos Konstantinou, Giovanna Biscontin, and Peter King. Stress inhomogeneity effect on fluid-induced fracture behavior into weakly consolidated granular systems. Physical Review E, 102(4):040901, 2020.
- [34] Paula A Gago, Kuba Wieladek, and Peter King. Fluid-induced fracture into weakly consolidated sand: Impact of confining stress on initialization pressure. Physical Review E, 101(1):012907, 2020.