Guiding large-scale management of invasive species using network metricsJournal: a journal
Abstract
Complex socio-environmental interdependencies drive biological invasions, causing damages across large spatial scales. For widespread invasions, targeting of management activities based on optimization approaches may fail due to computational or data constraints. Here we evaluate an alternative approach that embraces complexity by representing the invasion as a network and using network structure to inform management locations. We compare optimal versus network-guided invasive species management at a landscape-scale, considering siting of boat decontamination stations targeting 1.6 million boater movements among 9,182 lakes in Minnesota, USA. Studying performance for 58 counties, we find that when full information is known on invasion status and boater movements, the best-performing network-guided metric achieves a median and lower quartile performance of 100% of optimal. We also find that performance remains relatively high using different network metrics or with less information (median above 80% and lower quartile above 60% of optimal for most metrics), but is more variable, particularly at the lower quartile. Additionally, performance is generally stable across counties with varying lake counts, suggesting viability for large-scale invasion management.
Keywords:
Earth and environmental sciences/Environmental social sciences/Sustainability , Biological sciences/Ecology/Invasive species , Scientific community and society/Social sciences/Decision makingComplex socio-environmental interdependencies drive biological invasions at both regional and global scales Banks et al. 2015; Epanchin-Niell et al. 2009. These invasions damage ecosystems worldwide, threatening biodiversity and ecosystem services Charles and Dukes 2007; Gallardo et al. 2016 and causing annual losses of over $46B USD and rising Diagne et al. 2021. Over the coming decades, increases in global interconnections and associated trade are expected to drive many more invasions Sardain et al. 2019.
Widespread biological invasions, which cover large spatial scales, are a major environmental crisis whose long-term solution will require advancing beyond existing tools for managing established invasions Epanchin-Niell and Hastings 2010. Novel, approximate methods for controlling spread at large scales are needed because existing accepted methods for finding exact optima for these spatial resource allocation problems (e.g., using optimal control, mixed integer linear and nonlinear programming (Chades et al. 2011; Epanchin-Niell and Wilen 2012; Epanchin-Niell and Wilen 2015; Aadland et al. 2015; Baker 2017; Bushaj et al. 2021; Fischer et al. 2021, e.g.,)) cannot scale efficiently to large systems Büyüktahtakın and Haight 2018. These current methods are also often hindered by the challenge of limited data. Both the distribution of invasive species and the socio-ecological processes driving spread are at best partially-observed even in established invasions Epanchin-Niell and Hastings 2010; Epanchin-Niell 2017.
Network approaches are a promising way to analyze complex socio-environmental systems Bodin et al. 2019. Over the past decade, network science has made advances in understanding how to optimally control spread in complex networks, where the “network protection problem” is fundamental with applications in information security, epidemiology, politics, and marketing Nowzari et al. 2016. Recognition that optimization approaches for network protection cannot scale to large network sizes due to problem complexity has led to intensive research effort focused on “network-guided management": heuristic and approximate methods for solving this problem Newman 2002; Kempe et al. 2003; Pastor-Satorras and Vespignani 2002; Pastor-Satorras et al. 2015 including using network metrics to prioritize management actions Holme et al. 2002.
Despite clear parallels between network protection and invasive species management, and network approaches becoming more commonly applied to invasive species or socio-environmental systems (SESs), network-guided management has not been widely adopted for managing biological invasions. Specifically, the parallel exists because an invasion can be represented as a network, with sites that an invasive species can occupy representing nodes of a network and edges representing pathways of spread (e.g., via human movement using gravity models Muirhead and Macisaac 2005, or via biological dispersal using habitat connectivity models de la Fuente et al. 2018). As such, there is growing interest among researchers and practitioners in using network characteristics to understand invasions. Network characteristics affect spread both at landscape scales Minor and Urban 2008 and continental or global scales, where invasions are most often mediated by human movement and trade Banks et al. 2015. For example, consistent with network theory, experimental work reveals that spread is facilitated by network hubs, or central patches through which many dispersal pathways flow, and hindered by more clustered network structures Morel-Journel et al. 2019. However, these insights are not widely used to inform management. One explanation for this is that rigorous comparisons between network-guided management and accepted methods to obtain optimal solutions have been done only for newly established invasions in small systems—a situation where management based on network structure performs poorly Chades et al. 2011. Despite their poor performance for newly established invasions Chades et al. 2011, network-guided management has been suggested for landscape-scale management of spreading species Perry et al. 2017, including aquatic invasive species (AIS) that spread via human trade and movement Kvistad et al. 2019. To understand if network approaches provide value over accepted methods for optimal management of large networks with established invasions, however, rigorous comparisons are needed but have not yet been done.
Here we aim to bridge the gap between advances in network science on spread prevention in complex networks and real-world management of invasions in SESs. Specifically, our approach connects recent inquiry into using network structure to guide management of invasive species with existing understanding of optimal management of species invasions. We focus on a case of managing a large-scale invasion via allocation of inspection and decontamination stations (“inspection stations” hereafter) across a network, with the objective of minimizing the number of uninspected but potentially infective connections, a common problem in invasive species management Haight et al. 2021; Fischer et al. 2021. We evaluate performance of management based on network structure (i.e., centrality metrics, see “Analytical framework”; Holme et al. 2002) relative to the optimal management from an integer linear programming solution Haight et al. 2021; Fischer et al. 2021. Since managers are often constrained by knowledge of infestation status and processes (e.g., current invasion distribution, dispersal patterns), we also examine how performance degrades with reduced information on invasion status or spread magnitude, relative to the optimal solution which requires full information. Additionally, we characterize performance across a range of budgets. Thus, our analysis advances knowledge about the outstanding question of whether network metrics can effectively guide management and whether some metrics could work better than others in more information rich versus information poor management settings.
Applying and testing network-guided management
Study system and management objective
We focus on the large-scale management problem of preventing zebra mussel (Dreissena polymorpha) spread in Minnesota, USA (MN). Zebra mussels are one of the most costly invasive species in the US, causing changes to ecosystem processes McEachran et al. 2019, extirpating native mussel species Karatayev et al. 2002, and damaging infrastructure Prescott et al. 2013. In MN, zebra mussels are a prohibited invasive species, yet have spread to more than 270 lakes/rivers since their first report in 1989, with more than half of those infestations occurring since 2016 (see Minnesota Department of Natural Resources 2020 & Supplemental Information (SI) Section S1 for more details). This rapid spread has been largely human-mediated, facilitated by movement of boats and equipment Kanankege et al. 2018; Mallez and McCartney 2018. The objective we examine, minimizing short-term spread via optimal location of inspection stations at lakes, is implicitly aimed at achieving the more fundamental goal of reducing long-term damages from invasion spread Minnesota Department of Natural Resources 2020. Given that significant state funding is delegated to the county level ($10M annually for AIS prevention; Minnesota Department of Natural Resources 2020), decisions on where to locate most inspection stations are made by county managers Minnesota Department of Natural Resources 2020. Indeed, two co-authors (Phelps and Haight) were approached by state and county managers to both characterize boat movements Kao et al. 2021 and develop decision support tools for cost-effective county-level management of watercraft inspection programs Haight et al. 2021. Here, for each of the 58 counties in MN with more than 10 lakes, we examine the performance of network-guided approaches relative to an optimal solution obtained via integer linear programming (see Methods). Our set-up allows us to also examine how performance varies across counties that differ in system size (number of nodes).
Analytical framework
Our analytical approach centers around the optimal placement of boat inspection stations on a network of infested and uninfested lakes connected by boater movements. We compare the optimal solution from integer linear programming to network metric-guided management with sites prioritized based on the structure of the boater movement network. Our general approach involves six key steps.
(1) Construct the network. Given that the primary mode of zebra mussel spread is through human movement (of boats) Kanankege et al. 2018, we define a network with lakes that are infested or not as nodes, and the number of boats moving between lakes as weighted, directed edges that mediate spread of infestation (see Methods & SI Section S2; Kao et al. 2020). Within the overall network there is an “infested subnetwork”—the network of potentially infective movements from infested lakes to uninfested lakes (Fig. 1B). We construct a network for each county with 10 or more lakes (; Table S1).
(2) Compute the optimal inspection strategy for each county. The management objective is to maximize the inspections of potentially-infective boats, i.e., boats moving from infested to uninfested lakes. We focus on county-level management, which controls 90% of the inspection stations in MN. County managers decide where to locate inspection stations given a fixed budget, often with minimal coordination between counties or with the state. Thus, we solve for each county’s optimal inspection pattern, subject to a fixed budget, using integer linear programming (see Methods) where the objective is to maximize the number of potentially infective boats inspected (see SI Section S3).
(3) Compute network-guided inspection strategies for each county. We evaluate management strategies based on several centrality metrics that are measures of network structure (see Table 1). These include two strategies used in network protection contexts for the objective of reducing long-term spread: prioritizing based on highest degree or betweenness centrality Holme et al. 2002. These metrics also have been identified as useful predictors of node importance for invasive species spread Morel-Journel et al. 2019; Banks et al. 2015. We also propose and apply a novel metric that combines the Hub and Authority Scores of Kleinberg Kleinberg 1998; our hub+authority score (H+A) favors nodes that are either sources of infestation or targets of infestation on a directed network. In total, we examine five heuristic network-guided strategies (see SI Sections S4 & S5), presenting results in the main text for three focal strategies that prioritize nodes with highest network centrality (see Table 1 and Methods).
To evaluate management strategies based on centrality metrics, we rank the lakes (nodes) in each county according to each centrality metric, and place interventions in order of priority based on these ranks until the budget runs out. We calculate the relative performance of these strategies (Fig. 1B), i.e., the proportion of potentially infective boats inspected compared to optimal inspection (See SI Section S7).
(4) Construct cases with reduced ecological and social information. The optimal solution provides an upper bound on the performance of network-guided management, but because data are a key constraint in managing large, complex socio-ecological systems, we seek insight into whether network-guided management can perform well when planners use network-guided approaches with less detailed social or ecological information. We focus on four cases with varying levels of social and ecological information (Fig 1C and Table 2): full social and full ecological information; full social and low ecological; low social and full ecological; low social and low ecological. In both full and low social information cases, the directed topology of the network is known. With full social information, the edge weights are known, and a weighted edge from one lake to another represents the number of boats moving from that lake to the other. With low social information, the presence or absence of edges between two lakes are known. An edge from one lake to another represents at least one boat movement from that lake to the other, while no edge represents zero boat movements. With full ecological information, lake infestation status is known. Combined with the directed topology, this means the “infested subnetwork”—the network consisting of only potentially infective movements between infested lakes and uninfested lakes— is known with full ecological information. With low ecological information, only the position of each lake in the network is known, not its infestation status. See Table 2 and SI section S6 for more detail.
(5) Evaluate median and lower-quartile performance across counties for a range of budgets. For all network metrics and information levels we consider a range of relative budgets, expressed as a proportion of the maximum budget adequate to inspect all potentially infective boats in the county. Our unit of observation is a county. To measure overall performance we examine the median (0.5 quantile) and lower quartile (0.25 quantile) outcomes. We also computed average performance across counties within the lowest quartile, and the proportion of counties where methods performed optimally or failed (defined as relative performance ; see Methods and SI Section S8).
(6) Assess performance as a function of network size. Our last step exploits the variation in network size across counties, measured as the number of lakes within a county. Specifically, we use the results from the prior steps to examine whether performance changes with an increase in network size.
Results
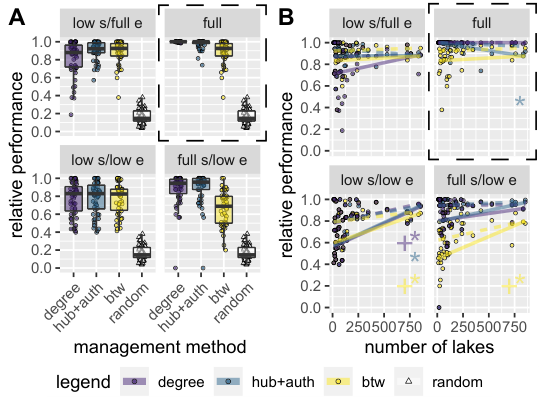
Across all metrics and information levels metric-guided strategies achieved median performance of at least 0.80 of the optimal for reasonable budgets (relative budgets ; SI Table S3). Metric-guided strategies also vastly exceeded the random benchmark, which achieved much lower performance relative to the optimal (median 0.15, lower quartile 0.10) for the same budgets (SI Table S5). As resource constraints in invasive species management mean budgets are almost never sufficient to control every site Büyüktahtakın and Haight 2018, we focus on results with a low relative budget (0.1 the amount required to inspect all infested boats); however, the qualitative patterns described below held for all relative budgets below 0.25 (see SI Tables S2, S3). Performance of metric-guided management generally improved with higher budgets (see SI Figs. S2, S3). Optimal management also improved with higher budgets but showed diminishing returns (SI Fig. S1). Synthesizing the results across metrics, information levels, and network size leads to four main findings, which we describe in the following subsections.
Network-guided management can achieve near-optimal performance
With full information, degree and hub+authority (H+A) achieved perfect (100%) median performance for reasonable budgets. Degree achieved near-perfect performance across all counties: eomparing inspected lakes between degree and the optimal solution reveals that, for relative budgets below 0.25, degree selected the same inspection patterns as the true optimum 87% of the time (Fig. S4, Table S3). A “recalculated” degree strategy selected the exact same inspection patterns for all relative budgets below 0.5 (see SI Section S5). Differences between degree and H+A emerge at the lower quartile with performance of degree (100%) exceeding H+A (97%). Still, H+A performs well across all counties with the average performance of the lower quartile of counties 89% of optimal.
Performance varies by metric
Betweenness performed worse than degree and H+A. Across the counties, its median and lower quartile performance for a realistic budget of 0.1 of the amount required to inspect all infested boats was 93% and 84% of optimal, respectively (SI Table S3). Average performance across counties in the lower quartile was 72% of optimal. Other metrics explored in the SI perform even worse, particularly in the lower quartile, revealing that performance can be tied to the choice of metric.
Performance can be high with less information, but it is more variable
Metric performance was reduced when less detailed social and ecological information was used in the metric calculation (Fig. 2), but these patterns differed depending on which type of data was removed. In the case with full social information but low ecological information, the performance of degree (median 97%, lower quartile 90%) and H+A (median 95%, lower quartile 85%) strategies were both high. The performance of betweenness was lower (median 72%; lower quartile 52%) (SI Table S3). In comparison, with low social but full ecological information the ranking of metrics by their median and lower quartile performance shifted. Betweenness (median 93%; lower quartile 84%) and H+A (median 92%; lower quartile 88%) performed best, with degree slightly lower (median 88%; lower quartile 72%). Also notable is that the average of the counties in the lower quartile was similar for H+A in each of these partial information scenarios (67% with low environmental; 77% with low social), and failure rates remained below 10%. In contrast, for betweenness and degree, average performance in the lower quartile dropped to near 50% or lower in one scenario or another, and failure rates were higher (SI Table S3). For low social/low ecological, all focal metrics performed approximately the same, with median performance above 80%, lower quartile approximately 65%, and average across the lower quartile counties 44-53% for reasonable budgets (Fig. 2A; relative budgets Table S3). Very similar results to the low social/low ecological case were observed even with only undirected topology (“minimal” information; see SI Section S6).
Performance generally does not decrease in larger-scale networks
Metric performance generally improves or shows no significant change as network size, measured as the number of lakes, increases (Fig 2B; See Fig. S6 for other budgets). Increases in performance with network size are common at the lowest information levels. In the low social/low ecological case, the lower (0.25 quantile) performance for all focal metrics was significantly higher () for counties with larger networks (Fig 2B; See Fig. S6 for other budgets). This finding also holds for even less information, when only the undirected topology is known (“minimal” information; see SI Section S6, Fig. S5). The one case where network size showed slight, but negative, association with performance is with full information for H+A (statistically significant decline in 0.25 quantile performance). However, the magnitude of this change over the range of network size was small compared to the larger positive association between performance and network size seen with low levels of ecological information.
Discussion
Our study demonstrates that network-based approaches can guide nearly-optimal invasive species management, including in large systems with constrained resources for management. We find that by managing based on some network metrics, a manager can achieve performance close to or equivalent to optimal—particularly using degree and hub + authority (H+A) (defined in Fig. 1, results in Fig. 2A). Performance was more variable in cases with relatively low budgets and low levels of social or ecological information. In these cases, there was relatively strong median performance across metrics but greater differences in performance of counties in the lower quartiles across metrics, including cases where average performance of the counties in the lower quartile was lower than 50% of optimal. On one hand, our results provide empirical evidence that network-guided management can achieve good performance even with limited information, but the lower-quartile results suggest that appropriate metric selection is important for achieving these outcomes. Finally, we find that the performance of metric-guided management strategies generally does not decrease with network size and generally increases with network size with low levels of information – i.e., in the contexts where identification of optimal solutions can be most computationally challenging. Stability of performance across network size also suggests that metrics can be tested for performance on smaller scale systems to provide insights into preferred metrics to employ in larger systems. Together, these results suggest that network-guided management is a promising approach for managing large-scale invasions, including those characterized by limited budgets or less detailed information about the social-ecological system.
Our research adds to a growing body of work applying network science to the management of complex socio-environmental systems. The utility of centrality metrics for guiding invasion management, as found in our study, is expected from longstanding network theory (e.g., Pastor-Satorras and Vespignani 2002), but their potential to guide management has not been realized for invasive species management at large scales. For small and newly-invaded systems, Chadès et al. Chades et al. 2011 found that centrality metrics can actually mislead management. However, large-scale invasions in real management contexts are inherently a large-network problem. While prior studies on invasive species in large networks assessed how well network metrics predict spread (e.g., Banks et al. 2015; Perry et al. 2017) and examined performance of metrics in prioritizing management actions (e.g., Kvistad et al. 2019), they did not rigorously compare the performance of network-based management to known-optimal interventions as we do here. In another conservation context (conserving species in a food web), at least one prior study compared the performance of network metric-guided management to an optimal approach McDonald-Madden et al. 2016, but did not test the performance for invasion management and under varying information, budgets, and network size, as in this study.
Here we test network-guided management’s efficacy for the objective of minimizing the number of uninspected but potentially infective boats (i.e. boats moving from infested to uninfested lakes), but other management problems could be explored in future work. Our objective captures the current means objective in our study region and is equivalent to minimizing one-period spread, which is implicitly aimed at achieving a more fundamental goal of reducing long-term damages from invasion spread Minnesota Department of Natural Resources 2020. Invasive species management involves many approaches to reducing long-term impacts, with diverse management activities including surveillance, containment, and removal, and with goals spanning prevention to eradication Büyüktahtakın and Haight 2018. Each option represents a distinct resource allocation problem, involving different time horizons, tools, and management objectives. Assessing the performance of network metrics for an objective like long-term damages would require integrated, dynamic socio-environmental systems models that describe changes in boater movement over time. A fuller picture of performance could also include empirical ex-post evaluation of management efficacy.
The relative performance of different metrics for network-guided management likely depends on the management objective. Here, the higher-performing metrics (i.e., degree and H+A in Fig. 2A) select nodes with a high weighted degree, which corresponds directly to high numbers of inspected boats. In contrast, the lower-performing betweenness centrality depends on all paths in the network and therefore selects nodes that may not have a high degree and thus may not correspond to a high number of inspected boats. Work on the network protection problem offers further support to this idea that the best performing metric will depend on the objective. For example, when controlling spread on a network via protecting nodes Nowzari et al. 2016, but with the objective of minimizing the rate of spread in the long-term, betweenness centrality outperforms strategies based on degree centrality Holme et al. 2002. Thus, our empirical results highlight the potential importance of selecting metrics that “match” the management objective and support a broader literature exploring this idea. For future research on network-guided management of invasive species or other applications of network-guided conservation, leveraging and translating predictions from network epidemiology (reviewed in Nowzari et al. 2016) is a promising approach.
Another outstanding topic for future research is how the performance of metric-based heuristics depends on interactions between invasive species’ dispersal characteristics and the data used to construct the network. The ordering of metric performance in cases with low levels of network information may be especially sensitive to these features. In our application, the spectral H+A metric had the most consistent performance across varying information levels. This indicates that in the partial information cases we considered (i.e., low social/full ecological or full social/low ecological; Fig. 2) H+A captures details in the network structure that result in a high ranking for nodes that turn out to be the highest degree in the full information case—i.e., on the weighted infested subnetwork. Future work could investigate if this finding is specific to our context, based on the network definition (from data collected over 2014-2017; Kao et al. 2020) and definition of invasion state (invaded in 2019) relative to the ecological properties (e.g., temporal and spatial dispersal abilities) of this invasive species. In our application, centrality metrics on the network are predictive of invaded status Kao et al. 2021. While this has been observed for AIS on other human transport networks Kvistad et al. 2019, it may not be the case for some invasions. Whether our findings extend to more general cases should be investigated, potentially through simulation approaches from network epidemiology (e.g., Nowzari et al. 2016). Another promising extension would be applying our methods to networks derived from other sources. For example, gravity models have often been applied to AIS (e.g., Bossenbroek et al. 2001; Leung et al. 2006), and these models could be used to create an approximate network Muirhead and Macisaac 2005 that could then be used for network-guided management.
Network approximations may be particularly valuable for spatial prioritization in very large systems, including for providing decision support for management, for several reasons. For one, integer-linear programming (ILP) approaches that have been successfully applied to small- and medium-sized problems in conservation planning (e.g., conservation prioritization with MARXAN Beger et al. 2015, sparing-sharing in tropical forests with ILP Runting et al. 2019) have computational and data constraints that limit their use for large-scale systems. Second, complementary work by Kinsley et al. Kinsley et al. 2021 demonstrates the effectiveness of network-guided management for real-world decision support by embedding near-optimal prioritization based on a network metric in a web-tool developed with intensive stakeholder engagement. Finally, output from network approaches such as ours could be integrated with broader frameworks for assessing invasion risk based on factors such as habitat suitability, stream connections, and impacts Vander Zanden and Olden 2008; Kanankege et al. 2018. Ongoing engagement between managers and researchers, such as in MN, provides a promising context for pursuing such extensions Kanankege et al. 2020.
In summary, our results suggest that network-guided management could provide an important tool for addressing management challenges posed by widespread invasions, which are becoming common due to globalization and other global changes. Our study demonstrates the potential value of methods developed in other areas of network science with a richer history of working in large complex systems for invasion management. These approaches also have relevance for other environmental contexts, such as fire, fisheries, or endangered species management, where management occurs within complex systems that test the limits of traditional optimal control tools (e.g., Kroetz and Sanchirico 2015). Overall our results show network approaches hold promise for improving management outcomes in contexts where modeling and/or data resources are limited.
Methods
Data and network representation
We use a network generated from million reported boater movements in Minnesota over the period 2014 to 2017 and zebra mussel lake infestation status from 2019 for 9,182 Minnesota lakes Kao et al. 2020; Kao et al. 2021. This network consists of lakes (nodes) connected by directed movements of boaters (edges). Edge weights represent estimated numbers of boaters moving between two connected lakes Kao et al. 2020; Kao et al. 2021. Based on lake infestation status, we categorize all network edges as either potentially infective (i.e., a movement from an infested body of water to an uninfested body of water based on observed infestation status) or non-infective (see SI Sections S1 & S2).
Defining county-level networks and infested subnetworks
We construct 58 county-level networks from the Minnesota-wide data, including all counties with greater than 10 lakes. We account for out-of-county and in-to-county boater movement by adding two nodes to each county network that serve as synthetic lakes: the first corresponding to all non-county lakes that are uninfested and the second corresponding to all non-county lakes that are infested. We aggregate all edge-weight that crosses a county line into the incoming and outgoing links to these two synthetic nodes. In this way, we define a county-level network as an adjacency matrix (for in 58, the number of counties that we examine). These county-level networks vary widely in summary statistics related to the network and infestation status, including number of edges, number of trips, and proportion of potentially infective trips (see Table S1).
For each county, we further define an infested subnetwork, which is a subgraph of each full county network , consisting of only the potentially infective edges and their connected lakes. Each edge in this subnetwork is a directed edge from an infested lake to an uninfested lake. The subnetwork connects a subset of lakes in the county network as an adjacency matrix . The entry corresponds to the number of trips from lake to lake .
Problem formulation
Although boater movement connects lakes across counties, resource allocation decisions primarily occur within counties, so we study a decision problem at that scale. The decision problem for county is to determine the location of inspection stations, given a limited budget , to maximize the number of boats inspected that are moving from infested lakes anywhere to uninfested lakes within the county. We assume uniform costs to inspect any given lake (i.e., the cost of inspection stations are the same for each lake).
Optimal solution and random-inspections benchmark
As a reference point and the upper bound on the performance of our network metrics we solve for the optimal solution for a fixed budget as an integer linear program, an approach that has previously been applied to optimize inspection for invasive species Fischer et al. 2021; Haight et al. 2021. Indeed, the ILP formulation for the optimal solution that we use here was developed to support AIS management in several MN counties (Haight et al. 2021; also see SI Section S3). For each county , we use the adjacency matrix of the infested subnetwork to define the infested matrix with rows corresponding to the infested lakes, within the county and the infested synthetic lake, and columns corresponding to the uninfested lakes only in the county. Each entry gives the number of boats moving from infested lake to uninfested lake . We define the decision problem of locating inspection stations as a sum across entries in this matrix, subject to constraints for the budget and to disallow inspection of synthetic lakes as an integer-linear program (see SI Section S3).
As a lower bound on performance, we also computed the performance of randomly-located inspection stations, where for a budget of , we chose lakes at random from all lakes in county . To determine the mean performance of a random strategy for a given budget, we initially compute the mean performance for 100 replicates, then add replicates in increments of 5 until mean performance across all replicates changes by less than one inspected boat. Plots for the random strategy show the final mean performance; for most county-by-budget combinations, this procedure resulted in a final mean taken over 105 to 570 replicates.
Network metric solution
We compute metric guided strategies degree, hub+auth, and betweenness (Table 1) as described in the SI Sections S4 & S5). For each metric and each information level, we select nodes for inspection sequentially until the budget (total number of nodes that can be inspected) is reached. For all metrics we select nodes based on the ranking from the initial state of the network (see SI Algorithm 1). We also examined a “recalculated” method Holme et al. 2002: compute the metric for all nodes, select the node with the highest metric score for inspection, update the network to exclude the selected node, recalculate the metric for all remaining uninspected nodes, then select the remaining node that has the highest score, continuing with this process until the budget is reached (see SI Algorithm 2). For the objective and metrics we examine here, the “recalculated" method shows little improvement over the initial state method (see SI Section S5, Fig. S7).
Computing relative performance of non-optimal strategies
To compare the performance of network-guided management (i.e., using heuristics based on centrality metrics) to the optimal allocation, we compute the number of potentially infective boats that are inspected under each strategy. We calculate relative performance as the number of infective boats inspected using metric-guided management divided by the number of infective boats inspected using the optimal integer-programming approach (see SI S7). We apply this approach for each county and for each budget up to the minimum budget required to inspect all potentially infective boats given full information and solving the inspection problem for the optimal solution. We denote this budget (See SI Section S3). We use the maximum budget to define each of the county’s relative budget , which facilitates comparing amongst counties of different sizes. We evaluated performance by calculating the median (0.5 quantile) relative performance across all counties for each budget as well as mean lower quartile (0.25 quantile) performance. We also computed the proportion of counties where the performance is perfect, i.e., matching the optimal exactly, and the proportion of failures (defined as relative performance ; see SI Section S8). These values are reported in SI Tables S2–S5.
Quantifying how performance depends on network characteristics
Quantile regression estimates relationships between predictors and parts of the outcome distribution other than the mean Cade and Noon 2003. To test associations between relative performance both at the median (0.5 quantile) and lower quartile (0.25 quantile) and network characteristics (size or the number of nodes; average degree) we computed quantile regressions, using R package quantreg. We performed linear quantile regressions for the median and lower quartile (quantiles 0.5, 0.25) and tested for significance using confidence intervals produced via inverting a rank test Koenker 1994. This method quantifies whether network characteristics show a significant association with increases or decreases in both average and lower-end performance.
Data availability
The network data used in this study were previously reported and are available in Kao et al. 2020. The specific data supporting this study, including network data, lake metadata including infestation status, and geospatial data delineating county boundaries are available in figshare with identifier 10.6084/m9.figshare.14402447.
Code availability
Analysis employed R version 4.0.2 (2020-06-22) using packages dplyr (v1.0.7), purrr (v0.3.4), ggplot2 (v3.3.3), igraph (v1.2.5), quantreg (v5.61), Rglpk (v0.6-4). Full analysis code underlying all analyses is available in figshare with identifier 10.6084/m9.figshare.14402447.
Correspondence and requests for materials
All correspondence and requests for materials should be addressed to Jaime Ashander.
Acknowledgements
The authors thank A. Kinsley for comments on a previous draft. Funding for this research was provided by Resources for the Future and the National Socio-Environmental Synthesis Center (SESYNC) under funding received from the National Science Foundation (NSF) DBI-1639145. The Northern Research Station, USDA Forest Service also provided support. L.E.D. acknowledges support from NSF OCE-2049360.
Contributions
J.A., L.E.D, K.K. conceived the study; J.A., L.E.D, R.E.-N., K.K. designed research; N.B.D.P., R.G.H. contributed data or analytic tools; J.A. performed research; J.A., L.E.D, R.E.-N., K.K., wrote the paper; and all authors edited the paper.
Tables
| Method | Description |
|---|---|
| Degree | Degree is the number of direct links (incoming and out-going) incident on a node. In weighted networks, the equivalent is weighted degree or strength. |
|
Hub Score + Authority
Score (H+A) |
Sum of two eigenvalue-based metrics that account for incoming links (Authority Score) and out-going links (Hub Score). Unlike degree, the contribution of a direct link is weighted by the linking node’s score. |
| Betweenness (btw) | The number of shortest paths between all other nodes that pass through a node. |
|
Information
level |
Definition |
|---|---|
| Full social | The weighted-directed network of boat movements (edges represent the number of boats moving from source to target lake). |
| Low social | Unweighted-directed network of boat movements (edges represent one or more boat moving from source to target lake). |
| Full ecological | Lake position in network and invasion status. |
| Low social | Lake position in network only. |
Appendix S1 Background on the Zebra Mussel Invasion and Management Context in Minnesota, USA
Zebra mussel invasions occurring at the landscape scale provide an ideal application to test the utility of our framework. Since their initial introduction into the United States (U.S.) in the mid-1980s from contaminated ballast water discharge into the Great Lakes, zebra mussels have spread rapidly to at least 409 sub-watersheds throughout the country, facilitated by natural (e.g., water connections Bobeldyk et al. 2005) and human-mediated pathways (e.g., boater movements Kanankege et al. 2018; Mallez and McCartney 2018). The latter is the dominant form of dispersal Kanankege et al. 2018; Mallez and McCartney 2018 and is particularly concerning given the long-distance dispersal potential of the microscopic juvenile stage in residual boat water and the hardy adult stage that attaches to hard surfaces (e.g. boat hulls) (Johnson et al. 2001). Following patterns throughout North America, the lake-river systems of Minnesota (MN), USA, have become infested with zebra mussels, with % of the infestations occurring since 2016 Minnesota Department of Natural Resources 2020. Representative of the national patterns, this rapid expansion and overland spread is closely associated with movements of recreational boats (as recreational boating is a major activity and source of tourism revenue in MN) Kanankege et al. 2018.
Once introduced and established, zebra mussels often become highly abundant, causing changes to ecosystem processes McEachran et al. 2019, extirpating native mussel species Karatayev et al. 2002, and damaging infrastructure Prescott et al. 2013. Although poorly quantified, this invasive species costs managers many millions of dollars each year Chakraborti et al. 2016. While small-scale eradications have been attempted Lund et al. 2018, there are currently no effective removal methods for established populations. Therefore, in Minnesota and many other places, the primary management objective is preventing the introduction of zebra mussel to new waterbodies Leung et al. 2002; Bobeldyk et al. 2005. Cost-effective management strategies are urgently needed.
Currently, significant funding from the state is allocated at the county and local levels for intervention: $10M annually is divided among 87 counties for management. To date, a significant portion of zebra mussel management in MN is conducted by county planning organizations that each receive a funding allocation from the state, which is generally spent on boat inspection programs. In these inspection programs, trained officers are authorized to inspect a watercraft and related equipment at a water-access site, any other public location in the state, or in plain view on private property (2018 Minnesota Statutes 84D.105). Individuals transporting zebra mussels are subject to a citation, including a fine depending on the offense (Minnesota Rules, 2018; MN § 84D.13).
Once introduced and established, zebra mussels often become highly abundant, re-engineer ecosystems McEachran et al. 2019, extirpate native mussel species Karatayev et al. 2002, and significantly impact industrial and recreational infrastructure Prescott et al. 2013. In MN, zebra mussel is a prohibited invasive species occupying around 3% of waters (over 230 lakes/rivers). Putting many other waterways at risk, zebra mussel spread is primarily facilitated by boater movements Kanankege et al. 2018; Mallez and McCartney 2018. Thus MN’s specific management objective is to contain the invasion by maximizing the number of potentially-infective boats that are inspected and cleaned, for a fixed budget. The budget is allocated to establishing and staffing boat inspection stations, for a fixed cost, at selected lakes. These inspect and clean all incoming or departing boats to prevent boats from moving zebra mussels from infected to uninfected lakes. The cost of inspection units is uniform as the fixed cost of setting up a station and staffing varies little over space and one staffer can generally handle the necessary inspections in any given location. Here we investigate how to allocate the substantial, but insufficient funding, available at local levels for intervention ($10M annually divided among 87 counties). This application is ideal for our aims of assessing network-guided management approaches, as the counties in MN differ in system size (number of nodes and connectivity) and the extent of the invasion.
Appendix S2 Data on Minnesota boat movement networks and lake infection status
Our dataset is based on previously estimated boater movements between lakes and infection status data for 9,182 Minnesota lakes Kao et al. 2020. To define the networks of boater movement between the Minnesota lakes used in the analysis, boater movements were estimated by two-stage boosted regression trees Kao et al. 2021. The movement estimate —the estimated number of boats moving between each lake— for the statewide network is output from the boosted regression procedure as an edge list with weight corresponding to the point estimate of the number of boat movements between two waterbodies. We define a lake’s infection attribute, using data on Zebra Mussel infection for all Minnesota lakes in 2019 Kao et al. 2020, as infected or not. Based on lake infection status, we further categorized all edges as either potentially infecting (i.e., a movement from an infected body of water to an uninfected body of water based on observed infection status) or non-infecting. We treat movement of recreational boats as a weighted, directed network with lakes as nodes and boat movement as edges ; the edge weight, for , defines the number of boat movements along any edge. A lake’s infection status is encoded as a binary node attribute for .
Appendix S3 Optimal inspection problem as an integer-linear program
We consider the infective matrix with rows corresponding to the infected lakes, both within the county and the infected synthetic lake, and columns corresponding to the uninfected lakes only in the -th county. Each entry gives the number of boats moving from infected lake to uninfected lake . To define the decision problem, let be a binary choice variable denoting inspection () or not () of infested lake , and be a binary decision variable denoting inspection of uninfested lake . Then we also introduce binary variable that denotes if a given edge is inspected by inspections at either the associated infested or uninfested lake or both, as indicated by the decision variables xi and yj. Further we denote the number of columns as and the number of rows as and assume that the -th row of the matrix includes all boats originating from infected lakes outside of the county. Then the county decision problem is to choose to maximize the number of inspections of boats moving from infested to uninfested lakes,
| (1) | ||||
when the first constraint imposes a fixed maximum budget and each inspection station costing one unit of budget, the second set of I*J constraints ensures that infected boats traveling along an edge will be counted as inspected if the origin or destination node (lake) is chosen for inspection, and the last constraint ensures that no inspection station can be located at the synthetic lake.
Statement in matrix form
Choice variables: To restate the problem in standard (or canonical) matrix form, we pose the vector of choice variables where the are ordered by index column-major order.
Objective: the objective is where with elements with ordered as column-major.
Constraints: The constraint equation is of matrix form with a matrix of constraint coefficients with right-hand-side : .
The notation ‘’ reflects that the type of constraint can differ by row. Within :
- 1.
The first IJ rows encode the constraints > ,
- 2.
The next row encodes the budget
- 3.
The final row encodes the synthetic lake constraint
Covering Budget and Relative Budget
To facilitate comparisons among counties for different budgets, we define a relative budget for county , where is the budget that is adequate to inspect all potentially infective boat movements for county . To compute we solve a related decision problem, also using integer-programming, with the objective to minimize the cost of inspecting all infective boat movements. Using the same variables in (1), the covering budget problem is formulated as:
| (2) | ||||
where the first (I-1)*(J) constraints require all infective edges be inspected at least once, the second set of I*J constraints ensures that infected boats traveling along an edge will be counted as inspected if the origin or destination node (lake) is chosen for inspection, and the last constraint ensures that no inspection can occur at the synthetic node. Results for relative budget of 0.1 are shown in the main text.
Appendix S4 Network metrics
Centrality metrics aim to quantify the importance of a given node to the structure and/or dynamics on a network. The precise interpretation of “importance” varies depending on the metric. Although metrics can be computed on any static network, many metrics have a dynamic interpretation (e.g., involving potential paths or random walks). As noted in the main text, such metrics are naturally attractive as heuristics for managing spreading phenomena on networks including invasive species Albert et al. 2000, however the problem of selecting a maximally influential set of nodes is much harder than finding the most single influential node Pei et al. 2018.
We compute network metrics for each county network, for each of four cases that have different levels of information (Fig. 1). In each case we use igraph to compute the metrics (Csardi and Nepusz 2006). The metrics we use include several well-known centrality metrics that aim to quantify the structural and dynamic importance of nodes. The specific metrics are as defined as follows:
- 1.
Degree: The node total weighted degree (i.e., total strength), is the sum of the weights of incoming and outgoing links.
- 2.
Betweenness: The node betweenness which is roughly the number of shortest paths incident on a node. Weights, if present, are interpreted as the inverse path length between two nodes (igraph; Freeman 1978)
- 3.
PageRank: The node’s PageRank is its entry in the dominant eigenvector of the normalized adjacency matrix (normalized by the node outdegree). The actual computation is via an iterative algorithm (igraph; Brin and Page 1998). This is a spectral metric.
We also propose and apply two novel spectral metrics that combine the Hub and Authority Scores of Kleinberg in Kleinberg 1998. The hub+authority score (H+A) favors nodes that are either sources of infection or targets of infection on a directed network. The hubauthority score (HA) favors nodes that are both sources of infection and targets of infection on a directed network. Like eigenvector centrality these are both spectral metrics and so recursively weight a node’s importance by the importance of its linked nodes. These novel metrics are as follows:
- 1.
Hub + Authority: This is the sum of the hub score and authority score, which are based on the eigenvectors of the adjacency matrix of the graph. The hub score is the node’s entry in the dominant eigenvector of . The authority score is the node’s entry in the dominant eigenvector of . Note for undirected graphs (i.e. symmetric ) the hub score is equivalent to the eigenvector centrality up to a scaling factor (igraph; Kleinberg 1998; extended discussion in Kleinberg 1999).
- 2.
Hub Authority: This is the product of hub and authority. In contrast to hub+auth it favors only nodes that have both hub and authority properties.
Appendix S5 Heuristic network-metric-based strategies for management
For comparison to the optimal solution, we considered heuristic solutions based on each of the network metrics (see Network Metrics, above).
The initial state method presented in the main text
For all metrics including degree, betweenness, and spectral metrics (e.g., Page Rank, hub+auth, hub*auth), we applied heuristic inspection strategy based on the initial state of the network, i.e., the centrality values before any inspection decisions.
For a network-metric based solution based on the initial state of the network, a metric for each node is calculated from the network structure prior to any inspection location placement and those values are used throughout the solution procedure. This approach is defined in Algorithm for a fixed budget . The initial state inspection method is used for the all metrics presented in the main text. It is also used for the hub authority (HA) and PageRank strategies presented in the SI.
The recalculated method and its relative performance
We also examined a recalculated heuristic inspection strategy, where the metric and ranking are recalculated after each inspection placement decision. The recalculated inspection strategy calculates the metric and ranking after each decision and is defined in Algorithm for a fixed budget . Results from the recalculated inspection method for all metrics are presented in the SI (Fig. S7).
We examined the relative performance of recalculated and initial state strategies. Recalculated (also called “adaptive”) strategies have been shown to improve performance of degree and betweenness Holme et al. 2002, albeit for different objectives. Recalculated methods also improve performance of metrics for detecting influential nodes across a corpus of real world networks from social, technology, biological, and transportation domains Erkol et al. 2019, but only when invasion dynamics are not favorable for spread (technically, when the network dynamics are in the sub-critical phase where the probability of spread is less than the critical level required for an invasion to spread network-wide). The recalculated methods improves performance of some metrics. In fact, given the focal management objective, degree used with a recalculated method is actually identical to the greedy approximation algorithm guaranteed to give best approximate performance (to a factor of ) for the maximum coverage problem in our full information case Feige 1998. However, on average we found little improvement (Fig. S7), which is consistent with an established invasion where dynamics are favorable for spread. Therefore, for our main results, we focus on the metrics without recalculation because they are easier to calculate.
Appendix S6 Information scenarios
We considered four cases with varying levels of information corresponding to increasing data on the social dimension (the boat movement network) and ecological dimension (infection status of each lake). The full weighted, directed network is encoded by the adjacency matrix (suppressing the indices for each county). Additional information on infection status (ecological information) is needed to obtain the infested network, encoded by . With less social information, only the unweighted network is known; it is defined by a (binary) adjacency matrix where if and otherwise The varying information levels we consider are as follows:
- 1.
full information: all ecological and social information used in the optimal linear programming solution; the directed and weighted topology of the network is known, and the infection status of each lake is known as well, so the invective network is known.
- 2.
full social/low ecological: the directed and weighted topology of the network corresponding to the adjacency matrix is known.
- 3.
low social/full ecological: the directed, unweighted topology of the network is known, as is the infection status. So the binary infested network is known.
- 4.
low social/low ecological: the directed, unweighted topology of the network is known, this corresponds to the binary adjacency matrix .
- 5.
minimal: only the unweighted undirected topology of the network is known. This corresponds to knowing the matrix , the symmetrized binary adjacency matrix
Results for minimal are quite similar to low social/low ecological and are only shown in the SI.
Appendix S7 Comparing the optimal and network-metric based solutions
Any metric-based strategy as defined above yields a network with node attribute inspection (0 for uninspected, 1 for inspected). Using this attribute, we compute the performance of the network-metric based solution on the same terms as the integer-programming solution: the total number of potentially infective boats inspected. We do this by directly using the objective function of the IP problem Equation (1)), and assigning for any entry where lake or lake is inspected.
Because we compute the performance of the network-metric based solution using the objective function, comparison with the integer-programming solution on these terms is straight-forward. We focus on relative performance measured by the objective function. Denoting the IP-optimum value of the objective function as and the value of the objective for a given network-metric based method as , relative performance is . To characterize degree of similarity between the inspection locations chosen by network-metric based solutions, we also computed their accuracy relative to the optimal integer-programming solution. Accuracy is computed as the proportion of matching sites (inspected or uninspected) between the metric and optimal solution (Fig S4). We examine relative performance and accuracy of the metrics across all counties and for varying values of the relative budget up to .
Appendix S8 Additional results on distribution of performance
We quantified agreement with optimal, failure rate, and expected performance in the worst 25% of counties for each metric, budget, and information scenario. To understand best-case performance, we examined the proportion of counties where the network metrics result in perfect performance—inspections of the same number of infective boats as the optimum ILP. To quantify performance in the worst cases, we also examined the failure rate (defining “failure” as of relative performance) as well as the mean performance in the lower quartile (mean of all counties below 0.25 quantile in the relative performance distribution), for each metric, budget, and information scenario. See Table S2 for full results with varying budgets and Table S3 for results in budget bins. Results for random are shown in Table S4 and S5.
References
- Aadland et al. (2015) Aadland, D., Sims, C., Finnoff, D., 2015. Spatial dynamics of optimal management in bioeconomic systems. Computational Economics 45, 545–577.
- Albert et al. (2000) Albert, R., Jeong, H., Barabási, A.L., 2000. Error and attack tolerance of complex networks. Nature 406, 378–382.
- Baker (2017) Baker, C.M., 2017. Target the source: optimal spatiotemporal resource allocation for invasive species control. Conservation Letters 10, 41–48.
- Banks et al. (2015) Banks, N.C., Paini, D.R., Bayliss, K.L., Hodda, M., 2015. The role of global trade and transport network topology in the human-mediated dispersal of alien species. Ecology Letters 18, 188–199. URL: http://doi.wiley.com/10.1111/ele.12397, doi:10.1111/ele.12397.
- Beger et al. (2015) Beger, M., McGowan, J., Treml, E.A., Green, A.L., White, A.T., Wolff, N.H., Klein, C.J., Mumby, P.J., Possingham, H.P., 2015. Integrating regional conservation priorities for multiple objectives into national policy. Nature Communications 6, 1–8.
- Bobeldyk et al. (2005) Bobeldyk, A.M., Bossenbroek, J.M., Evans-White, M.A., Lodge, D.M., Lamberti, G.A., 2005. Secondary spread of zebra mussels ( Dreissena polymorpha ) in coupled lake-stream systems. Écoscience 12, 339–346. URL: https://www.tandfonline.com/doi/full/10.2980/i1195-6860-12-3-339.1, doi:10.2980/i1195-6860-12-3-339.1.
- Bodin et al. (2019) Bodin, Ö., Alexander, S.M., Baggio, J., Barnes, M.L., Berardo, R., Cumming, G.S., Dee, L.E., Fischer, A., Fischer, M., Garcia, M.M., et al., 2019. Improving network approaches to the study of complex social–ecological interdependencies. Nature Sustainability 2, 551–559.
- Bossenbroek et al. (2001) Bossenbroek, J.M., Kraft, C.E., Nekola, J.C., 2001. Prediction of long-distance dispersal using gravity models: zebra mussel invasion of inland lakes. Ecological Applications 11, 1778–1788.
- Brin and Page (1998) Brin, S., Page, L., 1998. The anatomy of a large-scale hypertextual web search engine. Computer networks and ISDN systems 30, 107–117.
- Bushaj et al. (2021) Bushaj, S., Büyüktahtakın, İ.E., Yemshanov, D., Haight, R.G., 2021. Optimizing surveillance and management of emerald ash borer in urban environments. Natural Resource Modeling 34, e12267.
- Büyüktahtakın and Haight (2018) Büyüktahtakın, .E., Haight, R.G., 2018. A review of operations research models in invasive species management: state of the art, challenges, and future directions. Annals of Operations Research 271, 357–403. URL: http://link.springer.com/10.1007/s10479-017-2670-5, doi:10.1007/s10479-017-2670-5.
- Cade and Noon (2003) Cade, B.S., Noon, B.R., 2003. A gentle introduction to quantile regression for ecologists. Frontiers in Ecology and the Environment 1, 412–420.
- Chades et al. (2011) Chades, I., Martin, T.G., Nicol, S., Burgman, M.A., Possingham, H.P., Buckley, Y.M., 2011. General rules for managing and surveying networks of pests, diseases, and endangered species. Proceedings of the National Academy of Sciences 108, 8323–8328. URL: http://www.pnas.org/cgi/doi/10.1073/pnas.1016846108, doi:10.1073/pnas.1016846108.
- Chakraborti et al. (2016) Chakraborti, R.K., Madon, S., Kaur, J., 2016. Costs for controlling dreissenid mussels affecting drinking water infrastructure: Case studies. Journal-American Water Works Association 108, E442–E453.
- Charles and Dukes (2007) Charles, H., Dukes, J.S., 2007. Impacts of Invasive Species on Ecosystem Services, in: Nentwig, W. (Ed.), Biological Invasions. Springer, Berlin, Heidelberg. Ecological Studies, pp. 217–237. URL: https://doi.org/10.1007/978-3-540-36920-2_13, doi:10.1007/978-3-540-36920-2_13.
- Csardi and Nepusz (2006) Csardi, G., Nepusz, T., 2006. The igraph software package for complex network research. InterJournal Complex Systems, 1695. URL: https://igraph.org.
- Diagne et al. (2021) Diagne, C., Leroy, B., Vaissière, A.C., Gozlan, R.E., Roiz, D., Jarić, I., Salles, J.M., Bradshaw, C.J.A., Courchamp, F., 2021. High and rising economic costs of biological invasions worldwide. Nature 592, 571–576. URL: https://www.nature.com/articles/s41586-021-03405-6, doi:10.1038/s41586-021-03405-6.
- Epanchin-Niell et al. (2009) Epanchin-Niell, R., Hufford, M., Aslan, C., Sexton, J., Port, J., Waring, T., 2009. Controlling invasive species in complex social landscapes. Frontiers in Ecology and the Environment 8, 210–216. doi:10.1890/090029.
- Epanchin-Niell (2017) Epanchin-Niell, R.S., 2017. Economics of invasive species policy and management. Biological Invasions 19, 3333–3354. URL: http://link.springer.com/10.1007/s10530-017-1406-4, doi:10.1007/s10530-017-1406-4.
- Epanchin-Niell and Hastings (2010) Epanchin-Niell, R.S., Hastings, A., 2010. Controlling established invaders: integrating economics and spread dynamics to determine optimal management. Ecology Letters 13, 528–541. URL: http://doi.wiley.com/10.1111/j.1461-0248.2010.01440.x, doi:10.1111/j.1461-0248.2010.01440.x.
- Epanchin-Niell and Wilen (2012) Epanchin-Niell, R.S., Wilen, J.E., 2012. Optimal spatial control of biological invasions. Journal of Environmental Economics and Management 63, 260–270. URL: https://www.sciencedirect.com/science/article/pii/S0095069611001392, doi:10.1016/j.jeem.2011.10.003.
- Epanchin-Niell and Wilen (2015) Epanchin-Niell, R.S., Wilen, J.E., 2015. Individual and Cooperative Management of Invasive Species in Human-mediated Landscapes. American Journal of Agricultural Economics 97, 180–198. URL: https://ideas.repec.org/a/oup/ajagec/v97y2015i1p180-198..html.
- Erkol et al. (2019) Erkol, Ş., Castellano, C., Radicchi, F., 2019. Systematic comparison between methods for the detection of influential spreaders in complex networks. Scientific reports 9, 1–11.
- Feige (1998) Feige, U., 1998. A threshold of ln n for approximating set cover. Journal of the ACM (JACM) 45, 634–652.
- Fischer et al. (2021) Fischer, S.M., Beck, M., Herborg, L.M., Lewis, M.A., 2021. Managing aquatic invasions: optimal locations and operating times for watercraft inspection stations. Journal of Environmental Management 283, 111923.
- Freeman (1978) Freeman, L.C., 1978. Centrality in social networks conceptual clarification. Social networks 1, 215–239.
- de la Fuente et al. (2018) de la Fuente, B., Saura, S., Beck, P.S., 2018. Predicting the spread of an invasive tree pest: the pine wood nematode in southern europe. Journal of Applied Ecology 55, 2374–2385.
- Gallardo et al. (2016) Gallardo, B., Clavero, M., Sánchez, M., Vilà, M., 2016. Global ecological impacts of invasive species in aquatic ecosystems. Global Change Biology 22, 151–163. doi:10.1111/gcb.13004.
- Haight et al. (2021) Haight, R.G., Kinsley, A.C., Kao, S.Y., Yemshanov, D., Phelps, N.B., 2021. Optimizing the location of watercraft inspection stations to slow the spread of aquatic invasive species. Biological Invasions 23, 3907––3919.
- Holme et al. (2002) Holme, P., Kim, B.J., Yoon, C.N., Han, S.K., 2002. Attack vulnerability of complex networks. Physical Review E 65, 056109. URL: https://link.aps.org/doi/10.1103/PhysRevE.65.056109, doi:10.1103/PhysRevE.65.056109.
- Johnson et al. (2001) Johnson, L.E., Ricciardi, A., Carlton, J.T., 2001. Overland Dispersal of Aquatic Invasive Species: A Risk Assessment of Transient Recreational Boating. Ecological Applications 11, 1789–1799.
- Kanankege et al. (2018) Kanankege, K.S., Alkhamis, M.A., Phelps, N.B., Perez, A.M., 2018. A probability co-kriging model to account for reporting bias and recognize areas at high risk for zebra mussels and eurasian watermilfoil invasions in minnesota. Frontiers in Veterinary Science 4, 231.
- Kanankege et al. (2020) Kanankege, K.S., Phelps, N.B., Vesterinen, H.M., Errecaborde, K.M., Alvarez, J., Bender, J.B., Wells, S.J., Perez, A.M., 2020. Lessons learned from the stakeholder engagement in research: application of spatial analytical tools in one health problems. Frontiers in Veterinary Science 7, 254.
- Kao et al. (2020) Kao, S.Y., Enns, E.A., Tomamichel, M., Doll, A., Escobar, L.E., Qiao, H., Craft, M.E., Phelps, N.B.D., 2020. Network connectivity patterns of Minnesota waterbodies and implications for aquatic invasive species prevention. Retrieved from the Data Repository for the University of Minnesota: https://doi.org/10.13020/DJW8-2V86.
- Kao et al. (2021) Kao, S.Y.Z., Enns, E.A., Tomamichel, M., Doll, A., Escobar, L.E., Qiao, H., Craft, M.E., Phelps, N.B., 2021. Network connectivity of Minnesota waterbodies and implications for aquatic invasive species prevention. Biological Invasions 23, 3231––3242.
- Karatayev et al. (2002) Karatayev, A.Y., Burlakova, L.E., Padilla, D.K., 2002. Impacts of zebra mussels on aquatic communities and their role as ecosystem engineers, in: Invasive aquatic species of Europe. Distribution, impacts and management. Springer, pp. 433–446.
- Kempe et al. (2003) Kempe, D., Kleinberg, J., Tardos, E., 2003. Maximizing the spread of influence through a social network, in: Proceedings of the ninth ACM SIGKDD international conference on Knowledge discovery and data mining - KDD ’03, ACM Press, Washington, D.C.. p. 137. URL: http://portal.acm.org/citation.cfm?doid=956750.956769, doi:10.1145/956750.956769.
- Kinsley et al. (2021) Kinsley, A.C., Haight, R.G., Snellgrove, N., Muellner, P., Muellner, U., Duhr, M., Phelps, N.B.D., 2021. AIS Explorer: Prioritization for watercraft inspections-A decision-support tool for aquatic invasive species management. arXiv:2112.03859 [math, q-bio] URL: https://arxiv.org/abs/2112.03859. arXiv: 2112.03859.
- Kleinberg (1998) Kleinberg, J.M., 1998. Authoritative sources in a hyperlinked environment, in: Proceedings of the ninth annual ACM-SIAM symposium on Discrete algorithms, pp. 668–677.
- Kleinberg (1999) Kleinberg, J.M., 1999. Authoritative sources in a hyperlinked environment. Journal of the ACM 46, 604–632.
- Koenker (1994) Koenker, R., 1994. Confidence intervals for regression quantiles, in: Asymptotic Statistics. Springer, pp. 349–359.
- Kroetz and Sanchirico (2015) Kroetz, K., Sanchirico, J., 2015. The bioeconomics of spatial-dynamic systems in natural resource management. Annual Review of Resource Economics 7, 189–207.
- Kvistad et al. (2019) Kvistad, J.T., Chadderton, W.L., Bossenbroek, J.M., 2019. Network centrality as a potential method for prioritizing ports for aquatic invasive species surveillance and response in the Laurentian Great Lakes. Management of Biological Invasions 10, 403.
- Leung et al. (2006) Leung, B., Bossenbroek, J.M., Lodge, D.M., 2006. Boats, Pathways, and Aquatic Biological Invasions: Estimating Dispersal Potential with Gravity Models. Biological Invasions 8, 241–254. URL: http://link.springer.com/10.1007/s10530-004-5573-8, doi:10.1007/s10530-004-5573-8.
- Leung et al. (2002) Leung, B., Lodge, D.M., Finnoff, D., Shogren, J.F., Lewis, M.A., Lamberti, G., 2002. An ounce of prevention or a pound of cure: bioeconomic risk analysis of invasive species. Proceedings of the Royal Society of London. Series B: Biological Sciences 269, 2407–2413. URL: https://royalsocietypublishing.org/doi/10.1098/rspb.2002.2179, doi:10.1098/rspb.2002.2179.
- Lund et al. (2018) Lund, K., Cattoor, K.B., Fieldseth, E., Sweet, J., McCartney, M.A., 2018. Zebra mussel (Dreissena polymorpha) eradication efforts in Christmas Lake, Minnesota. Lake and Reservoir Management 34, 7–20.
- Mallez and McCartney (2018) Mallez, S., McCartney, M., 2018. Dispersal mechanisms for zebra mussels: population genetics supports clustered invasions over spread from hub lakes in minnesota. Biological Invasions 20, 2461–2484.
- McDonald-Madden et al. (2016) McDonald-Madden, E., Sabbadin, R., Game, E.T., Baxter, P.W.J., Chadès, I., Possingham, H.P., 2016. Using food-web theory to conserve ecosystems. Nature Communications 7, 10245. URL: http://www.nature.com/articles/ncomms10245, doi:10.1038/ncomms10245.
- McEachran et al. (2019) McEachran, M.C., Trapp, R.S., Zimmer, K.D., Herwig, B.R., Hegedus, C.E., Herzog, C.E., Staples, D.F., 2019. Stable isotopes indicate that zebra mussels (dreissena polymorpha) increase dependence of lake food webs on littoral energy sources. Freshwater Biology 64, 183–196.
- Minnesota Department of Natural Resources (2020) Minnesota Department of Natural Resources, 2020. Invasive Species of Aquatic Plants and Wild Animals in Minnesota: Annual Report for 2020. State of Minnesota, Department of Natural Resources, St. Paul, MN.
- Minor and Urban (2008) Minor, E.S., Urban, D.L., 2008. A Graph-Theory Framework for Evaluating Landscape Connectivity and Conservation Planning: Graph Theory, Connectivity, and Conservation. Conservation Biology 22, 297–307. URL: http://doi.wiley.com/10.1111/j.1523-1739.2007.00871.x, doi:10.1111/j.1523-1739.2007.00871.x.
- Morel-Journel et al. (2019) Morel-Journel, T., Assa, C.R., Mailleret, L., Vercken, E., 2019. Its all about connections: hubs and invasion in habitat networks. Ecology Letters 22, 313–321. URL: https://onlinelibrary.wiley.com/doi/abs/10.1111/ele.13192, doi:10.1111/ele.13192.
- Muirhead and Macisaac (2005) Muirhead, J.R., Macisaac, H.J., 2005. Development of inland lakes as hubs in an invasion network. Journal of Applied Ecology 42, 80–90. URL: http://doi.wiley.com/10.1111/j.1365-2664.2004.00988.x, doi:10.1111/j.1365-2664.2004.00988.x.
- Newman (2002) Newman, M.E.J., 2002. Spread of epidemic disease on networks. Physical Review E 66, 016128. URL: https://link.aps.org/doi/10.1103/PhysRevE.66.016128, doi:10.1103/PhysRevE.66.016128.
- Nowzari et al. (2016) Nowzari, C., Precaido, V.M., Pappas, G.J., 2016. Analysis and Control of Epidemics: A Survey of Spreading Processes on Complex Networks. IEEE Control Systems 36, 26–46. URL: https://ieeexplore.ieee.org/document/7393962/, doi:10.1109/MCS.2015.2495000.
- Pastor-Satorras et al. (2015) Pastor-Satorras, R., Castellano, C., Van Mieghem, P., Vespignani, A., 2015. Epidemic processes in complex networks. Reviews of Modern Physics 87, 925–979. URL: https://link.aps.org/doi/10.1103/RevModPhys.87.925, doi:10.1103/RevModPhys.87.925.
- Pastor-Satorras and Vespignani (2002) Pastor-Satorras, R., Vespignani, A., 2002. Immunization of complex networks. Physical Review E 65, 036104. URL: https://link.aps.org/doi/10.1103/PhysRevE.65.036104, doi:10.1103/PhysRevE.65.036104.
- Pei et al. (2018) Pei, S., Morone, F., Makse, H.A., 2018. Theories for influencer identification in complex networks. arXiv:1707.01594 [physics] URL: http://arxiv.org/abs/1707.01594. arXiv: 1707.01594.
- Perry et al. (2017) Perry, G.L.W., Moloney, K.A., Etherington, T.R., 2017. Using network connectivity to prioritise sites for the control of invasive species. Journal of Applied Ecology 54, 1238–1250. URL: http://doi.wiley.com/10.1111/1365-2664.12827, doi:10.1111/1365-2664.12827.
- Prescott et al. (2013) Prescott, T.H., Claudi, R., Prescott, K.L., 2013. Impact of Dreissenid mussels on the infrastructure of dams and hydroelectric power plants, in: Quagga and Zebra Mussels, CRC Press. pp. 243–258.
- Runting et al. (2019) Runting, R.K., Griscom, B.W., Struebig, M.J., Satar, M., Meijaard, E., Burivalova, Z., Cheyne, S.M., Deere, N.J., Game, E.T., Putz, F.E., et al., 2019. Larger gains from improved management over sparing–sharing for tropical forests. Nature Sustainability 2, 53–61.
- Sardain et al. (2019) Sardain, A., Sardain, E., Leung, B., 2019. Global forecasts of shipping traffic and biological invasions to 2050. Nature Sustainability 2, 274–282.
- Vander Zanden and Olden (2008) Vander Zanden, M.J., Olden, J.D., 2008. A management framework for preventing the secondary spread of aquatic invasive species. Canadian Journal of Fisheries and Aquatic Sciences 65, 1512–1522.
Figures and Tables
Figures


Tables
| County | Lakes | Infected | Proportion infected | Edges | Trips | Proportion infecting trips | Proportion infecting edges |
|---|---|---|---|---|---|---|---|
| Itasca | 854 | 7 | 0.01 | 17954 | 183194.95 | 0.08 | 0.06 |
| Otter Tail | 834 | 39 | 0.05 | 12350 | 206542.70 | 0.08 | 0.22 |
| Cook | 759 | 2 | 0.00 | 5531 | 182179.20 | 0.02 | 0.06 |
| Lake | 726 | 2 | 0.00 | 6815 | 171210.15 | 0.02 | 0.04 |
| Saint Louis | 725 | 2 | 0.00 | 19009 | 266655.20 | 0.07 | 0.03 |
| Cass | 529 | 8 | 0.02 | 14613 | 187737.35 | 0.07 | 0.09 |
| Crow Wing | 423 | 30 | 0.07 | 18030 | 151953.00 | 0.09 | 0.20 |
| Becker | 346 | 11 | 0.03 | 9737 | 109867.80 | 0.09 | 0.12 |
| Hubbard | 293 | 2 | 0.01 | 8683 | 120288.30 | 0.08 | 0.03 |
| Beltrami | 253 | 7 | 0.03 | 4773 | 93535.95 | 0.08 | 0.11 |
| Aitkin | 239 | 3 | 0.01 | 3794 | 76799.55 | 0.10 | 0.06 |
| Douglas | 238 | 26 | 0.11 | 5934 | 90715.25 | 0.07 | 0.24 |
| Clearwater | 231 | 2 | 0.01 | 1171 | 58420.35 | 0.04 | 0.07 |
| Stearns | 195 | 6 | 0.03 | 3161 | 66440.25 | 0.11 | 0.10 |
| Wright | 182 | 8 | 0.04 | 6813 | 101686.40 | 0.11 | 0.11 |
| Polk | 168 | 1 | 0.01 | 527 | 26890.15 | 0.06 | 0.08 |
| Pope | 140 | 6 | 0.04 | 1330 | 40824.50 | 0.09 | 0.19 |
| Washington | 133 | 4 | 0.03 | 1521 | 55365.55 | 0.08 | 0.15 |
| Hennepin | 126 | 9 | 0.07 | 3254 | 167916.15 | 0.05 | 0.18 |
| Pine | 123 | 1 | 0.01 | 474 | 23822.15 | 0.09 | 0.08 |
| Kandiyohi | 117 | 10 | 0.09 | 2453 | 54807.30 | 0.11 | 0.21 |
| Carlton | 104 | 1 | 0.01 | 503 | 20779.75 | 0.11 | 0.05 |
| Grant | 103 | 4 | 0.04 | 729 | 23444.85 | 0.09 | 0.19 |
| Clay | 99 | 1 | 0.01 | 263 | 14108.20 | 0.03 | 0.08 |
| Morrison | 94 | 4 | 0.04 | 369 | 21464.85 | 0.07 | 0.21 |
| Todd | 92 | 8 | 0.09 | 1561 | 33351.95 | 0.10 | 0.19 |
| Marshall | 81 | 2 | 0.02 | 634 | 16239.25 | 0.07 | 0.11 |
| Chisago | 74 | 2 | 0.03 | 577 | 28639.25 | 0.11 | 0.10 |
| Big Stone | 72 | 1 | 0.01 | 259 | 14447.70 | 0.07 | 0.08 |
| Anoka | 64 | 1 | 0.02 | 1053 | 39858.60 | 0.14 | 0.05 |
| Dakota | 63 | 5 | 0.08 | 283 | 34870.40 | 0.08 | 0.23 |
| Ramsey | 62 | 8 | 0.13 | 786 | 27668.65 | 0.11 | 0.22 |
| Carver | 56 | 7 | 0.12 | 1147 | 32224.75 | 0.12 | 0.18 |
| Sherburne | 54 | 1 | 0.02 | 426 | 16775.65 | 0.14 | 0.07 |
| Meeker | 53 | 2 | 0.04 | 1032 | 25328.40 | 0.15 | 0.07 |
| Stevens | 44 | 2 | 0.05 | 242 | 9147.60 | 0.10 | 0.15 |
| Scott | 36 | 3 | 0.08 | 370 | 18346.30 | 0.12 | 0.19 |
| Mcleod | 35 | 1 | 0.03 | 499 | 11166.05 | 0.20 | 0.04 |
| Kanabec | 32 | 1 | 0.03 | 148 | 9849.40 | 0.12 | 0.10 |
| Isanti | 31 | 2 | 0.06 | 256 | 14615.65 | 0.13 | 0.12 |
| Le Sueur | 30 | 1 | 0.03 | 512 | 18381.00 | 0.16 | 0.05 |
| Rice | 25 | 1 | 0.04 | 257 | 12246.90 | 0.19 | 0.07 |
| Wadena | 23 | 1 | 0.04 | 67 | 6042.75 | 0.13 | 0.15 |
| Koochiching | 22 | 1 | 0.05 | 58 | 5687.75 | 0.09 | 0.16 |
| Mahnomen | 21 | 1 | 0.05 | 185 | 9260.60 | 0.21 | 0.09 |
| Blue Earth | 20 | 1 | 0.05 | 173 | 10902.85 | 0.18 | 0.08 |
| Brown | 19 | 1 | 0.05 | 86 | 4078.65 | 0.17 | 0.12 |
| Cottonwood | 19 | 1 | 0.05 | 72 | 4044.00 | 0.15 | 0.15 |
| Goodhue | 18 | 3 | 0.17 | 36 | 12430.05 | 0.00 | 0.14 |
| Mille Lacs | 18 | 2 | 0.11 | 35 | 14304.90 | 0.03 | 0.26 |
| Murray | 18 | 1 | 0.06 | 80 | 5165.85 | 0.17 | 0.14 |
| Lyon | 17 | 1 | 0.06 | 83 | 3695.85 | 0.23 | 0.14 |
| Swift | 17 | 1 | 0.06 | 51 | 2012.40 | 0.17 | 0.18 |
| Benton | 13 | 1 | 0.08 | 22 | 3232.40 | 0.17 | 0.14 |
| Jackson | 12 | 1 | 0.08 | 76 | 3519.15 | 0.26 | 0.13 |
| Sibley | 12 | 1 | 0.08 | 25 | 3256.20 | 0.16 | 0.16 |
| Lincoln | 11 | 1 | 0.09 | 53 | 5110.05 | 0.29 | 0.15 |
| Waseca | 10 | 1 | 0.10 | 47 | 5542.50 | 0.18 | 0.13 |
| Olmsted | 9 | 2 | 0.22 | 15 | 3542.40 | 0.03 | 0.13 |
| Winona | 9 | 4 | 0.44 | 39 | 8793.15 | 0.04 | 0.21 |
| Yellow Medicine | 9 | 1 | 0.11 | 18 | 1909.20 | 0.13 | 0.17 |
| Lake Of The Woods | 8 | 1 | 0.12 | 8 | 6829.55 | 0.06 | 0.12 |
| Nobles | 8 | 1 | 0.12 | 44 | 4092.40 | 0.19 | 0.14 |
| Renville | 7 | 1 | 0.14 | 23 | 1231.65 | 0.20 | 0.17 |
| Wabasha | 7 | 2 | 0.29 | 10 | 5349.60 | 0.00 | 0.00 |
| Freeborn | 6 | 1 | 0.17 | 8 | 2367.55 | 0.17 | 0.12 |
| Lac Qui Parle | 6 | 2 | 0.33 | 14 | 3627.55 | 0.01 | 0.21 |
| Mower | 6 | 1 | 0.17 | 6 | 988.85 | 0.01 | 0.17 |
| Steele | 6 | 1 | 0.17 | 6 | 933.75 | 0.12 | 0.17 |
| Wilkin | 6 | 2 | 0.33 | 6 | 1060.55 | 0.00 | 0.00 |
| Traverse | 5 | 1 | 0.20 | 12 | 2559.45 | 0.21 | 0.25 |
| Watonwan | 5 | 1 | 0.20 | 15 | 1024.10 | 0.24 | 0.20 |
| Chippewa | 4 | 0 | 0.00 | 4 | 905.95 | 0.00 | 0.00 |
| Faribault | 4 | 1 | 0.25 | 4 | 495.00 | 0.10 | 0.25 |
| Kittson | 3 | 1 | 0.33 | 3 | 617.55 | 0.14 | 0.33 |
| Martin | 3 | 0 | 0.00 | 3 | 596.15 | 0.00 | 0.00 |
| Nicollet | 3 | 0 | 0.00 | 3 | 472.70 | 0.00 | 0.00 |
| Redwood | 3 | 1 | 0.33 | 3 | 369.80 | 0.08 | 0.33 |
| Roseau | 3 | 1 | 0.33 | 3 | 205.00 | 0.30 | 0.33 |
| Dodge | 2 | 1 | 0.50 | 2 | 508.85 | 0.02 | 0.50 |
| Rock | 2 | 0 | 0.00 | 2 | 490.30 | 0.00 | 0.00 |
| Norman | 1 | 0 | 0.00 | 1 | 248.45 | 0.00 | 0.00 |
| Pennington | 1 | 0 | 0.00 | 1 | 209.90 | 0.00 | 0.00 |
| Pipestone | 1 | 0 | 0.00 | 1 | 156.10 | 0.00 | 0.00 |
| Budget | Information | Metric | Median | Lower quartile | Average % | Proportion perfect | Proportion |
|---|---|---|---|---|---|---|---|
| 0.1 | full | degree | 1.00 | 1.00 | 0.99 | 0.88 | 0.00 |
| 0.1 | full | hub+auth | 1.00 | 0.98 | 0.91 | 0.71 | 0.00 |
| 0.1 | full | hub*auth | 0.98 | 0.88 | 0.60 | 0.41 | 0.12 |
| 0.1 | full | PR | 0.99 | 0.80 | 0.74 | 0.49 | 0.06 |
| 0.1 | full | btw | 0.93 | 0.84 | 0.72 | 0.24 | 0.06 |
| 0.1 | low s/full e | degree | 0.88 | 0.72 | 0.55 | 0.20 | 0.16 |
| 0.1 | low s/full e | hub+auth | 0.92 | 0.88 | 0.77 | 0.24 | 0.02 |
| 0.1 | low s/full e | hub*auth | 0.88 | 0.65 | 0.40 | 0.22 | 0.25 |
| 0.1 | low s/full e | PR | 0.92 | 0.87 | 0.74 | 0.25 | 0.04 |
| 0.1 | low s/full e | btw | 0.93 | 0.84 | 0.72 | 0.24 | 0.06 |
| 0.1 | full s/low e | degree | 0.94 | 0.83 | 0.65 | 0.24 | 0.10 |
| 0.1 | full s/low e | hub+auth | 0.96 | 0.87 | 0.67 | 0.31 | 0.08 |
| 0.1 | full s/low e | hub*auth | 0.95 | 0.86 | 0.67 | 0.29 | 0.10 |
| 0.1 | full s/low e | PR | 0.82 | 0.64 | 0.40 | 0.20 | 0.31 |
| 0.1 | full s/low e | btw | 0.69 | 0.50 | 0.42 | 0.04 | 0.45 |
| 0.1 | low s/low e | degree | 0.83 | 0.64 | 0.51 | 0.12 | 0.31 |
| 0.1 | low s/low e | hub+auth | 0.83 | 0.66 | 0.52 | 0.12 | 0.27 |
| 0.1 | low s/low e | hub*auth | 0.83 | 0.66 | 0.52 | 0.12 | 0.27 |
| 0.1 | low s/low e | PR | 0.74 | 0.62 | 0.44 | 0.08 | 0.35 |
| 0.1 | low s/low e | btw | 0.82 | 0.64 | 0.53 | 0.08 | 0.29 |
| 0.1 | minimal | degree | 0.81 | 0.58 | 0.48 | 0.10 | 0.35 |
| 0.1 | minimal | hub+auth | 0.81 | 0.59 | 0.48 | 0.10 | 0.29 |
| 0.1 | minimal | hub*auth | 0.81 | 0.59 | 0.48 | 0.10 | 0.29 |
| 0.1 | minimal | PR | 0.81 | 0.62 | 0.48 | 0.06 | 0.31 |
| 0.1 | minimal | btw | 0.80 | 0.61 | 0.46 | 0.06 | 0.31 |
| 0.5 | full | degree | 1.00 | 0.99 | 0.99 | 0.74 | 0.00 |
| 0.5 | full | hub+auth | 1.00 | 0.98 | 0.93 | 0.66 | 0.02 |
| 0.5 | full | hub*auth | 0.97 | 0.93 | 0.82 | 0.26 | 0.03 |
| 0.5 | full | PR | 0.99 | 0.94 | 0.90 | 0.47 | 0.00 |
| 0.5 | full | btw | 0.97 | 0.92 | 0.80 | 0.10 | 0.05 |
| 0.5 | low s/full e | degree | 0.97 | 0.93 | 0.84 | 0.12 | 0.03 |
| 0.5 | low s/full e | hub+auth | 0.97 | 0.95 | 0.86 | 0.17 | 0.03 |
| 0.5 | low s/full e | hub*auth | 0.96 | 0.90 | 0.72 | 0.12 | 0.09 |
| 0.5 | low s/full e | PR | 0.96 | 0.92 | 0.83 | 0.12 | 0.03 |
| 0.5 | low s/full e | btw | 0.97 | 0.92 | 0.80 | 0.10 | 0.05 |
| 0.5 | full s/low e | degree | 0.91 | 0.81 | 0.62 | 0.16 | 0.09 |
| 0.5 | full s/low e | hub+auth | 0.99 | 0.98 | 0.90 | 0.38 | 0.02 |
| 0.5 | full s/low e | hub*auth | 0.99 | 0.98 | 0.85 | 0.38 | 0.03 |
| 0.5 | full s/low e | PR | 0.72 | 0.61 | 0.48 | 0.05 | 0.38 |
| 0.5 | full s/low e | btw | 0.85 | 0.75 | 0.53 | 0.00 | 0.24 |
| 0.5 | low s/low e | degree | 0.98 | 0.95 | 0.81 | 0.17 | 0.05 |
| 0.5 | low s/low e | hub+auth | 0.97 | 0.95 | 0.80 | 0.17 | 0.05 |
| 0.5 | low s/low e | hub*auth | 0.97 | 0.95 | 0.80 | 0.17 | 0.05 |
| 0.5 | low s/low e | PR | 0.94 | 0.90 | 0.69 | 0.09 | 0.10 |
| 0.5 | low s/low e | btw | 0.97 | 0.95 | 0.83 | 0.19 | 0.02 |
| 0.5 | minimal | degree | 0.98 | 0.95 | 0.86 | 0.19 | 0.02 |
| 0.5 | minimal | hub+auth | 0.97 | 0.95 | 0.79 | 0.16 | 0.07 |
| 0.5 | minimal | hub*auth | 0.97 | 0.95 | 0.79 | 0.16 | 0.07 |
| 0.5 | minimal | PR | 0.95 | 0.92 | 0.80 | 0.16 | 0.03 |
| 0.5 | minimal | btw | 0.97 | 0.96 | 0.84 | 0.19 | 0.02 |
| Budget category | Information | Metric | Median | Lower quartile | Average % | Proportion perfect | Proportion |
|---|---|---|---|---|---|---|---|
| (0,0.25] | full | degree | 1.00 | 1.00 | 0.99 | 0.87 | 0.00 |
| (0,0.25] | full | hub+auth | 1.00 | 0.97 | 0.89 | 0.66 | 0.01 |
| (0,0.25] | full | hub*auth | 0.97 | 0.88 | 0.60 | 0.36 | 0.13 |
| (0,0.25] | full | PR | 0.96 | 0.83 | 0.74 | 0.45 | 0.05 |
| (0,0.25] | full | btw | 0.93 | 0.84 | 0.72 | 0.23 | 0.06 |
| (0,0.25] | low s/full e | degree | 0.89 | 0.73 | 0.52 | 0.20 | 0.20 |
| (0,0.25] | low s/full e | hub+auth | 0.93 | 0.88 | 0.74 | 0.24 | 0.05 |
| (0,0.25] | low s/full e | hub*auth | 0.89 | 0.63 | 0.38 | 0.21 | 0.28 |
| (0,0.25] | low s/full e | PR | 0.93 | 0.86 | 0.73 | 0.24 | 0.05 |
| (0,0.25] | low s/full e | btw | 0.93 | 0.84 | 0.72 | 0.23 | 0.06 |
| (0,0.25] | full s/low e | degree | 0.95 | 0.85 | 0.65 | 0.25 | 0.10 |
| (0,0.25] | full s/low e | hub+auth | 0.97 | 0.90 | 0.69 | 0.29 | 0.08 |
| (0,0.25] | full s/low e | hub*auth | 0.97 | 0.90 | 0.69 | 0.29 | 0.10 |
| (0,0.25] | full s/low e | PR | 0.79 | 0.63 | 0.41 | 0.14 | 0.32 |
| (0,0.25] | full s/low e | btw | 0.72 | 0.52 | 0.41 | 0.03 | 0.41 |
| (0,0.25] | low s/low e | degree | 0.84 | 0.66 | 0.52 | 0.11 | 0.27 |
| (0,0.25] | low s/low e | hub+auth | 0.85 | 0.67 | 0.53 | 0.11 | 0.25 |
| (0,0.25] | low s/low e | hub*auth | 0.85 | 0.67 | 0.53 | 0.11 | 0.25 |
| (0,0.25] | low s/low e | PR | 0.79 | 0.63 | 0.42 | 0.09 | 0.32 |
| (0,0.25] | low s/low e | btw | 0.83 | 0.66 | 0.51 | 0.09 | 0.27 |
| (0,0.25] | minimal | degree | 0.84 | 0.64 | 0.46 | 0.10 | 0.29 |
| (0,0.25] | minimal | hub+auth | 0.83 | 0.65 | 0.47 | 0.08 | 0.27 |
| (0,0.25] | minimal | hub*auth | 0.83 | 0.65 | 0.47 | 0.08 | 0.27 |
| (0,0.25] | minimal | PR | 0.83 | 0.65 | 0.46 | 0.08 | 0.29 |
| (0,0.25] | minimal | btw | 0.82 | 0.63 | 0.45 | 0.07 | 0.32 |
| (0.25,1] | full | degree | 1.00 | 0.99 | 0.99 | 0.74 | 0.00 |
| (0.25,1] | full | hub+auth | 1.00 | 0.98 | 0.93 | 0.66 | 0.02 |
| (0.25,1] | full | hub*auth | 0.97 | 0.93 | 0.82 | 0.26 | 0.03 |
| (0.25,1] | full | PR | 0.99 | 0.94 | 0.90 | 0.47 | 0.00 |
| (0.25,1] | full | btw | 0.97 | 0.92 | 0.80 | 0.10 | 0.05 |
| (0.25,1] | low s/full e | degree | 0.97 | 0.93 | 0.84 | 0.12 | 0.03 |
| (0.25,1] | low s/full e | hub+auth | 0.97 | 0.95 | 0.86 | 0.17 | 0.03 |
| (0.25,1] | low s/full e | hub*auth | 0.96 | 0.90 | 0.72 | 0.12 | 0.09 |
| (0.25,1] | low s/full e | PR | 0.96 | 0.92 | 0.83 | 0.12 | 0.03 |
| (0.25,1] | low s/full e | btw | 0.97 | 0.92 | 0.80 | 0.10 | 0.05 |
| (0.25,1] | full s/low e | degree | 0.91 | 0.81 | 0.62 | 0.16 | 0.09 |
| (0.25,1] | full s/low e | hub+auth | 0.99 | 0.98 | 0.90 | 0.38 | 0.02 |
| (0.25,1] | full s/low e | hub*auth | 0.99 | 0.98 | 0.85 | 0.38 | 0.03 |
| (0.25,1] | full s/low e | PR | 0.72 | 0.61 | 0.48 | 0.05 | 0.38 |
| (0.25,1] | full s/low e | btw | 0.85 | 0.75 | 0.53 | 0.00 | 0.24 |
| (0.25,1] | low s/low e | degree | 0.98 | 0.95 | 0.81 | 0.17 | 0.05 |
| (0.25,1] | low s/low e | hub+auth | 0.97 | 0.95 | 0.80 | 0.17 | 0.05 |
| (0.25,1] | low s/low e | hub*auth | 0.97 | 0.95 | 0.80 | 0.17 | 0.05 |
| (0.25,1] | low s/low e | PR | 0.94 | 0.90 | 0.69 | 0.09 | 0.10 |
| (0.25,1] | low s/low e | btw | 0.97 | 0.95 | 0.83 | 0.19 | 0.02 |
| (0.25,1] | minimal | degree | 0.98 | 0.95 | 0.86 | 0.19 | 0.02 |
| (0.25,1] | minimal | hub+auth | 0.97 | 0.95 | 0.79 | 0.16 | 0.07 |
| (0.25,1] | minimal | hub*auth | 0.97 | 0.95 | 0.79 | 0.16 | 0.07 |
| (0.25,1] | minimal | PR | 0.95 | 0.92 | 0.80 | 0.16 | 0.03 |
| (0.25,1] | minimal | btw | 0.97 | 0.96 | 0.84 | 0.19 | 0.02 |
| Budget | Metric | Median | Lower quartile | Average % | Proportion perfect | Proportion |
|---|---|---|---|---|---|---|
| 0.1 | random | 0.14 | 0.08 | 0.06 | 0 | 1 |
| 0.5 | random | 0.32 | 0.22 | 0.16 | 0 | 1 |
| Budget category | Metric | Median | Lower quartile | Average % | Proportion perfect | Proportion |
|---|---|---|---|---|---|---|
| (0,0.25] | random | 0.15 | 0.10 | 0.06 | 0 | 1 |
| (0.25,1] | random | 0.32 | 0.22 | 0.16 | 0 | 1 |