Origin of Galactic sub-PeV diffuse gamma-ray emission: constraints from high-energy neutrino observations
Abstract
Very recently, diffuse gamma rays with PeV have been discovered from the Galactic disk by the Tibet air shower array and muon detector array (Tibet AS+MD array). While the measured sub-PeV flux may be compatible with the hadronic origin in the conventional Galactic cosmic ray propagation model, we find that it is in possible tension with the non-detection of Galactic neutrino emissions by the IceCube neutrino telescope. We further find that the presence of an extra cosmic ray component of relatively hard spectrum, which is probably related to the Cygnus Cocoon region and other PeV cosmic-ray sources in the Galactic disk, would alleviate the tension. This scenario implies the existence of an extreme accelerator of either protons or electrons beyond PeV in the Cygnus region, and predicts the continuation of the gamma-ray spectrum of Cygnus Cocoon up to 1 PeV with a possible hardening beyond TeV.
I Introduction
The gamma-ray sky is dominated by the diffuse emission from the Galactic plane. The survey by gamma-ray satellites such as SAS-2 (Fichtel et al. 1975), EGRET on the Compton Gamma-Ray Observatory (Hunter et al. 1997), Fermi Large Area Telescopes (Ackermann et al. 2012; Neronov & Semikoz 2020, Fermi-LAT,) have measured diffuse gamma-ray emission from the Galactic plane from several tens of MeV up to TeV energies. Ground-based gamma-ray instruments can also measure Galactic diffuse gamma rays from a fraction of the Galactic plane due to the limited observable sky. Milagro (Atkins et al. 2005) and ARGO-YBJ (Bartoli et al. 2015) have extended the Galactic diffuse gamma-ray spectrum up to several TeV. The leading radiation mechanism for the diffuse Galactic gamma-ray emission (DGE) is believed to be the decay of neutral pions generated from hadronic interactions of cosmic ray (CR) protons with the interstellar medium (Dermer 1986; Mori 1997; Strong et al. 2010, e.g.), whereas energetic CR electron/positron pairs escaping from pulsar wind nebulae around middle-aged pulsars may also have an important contribution to the DGE at TeV band (Linden & Buckman 2018). Therefore, the DGE can serve as a probe of the CR distribution in the Galactic disk, and be used to study the CR propagation and their origin. Very recently, Amenomori et al. 2021 reported detection of PeV DGE by the Tibet AS+MD array. All gamma rays above 398 TeV are observed apart from of any known TeV sources and hence unlikely originate from leptonic sources since high-energy electrons cannot propagate far from sources before being cooled. The detection of diffuse sub-PeV gamma-ray emission of the hadronic origin provides a good opportunity to study the origin of PeV CRs.
Since high-energy neutrinos always accompany with the production of pionic gamma rays, a diffuse high-energy neutrino background is expected from the Galactic plane. Recently, the IceCube neutrino telescope has obtained an upper limit on the neutrino flux of the Galactic plane in the energy range of TeV Aartsen et al. 2017. This motivates us to compare the diffuse gamma-ray emission measured by the Tibet AS+MD array and the neutrino flux constraint from IceCube. As will be shown in this Letter, we find that if we require the model neutrino intensity to be consistent with the 90% C.L. upper limit of Galaxy, the model gamma-ray intensity is lower than the measured flux by the Tibet AS+MD array especially at the highest-energy bin in TeV. It may indicate that some additional sources contribute to the diffuse sub-PeV gamma-rays measured by the Tibet AS+MD array. For example, Ahlers & Murase 2014 suggested that remnants of historical yet unresolved hypernovae, which are believed to be capable of energizing protons up to 1 EeV (Wang et al. 2007; Budnik et al. 2008), may contribute to the sub-PeV DGE while not overproduce Galactic neutrinos.
Interestingly, as pointed out by Amenomori et al. 2021, 4 out of 10 measured events above 398 TeV are detected within from the center of the so-called Cygnus Cocoon. Therefore, a non-negligible fraction of the diffuse gamma-ray flux measured by the Tibet AS+MD array may originate from the Cygnus region. Indeed, various instruments have detected excess of gamma-ray emission from GeV up to 100 TeV from Cygnus Cocoon (Ackermann et al. 2011; Bartoli et al. 2012; Abeysekara et al. 2018; Abeysekara et al. 2021), which is probably a superbubble related to the massive star cluster Cygnus OB2 and is also in spatial coincidence with a pulsar wind nebula, PWN TeV J2032+4130 and a supernova remnant, Cygni. All of these objects are possible sources of energetic protons and electrons so that they are potential sources of these gamma rays. We speculate that a significant fraction of sub-PeV gamma-rays detected by the Tibet AS+MD array may originate from the Cygnus region and/or some other extended sources in the Galactic disk, rather than the true diffuse gamma rays. We will study whether this scenario can alleviate the tension.
II Gamma-ray and Neutrino Emission of Cosmic Rays in the Galactic disk
To calculate the diffuse gamma-ray and neutrino emission produced by the proton-proton () collisions between CRs and the interstellar medium, we need to know their spatial distributions, i.e., and with being the CR energy, the radius from the Galactic center projected in the Galactic plane and the height from the Galactic plane. We here employ the model developed by Lipari & Vernetto 2018, which can successfully reproduce both the flux (with an error of order depending on the direction) and the main features of the angular distribution of the diffuse gamma-ray flux measured by Fermi-LAT. The model parameterizes and as well as the CR slope as a function of and analytically so it can save a lot of computation time for modelling the CR transport and spatial distribution. Following the “factorized model” in that paper, we can then obtain the diffuse gamma-ray or neutrino intensity (in unit of ) in certain direction with Galactic coordinate by performing the line-of-sight integration
| (1) |
where denotes the operator calculating the gamma-ray or neutrino emissivity of collisions following the semi-analytical method developed by Kelner et al. 2006, is the distance of a certain place from Earth in the direction and the corresponding and can be found by and , where kpc is the distance of Earth from the Galactic center. is the opacity of the pair production of high-energy gamma-ray photon on the cosmic microwave background and the interstellar radiation field. The latter is based on the model by Popescu et al. 2017. Note that this term will not appear in the equation if we calculate the neutrino intensity. To compare with measured DGE spectra from certain region of the Galactic plane, we need to average the intensity over the region of interest, i.e.,
| (2) |
For example, the DGE spectra shown in Amenomori et al. 2021 are extracted from (corresponding to sr), and (corresponding to sr) respectively. The neutrino analysis by IceCube uses the data including the entire Galactic plane, but is primarily sensitive to the northern hemisphere. Therefore, to compare with the neutrino upper limit, we only average the intensity over the Galactic plane in the northern hemisphere (or with declination ), i.e.,
| (3) |
where is the Heaviside function and can be found by , where is the declination of the north Galactic pole and is the longitude of the northern equatorial pole. The corresponding solid angle of the region of interest for the neutrino emission is sr.
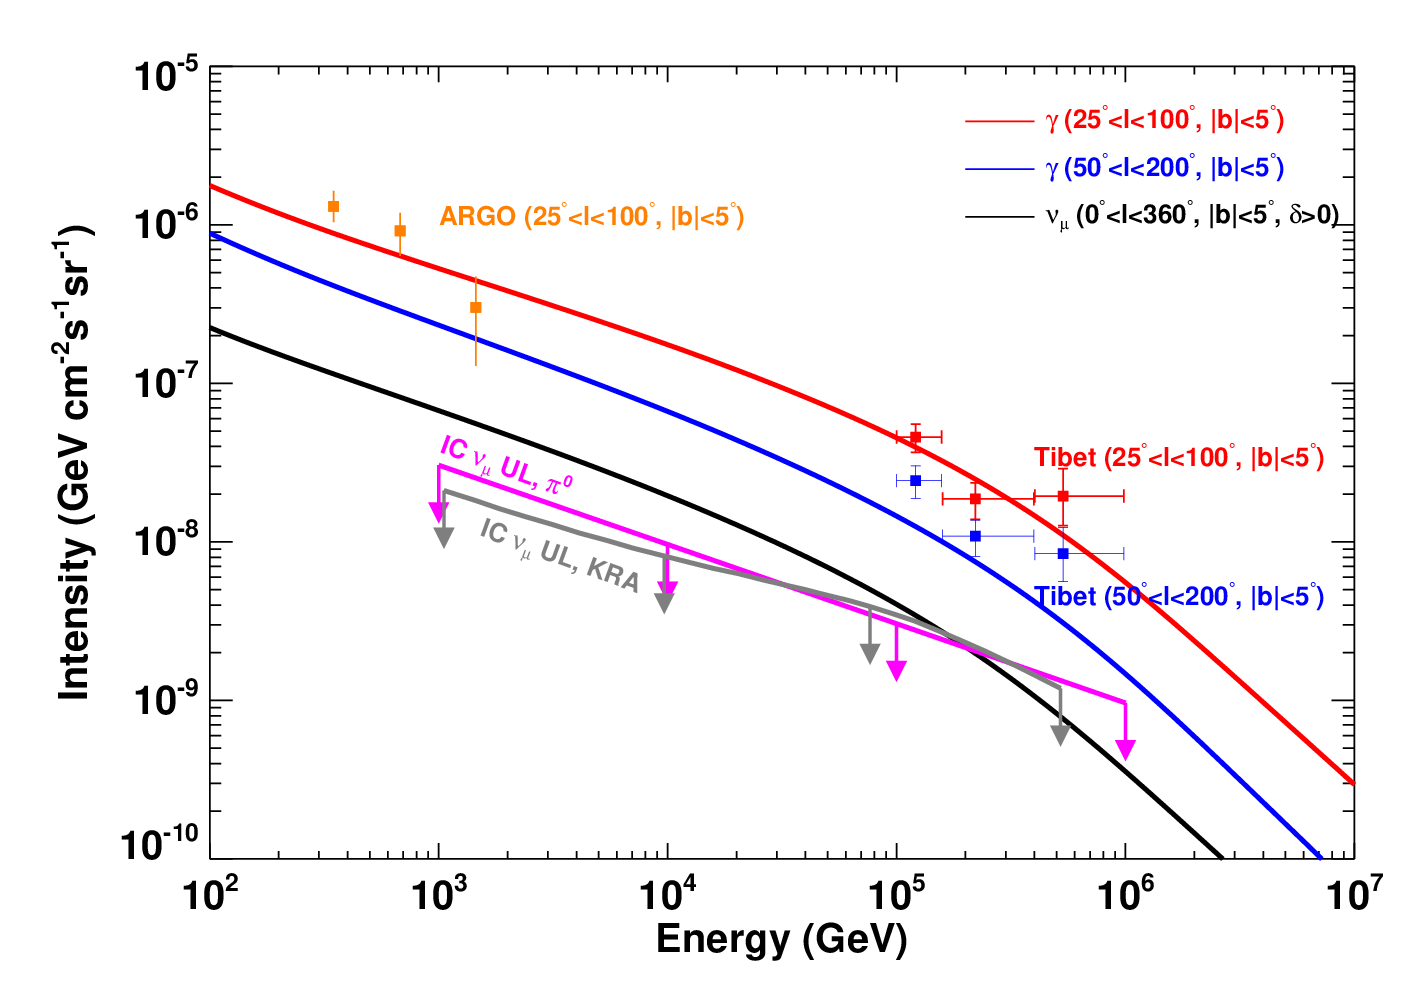
We compare the gamma-ray intensity and neutrino intensity predicted by the model with the observations in Fig. 1. For the predicted gamma-ray intensity, our result is the generally the same with that shown in Fig.20 of Lipari & Vernetto 2018. The model intensity is slightly lower than the measured intensity by the Tibet AS+MD array, in particular at the highest-energy bin, for both and . Such a difference is not significant considering the systematic error, as pointed out by Amenomori et al. 2021. However, we also see that the accompanying neutrino intensity exceeds the 90% confidence level (C.L.) upper limit of IceCube11 1 The neutrino upper limit given in Aartsen et al. 2017 is scaled to represent an all-sky integrated flux. We need to divide the given upper limit by a factor of for comparison. below 100 TeV by about a factor of 2. In other words, there might be a tension between the diffuse sub-PeV gamma-ray data and the neutrino data, and if we want to reconcile the model neutrino intensity with the IceCube’s upper limit, we need to multiply a factor of 0.5 to the neutrino intensity. In the mean time, it would reduce the predicted gamma-ray intensity by the same factor and make it insufficient to explain the DGE data especially for the highest-energy bin. Note that there are some uncertainties of the model, such as the metallicty of both CRs and the interstellar medium which would influence the predicted gamma-ray or neutrino intensity up to a factor of 2, as well as the spatial variation of CR density and spectra in the Galactic plane and etc. Therefore, it is acceptable to have the flexibility of a factor of a few for the model intensity.
In fact, the model uncertainty influencing the amplitude of the gamma-ray intensity would not affect our result significantly because we re-scale the gamma-ray intensity according to the co-produced neutrino intensity and the IceCube upper limit. On the other hand, the spectral variation of CRs across the Galaxy is important. The factorized model of Lipari & Vernetto 2018 employed here considers the hardening of the CR spectrum towards the inner Galaxy, from a slope of 2.8 in the periphery of the Galaxy to 2.4 at the Galactic center. Lipari & Vernetto 2018 also constructed a “no-factorized model” with a uniform CR spectral slope, identical to the locally measured one, throughout the Galaxy. If we adopt the no-factorized model, the resulting diffuse gamma-ray spectrum would be softer than the present one for . Consequently, it will be more insufficient to explain the measured intensity of the highest-energy bin solely with the diffusive CRs and strengthen our motivation to investigate additional contributions from extended sources. In contrast, if the CR spectral slope turns out to be harder than that in the factorized model in the inner Galaxy, the tension between the sub-PeV DGE and the Galactic neutrino flux upper limit can be alleviated.
III Possible contribution from Cygnus Cocoon and other PeV CR sources
It is reported that the total event number in the 398 TeV – 1000 TeV bin observed by the Tibet AS+MD array is ten in each of the region and . Among both of them, 4 out of 10 photons originate from the region within of the center of Cygnus Cocoon at (Amenomori et al. 2021). The Cygnus Cocoon region contains some potential sources for PeV CRs such as the massive star cluster Cygnus OB2 and the supernova remnant Gamma Cygni, so the energetic, fresh CRs may permeate throughout the entire region with a higher density than the average one in the interstellar medium. Although the analysis of the diffuse emission has excluded the region within of the known TeV sources (Amenomori et al. 2021), the radial profile of the TeV gamma-ray of Cygnus Cocoon is quite extended which can be described by a Gaussian profile with width of (Abeysekara et al. 2021). Therefore, most of the emission of Cygnus Cocoon probably has been counted in the diffuse emission. As a result, we should also consider an additional component from Cygnus Cocoon when modelling the intensity in both regions of and .
The TeV spectrum of the Cygnus Cocoon region has been measured by HAWC up to 100 TeV, which can be described by a power-law function with an index of 2.6 (Abeysekara et al. 2021). If part of the DGE between 398 TeV – 1000 TeV measured by the Tibet AS+MD array can be attributed to Cygnus Cocoon, it implies that its spectrum should continue somehow up to 1 PeV and indication the existence of an extreme accelerator of CRs in that region processing protons up to at least 10 PeV. To evaluate the sub-PeV flux of Cygnus Cocoon, however, we need to know the relative exposure time of the instrument on the Cygnus region and on other region of the Galactic plane, which is not given. If we simply assume a uniform exposure of the Tibet AS+MD array over the observed Galactic plane, the fact that 4 out of 10 total events in both and from Cygnus Cocoon would mean that a fraction of the total DGE flux () at this energy originates from the source. Comparing it with the HAWC data, we see a flattening of the spectrum above TeV (see the filled red and blue squares in Fig. 2) and this would imply a different origin of the emission below 30 TeV. We note that this is most likely an overestimation of the sub-PeV flux since the exposure for Cygnus Cocoon would be longer than the average value for the Galactic plane22 2 Roughly speaking, the exposure time is larger if the source’s declination is closer to the instrument’s declination for a fixed live time. The declination of Cygnus Cocoon is while that of the Tibet AS+MD array is , which is quite close to each other. So we expect the exposure time of Cygnus Cocoon is longer than the average of the Galactic plane., but we take it as a reference case and refer to it as CASE I. On the other hand, if we assume the flux of Cygnus Cocoon at 398 TeV – 1000 TeV is consistent with the extrapolation of HAWC’s spectrum, Cygnus Cocoon would account for only about of the DGE intensity at the highest-energy bin measured by the Tibet AS+MD array (see the open red and blue squares in Fig. 2). We refer to this case as CASE II.
III.1 The Case of Hadronic Origin
The HAWC observation on Cygnus Cocoon favors a hadronic origin of the TeV gamma-ray emission (Abeysekara et al. 2021). For a phenomenological modelling of the gamma-ray emission of Cygnus Cocoon, we consider a total proton energy of contained in the Cygnus region with a spectrum following to explain the emission above 30 TeV of Cygnus Cocoon in CASE I, and we assume the proton spectrum to be to account for also the spectrum below 1 TeV in CASE II, where can be determined by .
We then can obtain the gamma-ray flux related to the sub-PeV DGE from Cygnus Cocoon by
| (4) |
given the average gas density of in Cygnus Cocoon (Aharonian et al. 2019) and its distance kpc. We find the derived gamma-ray flux can match both the HAWC data and the postulated sub-PeV flux, with TeV and ergs in CASE I, and with PeV and ergs in CASE II as shown in Fig. 2. In this case, high-energy neutrinos are naturally expected from Cygnus Cocoon, as also predicted in some previous literature (Beacom & Kistler 2007; Evoli et al. 2007; Bi et al. 2009; Tchernin et al. 2013; Fox et al. 2013; Yoast-Hull et al. 2017, e.g.,). We calculated the co-produced neutrino flux and find it consistent with the sum of the upper limits for 2HWC J2031+415 and Gamma Cygni (Aartsen et al. 2020), which are two potential CR sources related to Cygnus Cocoon.

In addition to Cygnus Cocoon, there may be other sources injecting CRs with energy beyond 1 PeV into our Galaxy, although the others may be less powerful than Cygnus Cocoon. Similar to the case of Cygnus Cocoon, these super-PeV CRs diffuse quite fast, distributing over an extended region around their source, and produce gamma rays with a harder spectrum than that from the bulk of the interstellar medium. Without known the properties of these extended sources, we use Cygnus Cocoon’s emission as a proxy of all these extended sources and parameterize the contribution of other sources by a coefficient , i.e.,
| (5) |
The result is shown in Fig. 3. In CASE I, it needs to make the sum of the contribution by diffuse CRs and extended sources fit the diffuse gamma-ray spectra measured by the Tibet AS+MD array. The co-produced neutrino flux is consistent with the neutrino upper limit. Note that neutrinos now come from both discrete sources and diffusive CRs in the Galactic disk, so we compare it with the sum of the neutrino upper limits for diffuse Galactic emission as shown in Fig. 1 and the sources. For the latter, we employ the results in Aartsen et al. 2017 for five catalogs of potential Galactic high-energy CR sources and sum up the upper limits of all the catalogs. In CASE II, since the contribution of Cygnus Cocoon is low, it needs to fit the diffuse gamma-ray spectra. However, due to the soft proton spectrum in this case, the co-produced neutrino flux exceeds the upper limit. Therefore, the value of , the fraction of the sub-PeV DGE that can be attributed to Cygnus region, is probably larger than 5% (but lower than 40% as CASE I is most likely an overestimation). With a larger , a harder proton spectrum will be inferred and subsequently the neutrino flux at low energies can be reduced. A larger also implies that a hardening in the gamma-ray spectrum of Cygnus Cocoon would appear beyond TeV, and this might suggest a different origin for the TeV emission below 30 TeV. Note that, the spectra of other sources are not necessarily the same with that of Cygnus Cocoon. Thus, given a soft spectrum of Cygnus Cocoon with a low flux at sub-PeV such as in CASE II, the DGE at sub-PeV energy could be still explained if other sources have harder spectra.


III.2 The Case of Leptonic Origin
Although HAWC’s observation on Cygnus Cocoon favors a hadronic origin, it does not exclude a leptonic origin completely for TeV gamma-ray emission above 1 TeV. Indeed, if there exists a powerful CR proton accelerator in the center of Cygnus Cocoon, it should be able to produce high-energy electrons too. The pulsar wind nebulae powered by PSR J2032+4127 and/or other unresolved pulsars may also inject high-energy electrons into ambient medium. Therefore, we also discuss a possible source contribution of leptonic origin to the sub-PeV DGE and we refer to this case as CASE III.
The sub-PeV gamma rays in the case of the leptonic origin can arise from the inverse Compton scattering (IC) of PeV electrons off the CMB radiation, whereas the IC process off radiation field of higher temperature such as the dust infrared radiation and the stellar optical-UV radiation are severely suppressed by the Klein-Nishina (KN) effect. In fact, even for CMB radiation with typical energy of eV, their scatterings with PeV electrons have also entered the KN regime, and thus we may expect the upscattered photon energy to be close to the electron energy, i.e., . Electrons lose their energies as they radiate. The dominant cooling channel of electrons in the considered scenario is the synchrotron radiation with a cooling timescale of yr, as long as the magnetic field in Cygnus Cocoon is not much weaker than the typical interstellar magnetic field G (compare the synchrotron cooling timescale and the IC cooling timescale in Fig. 5). Since the cooling timescale is much shorter than the dynamical timescale of the system, the IC spectrum can be estimated by . Here, is the injection spectrum, and approximately in the range of PeV. Thus, we obtain . To explain the DGE measured by the Tibet AS+MD array, the spectrum should be harder than , because otherwise the source contribution would overshoot the measured DGE intensity at PeV while it fits the PeV intensity. This leads to a requirement of a hard electron injection spectrum with .
On the other hand, a major difference of the leptonic case from the hadronic case is that electrons cool efficiently as they propagate while protons almost do not cool. Because the analysis of the Tibet AS+MD array masked the region within of each known TeV sources, those PeV electrons should at least diffuse to the region beyond of the source, which corresponds to a radius of 12 pc at the nominal distance of 1.4 kpc for Cygnus Cocoon. It then puts a constraint on the diffusion coefficient by pc, or . This translates to , if we follow Abeysekara et al. 2021 which considers an average diffusion coefficient in the Galaxy to be and denote the diffusion coefficient in the Cygnus region by . For a stronger magnetic field, a faster diffusion or a larger will be needed. We show an example of the expected DGE and SED of Cygnus Cocoon under CASE III in Fig. 4, where we employ , , and an electron luminosity of . Note that high-energy neutrinos are not expected from the sources in this case. We see that the DGE measured by the Tibet AS+MD array is marginally explained although the model overpredicts the 200 TeV DGE intensity in .


IV Discussion and Summary
To summarize, we calculated the diffuse gamma-ray intensity and neutrino intensity of the Galactic plane, which arise from hadronic interactions between CRs and the interstellar medium. We found that if we require the model neutrino intensity to be consistent with the 90% C.L. upper limit of Galaxy, the model gamma-ray intensity is lower than the measured flux by the Tibet AS+MD array especially at the highest-energy bin in TeV. We speculated that an additional contribution by CRs with a relatively hard spectrum from the Cygnus region and/or some other extended sources of CRs beyond PeV is needed. Provided that these sources can accelerate electrons to energy beyond 1 PeV, the sub-PeV diffuse gamma-ray emissions may also contributed by the inverse Compton scatterings of PeV electrons off CMB, as long as the injected electron spectra are harder than and the diffusion coefficient in the ambient source region is much larger than times the average diffusion coefficient of the interstellar medium. In such a scenario, Cygnus Cocoon would harbor one (or more) extreme particle accelerator of either protons or electrons beyond PeV, and its gamma-ray spectrum might show a hardening above TeV. If the sub-PeV gamma-ray flux from the Cygnus region turns out be low, other extreme particle accelerators in our Galaxy would make a more important contribution to the diffuse sub-TeV gamma-rays measured by the Tibet AS+MD array. The up-coming TeV – PeV gamma-ray instrument LHAASO (Bai et al. 2019) is promising to test our speculation.
Lastly, we caveat that the upper limits of the neutrino flux employed in this work are only in 90% C.L. Therefore, the constraint from the neutrino flux is not so strict and hence the contribution needed to be attributed to extended sources may be lower. Aartsen et al. 2017 showed a 2D likelihood scan of the normalization and spectral slope of Galactic neutrino flux. For the benchmark spectral index, i.e., 2.5, the 99% C.L. flux upper limit is about 1.5 times the 90% C.L. upper limit as employed in this study. Adopting the 99% C.L. upper limit would relax the tension between the diffuse neutrinos and diffuse gamma rays. Also, the analysis for the neutrino upper limits of the 2HWC J2031+415 and Gamma Cygni, the two sources related to the Cygnus region, assumes point-like source. A dedicated analysis optimized for the extended source could result in a different upper limit. Therefore, we encourage a detailed analysis of the neutrino emission on the Cygnus region with the spatial template of gamma-ray emission above 30 TeV.
Acknowledgements
We thank Christian Haack for helpful discussion on the IceCube data and the anonymous referee for the constructive comments. This work is supported by NSFC grants U2031105, 11625312 and 11851304, and the National Key R & D program of China under the grant 2018YFA0404203.
Diffusion and IC radiation of High-energy Electrons
We consider a simplified case in which high-energy electrons are injected at a constant rate at and diffuse isotropically to larger radius. The injection spectrum is given by for PeV. The prefactor can be found by with being the total electron luminosity, which will be treated as an input parameter. Following Syrovatskii 1959, the electron distribution can be given by
| (6) |
where is taken to be 1 Myr and . represents the trajectory in the energy space of an electron the energy of which is at present, and is the initial energy of the electron at the generation (injection) time . The relation between and as well as can be obtained by the energy evolution of the electron, i.e.,
| (7) |
where is the Thomson cross section, is the electron mass and is the speed of light. is the magnetic field energy density. is the energy density of the th radiation field. is the typical photon energy of the th radiation field of a black body or a grey body radiation field with a temperature and is the Boltzmann constant (Moderski et al. 2005). here includes the CMB radiation and the mean interstellar radiation field of the Galaxy which is composed of an infrared radiation field with K and and an optical radiation field with K and , although the interstellar radiation field has a negligible influence on PeV electrons due to the KN effect. The electron cooling timescale as a function of energy is shown in Fig. 5.
With the electron’s spatial distribution, we can calculate the gamma-ray surface brightness profile by integrating the IC radiation over the line of sight towards an arbitrary angle from the center of Cygnus Cocoon, following the method detailed in Liu et al. 2019. The total unmasked gamma-ray flux related to Cygnus Cocoon then reads
| (8) |
The contribution of extended sources in the leptonic case to the DGE can be obtained by Eq. (5).

References
- Aartsen et al. (2020) Aartsen, M. G. et al. 2020, Phys. Rev. Lett., 124, 051103
- Aartsen et al. (2017) — 2017, ApJ, 849, 67
- Abeysekara et al. (2021) Abeysekara, A. U. et al. 2021, Nature Astronomy
- Abeysekara et al. (2018) — 2018, ApJ, 861, 134
- Ackermann et al. (2011) Ackermann, M. et al. 2011, Science, 334, 1103
- Ackermann et al. (2012) — 2012, ApJ, 750, 3
- Aharonian et al. (2019) Aharonian, F., Yang, R., & de Oña Wilhelmi, E. 2019, Nature Astronomy, 3, 561
- Ahlers & Murase (2014) Ahlers, M. & Murase, K. 2014, PRD, 90, 023010
- Amenomori et al. (2021) Amenomori, M. et al. 2021, Phys. Rev. Lett., 126, 141101
- Atkins et al. (2005) Atkins, R. et al. 2005, Phys. Rev. Lett., 95, 251103
- Bai et al. (2019) Bai, X. et al. 2019, arXiv e-prints, arXiv:1905.02773
- Bartoli et al. (2012) Bartoli, B. et al. 2012, ApJL, 745, L22
- Bartoli et al. (2015) — 2015, ApJ, 806, 20
- Beacom & Kistler (2007) Beacom, J. F. & Kistler, M. D. 2007, PRD, 75, 083001
- Bi et al. (2009) Bi, X.-J., Chen, T.-L., Wang, Y., & Yuan, Q. 2009, ApJ, 695, 883
- Budnik et al. (2008) Budnik, R., Katz, B., MacFadyen, A., & Waxman, E. 2008, ApJ, 673, 928
- Dermer (1986) Dermer, C. D. 1986, Astronomy and Astrophysics, 157, 223
- Evoli et al. (2007) Evoli, C., Grasso, D., & Maccione, L. 2007, JCAP, 2007, 003
- Fichtel et al. (1975) Fichtel, C. E., Hartman, R. C., Kniffen, D. A., Thompson, D. J., Bignami, G. F., Ögelman, H., Özel, M. E., & Tümer, T. 1975, ApJ, 198, 163
- Fox et al. (2013) Fox, D. B., Kashiyama, K., & Mészarós, P. 2013, ApJ, 774, 74
- Gaggero et al. (2015) Gaggero, D., Urbano, A., Valli, M., & Ullio, P. 2015, PRD, 91, 083012
- Hunter et al. (1997) Hunter, S. D. et al. 1997, ApJ, 481, 205
- Kelner et al. (2006) Kelner, S. R., Aharonian, F. A., & Bugayov, V. V. 2006, PRD, 74, 034018
- Linden & Buckman (2018) Linden, T. & Buckman, B. J. 2018, Phys. Rev. Lett., 120, 121101
- Lipari & Vernetto (2018) Lipari, P. & Vernetto, S. 2018, PRD, 98, 043003
- Liu et al. (2019) Liu, R.-Y., Ge, C., Sun, X.-N., & Wang, X.-Y. 2019, ApJ, 875, 149
- Moderski et al. (2005) Moderski, R., Sikora, M., Coppi, P. S., & Aharonian, F. 2005, Mon. Not. R. Astron. Soc., 363, 954
- Mori (1997) Mori, M. 1997, ApJ, 478, 225
- Neronov & Semikoz (2020) Neronov, A. & Semikoz, D. 2020, Astronomy and Astrophysics, 633, A94
- Popescu et al. (2017) Popescu, C. C., Yang, R., Tuffs, R. J., Natale, G., Rushton, M., & Aharonian, F. 2017, Mon. Not. R. Astron. Soc., 470, 2539
- Strong et al. (2010) Strong, A. W., Porter, T. A., Digel, S. W., Jóhannesson, G., Martin, P., Moskalenko, I. V., Murphy, E. J., & Orlando, E. 2010, ApJL, 722, L58
- Syrovatskii (1959) Syrovatskii, S. I. 1959, Soviet Ast., 3, 22
- Tchernin et al. (2013) Tchernin, C., Aguilar, J. A., Neronov, A., & Montaruli, T. 2013, Astronomy and Astrophysics, 560, A67
- Wang et al. (2007) Wang, X.-Y., Razzaque, S., Mészáros, P., & Dai, Z.-G. 2007, PRD, 76, 083009
- Yoast-Hull et al. (2017) Yoast-Hull, T. M., Gallagher, J. S., Halzen, F., Kheirandish, A., & Zweibel, E. G. 2017, PRD, 96, 043011