Few-Shot Meta-Learning on Point Cloud
for Semantic
Segmentation
Abstract
The promotion of construction robots can solve the problem of human resource shortage and improve the quality of decoration. To help the construction robots obtain environmental information, we need to use 3D point cloud, which is widely used in robotics, autonomous driving, and so on. With a good understanding of environmental information, construction robots can work better. However, the dynamic changes of 3D point cloud data may bring difficulties for construction robots to understand environmental information, such as when construction robots renovate houses. The paper proposes a semantic segmentation method for point cloud based on meta-learning. The method includes a basic learning module and a meta-learning module. The basic learning module is responsible for learning data features and evaluating the model, while the meta-learning module is responsible for updating the parameters of the model and improving the model generalization ability. In our work, we pioneered the method of producing datasets for meta-learning in 3D scenes, as well as demonstrated that the Model-Agnostic Meta-Learning (MAML) algorithm can be applied to process 3D point cloud data. At the same time, experiments show that our method can allow the model to be quickly applied to new environments with a few samples. Our method has important applications.
Index Terms:
Artificial intelligence (AI), deep learning (DL), model-agnostic meta-learning (MAML), PointNet, point cloud semantic segmentation (PCSS).I Introduction
China’s aging population is increasing significantly every day [1],[2]. And the problem of human resource shortage will create a huge need for robots. In real estate, construction robots can solve the labor shortage problem, while improving productivity and ensuring production safety. To automate the construction process, robots are required to recognize different objects, such as doors, windows, ceilings, floors, and so on. Or in other words, they are required to be able to semantically understand their surroundings. Normally, the robots obtain information from 2D cameras. However, the interior decoration scenes are poorly lit and quite gloomy, which affects the quality of the pictures taken by the camera. And robots also have to work at night. In contrast, 3D point cloud collected by LiDAR can not be affected by the weather. Moreover, the point cloud can describe the location, shape, size, and other attributes of objects, therefore it can provide more accurate geometric information than 2D images. Again, the popularity of laser scanners and 3D cameras has reduced the cost of acquiring 3D data and the difficulty of obtaining our data.
In this paper, we specifically focus on 3D Point Cloud Semantic Segmentation (PCSS) techniques. PCSS is a major area of interest within the field of autonomous driving [3],[4], virtual reality (VR) [5],[6], and augmented reality (AR) [7],[8]. However, PCSS is limited by the disadvantage of having large amounts of unstructured and unordered data [9]. Previous researchers have approached PCSS as a regular supervised machine learning problem, and their methods are mainly divided into two categories which are individual PCSS and statistical contextual models [10],[11]. Individual PCSS performs cluster analysis of points by the features of each point, such as Support Vector Machines (SVM) [12],[13], Random Forests [14], AdaBoost [15], Bayesian Discriminant Classifiers [16], etc. Such approaches, however, have failed to address the influence of noisy points because they only consider the features of each point. The statistical contextual models, on the other hand, take the relationship between a single point and the surrounding points into consideration, such as Markov Networks [17] and Conditional Random Fields [18]. They overcome the noise problem of initial labeling, and improve the accuracy of the segmentation.
Studies of Convolutional Neural Networks (CNNs) have greatly promoted the development of deep learning-based PCSS. However, CNNs can be adversely affected under certain conditions, such as the input data is unstructured point cloud data. To address this issue, some researchers have proposed various methods, which are mainly divided into three categories: multiview-based, voxel-based, and point-based [11]. H. Su et al. [19] proposed the Multiview-based PCSS method. They input 2D data from multiple perspectives into CNNs to extract features, and then transform the results to 3D to accomplish segmentation. Benefiting from the development of 3D CNNs, D. Maturana et al. [20] combined voxels and 3D CNNs, and proposed Voxel-based 3D CNNs. They use a volumetric grid to represent the estimate of spatial occupancy and then input it to 3D CNNs to predict the class label directly. In 2017, C. R. Qi et al. [21], scholars at Stanford University proposed the PointNet, which directly uses raw 3D point cloud data as input for deep learning applications. PointNet shows strong performance on both ModelNet40 [22] and ShapeNet [23] datasets. The main shortcoming of PointNet is that the local features are ignored. To solve this issue, C. R. Qi et al. [24] proposed PointNet++, which splics a hierarchical neural network with PointNet to capture local representation within the data.
However, previous studies of PCSS have only focused on the accuracy under a large amount of data, they have not dealt with certain conditions in which we only have a small amount of labeled data. In this paper, we propose a new PCSS method which is able to directly process raw point cloud data and extract features from a small number of samples. Our network consists of two main modules. The first module is the basic learning module, which aims to extract the useful features of the support set constructed by N-way K-shot sampling method from the S3DIS dataset. Considering the extraordinary success and advantages of PointNet, we apply it as the base learner of the network. We used the support set to train the PointNet network and used the query set to calculate the loss value to evaluate the model. At the heart of our network is a meta-learning module, which aims to achieve finite-sample convergence and improve generalization ability. We update the gradient of the network by the loss values of the query set, which enables the model to quickly adapt to the new environment with a small number of samples. The main contributions of this paper are summarized as follows:
- 1.
We propose a sampling method in order to build a 3D dataset with few samples for MAML algorithm.
- 2.
We successfully apply the MAML algorithm over 3D point cloud to perform semantic segmentation.
- 3.
We propose an effective network which can be rapidly adapted to a new environment with fewer samples, in order to significantly reduce the training time and the cost of data annotation.
- 4.
We evaluate our model on a large-scale 3D indoor spaces dataset and compare it with a variety of state-of-the-art models.
The paper is composed of five themed sections and the remaining part is organized as follows. Section II presents the recent research on PointNet and Model-Agnostic Meta-Learning (MAML). Section III presents our network for point cloud semantic segmentation, focusing on the three key parts, which are N-way K-shot sampling method, the network architecture, and the algorithm. Section IV presents our experiments. We evaluated our model on the Stanford Large-Scale 3D Indoor Spaces Dataset (S3DIS) [25] and analyzed the accuracy of the results. Finally, the conclusion and future research directions are given in Section V.
II Related Works
II-A PointNet
As it was mentioned in Section I, in 2017, Qi et al. [21] at Stanford University proposed PointNet. PointNet is the first neural network that directly processes raw point cloud data for classification and semantic segmentation. It has three main key modules. The first module is T-Net. T-Net is a regression network. It can predict an input-dependent transformation matrix. Multiplying the matrix of the input data with this matrix can make the point cloud data spatially aligned and facilitate subsequent feature extraction. The second module is max-pooling. To deal with unordered input data, PointNet uses the symmetric function max-pooling to extract the global features of the data. Experiments show that the max-pooling operation can greatly enhance the performance of the network. The third module is the combination module of local features and global features. PointNet concatenates the global feature vector with the input point vector directly and extracts the features through Convolutional Neural Network (CNN) to get the final classification and segmentation result. PointNet has shown the best segmentation results on both ModelNet40 [22] and ShapeNet [23] datasets, and has greatly advanced the development of PCSS techniques. These modules solve the problems of disorder, substitution invariance and rotation invariance of point clouds.
However, since PointNet directly uses max-pooling to extract global features, it is insufficient for local feature extraction. In a further study, Qi et al. [24] proposed PointNet++. The network borrows the idea of multilayer perceptual field in CNNs, and captures local geometric features by using a hierarchical neural network. PointNet++ network has improved the semantic segmentation effect of point clouds.
II-B Model-Agnostic Meta-Lerning
Meta-Learning, which main purpose is to learn a rule. While common deep learning models focus on learning a mathematical model for prediction or classification, meta-learning learns the process of learning. Thus meta-learning can use a small number of training samples to solve a new learning task. Model-Agnostic Meta-Lerning (MAML) [26] is a meta-learning algorithm that trains the model by optimizing the gradients of the parameters in each direction. The initialization parameter of the model is . MAML randomly selects a number of tasks in task for sampling to form a batch. In the next step, the gradient values are updated by calculating the loss values for each task separately. After that, we get . After performing the first gradient update, MAML can perform a second gradient update. Finally, is updated by calculating the sum of losses of a batch. MAML can be quickly adapted to new tasks with few samples. The MAML algorithm has been validated for supervised machine learning and reinforcement learning on 2D images. Zhong et al. [27] used the MAML framework as the basis and combined with ResNet and GeM to extract features to achieve the retrieval of remote sensing images. Zhang et al. [28] combined the MAML algorithm with GAN network and proposed MetaGAN network, which are capable of classifying images with a small number of samples. However, there are no relevant articles demonstrating that MAML can be applied to semantic segmentation of point clouds with few samples.
III Methods
Few-shot meta-learning is to learn the features of the dataset by a small number of samples. Although MAML is a universal algorithm for meta-learning, there are no small samples of 3D point cloud dataset for the MAML algorithm and no methods which have demonstrated the effectiveness of MAML for 3D point cloud semantic segmentation.
In this section, we propose a Few-Shot Meta-Learning Semantic Segmentation method for Point Cloud. In Section III-A, we introduce the N-way K-shot sampling method to construct the training dataset and the test dataset. The dataset consisting of these data will be applied to the MAML algorithm. In Section III-B, we present the architecture of our model, including a basic learning module and a meta-learning module. Finally, we present the algorithm in Section III-C. We will demonstrate the effectiveness of MAML on 3D point cloud in the Section IV.
III-A N-way K-shot sampling
Before training the model, we need to construct a training dataset and a test dataset, which we call the support set and the query set, respectively. We will use the N-way K-shot (N denotes the number of categories of samples and K denotes the number of samples contained in each category) method for sampling to form task sets, and each task set consists of a support set and a query set. The support set contains labeled data. There are categories with samples in each set, so . The support set is denoted as , denotes the D-dimensional point cloud data, and denotes the corresponding label of the data and the semantic information of the data. The query set contains some ”unlabeled” query samples, denoted as Q. The aim of our model in the training period is to predict the correct labels of the query samples from the given support set S and query set Q.
Algorithm 1 is the N-way K-shot sampling method. In the algorithm, the training dataset contains categories, denotes the number of categories in the task set, denotes the number of samples contained in each category, denotes the number of samples in support set, denotes the number of samples in query set, the function denotes the random taking of samples from the dataset without putting back, and denotes all samples belonging to the set D and not belonging to the set S. In sampling, categories are randomly taken from the training dataset , and labeled samples are randomly taken from each category to form a task , where samples are called the support set and samples are called the query set. We need to continuously employ Algorithm 1 to perform task sampling and generate the training dataset distribution .
The output will be used as the dataset for the algorithm in Section III-C.
III-B Architecture
In this paper, we propose a semantic segmentation network for point cloud based on meta-learning. The model is a pioneering application of MAML to the processing of 3D data. Our model can be divided into two parts. First, the support set is used as the training dataset of the model to train the network, and then the query set is used as the test dataset of the model for testing. Second, the test results are used to perform meta-learning operations to update the parameters of the model.
To represent the model more clearly, the whole network is divided into two modules: basic learning module (base learner) and meta-learning module (meta learner). The network process flow is shown in Fig. 1.

III-B1 Basic Learning Module
The basic learning module, which focuses on learning the features of dateset by PointNet. Firstly, the gradient parameter of the model is initialized, i.e. . Then the loss values are obtained by training on the support set, as shown in (1).
| (1) |
After the loss value is calculated, the gradient is updated as shown in (2).
| (2) |
where denotes the model learning rate.
Finally, we evaluate the PointNet model using the query set to obtain the loss values of the query set as shown in (3).
| (3) |
To improve the efficiency of the model, we propose a collaborative network model, as shown in Fig. 2. In this model, PointNet shares the initialization parameter , i.e., . Then the model is trained using the support set to obtain the cross-entropy loss, and the gradient is updated by the loss, as shown in (1) and (2). Finally, the model is evaluated using the query set separately and after that the loss values are averaged, as shown in (4).
| (4) |
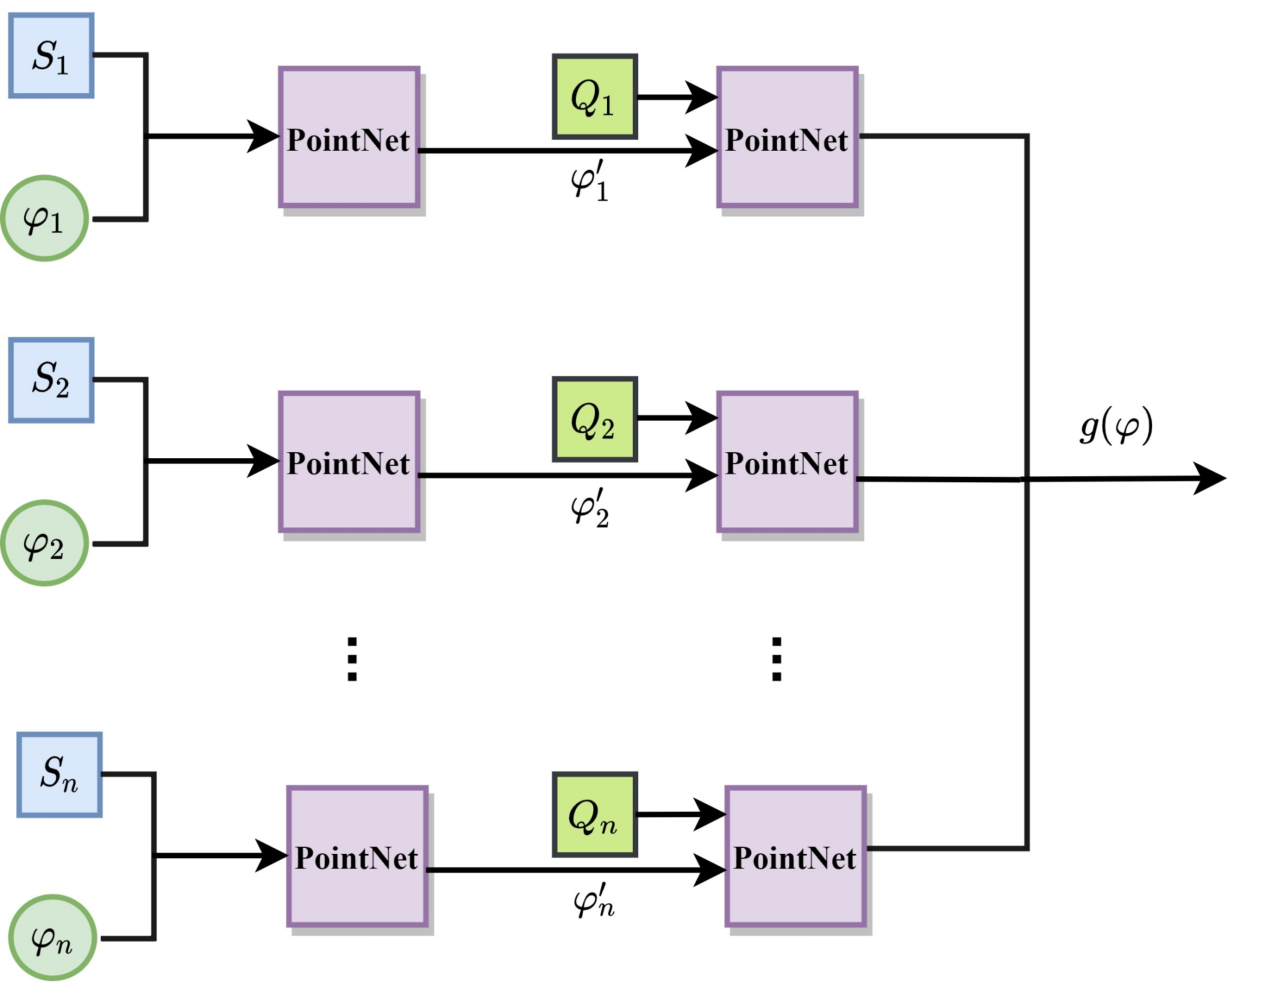
III-B2 Meta-Learning Module
The main purpose of the meta-learning module is to improve the generalization ability of the model with few samples. In this module, we calculate the gradient values of the model from the loss values and update them. This is shown in (5) and (6).
| (5) |
where, denotes the step in meta-learning.
| (6) |
If a collaborative network model is used, the gradient value is calculated as shown in (7).
| (7) |
III-C Algorithm
Algorithm 2 is the semantic segmentation algorithm based on meta-learning proposed in this paper. The model parameters are first initialized randomly. Then a number of tasks are randomly selected from the task set to form a batch. Steps 5-8 are performed continuously for this batch of tasks until the model converges.
IV Experiments
We first introduce the experiment environment in Section IV-A and the S3DIS dataset in Section IV-B. In Section IV-C, we present our experiments. Experiments are divided into four parts. In Section IV-C1, we verified that the MAML algorithm can be successfully applied to 3D point cloud and our model can be quickly adapted to new environments with few samples. In Section IV-C2, we did cross-validation experiments and proved that our model has good generalisation ability. In Section IV-C3, we visualised five samples to further demonstrate the validity of our proposed method. In Section IV-C4, we have compared our method with other methods and have proven that our method has better results.
IV-A Experiment environment
The experiment environment is shown in the Table I.
| Software and hardware | Model |
|---|---|
| CPU | Intel Core i7-8700 |
| GPU | GeForce GTX 1080 Ti |
| OS | Ubuntu 18.04 |
| Computing Framework | TensorFlow-GPU 1.14 |
| GPU acceleration | cuda10.0/cuDNN7.4 |
| Programming language | Python2.7 |
IV-B S3DIS dataset
We will experiment on the Stanford Large-Scale 3D Indoor Spaces Dataset (S3DIS) [25]. The dataset is composed of 6 large-scale indoor areas from 3 different buildings, with a total of 11 room types [25]. The Fig. 3 shows the six areas of the S3DIS dataset. The number of spaces in each area is shown in the Table II.

| Office | Conf. Room | Auditorium | Lobby | Lounge | Hallway | Copy Room | Pantry | Open Space | Storage | WC | Total Num | |
|---|---|---|---|---|---|---|---|---|---|---|---|---|
| Area 1 | 31 | 2 | - | - | - | 8 | 1 | 1 | - | - | 1 | 45 |
| Area 2 | 14 | 1 | 2 | - | - | 12 | - | - | - | 9 | 2 | 39 |
| Area 3 | 10 | 1 | - | - | 2 | 6 | - | - | - | 2 | 2 | 24 |
| Area 4 | 22 | 3 | - | 2 | - | 14 | - | - | - | 4 | 2 | 49 |
| Area 5 | 42 | 3 | - | 1 | - | 15 | - | 1 | - | 4 | 2 | 55 |
| Area 6 | 37 | 1 | - | - | 1 | 6 | 1 | 1 | 1 | - | - | 53 |
| Total Num | 156 | 11 | 2 | 3 | 3 | 61 | 2 | 3 | 1 | 19 | 9 | 270 |
In the process of data preparation, we first partition the point cloud data of each area into rooms. Next, each room is divided into blocks, and each block contains lots of point cloud data. Each point contains 9 dimensions of feature information such as spatial coordinate, RGB color and normalized coordinate. And it is represented as .
IV-C Semantic segmentation of point clouds based on meta-learning
In the pre-training process, we set 50 epochs, each epoch is trained 500 steps, and the learning rate is set to , , in order. The experimental results are shown in Figure 4 after 25000 steps. Experiment shows that our network converges gradually during the training process. At the same time, the learning rate that is too large or too small will slow down the convergence of the model. Therefore, in this paper, we choose the most suitable learning rate for the model, which is .

For the purpose of better representing the experimental results, we used three metrics: overall accuracy (oAcc), mean class accuracy (mAcc) and mean class Intersection-over-Union (mIoU). Their calculation formulas are shown in Table III.
| No. | Name | Equation* |
|---|---|---|
| 1 | overall accuracy (oAcc) | |
| 2 | mean class accuracy (mAcc) | |
| 3 | mean class Intersection-over-Union (mIoU) |
- *
denotes the number of categories of data.
For the i-th category, the total number of point clouds is , the number of correctly predicted point clouds is , and the number of incorrectly predicted point clouds is .
IV-C1 N-way K-shot random sampling
We used the N-way K-shot random sampling method to construct the 3D dataset applied to the MAML algorithm. The parameters N and K were selected as 2 and 6, respectively. The Area 1 dataset was used as the pre-training data, and the other five areas were used as the test data for transfer learning. The experimental results are shown in Table IV. The experiment shows that the MAML algorithm can be successfully applied to the 3D point cloud. At the same time, the model perform differently due to the different sizes of pre-training dataset. When K is the same, the accuracy of 2-way test is higher than that of 6-way test; when N is the same, the accuracy of 6-shot test is higher than that of 2-shot test. Therefore, the 2-way 6-shot method is chosen for the experiments in this section.
| Test dataset | 2-way | 6-way | ||
|---|---|---|---|---|
| 2-shot | 6-shot | 2-shot | 6-shot | |
| Area 2 | 79.7 | 81.4 | 77.5 | 80.5 |
| Area 3 | 71.2 | 75.8 | 69.8 | 73.6 |
| Area 4 | 73.5 | 77.4 | 70.6 | 75.0 |
| Area 5 | 83.7 | 86.2 | 80.8 | 85.5 |
| Area 6 | 79.9 | 81.2 | 76.7 | 80.9 |
IV-C2 Cross-validation
To verify that our model can quickly adapt to changes in the indoor environment, and to verify that the model has good generalization performance, we conducted cross-validation experiments. During the cross-validation experiments, we trained the model using each of the six areas as a pre-training dataset, and later transferred it to the other test dataset. The semantic segmentation results are shown in Table V. The experiments all used the 2-way 6-shot sampling method. According to the Table V, the overall accuracy reached a minimum of 69.0 when Area 3 was used for pre-training and applied to Area 1, and reached a maximum of 88.0 when Area 5 was used for pre-training and applied to Area 3. Moreover, the overall accuracies using Area 5 as the pre-training dataset were higher than the other pre-training datasets.
Table IV and Table V show that the larger the amount of data in the pre-training dataset, the richer the semantic information included. And the model also works better. At the same time, if the test dataset has high similarity with the pre-trainging dataset, the model will perform better.
| Test dataset | Area 1 | Area 2 | Area 3 | Area 4 | Area 5 | Area 6 |
|---|---|---|---|---|---|---|
| Area 1 | — | 81.4 | 75.8 | 77.4 | 86.2 | 81.2 |
| Area 2 | 71.1 | — | 81.2 | 76.4 | 86.0 | 82.0 |
| Area 3 | 69.0 | 75.3 | — | 70.8 | 79.7 | 74.5 |
| Area 4 | 75.4 | 78.5 | 74.7 | — | 80.5 | 76.7 |
| Area 5 | 79.2 | 82.2 | 88.0 | 77.8 | — | 84.7 |
| Area 6 | 77.0 | 80.3 | 85.8 | 78.6 | 83.1 | — |
IV-C3 Comparison of the effect of different test methods
We used the other five areas as the pre-training dataset and Area 6 as the test dataset, and the semantic segmentation accuracy reached 87.8. This approach works better than other individual areas as a pre-training dataset. The results further demonstrate that the richer the categories contained in the pre-training dataset, the higher the accuracy of the model. Meanwhile, the model has better generalization ability. We randomly selected five test samples from the Area 6 test dataset and visualized their segmentation results as shown in Fig. 5. From left to right are hallway6, pantry1, office18, office7 and office8. From top to bottom are original point cloud, real semantic segmentation result, Area 1 as pre-training dataset, Area 2 as pre-training dataset, Area 3 as pre-training dataset, Area 4 as pre-training dataset, Area 5 as pre-training dataset, Area 1-5 as pre-training dataset. From the Fig. 5, we can see that the room segmentation results in complex semantic environment are better, such as office7 and office8, while the room segmentation results in simple semantic environment are not so good, such as pantry1. In general, the semantic segmentation results using Area 1-5 as the pre-training dataset are better than the others.

IV-C4 Comparison of the effect of different models
V Conclusion
In our work, we propose a semantic segmentation method for point cloud based on meta-learning. Our method demonstrates that the MAML algorithm can be successfully applied to 3D point cloud. At the same time, with fewer samples, our network can be quickly adapted to new environments. Our network has good generalisation properties and can be used in a wide range of scenarios. It has great application value.
Acknowledgment
We sincerely thank the University of Electronic Science and Technology of China (UESTC) and Harbin Institute of Technology (HIT) for their technical support to this project.
References
- [1] R. Chen, P. Xu, P. Song, M. Wang, and J. He, “China has faster pace than japan in population aging in next 25 years,” BioScience Trends, vol. 13, no. 4, pp. 287–291, 2019.
- [2] R. Chen, P. Xu, F. Li, and P. Song, “Internal migration and regional differences of population aging: An empirical study of 287 cities in china,” BioScience Trends, vol. advpub, 2018.
- [3] X. Yue, B. Wu, S. A. Seshia, K. Keutzer, and A. L. Sangiovanni-Vincentelli, “A lidar point cloud generator: from a virtual world to autonomous driving,” in the 2018 ACM, 2018.
- [4] S. Chen, B. Liu, C. Feng, C. Vallespi-Gonzalez, and C. Wellington, “3d point cloud processing and learning for autonomous driving,” 2020.
- [5] R. Tredinnick, M. Broecker, and K. Ponto, “Progressive feedback point cloud rendering for virtual reality display,” in Virtual Reality, 2016.
- [6] E. Alexiou, N. Yang, and T. Ebrahimi, “Pointxr: A toolbox for visualization and subjective evaluation of point clouds in virtual reality,” in 2020 Twelfth International Conference on Quality of Multimedia Experience (QoMEX), 2020.
- [7] E. Alexiou, E. Upenik, and T. Ebrahimi, “Towards subjective quality assessment of point cloud imaging in augmented reality,” in IEEE International Workshop on Multimedia Signal Processing, 2017, pp. 1–6.
- [8] D. Borrmann, A. Nuechter, and T. Wiemann, “Large-scale 3d point cloud processing for mixed and augmented reality,” in 2018 IEEE International Symposium on Mixed and Augmented Reality Adjunct (ISMAR-Adjunct), 2019.
- [9] C. Chen, L. Zanotti Fragonara, and A. Tsourdos, “Go wider: An efficient neural network for point cloud analysis via group convolutions,” Applied Sciences, vol. 10, no. 7, 2020.
- [10] J. Zhang, X. Zhao, Z. Chen, and Z. Lu, “A review of deep learning-based semantic segmentation for point cloud (november 2019),” IEEE Access, vol. PP, pp. 1–1, 12 2019.
- [11] Y. Xie, J. Tian, and X. X. Zhu, “Linking points with labels in 3d: A review of point cloud semantic segmentation,” IEEE Geoscience and Remote Sensing Magazine, vol. PP, no. 99, pp. 0–0.
- [12] J. Zhang, X. Lin, and X. Ning, “Svm-based classification of segmented airborne lidar point clouds in urban areas,” Remote Sensing, vol. 5, issue 8, pp. 3749-3775, vol. 5, pp. 3749–3775, 07 2013.
- [13] Z. Li, L. Zhang, X. Tong, B. Du, Y. Wang, L. Zhang, Z. Zhang, H. Liu, J. Mei, X. Xing et al., “A three-step approach for tls point cloud classification,” IEEE Transactions on Geoscience and Remote Sensing, vol. 54, no. 9, pp. 5412–5424, 2016.
- [14] N. Chehata, L. Guo, and C. Mallet, “Airborne lidar feature selection for urban classification using random forests,” in Laserscanning, 2009.
- [15] Zhang, Liqiang, Fang, Huamin, Xiao, Zhiqiang, Chen, Dong, Mathiopoulos, and P. Takis, “A multiscale and hierarchical feature extraction method for terrestrial laser scanning point cloud classification,” IEEE Transactions on Geoscience and Remote Sensing, 2015.
- [16] K. Khoshelham and S. O. Elberink, “Accuracy and resolution of kinect depth data for indoor mapping applications,” Sensors (14248220), vol. 12, no. 2, p. 1437, 2012.
- [17] M. Najafi, S. Taghavi, M. Salzmann, and L. Petersson, “Non-associative higher-order markov networks for point cloud classification,” 09 2014, pp. 500–515.
- [18] J. Niemeyer, F. Rottensteiner, and U. Soergel, “Contextual classification of lidar data and building object detection in urban areas,” ISPRS journal of photogrammetry and remote sensing, vol. 87, pp. 152–165, 2014.
- [19] H. Su, S. Maji, E. Kalogerakis, and E. Learned-Miller, “Multi-view convolutional neural networks for 3d shape recognition,” in Proceedings of the IEEE International Conference on Computer Vision (ICCV), December 2015.
- [20] D. Maturana and S. Scherer, “Voxnet: A 3d convolutional neural network for real-time object recognition,” in 2015 IEEE/RSJ International Conference on Intelligent Robots and Systems (IROS). IEEE, 2015, pp. 922–928.
- [21] C. R. Qi, H. Su, K. Mo, and L. J. Guibas, “Pointnet: Deep learning on point sets for 3d classification and segmentation,” in Proceedings of the IEEE conference on computer vision and pattern recognition, 2017, pp. 652–660.
- [22] Z. Wu, S. Song, A. Khosla, F. Yu, L. Zhang, X. Tang, and J. Xiao, “3d shapenets: A deep representation for volumetric shapes,” in Proceedings of the IEEE conference on computer vision and pattern recognition, 2015, pp. 1912–1920.
- [23] A. X. Chang, T. Funkhouser, L. Guibas, P. Hanrahan, Q. Huang, Z. Li, S. Savarese, M. Savva, S. Song, H. Su et al., “Shapenet: An information-rich 3d model repository,” arXiv preprint arXiv:1512.03012, 2015.
- [24] C. R. Qi, L. Yi, H. Su, and L. J. Guibas, “Pointnet++: Deep hierarchical feature learning on point sets in a metric space,” arXiv preprint arXiv:1706.02413, 2017.
- [25] I. Armeni, O. Sener, A. R. Zamir, H. Jiang, I. Brilakis, M. Fischer, and S. Savarese, “3d semantic parsing of large-scale indoor spaces,” in Proceedings of the IEEE Conference on Computer Vision and Pattern Recognition, 2016, pp. 1534–1543.
- [26] C. Finn, P. Abbeel, and S. Levine, “Model-agnostic meta-learning for fast adaptation of deep networks,” in International Conference on Machine Learning. PMLR, 2017, pp. 1126–1135.
- [27] Q. Zhong, L. Chen, and Y. Qian, “Few-shot learning for remote sensing image retrieval with maml,” in 2020 IEEE International Conference on Image Processing (ICIP), 2020, pp. 2446–2450.
- [28] R. ZHANG, T. Che, Z. Ghahramani, Y. Bengio, and Y. Song, “Metagan: An adversarial approach to few-shot learning,” in Advances in Neural Information Processing Systems, S. Bengio, H. Wallach, H. Larochelle, K. Grauman, N. Cesa-Bianchi, and R. Garnett, Eds., vol. 31. Curran Associates, Inc., 2018.