Multimodal Object Detection via Probabilistic Ensembling
Abstract
Object detection with multimodal inputs can improve many safety-critical systems such as autonomous vehicles (AVs). Motivated by AVs that operate in both day and night, we study multimodal object detection with RGB and thermal cameras, since the latter provides much stronger object signatures under poor illumination. We explore strategies for fusing information from different modalities. Our key contribution is a probabilistic ensembling technique, ProbEn, a simple non-learned method that fuses together detections from multi-modalities. We derive ProbEn from Bayes’ rule and first principles that assume conditional independence across modalities. Through probabilistic marginalization, ProbEn elegantly handles missing modalities when detectors do not fire on the same object. Importantly, ProbEn also notably improves multimodal detection even when the conditional independence assumption does not hold, e.g., fusing outputs from other fusion methods (both off-the-shelf and trained in-house). We validate ProbEn on two benchmarks containing both aligned (KAIST) and unaligned (FLIR) multimodal images, showing that ProbEn outperforms prior work by more than 13% in relative performance!
Keywords:
Object Detection Multimodal Detection Infrared Thermal Probabilistic Model Ensembling Multimodal Fusion Uncertainty1 Introduction
Object detection is a canonical computer vision problem that has been greatly advanced by the end-to-end training of deep neural detectors [48, 26]. Such detectors are widely adopted in various safety-critical systems such as autonomous vehicles (AVs) [22, 7]. Motivated by AVs that operate in both day and night, we study multimodal object detection with RGB and thermal cameras, since the latter can provide much stronger object signatures under poor illumination [29, 56, 35, 12, 63, 4].

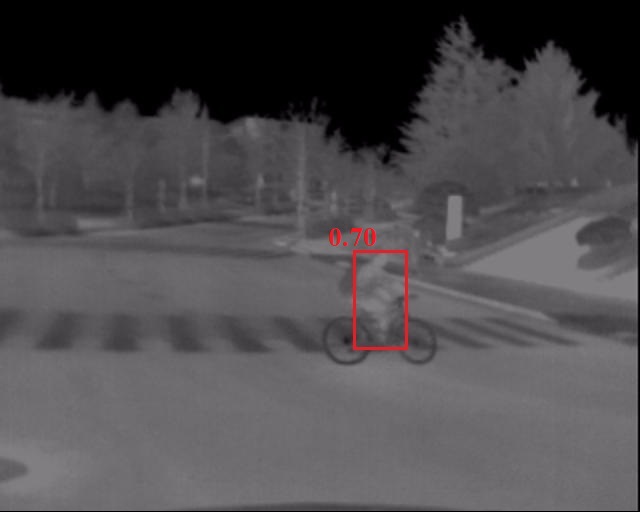
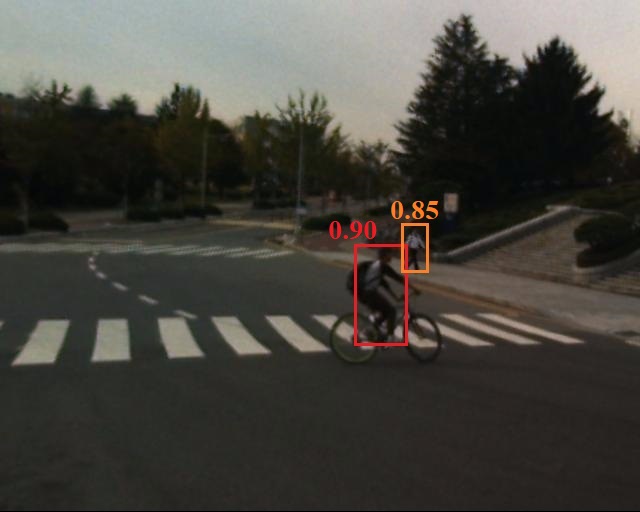
Multimodal Data. There exists several challenges in multimodal detection. One is the lack of data. While there exists large repositories of annotated single-modal datasets (RGB) and pre-trained models, there exists much less annotated data of other modalities (thermal), and even less annotations of them paired together. One often-ignored aspect is the alignment of the modalities: aligning RGB and thermal images requires special purpose hardware, e.g., a beam-splitter [29] or a specialized rack [52] for spatial alignment, and a GPS clock synchronizer for temporal alignment [45]. Fusion on unaligned RGB-thermal inputs (cf. Fig. 4) remains relatively unexplored. For example, even annotating bounding boxes is cumbersome because separate annotations are required for each modality, increasing overall cost. As a result, many unaligned datasets annotate only one modality (e.g., FLIR [20]), further complicating multimodal learning.
Multimodal Fusion. The central question in multimodal detection is how to fuse information from different modalities. Previous work has explored strategies for fusion at various stages [9, 56, 35, 62, 63, 4], which are often categorized into early-, mid- and late-fusion. Early-fusion constructs a four-channel RGB-thermal input [53], which is then processed by a (typical) deep network. In contrast, mid-fusion keeps RGB and thermal inputs in different streams and then merges their features downstream within the network (Fig. 2a) [53, 39, 33]. The vast majority of past work focuses on architectural design of where and how to merge. Our key contribution is the exploration of an extreme variant of very-late fusion of detectors trained on separate modalities (Fig. 2b) through detector ensembling. Though conceptually simple, ensembling can be effective because one can learn from single-modal datasets that often dwarf the size of multimodal datasets. However, ensembling can be practically challenging because different detectors might not fire on the same object. For example, RGB-based detectors often fail to fire in nighttime conditions, implying one needs to deal with “missing” detections during fusion.

Probabilistic Ensembling (ProbEn). We derive our very-late fusion approach, ProbEn, from first principles: simply put, if single-modal signals are conditionally independent of each other given the true label, the optimal fusion strategy is given by Bayes rule [44]. ProbEn requires no learning, and so does not require any multimodal data for training. Importantly, ProbEn elegantly handles “missing” modalities via probabilistic marginalization. While ProbEn is derived assuming conditional independence, we empirically find that it can be used to fuse outputs that are not strictly independent, by fusing outputs from other fusion methods (both off-the-shelf and trained in-house). In this sense, ProbEn is a general technique for ensembling detectors. We achieve significant improvements over prior art, both on aligned and unaligned multimodal benchmarks.
Why ensemble? One may ask why detector ensembling should be regarded as an interesting contribution, given that ensembling is a well-studied approach [21, 32, 3, 13] that is often viewed as an “engineering detail” for improving leaderboard performance [34, 28, 25]. Firstly, we show that the precise ensembling technique matters, and prior approaches proposed in the (single-modal) detection literature such as score-averaging [34, 14] or max-voting [57], are not as effective as ProbEn, particularly when dealing with missing modalities. Secondly, to our knowledge, we are the first to propose detector ensembling as a fusion method for multimodal detection. Though quite simple, it is remarkably effective and should be considered a baseline for future research.
2 Related Work
Object Detection and Detector Ensembling. State-of-the-art detectors train deep neural networks on large-scale datasets such as COCO [37] and often focus on architectural design [40, 46, 47, 48]. Crucially, most architectures generate overlapping detections which need to be post-processed with non-maximal suppression (NMS) [10, 5, 51]. Overlapping detections could also be generated by detectors tuned for different image crops and scales, which typically make use of ensembling techniques for post-processing their output [1, 25, 28]. Somewhat surprisingly, although detector ensembling and NMS are widely studied in single-modal RGB detection, to the best of our knowledge, they have not been used to (very) late-fuse multimodal detections; we find them remarkably effective.
Multimodal Detection, particularly with RGB-thermal images, has attracted increasing attention. The KAIST pedestrian detection dataset [29] is one of the first benchmarks for RGB-thermal detection, fostering growth of research in this area. Inspired by the successful RGB-based detectors [48, 46, 40], current multimodal detectors train deep models with various methods for fusing multimodal signals [9, 56, 35, 62, 63, 4, 64, 63, 31]. Most of these multimodal detection methods work on aligned RGB-thermal images, but it is unclear how they perform on heavily unaligned modalities such as images in Fig. 4 taken from FLIR dataset [20]. We study multimodal detection under both aligned and unaligned RGB-thermal scenarios. Multimodal fusion is the central question in multimodal detection. Compared to early-fusion that simply concatenates RGB and thermal inputs, mid-fusion of single-modal features performs better [53]. Therefore, most multimodal methods study how to fuse features and focus on designing new network architectures [53, 39, 33]. Because RGB-thermal pairs might not be aligned, some methods train an RGB-thermal translation network to synthesize aligned pairs, but this requires annotations in each modality [12, 41, 30]. Interestingly, few works explore learning from unaligned data that are annotated only in single modality; we show that mid-fusion architectures can still learn in this setting by acting as an implicit alignment network. Finally, few fusion architectures explore (very) late fusion of single-modal detections via detector ensembling. Most that do simply take heuristic (weighted) averages of confidence scores [23, 35, 63]. In contrast, we introduce probabilistic ensembling (ProbEn) for late-fusion, which significantly outperforms prior methods on both aligned and unaligned RGB-thermal data.
3 Fusion Strategies for Multimodal Detection
We now present multimodal fusion strategies for detection. We first point out that single-modal detectors are viable methods for processing multimodal signals, and so include them as a baseline. We also include fusion baselines for early-fusion, which concatenates RGB and thermal as a four-channel input, and mid-fusion, which concatenates single-modal features inside a network (Fig. 2). As a preview of results, we find that mid-fusion is generally the most effective baseline (Table 1). Surprisingly, this holds even for unaligned data that is annotated with a single modality (Fig. 4), indicating that mid-fusion can perform some implicit alignment (Table 3).
We describe strategies for late-fusing detectors from different modalities, or detector ensembling. We begin with a naive approach (Fig. 1). Late-fusion needs to fuse scores and boxes; we discuss the latter at the end of this section.
Naive Pooling. The possibly simplest strategy is to naively pool detections from multiple modalities together. This will probably result in multiple detections overlapping the same ground-truth object (Fig. 1a).
Non-Maximum Supression (NMS). The natural solution for dealing with overlapping detections is NMS, a crucial component in contemporary RGB detectors [14, 67, 27]. NMS finds bounding box predictions with high spatial overlap and remove the lower-scoring bounding boxes. This can be implemented in a sequential fashion via sorting of predictions by confidence, as depicted by Algorithm 1, or in a parallel fashion amenable to GPU computation [6]. While NMS has been used to ensemble single-modal detectors [51], it has (surprisingly) not been advocated for fusion of multi-modal detectors. We find it be shockingly effective, outperforming the majority of past work on established benchmarks (Fig. 2). Specifically, when two detections from two different modalities overlap (e.g., IoU0.5), NMS simply keeps the higher-score detection and suppresses the other (Fig. 1b). This allows each modality to “shine” where effective – thermal detections tend to score high (and so will be selected) when RGB detections perform poorly due to poor illumination conditions. That said, rather than selecting one modality at the global image level (e.g., day-time vs. night time), NMS selects one modality at the local bounding box level. However, in some sense, NMS fails to “fuse” information from multiple modalities together, since each of the final detections are supported by only one modality.
Average Fusion. To actually fuse multimodal information, a straightforward strategy is to modify NMS to average confidence scores of overlapping detections from different modalities, rather than suppressing the weaker modality. Such an averaging has been proposed in prior work [57, 39, 35]. However, averaging scores will necessarily decrease the NMS score which reports the max of an overlapping set of detections (Fig. 1c). Our experiments demonstrate that averaging produces worse results than NMS and single-modal detectors. Intuitively, if two modalities agree that there exist a detection, fusion should increase the overall confidence rather than decrease.
Probabilistic Ensembling (ProbEn). We derive our probabilistic approach for late-fusion of detections by starting with how to fuse detection scores (Algorithm 1). Assume we have an object with label (e.g., a “person”) and measured signals from two modalities: (RGB) and (thermal). We write out our formulation for two modalities, but the extension to multiple (evaluated in our experiments) is straightforward. Crucially, we assume measurements are conditionally independent given the object label :
| (1) |
This can also be written as , which may be easier to intuit. Given the person label , predict its RGB appearance ; if this prediction would not change the given knowledge of the thermal signal , then conditional independence holds. We wish to infer labels given multimodal measurements:
| (2) |
By applying the conditional independence assumption from (1) to (2), we have:
| (3) | ||||
| (4) |
The above suggests a simple approach to fusion that is provably optimal when single-modal features are conditionally-independent of the true object label:
- 1.
Train independent single-modal classifiers that predict the distributions over the label given each individual feature modality and .
- 2.
Produce a final score by multiplying the two distributions, dividing by the class prior distribution, and normalizing the final result (4) to sum-to-one.
To obtain the class prior , we can simply normalize the counts of per-class examples. Extending ProbEn (4) to modalities is simple:
| (5) |
Independence assumptions. ProbEn is optimal given the independence assumption from (1). Even when such independence assumptions do not hold in practice, the resulting models may still be effective [11] (i.e., just as assumptions of Gaussianity can still be useful even if strictly untrue [32, 44]). Interestingly, many fusion methods including NMS and averaging make the same underlying assumption, as discussed in [32]. In fact, [32] points out that Average Fusion (which averages class posteriors) makes an even stronger assumption: posteriors do not deviate dramatically from class priors. This is likely not true, as corroborated by the poor performance of averaging in our experiments (despite its apparent widespread use [57, 39, 35]).
Relationship to prior work. To compare to prior fusion approaches that tend to operate on logit scores, we rewrite the single-modal softmax posterior for class- given modality in terms of single-modal logit score . For notational simplicity, we suppress its dependence on the underlying input modality : , where we exploit the fact that the partition function in the denominator is not a function of the class label . We now plug the above into Eq. (5):
| (6) |
ProbEn is thus equivalent to summing logits, dividing by the class prior and normalizing via a softmax. Our derivation (6) reveals that summing logits without the division may over-count class priors, where the over-counting grows with the number of modalities . The supplement shows that dividing by class posteriors marginally helps. In practice, we empirically find that assuming uniform priors works surprisingly well, even on imbalanced datasets. This is the default for our experiments, unless otherwise noted.
Missing modalities. Importantly, summing and averaging behave profoundly differently when fusing across “missing” modalities (Fig. 3). Intuitively, different single-modal detectors often do not fire on the same object. This means that to output a final set of detections above a confidence threshold (e.g., necessary for computing precision-recall metrics), one will need to compare scores from fused multi-modal detections with single modal detections, as illustrated in Fig. 3. ProbEn elegantly deals with missing modalities because probabilistically-normalized multi-modal posteriors can be directly compared with single-modal posteriors .
(a) RGB (b) thermal (c) average fusion (d) ProbEn


Bounding Box Fusion. Thus far, we have focused on fusion of class posteriors. We now extend ProbEn to probabilistically fuse bounding box (bbox) coordinates of overlapping detections. We repurpose the derivation from (4) for a continuous bbox label rather than a discrete one. Specifically, we write for the continuous random variable defining the bounding box (parameterized by its centroid, width, and height) associated with a given detection. We assume single-modal detections provide a posterior that takes the form of a Gaussian with a single variance , i.e., where are box coordinates predicted from modality . We also assume a uniform prior on , implying bbox coordinates can lie anywhere in the image plane. Doing so, we can write
| (7) | ||||
| (8) |
We refer the reader to the supplement for a detailed derivation. Eq. (8) suggests a simple way to probabilistically fuse box coordinates: compute a weighted average of box coordinates, where weights are given by the inverse covariance. We explore three methods for setting . The first method “avg” fixes =, amounting to simply averaging bounding box coodinates. The second “s-avg” approximates , implying that more confident detections should have a higher weight when fusing box coordinates. This performs marginally better than simply averaging. The third “v-avg” train the detector to predict regression variance/uncertainty using the Gaussian negative log likelihood (GNLL) loss [42] alongside the box regression loss. Interestingly, incorporating GNLL not only produces better variance/uncertainty estimate helpful for fusion but also improves detection performance of the trained detectors (details in supplement).
4 Experiments
We validate different fusion methods on two datasets: KAIST [29] which is released under the Simplified BSD License, and FLIR [20] (Fig. 4), which allows for non-commercial educational and research purposes. Because the two datasets contain personally identifiable information such as faces and license plates, we assure that we (1) use them only for research, and (2) will release our code and models to the public without redistributing the data. We first describe implementation details and then report the experimental results on each dataset (alongside their evaluation metrics) in separate subsections.


4.1 Implementation
We conduct experiments with PyTorch [43] on a single GPU (Nvidia GTX 2080). We train our detectors (based on Faster-RCNN) with Detectron2 [54], using SGD and learning rate 5e-3. For data augmentation, we adopt random flipping and resizing. We pre-train our detector on COCO dataset [37]. As COCO has only RGB images, fine-tuning the pre-trained detector on thermal inputs needs careful pre-processing of thermal images (detailed below).
Pre-processing. All RGB and thermal images have intensity in [0, 255]. In training an RGB-based detector, RGB input images are commonly processed using the mean subtraction [54] where the mean values are computed over all the training images. Similarly, we calculate the mean value (135.438) in the thermal training data. We find using a precise mean subtraction to process thermal images yields better performance when fine-tuning the pre-trained detector.
Stage-wise Training. We fine-tune the pre-trained detector to train single-modal detectors and the early-fusion detectors. To train a mid-fusion detector, we truncate the already-trained single-modal detectors, concatenate features add a new detection head and train the whole model (Fig. 2a). The late-fusion methods fuse detections from (single-modal) detectors. Note that all the late-fusion methods are non-learned. We also experimented with learning-based late-fusion methods (e.g., learning to fuse logits) but find them to be only marginally better than ProbEn (9.08 vs. 9.16 in LAMR using argmax box fusion). Therefore, we focus on the non-learned late fusion methods in the main paper and study learning-based ones in the supplement.
Post-processing. When ensembling two detectors, we find it crucial to calibrate scores particularly when we we fuse detections from our in-house models and off-the-shelf models released by others. We adopt the simple temperature scaling for score calibration [24]. Please refer to the supplement for details.


4.2 Multimodal Pedestrian Detection on KAIST
Dataset. The KAIST dataset is a popular multimodal benchmark for pedestrian detection [29]. In KAIST, RGB and thermal images are aligned with a beam-splitter, and have resolutions of 640x480 and 320x256, respectively. We resize thermal images to 640x480 during training. KAIST also provides day/night tags for breakdown analysis. The original KAIST dataset contains 95,328 RGB-thermal image pairs, which are split into a training set (50,172) and a testing set (45,156). Because the original KAIST dataset contains noisy annotations, the literature introduces cleaned version of the train/test sets: a sanitized train-set (7,601 examples) [35] and a cleaned test-set (2,252 examples) [38]. We also follow the literature [29] to evaluate under the “reasonable setting” for evaluation by ignoring annotated persons that are occluded (tagged by KAIST) or too small (55 pixels). We follow this literature for fair comparison with recent methods.
Metric. We measure detection performance with the Log-Average Miss Rate (LAMR), which is a standard metric in pedestrian detection [15] and KAIST [29]. LAMR is computed by averaging the miss rate (false negative rate) at nine false positives per image (FPPI) rates evenly spaced in log-space from the range 10-2 to 100 [29]. It does not evaluate the detections that match to ignored ground-truth [15, 29]. A true positive is a detection that matches a ground-truth object with IoU0.5 [29]; false positives are detections that do not match any ground-truth; false negatives are miss-detections.
Ablation Study on KAIST
| baselines | Day | Night | All | |
| RGB | 14.56 | 27.42 | 18.67 | |
| Thermal | 24.59 | 7.76 | 18.99 | |
| EarlyFusion | 26.30 | 6.61 | 19.36 | |
| MidFusion | 17.55 | 9.30 | 14.48 | |
| Pooling | 37.92 | 22.61 | 32.68 | |
| score-fusion | box-fusion | Day | Night | All |
| max | argmax | 13.25 | 6.42 | 10.78 |
| max | avg | 13.25 | 6.65 | 10.89 |
| max | s-avg | 13.35 | 6.65 | 10.96 |
| max | v-avg | 13.19 | 6.65 | 10.79 |
| avg | argmax | 21.68 | 15.16 | 19.53 |
| avg | avg | 21.59 | 15.46 | 19.47 |
| avg | s-avg | 21.67 | 15.46 | 19.55 |
| avg | v-avg | 21.51 | 15.46 | 19.42 |
| ProbEn | argmax | 10.21 | 5.45 | 8.62 |
| ProbEn | avg | 10.14 | 5.41 | 8.58 |
| ProbEn | s-avg | 10.27 | 5.41 | 8.67 |
| ProbEn | v-avg | 9.93 | 5.41 | 8.50 |
| ProbEn3 | argmax | 13.67 | 6.31 | 11.00 |
| ProbEn3 | avg | 9.07 | 4.89 | 7.68 |
| ProbEn3 | s-avg | 9.07 | 4.89 | 7.68 |
| ProbEn3 | v-avg | 9.07 | 4.89 | 7.66 |
Table 1 shows ablation studies on KAIST. Single modal detectors tend to work well in different environments, with RGB detectors working on well-lit day images while Thermal working well on nighttime images. EarlyFusion reduces the miss rate by a modest amount, while MidFusion is more effective. Naive strategies for late fusion (such as pooling together detections from different modalities) are quite poor because they generate many repeated detections on the same object, which are counted as false positives. Interestingly, simple NMS that has max score fusion and argmax box fusion, is quite effective at removing overlapping detections from different modalities, already outperforming Early and MidFusion. Instead of suppressing the weaker modality, one might average the scores of overlapping detections but this is quite ineffective because it always decreases the score from NMS. Intuitively, one should increase the score when different modalities agree on a detection. ProbEn accomplishes this by probabilistic integration of information from the RGB and Thermal single-modal detectors. Moreover, it can be further improved by probabilisitcally fusing coordinates of overlapping boxes. Lastly, ProbEn3 that ensembles three models (RGB, thermal and MidFusion), performs the best.
Qualitative Results are displayed in Fig. 5. Visually, ProbEn detects all persons, while the MidFusion model has multiple false negatives / miss-detections.
Quantitative Comparison on KAIST
Compared Methods. Among many prior methods, we particularly compare against four recent ones: AR-CNN [63], MBNet [64], MLPD [31], and GAFF [61]. AR-CNN focuses on weakly-unaligned RGB-thermal pairs and explores multiple heuristic methods for fusing features, scores and boxes. MBNet addresses modality imbalance w.r.t illumination and features to improve detection; both MLPD and GAFF are mid-fusion methods that design sophisticated network architectures; MLPD adopts aggressive data augmentation techniques and GAFF extensively exploits attentitive modules to fuse multimodal features. Table 2 lists more methods.
Results. Table 2 compares ProbEn against the prior work. ProbEn+ that ensembles three models trained in-house (RGB, Thermal, and MidFusion) achieves competitive performance (7.95 LAMR) against the prior art. When replacing our MidFusion detector with off-the-shelf mid-fusion detectors [31, 61], ProbEn++ significantly outperforms all the existing methods, boosting the performance from the prior art 6.48 to 5.14! This clearly shows that ProbEn works quite well when the conditional independence assumption does not hold, i.e., fusing outputs from other fusion methods (both off-the-shelf and trained in-house). As ProbEn performs better than past work as a non-learned solution, we argue that it should serve as a new baseline for future research on multimodal detection.
| Method | Day | Night | All |
| HalfwayFusion [39] | 36.84 | 35.49 | 36.99 |
| RPN+BDT [33] | 30.51 | 27.62 | 29.83 |
| TC-DET [4] | 34.81 | 10.31 | 27.11 |
| IATDNN [23] | 27.29 | 24.41 | 26.37 |
| IAF R-CNN [36] | 21.85 | 18.96 | 20.95 |
| SyNet [2] | 22.64 | 15.80 | 20.19 |
| CIAN [62] | 14.77 | 11.13 | 14.12 |
| MSDS-RCNN [35] | 12.22 | 7.82 | 10.89 |
| AR-CNN [63] | 9.94 | 8.38 | 9.34 |
| MBNet [64] | 8.28 | 7.86 | 8.13 |
| MLPD [31] | 7.95 | 6.95 | 7.58 |
| GAFF [61] | 8.35 | 3.46 | 6.48 |
| MaxFusion (NMS) | 13.25 | 6.42 | 10.78 |
| ProbEn | 9.93 | 5.41 | 8.50 |
| ProbEn3 | 9.07 | 4.89 | 7.66 |
| ProbEn3 w/ MLPD | 7.81 | 5.02 | 6.76 |
| ProbEn3 w/ GAFF | 6.04 | 3.59 | 5.14 |
4.3 Multimodal Object Detection on FLIR
Dataset. The FLIR dataset [20] consists of RGB images (captured by a FLIR BlackFly RGB camera with 1280x1024 resolution) and thermal images (acquired by a FLIR Tau2 thermal camera 640x512 resolution). We resize all images to resolution 640x512. FLIR has unaligned RGB-thermal image pairs and annotates only for thermal (Fig. 4). Image pairs are split into train-set ( images) and a validation set ( images). FLIR evaluates on three classes which have imbalanced examples [8, 30, 60, 41, 12]: persons, cars, and bicycles. Following [60], we remove 108 thermal images in the val-set that do not have the RGB counterparts. For breakdown analysis w.r.t day/night scenes, we manually tag the validation images with “day” (768) and “night” (490). We will release our annotations to the public.
Misaligned modalities. Because FLIR’s RGB and thermal images are heavily unaligned, it labels only thermal images and does not have RGB annotations. We can still train Early and MidFusion models using multimodal inputs and the thermal annotations. These detectors might learn to internally align the unaligned modalities to predict bounding boxes according to the thermal annotations. Because we do not have an RGB-only detector, our ProbEn ensembles EarlyFusion, MidFusion, and thermal-only detectors.
Metric. We measure performance using Average Precision (AP) [17, 49]. Precision is computed over testing images within a single class, with true positives that overlap ground-truth bounding boxes (e.g., IoU0.5). Computing the average precision (AP) across all classes measures the performance in multi-class object detection. Following [12, 41, 60, 30, 8], we define a true positive as a detection that overlaps a ground-truth with IoU0.5. Note that AP used in the the multimodal detection literature is different from mAP [37], which averages over different AP’s computed with different IoU thresholds.
| baselines | Day | Night | All | |
| Thermal | 75.35 | 82.90 | 79.24 | |
| EarlyFusion | 77.37 | 79.56 | 78.80 | |
| MidFusion | 79.37 | 81.64 | 80.53 | |
| Pooling | 52.57 | 55.15 | 53.66 | |
| score-fusion | box-fusion | Day | Night | All |
| max | argmax | 81.91 | 84.42 | 83.14 |
| max | avg | 81.84 | 84.62 | 83.21 |
| max | s-avg | 81.85 | 84.48 | 83.19 |
| max | v-avg | 81.80 | 85.07 | 83.31 |
| avg | argmax | 81.34 | 84.69 | 82.65 |
| avg | avg | 81.26 | 84.81 | 82.91 |
| avg | s-avg | 81.26 | 84.72 | 82.89 |
| avg | v-avg | 81.26 | 85.39 | 83.03 |
| ProbEn3 | argmax | 82.19 | 84.73 | 83.27 |
| ProbEn3 | avg | 82.19 | 84.91 | 83.63 |
| ProbEn3 | s-avg | 82.20 | 84.84 | 83.61 |
| ProbEn3 | v-avg | 82.21 | 85.56 | 83.76 |
Ablation study on FLIR
We compare our fusion methods in Table 3, along with qualitative results in Fig. 6. We analyze results using our day/night tags. Compared to the single-modal detector (Thermal), our learning-based early-fusion (EarlyFusion) and mid-fusion (MidFusion) produce better performance. MidFusion outperforms EarlyFusion, implying that end-to-end learning of fusing features better handles mis-alignment between RGB and thermal images. By applying late-fusion methods to detections of Thermal, EarlyFusion and MidFusion detectors, we boost detection performance. Note that typical ensembling methods in the single-modal (RGB) detection literature [57, 39, 35] often use max / average score fusion, and argmax / average box fusion, which are outperformed by our ProbEn. This suggests that ProbEn should be potentially a better ensembling method for object detection.
day scene night scene


Quantitative Comparison on FLIR
Compared Methods. We compare against prior methods including ThermalDet [8], BU [30], ODSC [41], MMTOD [12], CFR [60], and GAFF [61]. As FLIR does not have aligned RGB-thermal images and only annotates thermal images, many methods exploit domain adaptation that adapts a pre-trained RGB detector to thermal input. For example, MMTOD [12] and ODSC [41] adopt the image-to-image-translation technique [65, 59] to generate RGB from thermal, hypothesizing that this helps train a better multimodal detector by finetuning a detector that is pre-trained over large-scale RGB images. BU [30] operates such a translation/adaptation on features that generates thermal features to be similar to RGB features. ThermalDet [8] exclusively exploits thermal images and ignores RGB images; it proposes to combine features from multiple layers for the final detection. GAFF [61] trains on RGB-thermal image with a sophisticated attention module that fuse single-modal features. Perhaps because the complexity of the attention module, GAFF is limited to using small network backbones (ResNet18 and VGG16). Somewhat surprisingly, to the best of our knowledge, there is no prior work that trained early-fusion or mid-fusion deep networks (Fig. 2a) on the heavily unaligned RGB-thermal image pairs (like in FLIR) for multimodal detection. We find directly training them performs much better than prior work (Table 4).
Results. Table 4 shows that all our methods outperform the prior art. Our single-modal detector (trained on thermal images) achieves slightly better performance than ThermalDet [8], which also exclusively trains on thermal images. This is probably because we use a better pre-trained Faster-RCNN model provided by the excellent Detectron2 toolbox. Surprisingly, our simpler EarlyFusion and MidFusion models achieve big boosts over the thermal-only model (Thermal), while MidFusion performs much better. This confirms our hypothesis that fusing features better handles mis-alignment of RGB-thermal images than the early-fusion method. Our ProbEn performs the best, significantly better than all compared methods! Notably, our fusion methods boost “bicycle” detection. We conjecture that bicycles do not emit heat to deliver strong signatures in thermal, but are more visible in RGB; fusing them greatly improves bicycle detection.
| Method | Bicycle | Person | Car | All |
| MMTOD-CG [12] | 50.26 | 63.31 | 70.63 | 61.40 |
| MMTOD-UNIT [12] | 49.43 | 64.47 | 70.72 | 61.54 |
| ODSC [41] | 55.53 | 71.01 | 82.33 | 69.62 |
| CFR3 [60] | 55.77 | 74.49 | 84.91 | 72.39 |
| BU(AT,T) [30] | 56.10 | 76.10 | 87.00 | 73.10 |
| BU(LT,T) [30] | 57.40 | 75.60 | 86.50 | 73.20 |
| GAFF [61] | — | — | — | 72.90 |
| ThermalDet [8] | 60.04 | 78.24 | 85.52 | 74.60 |
| Thermal | 62.63 | 84.04 | 87.11 | 79.24 |
| EarlyFusion | 63.43 | 85.27 | 87.69 | 78.80 |
| MidFusion | 69.80 | 84.16 | 87.63 | 80.53 |
| ProbEn3 | 73.49 | 87.65 | 90.14 | 83.76 |
5 Discussion and Conclusions
We explore different fusion strategies for multimodal detection under both aligned and unaligned RGB-thermal images. We show that non-learned probabilistic fusion, ProbEn, significantly outperforms prior approaches. Key reasons for its strong performance are that (1) it can take advantage of highly-tuned single-modal detectors trained on large-scale single-modal datasets, and (2) it can deal with missing detections from particular modalities, a common occurrence when fusing together detections. One by-product of our diagnostic analysis is the remarkable performance of NMS as a fusion technique, precisely because it exploits the same key insights. Our ProbEn yields 13% relative improvement over prior work, both on aligned and unaligned multimodal benchmarks.
Acknowledgement.
This work was supported by the CMU Argo AI Center for Autonomous Vehicle Research. Authors acknowledge valuable discussions with Jessica Lee, Peiyun Hu, Jianren Wang, David Held, Kangle Deng, and Michel Laverne.
References
- [1] Akiba, T., Kerola, T., Niitani, Y., Ogawa, T., Sano, S., Suzuki, S.: Pfdet: 2nd place solution to open images challenge 2018 object detection track. arXiv preprint arXiv:1809.00778 (2018)
- [2] Albaba, B.M., Ozer, S.: Synet: An ensemble network for object detection in uav images. In: 2020 25th International Conference on Pattern Recognition (ICPR). pp. 10227–10234. IEEE (2021)
- [3] Bauer, E., Kohavi, R.: An empirical comparison of voting classification algorithms: Bagging, boosting, and variants. Machine learning 36(1), 105–139 (1999)
- [4] Bertini, M., del Bimbo, A.: Task-conditioned domain adaptation for pedestrian detection in thermal imagery. In: ECCV (2020)
- [5] Bodla, N., Singh, B., Chellappa, R., Davis, L.S.: Soft-nms–improving object detection with one line of code. In: ICCV (2017)
- [6] Bolya, D., Zhou, C., Xiao, F., Lee, Y.J.: Yolact: Real-time instance segmentation. In: ICCV (2019)
- [7] Caesar, H., Bankiti, V., Lang, A.H., Vora, S., Liong, V.E., Xu, Q., Krishnan, A., Pan, Y., Baldan, G., Beijbom, O.: nuscenes: A multimodal dataset for autonomous driving. In: Proceedings of the IEEE/CVF Conference on Computer Vision and Pattern Recognition. pp. 11621–11631 (2020)
- [8] Cao, Y., Zhou, T., Zhu, X., Su, Y.: Every feature counts: An improved one-stage detector in thermal imagery. In: IEEE International Conference on Computer and Communications (ICCC) (2019)
- [9] Choi, H., Kim, S., Park, K., Sohn, K.: Multi-spectral pedestrian detection based on accumulated object proposal with fully convolutional networks. In: International Conference on Pattern Recognition (ICPR) (2016)
- [10] Dalal, N., Triggs, B.: Histograms of oriented gradients for human detection. In: CVPR (2005)
- [11] Dawid, A.P.: Conditional independence in statistical theory. Journal of the Royal Statistical Society: Series B (Methodological) 41(1), 1–15 (1979)
- [12] Devaguptapu, C., Akolekar, N., M Sharma, M., N Balasubramanian, V.: Borrow from anywhere: Pseudo multi-modal object detection in thermal imagery. In: Proceedings of the IEEE Conference on Computer Vision and Pattern Recognition Workshops. pp. 0–0 (2019)
- [13] Dietterich, T.G.: Ensemble methods in machine learning. In: International workshop on multiple classifier systems. pp. 1–15. Springer (2000)
- [14] Dollár, P., Wojek, C., Schiele, B., Perona, P.: Pedestrian detection: A benchmark. In: CVPR (2009)
- [15] Dollar, P., Wojek, C., Schiele, B., Perona, P.: Pedestrian detection: An evaluation of the state of the art. IEEE transactions on pattern analysis and machine intelligence 34(4), 743–761 (2011)
- [16] Dong, W.: https://github.com/wushidonguc/two-stream-action-recognition-keras/blob/master/fuse_validate_model.py. commit 0a3e722
- [17] Everingham, M., Eslami, S.A., Van Gool, L., Williams, C.K., Winn, J., Zisserman, A.: The pascal visual object classes challenge: A retrospective. International journal of computer vision 111(1), 98–136 (2015)
- [18] Feichtenhofer, C.: https://github.com/feichtenhofer/twostreamfusion/blob/master/cnn_ucf101_fusion.m. commit 3e313c4
- [19] Feichtenhofer, C., Pinz, A., Zisserman, A.: Convolutional two-stream network fusion for video action recognition. In: CVPR (2016)
- [20] FLIR: Flir thermal dataset for algorithm training. https://www.flir.in/oem/adas/adas-dataset-form (2018)
- [21] Freund, Y., Schapire, R.E., et al.: Experiments with a new boosting algorithm. In: icml. vol. 96, pp. 148–156. Citeseer (1996)
- [22] Geiger, A., Lenz, P., Urtasun, R.: Are we ready for autonomous driving? the kitti vision benchmark suite. In: Conference on Computer Vision and Pattern Recognition (CVPR) (2012)
- [23] Guan, D., Cao, Y., Yang, J., Cao, Y., Yang, M.Y.: Fusion of multispectral data through illumination-aware deep neural networks for pedestrian detection. Information Fusion 50, 148–157 (2019)
- [24] Guo, C., Pleiss, G., Sun, Y., Weinberger, K.Q.: On calibration of modern neural networks. arXiv preprint arXiv:1706.04599 (2017)
- [25] Guo, R., Cui, C., Du, Y., Meng, X., Wang, X., Liu, J., Zhu, J., Feng, Y., Han, S.: 2nd place solution in google ai open images object detection track 2019. arXiv preprint arXiv:1911.07171 (2019)
- [26] He, K., Gkioxari, G., Dollár, P., Girshick, R.: Mask r-cnn. In: ICCV (2017)
- [27] Hosang, J., Benenson, R., Schiele, B.: Learning non-maximum suppression. In: Proceedings of the IEEE conference on computer vision and pattern recognition. pp. 4507–4515 (2017)
- [28] Huang, Z., Chen, Z., Li, Q., Zhang, H., Wang, N.: 1st place solutions of waymo open dataset challenge 2020–2d object detection track. arXiv preprint arXiv:2008.01365 (2020)
- [29] Hwang, S., Park, J., Kim, N., Choi, Y., So Kweon, I.: Multispectral pedestrian detection: Benchmark dataset and baseline. In: CVPR (2015)
- [30] Kiew, M.Y., Bagdanov, A.D., Bertini, M.: Bottom-up and layer-wise domain adaptation for pedestrian detection in thermal images. ACM Transactions on Multimedia Computing Communications and Applications (2020)
- [31] Kim, J., Kim, H., Kim, T., Kim, N., Choi, Y.: Mlpd: Multi-label pedestrian detector in multispectral domain. IEEE Robotics and Automation Letters 6(4), 7846–7853 (2021)
- [32] Kittler, J., Hatef, M., Duin, R.P., Matas, J.: On combining classifiers. IEEE transactions on pattern analysis and machine intelligence 20(3), 226–239 (1998)
- [33] Konig, D., Adam, M., Jarvers, C., Layher, G., Neumann, H., Teutsch, M.: Fully convolutional region proposal networks for multispectral person detection. In: Proceedings of the IEEE Conference on Computer Vision and Pattern Recognition Workshops. pp. 49–56 (2017)
- [34] Krizhevsky, A., Sutskever, I., Hinton, G.E.: Imagenet classification with deep convolutional neural networks. Advances in neural information processing systems 25, 1097–1105 (2012)
- [35] Li, C., Song, D., Tong, R., Tang, M.: Multispectral pedestrian detection via simultaneous detection and segmentation. arXiv preprint arXiv:1808.04818 (2018)
- [36] Li, C., Song, D., Tong, R., Tang, M.: Illumination-aware faster r-cnn for robust multispectral pedestrian detection. Pattern Recognition 85, 161–171 (2019)
- [37] Lin, T.Y., Maire, M., Belongie, S., Hays, J., Perona, P., Ramanan, D., Dollár, P., Zitnick, C.L.: Microsoft coco: Common objects in context. In: European conference on computer vision. pp. 740–755. Springer (2014)
- [38] Liu, J., Zhang, S., Wang, S., Metaxas, D.: Improved annotations of test set of kaist (2018)
- [39] Liu, J., Zhang, S., Wang, S., Metaxas, D.N.: Multispectral deep neural networks for pedestrian detection. BMVC (2016)
- [40] Liu, W., Anguelov, D., Erhan, D., Szegedy, C., Reed, S., Fu, C.Y., Berg, A.C.: Ssd: Single shot multibox detector. In: ECCV. pp. 21–37. Springer (2016)
- [41] Munir, F., Azam, S., Rafique, M.A., Sheri, A.M., Jeon, M.: Thermal object detection using domain adaptation through style consistency. arXiv preprint arXiv:2006.00821 (2020)
- [42] Nix, D.A., Weigend, A.S.: Estimating the mean and variance of the target probability distribution. In: Proceedings of 1994 ieee international conference on neural networks (ICNN’94). vol. 1, pp. 55–60. IEEE (1994)
- [43] Paszke, A., Gross, S., Chintala, S., Chanan, G., Yang, E., DeVito, Z., Lin, Z., Desmaison, A., Antiga, L., Lerer, A.: Automatic differentiation in pytorch (2017)
- [44] Pearl, J.: Probabilistic reasoning in intelligent systems: networks of plausible inference. Elsevier (2014)
- [45] Quigley, M., Conley, K., Gerkey, B., Faust, J., Foote, T., Leibs, J., Wheeler, R., Ng, A.Y.: Ros: an open-source robot operating system. In: ICRA workshop on open source software. vol. 3, p. 5. Kobe, Japan (2009)
- [46] Redmon, J., Divvala, S., Girshick, R., Farhadi, A.: You only look once: Unified, real-time object detection. In: CVPR (2016)
- [47] Redmon, J., Farhadi, A.: Yolo9000: better, faster, stronger. In: CVPR (2017)
- [48] Ren, S., He, K., Girshick, R., Sun, J.: Faster r-cnn: Towards real-time object detection with region proposal networks. In: NeurIPS (2015)
- [49] Russakovsky, O., Deng, J., Su, H., Krause, J., Satheesh, S., Ma, S., Huang, Z., Karpathy, A., Khosla, A., Bernstein, M., et al.: Imagenet large scale visual recognition challenge. International journal of computer vision 115(3), 211–252 (2015)
- [50] Simonyan, K., Zisserman, A.: Two-stream convolutional networks for action recognition in videos. In: NeurIPS. pp. 568–576 (2014)
- [51] Solovyev, R., Wang, W., Gabruseva, T.: Weighted boxes fusion: Ensembling boxes from different object detection models. Image and Vision Computing 107, 104117 (2021)
- [52] Valverde, F.R., Hurtado, J.V., Valada, A.: There is more than meets the eye: Self-supervised multi-object detection and tracking with sound by distilling multimodal knowledge. In: CVPR (2021)
- [53] Wagner, J., Fischer, V., Herman, M., Behnke, S.: Multispectral pedestrian detection using deep fusion convolutional neural networks. In: Proceedings of European Symposium on Artificial Neural Networks (2016)
- [54] Wu, Y., Kirillov, A., Massa, F., Lo, W.Y., Girshick, R.: Detectron2. https://github.com/facebookresearch/detectron2 (2019)
- [55] Wu, Z., Wang, X., Jiang, Y.G., Ye, H., Xue, X.: Modeling spatial-temporal clues in a hybrid deep learning framework for video classification. In: Proceedings of the ACM international conference on Multimedia (2015)
- [56] Xu, D., Ouyang, W., Ricci, E., Wang, X., Sebe, N.: Learning cross-modal deep representations for robust pedestrian detection. In: CVPR (2017)
- [57] Xu, P., Davoine, F., Denoeux, T.: Evidential combination of pedestrian detectors. In: British Machine Vision Conference. pp. 1–14 (2014)
- [58] Yue-Hei Ng, J., Hausknecht, M., Vijayanarasimhan, S., Vinyals, O., Monga, R., Toderici, G.: Beyond short snippets: Deep networks for video classification. In: CVPR (2015)
- [59] Zhang, H., Dana, K.: Multi-style generative network for real-time transfer. arXiv preprint arXiv:1703.06953 (2017)
- [60] Zhang, H., Fromont, E., Lefèvre, S., Avignon, B.: Multispectral fusion for object detection with cyclic fuse-and-refine blocks. In: IEEE International Conference on Image Processing (ICIP) (2020)
- [61] Zhang, H., Fromont, E., Lefèvre, S., Avignon, B.: Guided attentive feature fusion for multispectral pedestrian detection. In: WACV (2021)
- [62] Zhang, L., Liu, Z., Zhang, S., Yang, X., Qiao, H., Huang, K., Hussain, A.: Cross-modality interactive attention network for multispectral pedestrian detection. Information Fusion 50, 20–29 (2019)
- [63] Zhang, L., Zhu, X., Chen, X., Yang, X., Lei, Z., Liu, Z.: Weakly aligned cross-modal learning for multispectral pedestrian detection. In: ICCV (2019)
- [64] Zhou, K., Chen, L., Cao, X.: Improving multispectral pedestrian detection by addressing modality imbalance problems. In: Computer Vision–ECCV 2020: 16th European Conference, Glasgow, UK, August 23–28, 2020, Proceedings, Part XVIII 16. pp. 787–803. Springer (2020)
- [65] Zhu, J.Y., Park, T., Isola, P., Efros, A.A.: Unpaired image-to-image translation using cycle-consistent adversarial networks. In: ICCV (2017)
- [66] Zhu, Y.: https://github.com/bryanyzhu/two-stream-pytorch/blob/master/scripts/eval_ucf101_pytorch/temporal_demo.py. commit 32b6354
- [67] Zitnick, C.L., Dollár, P.: Edge boxes: Locating object proposals from edges. In: ECCV. pp. 391–405. Springer (2014)
Appendix
The appendix provides additional studies about the proposed probabilistic ensembling technique (ProbEn). Below is a sketch of document and we refer the reader to each of these sections for details.
- •
Section 6: Analysis of ProbEn and comparisons to other late-fusion methods.
- •
Section 7: Score calibration for ProbEn
- •
Section 8: Further study of weight score fusion
- •
Section 9: Further study of class prior in ProbEn
- •
Section 10: A detailed derivation of probabilistic box fusion
- •
Section 11: A study of fusing more and better models
- •
Section 12: Qualitative results and video demo
6 Probabilistic Fusion for Logits
We compare ProbEn to additional late fusion approaches in the literature that extends beyond detection. Because classic fusion approaches [50, 58, 19] often operate on logit scores that are input into a softmax (rather than operating on the output of a softmax), we re-examine ProbEn in terms of logit scores.
Let us rewrite the single-modal softmax posterior for class given modality in terms of single-modal logit scores . For notational simplicity, we suppress its dependence on the underlying input modality :
| (9) |
where we exploit the fact that the partition function in the denominator is not a function of the class label . We now plug the above into Eq. 6:
| (10) |

If we assume a uniform prior over classes, Bayesian posteriors are proportional to where are the summed per-modality logits. Hence, ProbEn corresponds to adding logits from each modality. This suggests another practical implementation of ProbEn that may improve numerical stability: given single-modal detections with cached logit scores, sum logit scores on overlapping detections before pushing them through a softmax.
| Method | Day | Night | All |
| RGB | 14.56 | 27.42 | 18.67 |
| Thermal | 24.59 | 7.76 | 18.99 |
| Pooling | 37.92 | 22.61 | 32.68 |
| NMS (MaxFusion) | 13.25 | 6.42 | 10.78 |
| AvgScore | 21.68 | 15.16 | 19.53 |
| AvgLogits | 18.78 | 11.70 | 16.28 |
| LogRegFusion | 10.70 | 6.11 | 9.08 |
| ProbEn | 10.21 | 5.45 | 8.62 |
| ProbEn+bbox | 9.93 | 5.41 | 8.50 |
Summing vs. averaging logits. Let us now revisit prior approaches to logit-based fusion in detail. Late fusion was popularized by video classification networks that made use of two-stream architectures [50]. This seminal work proposed an influential baseline for “fusing softmax scores” by averaging. However, practical implementations average logits [66, 16] or sum logits [18], often omitting the final softmax [55] because one can obtain a class prediction by simple maximization of the fused logits. In the classification setting, the distinction between summing versus averaging does not matter because both produce the same argmax label prediction. But the distinction does matter in detection, which requires ranking and comparison of scores for non-maximal suppression (NMS) and global thresholding. Intuitively, summing allows detections to become more confident as more modalities agree, while averaging does not. Most crucially, summing logits allows one to optimally compare detections with missing modalities, which is frequently needed in NMS whenever all modalities fail to fire on a given object. Here, optimality holds in the Bayesian sense whenever modalities are conditionally independent (as derived in (10)).
Fusion from logits. We can succintly compare various fusion approaches from the logit perspective with the following:
| (11) | ||||
| (12) |
It is easy to see that
Note that the relative ordering of the fused logits does not necessarily imply the same holds for the final posterior because the other class logits are needed to compute the softmax partition function. One particularly simple case to analyze is a single-class detector , as is true for the KAIST benchmark (that evaluates only pedestrians). Here we can analytically compute posteriors by looking at the relative logit score for modality (by relying on the well-known fact that a 2-class softmax function reduces to a sigmoid function of the relative input scores). We visualize the fused probability as a function of the relative per-modality logits and in Fig. 7. Finally, Table 5 explicitly compares the performance of such fusion approaches with other diagnostic variants. We refer the reader to both captions for more analysis.

| Method | A+B | A+C | A+D | B+C | B+D | C+D | A+B+C | A+B+D | A+B+C+D |
| Pooling | 32.68 | 28.87 | 29.70 | 36.68 | 36.36 | 23.24 | 43.04 | 43.56 | 46.03 |
| AvgScore | 19.53 | 19.94 | 18.67 | 21.58 | 18.18 | 22.26 | 21.98 | 21.06 | 24.06 |
| NMS | 10.85 | 11.59 | 13.05 | 18.74 | 13.81 | 14.18 | 10.91 | 12.11 | 12.09 |
| ProbEn | 8.62 | 9.63 | 10.99 | 16.88 | 11.90 | 11.58 | 8.40 | 8.54 | 8.21 |
| ProbEn + bbox | 8.50 | 9.87 | 10.30 | 16.87 | 11.20 | 11.32 | 8.55 | 7.66 | 7.45 |
(a) RGB-detector (b) thermal-detector (c) NMS fusion (d) ProbEn fusion

7 Score Calibration for Fusion
ProbEn assumes that detectors return true class posteriors. However, deep networks are notoriously over-confident in their predictions, even when wrong [24]. One popular calibration strategy is adding a temperature parameter to the final softmax, typically to “soften” overconfident estimates [24]. This can be implemented by scaling logits by a temperature :
| (13) |
In the two-modality detection setting, because monotonic transformations of probability scores will not affect ranks (and hence not effect LAMR or AP), one can show that we need only calibrate one of two modalities. In practice, we calibrate thermal detector scores so as to better match scores from the RGB detector. Figure 8 plots LAMR as a function of a single scalar temperature used to scale thermal detections. Tuning yields only a marginal improvement over standard ProbEn (i.e., when ). We conjecture that the two single-modal detectors are trained with the same annotation and network architecture, making their output scores comparable to each other already.
Interestingly, when we ensemble an off-the-self multimodal detector GAFF [61], our Thermal and RGB detectors (trained in-house), we find score calibration is particularly important. Importantly, we find that calibration requires not only a temperature variable but also a shift variable on the logits of GAFF. We conjecture that this is because GAFF is trained in a very different way; we do not know how GAFF is trained as there is not a publicly available codebase. Fig. 10 depicts the miss-rate as a function of the two variables, temperature and shift . Clearly, the shift variable makes a significant impact on the fusion results.

| Method | A+B | A+C | B+C | A+B+C |
| Pooling | 54.04 | 61.48 | 63.38 | 53.66 |
| AvgScore | 81.65 | 81.47 | 82.43 | 82.65 |
| NMS | 81.75 | 82.34 | 82.43 | 83.14 |
| ProbEn | 82.05 | 82.26 | 82.67 | 83.27 |
| ProbEn + bbox | 81.93 | 82.85 | 83.04 | 83.76 |
8 Further Study of Weighted Score Fusion
All late fusion approaches discussed thus far do not require training on multimodal data. Because prior work on late fusion has also explored learned variants, we also consider (learned) linear combinations of single-modal logits:
| (14) |
One can view ProbEn, AvgLogits, and Temperature Scaling as special cases of the above. ProbEn and AvgLogits use predefined weights that do not require learning and so are easy to implement. Temperature scaling requires single-modal validation data to tune each temperature parameter, but does not require multimodal learning. This can be advantageous in settings where modalities do not align (e.g., FLIR) or where there exists larger collections of single-modal training data (e.g., COCO training data for RGB detectors). Truly joint learning of weights requires multimodal training data, but joint learning may better deal with correlated modalities by downweighting the contribution of modalities that are highly correlated (and don’t provide independant sources of information). We experimented with joint learning of the weights with logistic regression. To do so, we assembled training examples of overlapping single-modal detections (and cached logit scores) encountered during NMS, assigning a binary target label (corresponding to true vs false positive detection). After training on such data, we observe a small improvement over non-learned fusion (Table 5), consistent with prior art on late fusion [50]. We also tested learning-based late fusion methods on the FLIR dataset. We further tested learning class priors. However, these methods do not yield better performance than the simple non-learned ProbEn (both achieve 82.91 AP). The reason is that FLIR annotations are inconsistent across frames, making it hard for learning-based late fusion methods to shine, as explained in Fig. 14 and 11.
RGB frame thermal frame annotations our predictions


9 Further Study of Class Prior in ProbEn
In the main paper, we assume uniform class priors when using ProbEn. Now we test ProbEn with computed class priors. For consistent experiments as done in the main paper, we use FLIR dataset and fuse three models (Thermal, Early and Mid). Recall that FLIR has imbalanced classes: person (21,744), bicycle (3,806), and car (39,372). First, we count the number of annotated objects of each of the three class, and assign the fourth background class with a dummy number. Then, we normalize them to be sum-to-one as class priors. We vary the background prior and evaluate the final detection performance measured by AP at IoU0.5, as shown in Fig. 12. Clearly, ProbEn works better with uniform priors than the computed the class piriors.
We further ablate which class is more important by manually assigning a prior. Concretely, we vary one class prior by fixing the others to be the same. We plot the performance vs. the per-class prior in Fig. 13. Tuning specific class priors yields marginal improvements compared to using uniform prior.
10 A Detailed Derivation of Probabilistic Box Fusion
In the main paper, we present a probabilistic method to fuse multiple bounding boxes. Below is a detailed derivation. We write for the continuous random variable defining the bounding box (parameterized by its centroid, width, and height) associated with a given detection. We assume single-modal detections provide a posterior that takes the form of a Gaussian with a single variance , i.e., where are box coordinates predicted from modality . We also assume a uniform prior on , implying box coordinates can lie anywhere in the image plane. Doing so, we derive probabilistic box fusion:


11 A Study of Fusing More and Better Models
We study late fusion methods on more combinations of underlying detectors. Table 6, 7 and 8 list results on KAIST and FLIR datasets, respectively. Importantly, ProbEn consistently performs the best on each of combinations. Interestingly, applying ProbEn method to detectors that are not independent to each other (e.g., Thermal and MidFusion) can achieve better performance. Admittedly, the improvements may not be statistically significant and overfitting may be an issue. This can not be resolved or studied further using contemporary datasets which are relatively small. Therefore, we solicit a larger-scale dataset to benchmark multimodal detection in the commmunity.
| fusing MLPD and GAFF on KAIST (LAMR in %) | |||
| method | Day | Night | All |
| MLPD | 7.96 | 6.95 | 7.58 |
| GAFF | 8.25 | 3.46 | 6.38 |
| NMS (MLPD+GAFF) | 7.63 | 6.76 | 7.24 |
| ProbEn (MLPD+GAFF) | 6.23 | 3.79 | 5.38 |
| NMS3 w/ MLPD | 7.34 | 7.03 | 7.13 |
| ProbEn3 w/ MLPD | 7.81 | 5.02 | 6.76 |
| NMS3 w/ GAFF | 8.29 | 3.46 | 6.36 |
| ProbEn3 w/ GAFF | 6.04 | 3.59 | 5.14 |
12 Qualitative Results and Video Demo
In our github repository, we attach a demo video on a testing video (captured at night) provided by the FLIR dataset. In the video, we compare the detection results by the Thermal model and ProbEn that fuses results of three models (Thermal + Eary + Mid). Recall that the FLIR dataset does not align RGB and thermal frames, and annotates only thermal frames. Therefore, we only provide RGB frames as reference (cf. Fig. 15).
Lastly, we provide more qualitative results in Figure 16 and 17 for KAIST and FLIR, respectively. Visually, we can see our ProbEn method performs better than the compared methods.


