Relationships between Superconductivity and Nematicity in FeSe1-xTex () Films Studied by Complex Conductivity Measurements
Abstract
We measured the complex conductivity, , of FeSe1-xTex () films in the superconducting state which show a drastic increase of the superconducting transition temperature, , when the nematic order disappears. Since the magnetic penetration depth, 400 nm), of Fe(Se,Te) is longer than the typical thickness of the film (100 nm), we combined the coplanar waveguide resonator and cavity perturbation techniques to evaluate both the real and imaginary parts of . Films with a nematic order showed a qualitatively different temperature dependence in penetration depth and quasiparticle scattering time when compared with those without nematic order, suggesting that nematic order influences the superconducting gap structure. Conversely, the proportionality between superfluid density, (), and was observed irrespective of the presence or absence of nematic order. This result indicates that the amount of superfluid has a stronger impact on the of Fe(Se,Te) than the presence or absence of nematic order. Combining these results with band dispersions calculated using density functional theory, we propose that the change of the Fermi surface associated with nematicity is the primary factor influencing the change of and the superconducting gap structure in Fe(Se,Te).
I Introduction
Iron chalcogenide superconductor, FeSe, has been intensively studied by virtue of its various intriguing properties:Liu et al. 2015; Böhmer and Kreisel 2018; Kreisel et al. 2020 the potential for high-transition-temperature superconductivity, the absence of magnetic order under ambient pressures, and their ability to exhibit exotic electronic states as a result of their extremely small Fermi surface. The superconducting transition temperature, , can be enhanced above 40 K from 9 K by intercalation,Hsu et al. 2008; Burrard-Lucas et al. 2013 carrier doping using an electron double layer transistor,Shiogai et al. 2016; Shikama et al. 2020 and synthesis of a monolayer film.Wang et al. 2012; Huang and Hoffman 2017 The nematic phase without magnetic order in FeSe is ideal for studying the origin of nematicity and the relationship between nematicity and superconductivity.Fernandes et al. 2014; Glasbrenner et al. 2015 Furthermore, the small Fermi surface ( meV) can easily be tuned by hydrostatic pressure,Margadonna et al. 2009 chemical pressure via isovalent substitution,Fang et al. 2008; Mizuguchi et al. 2009; Imai et al. 2015 and the in-plane lattice strain.Nabeshima et al. 2018a Since changes in the Fermi surface influence the superconducting, nematic, and magnetic phases, various techniques have been applied to investigate the electronic phase diagram and exotic superconductivity of FeSe.
Among the above-mentioned techniques to control the electronic state, chemical isovalent substitution is advantageous since experiments can be performed under ambient pressures. The S-substitution shrinks the lattice of FeSe, resulting in positive chemical pressure. With increasing S content, the nematic transition temperature, , decreases, and slightly increases and decreases.Watson et al. 2015 Although no significant changes in occur when the nematic order disappears, some abrupt changes in the superconducting gap have been observed in a measurement of thermal properties and the scanning tunneling microscopy/spectroscopy.Sato et al. 2018; Hanaguri et al. 2018 Hence, the nematic order or its fluctuation may exert some influence on the superconducting state. Conversely, few systematic investigations of Te-substituted FeSe, which are subject to negative chemical pressures, have been conducted relative to those concerning Fe(Se,S) since the systematic synthesis of bulk Fe(Se,Te) had, until recently, been hindered by the phase separation region.Terao et al. 2019 Since the superconducting gap structure of FeSe is distinctly different from that of FeSe1-xTex (),Hanaguri et al. 2010; Kasahara et al. 2014; Sprau et al. 2017 it is necessary to understand how the superconducting gap evolves with increasing Te content.
Before the systematic synthesis of bulk Fe(Se,Te), we succeeded in growing single-crystalline thin films of FeSe1-xTex in the whole composition () using a pulsed laser deposition technique.Imai et al. 2015; Imai et al. 2017 Although the of the Fe(Se,Te) films decreased after Te substitution, was largely enhanced after the disappearance of nematic order.Imai et al. 2015; Bellingeri et al. 2010; Sylva et al. 2018 This enhancement of is contrary to the Fe(Se,S) films and bulk Fe(Se,Te),Nabeshima et al. 2018b; Terao et al. 2019 indicating that the effect of nematicity on is complicated in these materials. Although a positive correlation between and the carrier density or the density of states (DOS) has been reported through magneto-transport and the angle-resolved photoemission spectroscopy (ARPES) in the normal state,Nabeshima et al. 2020; Nakayama et al. 2021 the superconducting properties of these films and their relation to nematicity are yet to be fully understood. To elucidate the effects of Te substitution and nematicity on superconductivity, we investigated both the response of the superfluid and dynamics of quasiparticles below in Fe(Se,Te) films.
In this paper, we report systematic measurements of the complex conductivity, , of FeSe1-xTex () films below . Since the magnetic penetration depth, , is several times as long as the typical thickness of the film ( nm), measurement techniques applicable to bulk crystals cannot be used. Hence, to evaluate both the real and imaginary parts of , we combined the coplanar waveguide resonator and cavity perturbation techniques. The quasiparticle scattering time, , was calculated from the real part of and was found to increase at low temperatures, as observed in bulk FeSe and FeSe0.4Te0.6.Takahashi et al. 2011; Okada et al. Moreover, the and of films with nematic order showed a quantitatively distinct behavior from films without nematic order, suggesting that changes in the superconducting gap structure are associated with nematic order. Conversely, the proportionality between superfluid density, , and was observed irrespective of the presence or absence of nematic order. Additionally, using density functional theory (DFT) calculations, we confirmed a change of Fermi surface associated with nematic order, which is considered to influence the superconducting gap structure. Moreover, DOS decreased in the nematic phase, which may have caused a decrease in superfluid density. From these results, we suggest that the change of the band structure in the nematic phase primarily influences the superconducting gap structure and rather than the nematic fluctuation developing near the nematic quantum critical point.Mukasa et al. 2021
II Experiments
II.1 Sample
All films were grown on CaF2 substrates ( mm3) via the pulsed laser deposition method using a KrF laser. The details of film growth have been described elsewhere.Imai et al. 2010a; Imai et al. 2010b The thicknesses of grown films were measured using a stylus profiler. DC electrical resistivity was measured using a standard four-probe method equipped with a physical property measurement system (Quantum Design, PPMS).

II.2 Measurements and calculations
To measure of FeSe1-xTex films, we fabricated the mm2 film into the coplanar waveguide resonator (Fig. 1 [a]) by Ar ion milling and focused ion beam (FIB). Ar ion milling was used to fabricate the whole structure, after which the 50 m gap between the resonator and the microwave input/output port was etched using FIB. The width of the resonator, , the gap between the resonator and the ground, , and the length of the resonator, , were designed to be 120 m, 30 m, and 6.2-9.9 mm, respectively. The resonance frequency of the coplanar resonator was 6-10 GHz. Figure 1 (b) shows the fabricated resonator on the FeSe0.8Te0.2 film. The resonator was mounted onto a printed circuit board, which was connected to the resonator by Al wirebonding. This was cooled down to 2 K using PPMS. Transmitted power was measured using a network analyzer (Keysight, N5222A).
was calculated from the resonance frequency, , as follows. For the half-wavelength coplanar resonator:
| (1) |
where is the inductance per unit length and is the capacitance per unit length. Using an electromagnetic simulation software (WIPL-D), we confirmed that the coupling between the resonator and the input port had negligible effects on . For a superconductor:
| (2) |
where is the magnetic inductance and is the kinetic inductance corresponding to the response of the superfluid Watanabe et al. 1994. is a quadratic function of as follows:
| (3) |
where is vacuum permeability, is a geometrical factor, and is the thickness of the film Watanabe et al. 1994; Clem 2013. From eq. (1)-(3), is expressed as follows:
| (4) |
All parameters on the right-hand side of eq. (4) can be determined from the shape of the resonator (, , ) and measurements of and . The length was measured using an optical microscope (Keyence, VHS-6000), and the thickness was measured using a stylus profiler as mentioned above. The typical standard deviations of and and were about 1-2 um, 1-2 um and 1 nm, respectively, leading to the standard deviation of of 50nm, which was shown as an error bar. Also, was measured using an impedance analyzer (Hewlett-Packard, 4192A) in the frequency range, 10-1000 kHz. The measured values of were in good agreement with the calculated values of assuming that the relative permittivity of CaF2 is 6.5. Jacob et al. 2003
The dynamics of quasiparticles in the Fe(Se,Te) films were measured using the cavity perturbation technique. For a thin film (), the cavity perturbation formula for the analysis of a bulk crystal cannot be applied. In such cases, the measured quantity is the effective impedance, , where is surface impedance. Formulae of corresponding to various situations have been derived, and are found to depend on configurations of both the electromagnetic field and the sample.Klein et al. 1990; Drabeck et al. 1990; Peligrad et al. 1998; Barannik et al. 2014
A flake of FeSe1-xTex film with substrate was cut from the coplanar resonator after the measurement of . This flake ( 0.5 0.5 mm2) was mounted onto a sapphire rod at the center of the cavity resonator (Fig. 1 [c]). The TE011 mode (44 GHz) of the resonator was used with a configuration in which the magnetic field of the TE011 mode was parallel to the film well below such that can be expressed as follows:
| (5) |
where is angular frequency Barannik et al. 2014. Experimentally, the effective surface resistance, , is determined by the following equation:
| (6) |
where is the geometric factor, is the quality factor of the cavity containing the sample, is the quality factor of the cavity without the sample. Here, we have confirmed that the effect of the CaF2 substrate was negligible by measurement of the substrate alone. Also, the effective surface reactance, is as follows:
| (7) |
where is the resonance frequency with the sample, is the resonance frequency without the sample, and is the minimum temperature during the measurement, typically 2.1 K.
To obtain by solving eq. (5)-(7), we determined and as follows. At low temperatures where ,
| (8) |
from eq. (5) and . Thus, can be calculated by substituting the value of measured by the coplanar resonator into eq. (8). Here, was obtained using eq. (8) and measured by the coplanar resonator. Conversely, was determined by curve fitting assuming that calculated using eq.(8) and measured by the coplanar resonator and obtained from eq.(7) and the measurement of the cavity resonator is equal in the temperature range, , where the approximation, , hold. After determining and , we numerically solved eq. (5) and obtained . It should be noted that eq. (5) is not applicable near due to the drastic change of the electromagnetic field distribution around the film.Barannik et al. 2014 Here, we determined the upper temperature limit for an applicable range of eq. (5) to be below 0.75 from a measurement of a conventional superconductor, NbN film.
Besides the measurement of , we performed DFT calculation using FPLO-18. The exchange functional was a generalized gradient approximation (GGA+U). The -mesh was . For the calculation of the nematic phase, we applied the technique proposed in Ref. Long et al. 2020, using lattice constants for FeSe as follows: Å, Åand .Glasbrenner et al. 2015
III Results and Discussion
III.1 Measurements of complex conductivity

Figure 2 shows the temperature dependence of DC resistivity in FeSe1-xTex () films. increased from to , consistent with previous reports.Imai et al. 2015 Subsequently, gradually decreased with increasing Te content, and the resistivity of increased from 100 cm at to 400 cm at , which was again a typical value for these films.Imai et al. 2017
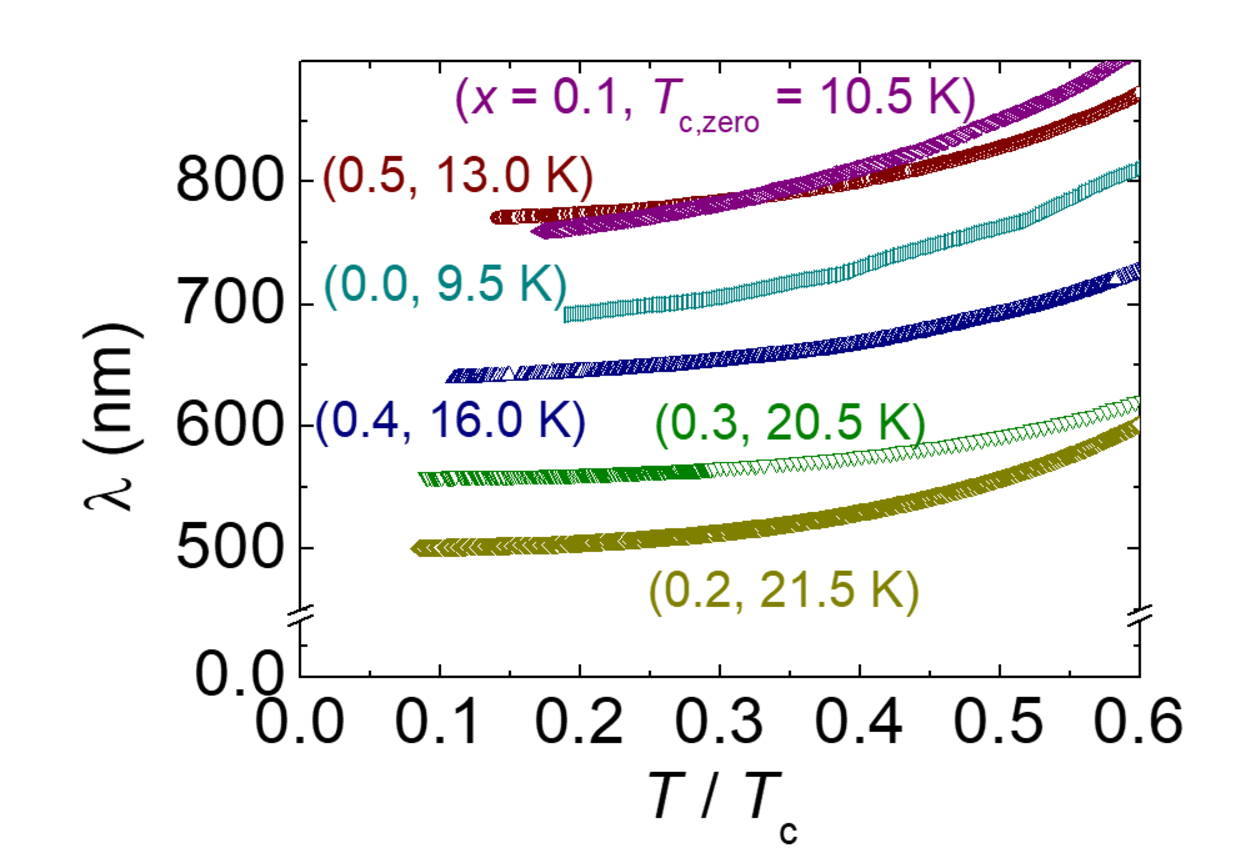
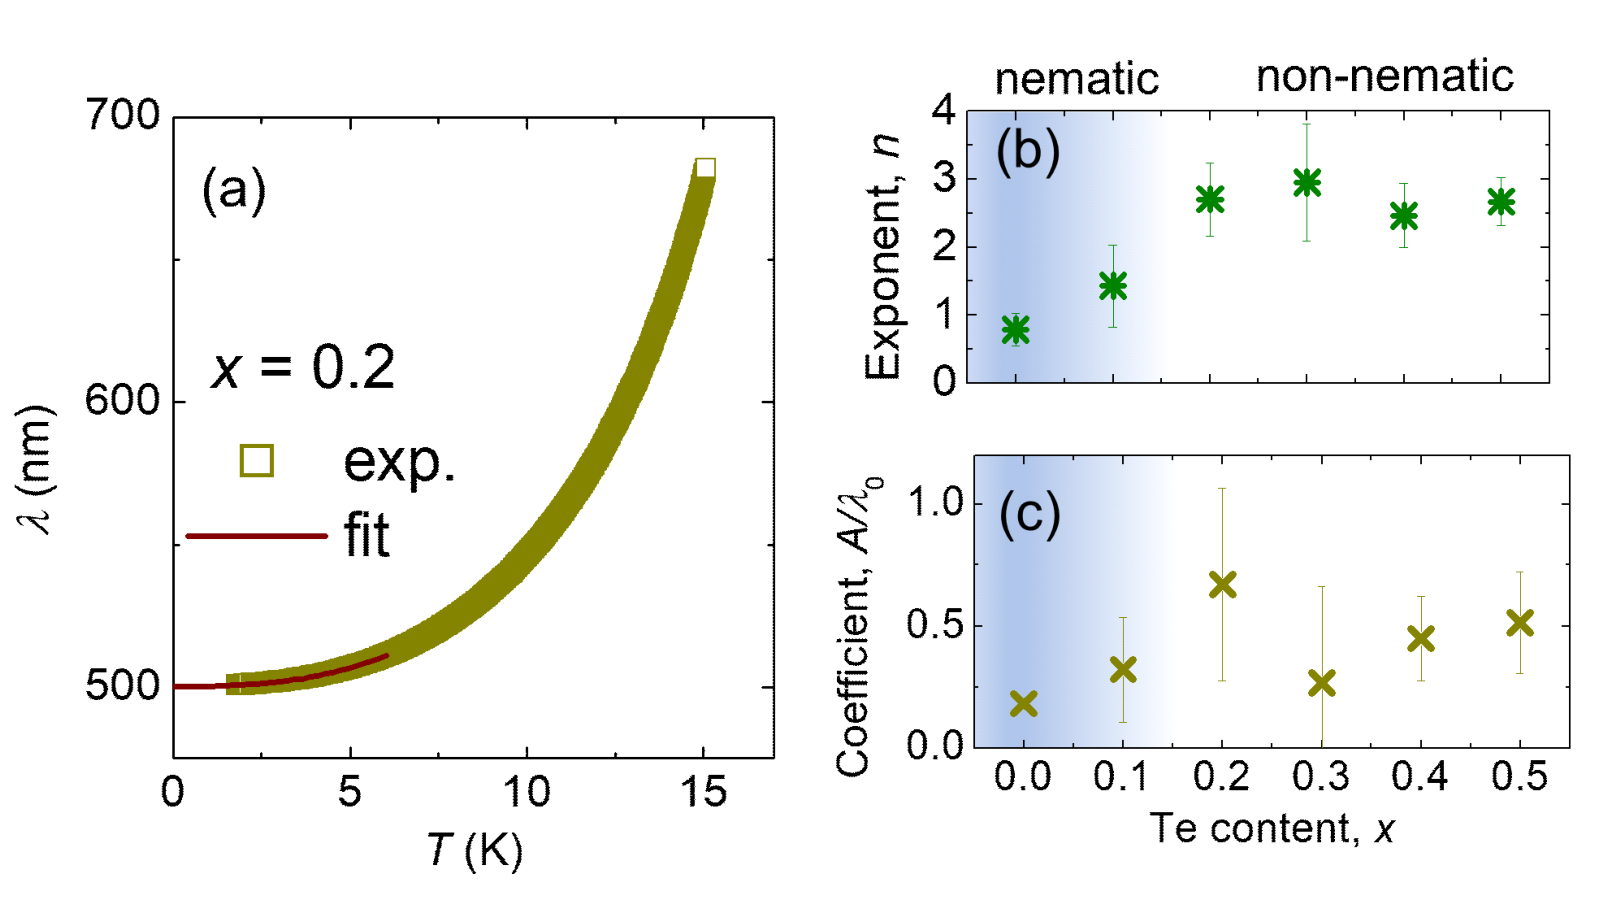
Using the temperature dependence of of the coplanar resonator, we calculated using eq. (4). Fig. 3 shows of FeSe1-xTex () films as a function of reduced temperature. The obtained was extrapolated to 0 K assuming that , where is the penetration depth at 0 K, and and are constants. Here, we performed curve fitting in the temperature range from 2 K to 0.3 . Prozorov and Kogan 2011 Fig. 4 (a) shows the fitting result of FeSe0.8Te0.2 as an representative.
Figure 4 (b) shows of FeSe1-xTex films. For films in nematic phase (=0, 0.1), was almost 1, whereas was 23 in non-nematic phase. The -linear behavior indicates that the superconducting gap has nodes or gap minima in nematic phase. Kasahara et al. 2014; Okada et al.. Conversely, in non-nematic phase probably denote the existence of nodeless gaps which are subjected to pair-breaking effects.Prozorov and Kogan 2011 On the other hand, no systematic changes in the dimensionless coefficient, , were observed as shown in Fig.4 (c). For cases such as -wave superconductor with line nodes or gapless superconductor, can be related to the superconducting gap or some other material properties.Prozorov and Kogan 2011 However, in the case of Fe(Se,Te) films, superconducting gap structure changes with increasing Te content. Thus, though we show for the clarity of fitting results, interpreting for all samples in terms of any universal standpoint is difficult, rather does not make sense.
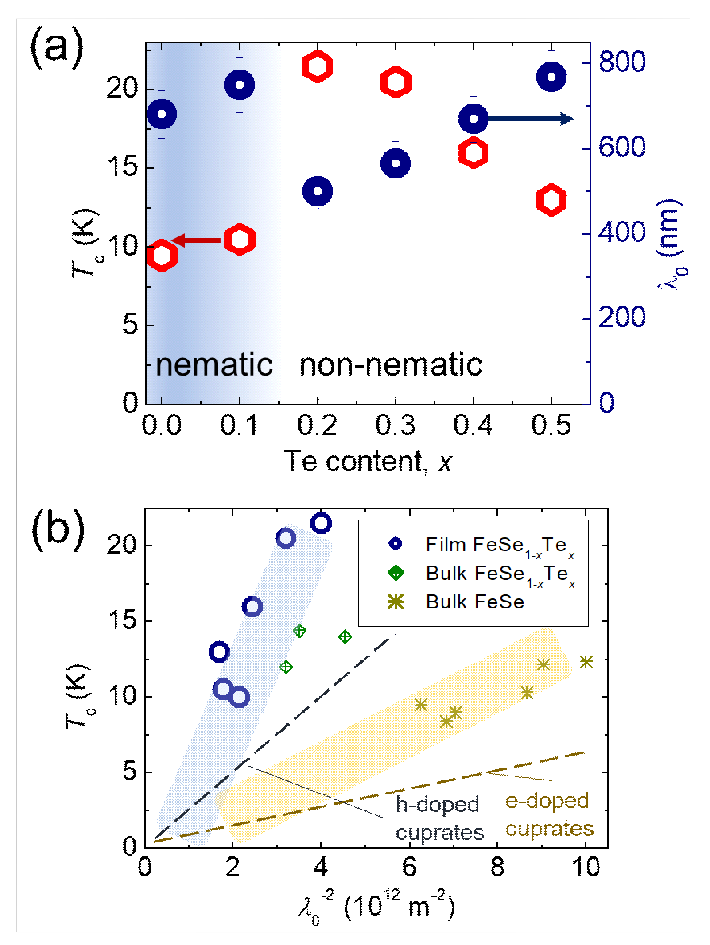
Figure 5 (a) shows Te content versus and . The negative correlation between and seems to exist irrespective of the presence or absence of nematic order. Subsequently, we plotted as a function of (Fig. 5 [b]), which is the so-called Uemura plot. exhibited an obvious positive correlation with , corresponding to . The observed proportionality between and is consistent with the correlation between and the carrier density of the Fe (Se,Te) and Fe(Se,S) films in their normal state.Nabeshima et al. 2020 These results indicate that either or carrier density plays a crucial role in determining the of Fe(Se,Te) films irrespective of the presence or absence of nematic order or its fluctuation. Of note, this kind of correlation between and was widely observed in other iron based superconductors, suggesting that superconductivity is induced by electronic correlation in these materials.Uemura et al. 1989; Bendele et al. 2010; Rodière et al. 2012
We remark that an abrupt change of with increasing disorder was reported in Ba(Fe,Rh)2As2, indicating that the change of superconducting gap structure from to .Ghigo et al. 2018 Also in Fe(Se,Te) films, when superconducting gap structure changed from nodal (nematic phase) to nodeless (non-nematic phase), changed abruptly. Thus, it can be said not only but also is sensitive to the change of the superconducting gap structure.
Compared with bulk samples, whereas the trend between and in the films was similar to that of bulk FeSe1-xTex (),Takahashi et al. 2011; Kim et al. 2010 a discrepancy with bulk FeSe was observed.Kasahara et al. 2014; Okada et al. Namely, the slope of the data of FeSe1-xTex () films and bulk FeSe1-xTex () was larger than that of bulk FeSe. Such differences in the Uemura plot have already been reported in cuprate superconductors, in which the data of hole-doped cuprates show the larger slopes than that of electron-doped cuprates (dotted lines in Fig. 5 [b]). Interestingly, whereas in the bulk FeSe,Ovchenkov et al. 2018 in the FeSe1-xTex films which showed the steeper slope,Sawada et al. 2016; Yoshikawa et al. 2019; Nabeshima et al. 2020 where is the hole density and is the electron density. The carrier density of the bulk as-grown FeSe1-xTex () is also estimated to be from measurements of the Hall coefficient.Liu et al. 2009; Sun et al. 2014 This correspondence between Fe(Se,Te) and the cuprates suggests the possibility that hole-doping increases the slope of the Uemura plot, even in multi-band superconductors.

Next, we evaluated the results of measurements of the dynamics of quasiparticles using the cavity perturbation technique. From the measurement of the and in each films placed in the cavity resonator, and were calculated using eq. (5) below .The real part of the complex conductivity, , was calculated using . When calculating , we subtracted residual surface resistance from , which was estimated from the linear extrapolation of to 0 K. Figure 6 (a) shows the value of corresponding to each film. With decreasing temperature, decreased in all tested films. The decrease of at low temperatures is consistent with the measurement of bulk FeSe and FeSe0.4Te0.6.Li et al. 2016; Takahashi et al. 2011
Assuming the two-fluid model and Drude-like single-carrier normal fluid, the quasiparticle scattering time, , can be expressed as follows:
| (9) |
where , which gives the dimensionless conductivity.Takahashi et al. 2011 Since temperature dependence of did not strongly depend on values of residual surface resistance, we used to compare intrinsic properties of Fe(Se,Te) films instead of . Here, we should be careful this single-carrier treatment because Fe(Se,Te) is a multi-band superconductor. Since FeSe has highly anisotropic gaps in both hole and electron pockets,Sprau et al. 2017 whereas FeSe1-xTex () has nodeless gaps in both pockets ,Hanaguri et al. 2010 the corresponding values of the electron pockets are expected to show similar temperature dependence to that of the hole pocket in FeSe1-xTex (). Hence, in eq. (9), we assumed that the temperature dependence of in both pockets could be captured using a single as a first approximation.
In all films, was observed to decrease at low temperatures (Fig. 6 [b]), indicating rapid suppression of the inelastic scattering of the electron, which was already established in bulk FeSe and FeSe0.4Te0.6.Okada et al.; Takahashi et al. 2011 In Fe(Se,Te) films, the values of at low temperatures were , which was similar value to bulk 122 compounds, Hashimoto et al. 2009; Torsello et al. 2019. This coincidence with 122 compounds suggests that our film samples were as clean as 122 materials. Furthermore, the slope of seems to be different among these films as shown in Fig. 6 (b). To obtain further insights, we performed curve fitting with , where , , and are positive constants. Figure 6 (c) shows of each film as a function of the maximum temperature used for the curve fitting, . The exponent, , showed differing behavior among these films when was decreased. Although remained constant around 1 in 0, 0.1 films below , tended to increase with decreasing in the other films, resulting in at low . Additionally, in bulk FeSe,Okada et al.; Li et al. 2016 which is in the nematic phase same as 0 0.1 films, was almost equal to 1. In bulk FeSe0.4Te0.6,Takahashi et al. 2011 which does not show nematic order, increased to over 2 with decreasing . As was pointed out by Li ,Li et al. 2016 the -linear behavior () in may be the consequence of gap structure with line nodes or deep gap minima.Li et al. 2016; Hirschfeld et al. 1993; Özcan et al. 2006 Conversely, the behavior observed for films could denote the nodeless superconducting gap, since an exponential decrease in is expected in nodeless superconductor.Quinlan et al. 1994; Hashimoto et al. 2009 Hence, considering the variation in in samples with different Te contents, we consider that the superconducting gap structure changes from those with line nodes or deep minima in nematic phase to those that are nodeless outside the nematic phase. The result is consistent with other measurement techniques claiming that bulk FeSe has line nodes or the deep minima, Sprau et al. 2017; Sun et al. 2017 whereas bulk FeSe1-xTex () shows nodeless superconducting gaps.Hanaguri et al. 2010
III.2 DFT calculations

To interpret our experimental results with respect to electronic band structure, we calculated the band dispersion of FeSe in both non-nematic and nematic phases. Figure 7 (a) and (b) show the Fermi surface of FeSe in the non-nematic and nematic phases calculated using eV. Figs. 7 (c) and (d) show band dispersion along the points depicted in Figs. 7 (a) and (b). In the nematic phase, the Fermi surface shows two-fold symmetry and the disappearance of one of the electron pockets at the point (Fig. 7 [b]). Although the size of Fermi surface was larger than that of experimentally observed one as it is widely accepted,Liu et al. 2015; Coldea and Watson 2018 the band dispersion agrees with the previous calculation and qualitatively captures the experimentally observed band structure.Long et al. 2020; Yi et al. 2019
The disappearance of the electron pocket in the nematic phase has been confirmed by several photoemission experiments.Rhodes et al. 2018; Yi et al. 2019; Rhodes et al. 2020 It has been previously reported that, when considering the absence of one electron pocket, the strongly anisotropic superconducting gap of FeSe can be reproduced via calculation of the superconducting gap equation.Rhodes et al. 2018 Based on these results, the observed nodal gap in FeSe1-xTex films with nematic order is probably caused by the disappearance or shrinkage of the electron pocket due to the nematic transition.
In Fig. 7 (e), the ground state energies of the non-nematic and nematic phases are shown. The nematic phase became energetically favorable compared with the non-nematic phase when increased to values greater than 3 eV. Furthermore, we compared the averaged DOS near the Fermi surface, which determines the carrier density. Figure 7 (f) shows DOS averaged over meV in the non-nematic and nematic phases, where is the Fermi level. The averaged DOS in the nematic phase is considerably lower than that in the non-nematic phase because of the disappearance of one electron pocket. The difference in averaged DOS between the non-nematic and nematic phases became larger with increasing . The decrease of DOS near the Fermi surface should result in an observed reduction of normal-carrier density in the nematic phase.Nabeshima et al. 2020 Superfluid density is also considered to be reduced in the nematic phase, resulting in a decrease of in the FeSe1-xTex films in nematic phase. Of note, nematic order disappears at different Te content in Fe(Se,Te) film on CaF2 substrate, LaAlO3 substrate and bulk crystal.Imai et al. 2017; Terao et al. 2019 This difference is possibly due to existence of compression strain in Fe(Se,Te) films, which results in the difference in electronic phase diagram of Fe(Se,Te) film and bulk crystal.

Figure 8 summarizes the above results and discussion. The deformation of the Fermi surface in the nematic phase induces strongly anisotropic superconducting gaps with nodes or gap minima. We are not able to determine whether the change in the gap structure takes place exactly at the nematic end point composition or not, since it is rather difficult to change Te content so finely to cover the nematic end point almost continuously. However, it can be mentioned safely that there is the gross correspondence between the presence/absence of the nematicity and the gap structure. In nematic phase, superfluid density is suppressed because of the reduction of DOS near the Fermi surface, resulting in a decrease of . Although an origin of the disappearance of nematic order by Te substitution is difficult to infer from our results alone, a recent ARPES study on our films revealed an upward shift of the orbital with increasing Te content because of the change of the chalcogen height.Nakayama et al. 2021 The approach of the orbital to Fermi energy reduces the relative contribution of the orbitals which is important for nematicity, resulting in instability of nematic order. Also, we should comment on the difference in the behaviors of the and other quantities such as DOS between Fe(Se,Te) films and Fe(Se,S) films, which do not show a drastic increase of when nematic order disappears.Nabeshima et al. 2018b In Fe(Se,S) films, our recent -SR study showed the appearance of the short range magnetic order at high S contents,Nabeshima et al. 2018b; Nabeshima et al. 2021 which is absent in Te substituted films. This may be one of the possible origins to explain the contrasting behavior of in Fe(Se,Te) and Fe(Se,S) films. Another important feature for S-substituted system is the weakening of the electronic correlation with increasing S content,Coldea et al. 2019; Kreisel et al. 2020 which is again, in contrast to Te substituted films.Nakajima et al. In summary, phase diagrams of the FeSe1-xTex () films can be explained by considering their band structure as a primary factor. This indicates that band deformation in the nematic phase rather than the existence of the nematic order itself or possible nematic fluctuations developing near the quantum critical point is the predominant factor on superconductivity. Topological nature established in highly Te substituted materials might be another important factor,Zhang et al. 2018 which is the subject of future works.
IV Conclusion
To conclude, we measured the complex conductivity of FeSe1-xTex () films below combining coplanar waveguide resonator and cavity perturbation techniques. In the presence of nematic order, the temperature dependences of superfluid density and quasiparticle scattering time were qualitatively distinct from those of films without nematic order. This difference indicates that nematic order strongly influences the formation of nodes or gap minima in its superconducting gap structure. Conversely, the proportionality between and was observed irrespective of the presence or absence of nematic order, suggesting that the amount of superfluid exerts a more direct influence on the of Fe(Se,Te) than the nematic order itself. Combining those results with the band dispersion calculated based on DFT, we propose that the change of the Fermi surface in the nematic phase is the main factor for changes of and the corresponding superconducting gap structure in Fe(Se,Te).
Acknowledgments
This work was supported by JSPS KAKENHI Grant Numbers JP20H05164, JP19K14661.
References
- Liu et al. (2015) X. Liu, L. Zhao, S. He, J. He, D. Liu, D. Mou, B. Shen, Y. Hu, J. Huang, and X. J. Zhou, Journal of Physics: Condensed Matter 27, 183201 (2015).
- Böhmer and Kreisel (2018) A. E. Böhmer and A. Kreisel, Journal of Physics: Condensed Matter 30, 023001 (2018).
- Kreisel et al. (2020) A. Kreisel, P. J. Hirschfeld, and B. M. Andersen, Symmetry 12, 1402 (2020).
- Hsu et al. (2008) F.-C. Hsu, J.-Y. Luo, K.-W. Yeh, T.-K. Chen, T.-W. Huang, P. M. Wu, Y.-C. Lee, Y.-L. Huang, Y.-Y. Chu, D.-C. Yan, and M.-K. Wu, Proceedings of the National Academy of Sciences 105, 14262 (2008).
- Burrard-Lucas et al. (2013) M. Burrard-Lucas, D. G. Free, S. J. Sedlmaier, J. D. Wright, S. J. Cassidy, Y. Hara, A. J. Corkett, T. Lancaster, P. J. Baker, S. J. Blundell, and S. J. Clarke, Nature Materials 12, 15 (2013).
- Shiogai et al. (2016) J. Shiogai, Y. Ito, T. Mitsuhashi, T. Nojima, and A. Tsukazaki, Nature Physics 12, 42 (2016).
- Shikama et al. (2020) N. Shikama, Y. Sakishita, F. Nabeshima, Y. Katayama, K. Ueno, and A. Maeda, Applied Physics Express 13, 083006 (2020).
- Wang et al. (2012) Q. Y. Wang, Z. Li, W. H. Zhang, Z. C. Zhang, J. S. Zhang, W. Li, H. Ding, Y. B. Ou, P. Deng, K. Chang, J. Wen, C. L. Song, K. He, J. F. Jia, S. H. Ji, Y. Y. Wang, L. L. Wang, X. Chen, X. C. Ma, and Q. K. Xue, Chinese Physics Letters 29, 037402 (2012).
- Huang and Hoffman (2017) D. Huang and J. E. Hoffman, Annual Review of Condensed Matter Physics 8, 311 (2017).
- Fernandes et al. (2014) R. M. Fernandes, A. V. Chubukov, and J. Schmalian, Nature Physics 10, 97 (2014).
- Glasbrenner et al. (2015) J. K. Glasbrenner, I. I. Mazin, H. O. Jeschke, P. J. Hirschfeld, R. M. Fernandes, and R. Valentí, Nature Physics 11, 953 (2015).
- Margadonna et al. (2009) S. Margadonna, Y. Takabayashi, Y. Ohishi, Y. Mizuguchi, Y. Takano, T. Kagayama, T. Nakagawa, M. Takata, and K. Prassides, Physical Review B 80, 064506 (2009).
- Fang et al. (2008) M. H. Fang, H. M. Pham, B. Qian, T. J. Liu, E. K. Vehstedt, Y. Liu, L. Spinu, and Z. Q. Mao, Physical Review B 78, 224503 (2008).
- Mizuguchi et al. (2009) Y. Mizuguchi, F. Tomioka, S. Tsuda, T. Yamaguchi, and Y. Takano, Journal of the Physical Society of Japan 78, 074712 (2009).
- Imai et al. (2015) Y. Imai, Y. Sawada, F. Nabeshima, and A. Maeda, Proceedings of the National Academy of Sciences 112, 1937 (2015).
- Nabeshima et al. (2018a) F. Nabeshima, M. Kawai, T. Ishikawa, N. Shikama, and A. Maeda, Japanese Journal of Applied Physics 57, 120314 (2018a).
- Watson et al. (2015) M. D. Watson, T. K. Kim, A. A. Haghighirad, S. F. Blake, N. R. Davies, M. Hoesch, T. Wolf, and A. I. Coldea, Physical Review B 92, 121108 (2015).
- Sato et al. (2018) Y. Sato, S. Kasahara, T. Taniguchi, X. Xing, Y. Kasahara, Y. Tokiwa, Y. Yamakawa, H. Kontani, T. Shibauchi, and Y. Matsuda, Proceedings of the National Academy of Sciences 115, 1227 (2018).
- Hanaguri et al. (2018) T. Hanaguri, K. Iwaya, Y. Kohsaka, T. Machida, T. Watashige, S. Kasahara, T. Shibauchi, and Y. Matsuda, Science Advances 4, eaar6419 (2018).
- Terao et al. (2019) K. Terao, T. Kashiwagi, T. Shizu, R. A. Klemm, and K. Kadowaki, Physical Review B 100, 224516 (2019).
- Hanaguri et al. (2010) T. Hanaguri, S. Niitaka, K. Kuroki, and H. Takagi, Science 328, 474 (2010).
- Kasahara et al. (2014) S. Kasahara, T. Watashige, T. Hanaguri, Y. Kohsaka, T. Yamashita, Y. Shimoyama, Y. Mizukami, R. Endo, H. Ikeda, K. Aoyama, T. Terashima, S. Uji, T. Wolf, H. Von Löhneysen, T. Shibauchi, and Y. Matsuda, Proceedings of the National Academy of Sciences 111, 16309 (2014).
- Sprau et al. (2017) P. O. Sprau, A. Kostin, A. Kreisel, A. E. Böhmer, V. Taufour, P. C. Canfield, S. Mukherjee, P. J. Hirschfeld, B. M. Andersen, and J. C. Davis, Science 357, 75 (2017).
- Imai et al. (2017) Y. Imai, Y. Sawada, F. Nabeshima, D. Asami, M. Kawai, and A. Maeda, Scientific Reports 7, 46653 (2017).
- Bellingeri et al. (2010) E. Bellingeri, I. Pallecchi, R. Buzio, A. Gerbi, D. Marrè, M. R. Cimberle, M. Tropeano, M. Putti, A. Palenzona, and C. Ferdeghini, Applied Physics Letters 96, 102512 (2010).
- Sylva et al. (2018) G. Sylva, E. Bellingeri, C. Ferdeghini, A. Martinelli, I. Pallecchi, L. Pellegrino, M. Putti, G. Ghigo, L. Gozzelino, D. Torsello, G. Grimaldi, A. Leo, A. Nigro, and V. Braccini, Superconductor Science and Technology 31, 054001 (2018).
- Nabeshima et al. (2018b) F. Nabeshima, T. Ishikawa, K.-i. Oyanagi, M. Kawai, and A. Maeda, Journal of the Physical Society of Japan 87, 073704 (2018b).
- Nabeshima et al. (2020) F. Nabeshima, T. Ishikawa, N. Shikama, and A. Maeda, Physical Review B 101, 184517 (2020).
- Nakayama et al. (2021) K. Nakayama, R. Tsubono, G. N. Phan, F. Nabeshima, N. Shikama, T. Ishikawa, Y. Sakishita, S. Ideta, K. Tanaka, A. Maeda, T. Takahashi, and T. Sato, Physical Review Research 3, L012007 (2021).
- Takahashi et al. (2011) H. Takahashi, Y. Imai, S. Komiya, I. Tsukada, and A. Maeda, Physical Review B 84, 132503 (2011).
- (31) T. Okada, Y. Imai, T. Urata, Y. Tanabe, K. Tanigaki, and A. Maeda, arXiv:1801.00262 .
- Mukasa et al. (2021) K. Mukasa, K. Matsuura, M. Qiu, M. Saito, Y. Sugimura, K. Ishida, M. Otani, Y. Onishi, Y. Mizukami, K. Hashimoto, J. Gouchi, R. Kumai, Y. Uwatoko, and T. Shibauchi, Nature Communications 12, 381 (2021).
- Imai et al. (2010a) Y. Imai, T. Akiike, M. Hanawa, I. Tsukada, A. Ichinose, A. Maeda, T. Hikage, T. Kawaguchi, and H. Ikuta, Applied Physics Express 3, 043102 (2010a).
- Imai et al. (2010b) Y. Imai, R. Tanaka, T. Akiike, M. Hanawa, I. Tsukada, and A. Maeda, Japanese Journal of Applied Physics 49, 023101 (2010b).
- Watanabe et al. (1994) K. Watanabe, K. Yoshida, T. Aoki, and S. Kohjiro, Japanese Journal of Applied Physics 33, 5708 (1994).
- Clem (2013) J. R. Clem, Journal of Applied Physics 113, 13910 (2013).
- Jacob et al. (2003) M. V. Jacob, J. Mazierska, D. Ledenyov, and J. Krupka, Journal of the European Ceramic Society 23, 2617 (2003).
- Klein et al. (1990) N. Klein, H. Chaloupka, G. Müller, S. Orbach, H. Piel, B. Roas, L. Schultz, U. Klein, and M. Peiniger, Journal of Applied Physics 67, 6940 (1990).
- Drabeck et al. (1990) L. Drabeck, K. Holczer, G. Grüner, J.-J. Chang, D. J. Scalapino, A. Inam, X. D. Wu, L. Nazar, and T. Venkatesan, Physical Review B 42, 10020 (1990).
- Peligrad et al. (1998) D.-N. Peligrad, B. Nebendahl, C. Kessler, M. Mehring, A. Dulčić, M. Požek, and D. Paar, Physical Review B 58, 11652 (1998).
- Barannik et al. (2014) A. A. Barannik, N. T. Cherpak, M. S. Kharchenko, Y. Wu, S. Luo, Y. He, and A. Porch, Low Temperature Physics 40, 492 (2014).
- Long et al. (2020) X. Long, S. Zhang, F. Wang, and Z. Liu, npj Quantum Materials 5, 50 (2020).
- Khasanov et al. (2009) R. Khasanov, M. Bendele, A. Amato, K. Conder, H. Keller, H. H. Klauss, H. Luetkens, and E. Pomjakushina, Physical Review Letters 104, 087004 (2009).
- Kim et al. (2010) H. Kim, C. Martin, R. T. Gordon, M. A. Tanatar, J. Hu, B. Qian, Z. Q. Mao, R. Hu, C. Petrovic, N. Salovich, R. Giannetta, and R. Prozorov, Physical Review B 81, 180503 (2010).
- Biswas et al. (2010) P. K. Biswas, G. Balakrishnan, D. M. Paul, C. V. Tomy, M. R. Lees, and A. D. Hillier, Physical Review B 81, 92510 (2010).
- Luetkens et al. (2008) H. Luetkens, H.-H. Klauss, R. Khasanov, A. Amato, R. Klingeler, I. Hellmann, N. Leps, A. Kondrat, C. Hess, A. Köhler, G. Behr, J. Werner, and B. Büchner, Physical Review Letters 101, 97009 (2008).
- Prozorov and Kogan (2011) R. Prozorov and V. G. Kogan, Reports on Progress in Physics 74, 124505 (2011).
- Uemura et al. (1989) Y. J. Uemura, G. M. Luke, B. J. Sternlieb, J. H. Brewer, J. F. Carolan, W. N. Hardy, R. Kadono, J. R. Kempton, R. F. Kiefl, S. R. Kreitzman, P. Mulhern, T. M. Riseman, D. L. Williams, B. X. Yang, S. Uchida, H. Takagi, J. Gopalakrishnan, A. W. Sleight, M. A. Subramanian, C. L. Chien, M. Z. Cieplak, G. Xiao, V. Y. Lee, B. W. Statt, C. E. Stronach, W. J. Kossler, and X. H. Yu, Physical Review Letters 62, 2317 (1989).
- Bendele et al. (2010) M. Bendele, S. Weyeneth, R. Puzniak, A. Maisuradze, E. Pomjakushina, K. Conder, V. Pomjakushin, H. Luetkens, S. Katrych, A. Wisniewski, R. Khasanov, and H. Keller, Physical Review B 81, 224520 (2010).
- Rodière et al. (2012) P. Rodière, T. Klein, L. Lemberger, K. Hasselbach, A. Demuer, J. Kačmarčik, Z. S. Wang, H. Q. Luo, X. Y. Lu, H. H. Wen, F. Gucmann, and C. Marcenat, Physical Review B 85, 214506 (2012).
- Ghigo et al. (2018) G. Ghigo, D. Torsello, G. A. Ummarino, L. Gozzelino, M. A. Tanatar, R. Prozorov, and P. C. Canfield, Physical Review Letters 121, 107001 (2018).
- Ovchenkov et al. (2018) Y. A. Ovchenkov, D. A. Chareev, V. A. Kulbachinskii, V. G. Kytin, S. V. Mishkov, D. E. Presnov, O. S. Volkova, and A. N. Vasiliev, arXiv (2018).
- Sawada et al. (2016) Y. Sawada, F. Nabeshima, Y. Imai, and A. Maeda, Journal of the Physical Society of Japan 85, 073703 (2016).
- Yoshikawa et al. (2019) N. Yoshikawa, M. Takayama, N. Shikama, T. Ishikawa, F. Nabeshima, A. Maeda, and R. Shimano, Physical Review B 100, 035110 (2019).
- Liu et al. (2009) T. J. Liu, X. Ke, B. Qian, J. Hu, D. Fobes, E. K. Vehstedt, H. Pham, J. H. Yang, M. H. Fang, L. Spinu, P. Schiffer, Y. Liu, and Z. Q. Mao, Physical Review B 80, 174509 (2009).
- Sun et al. (2014) Y. Sun, Y. Tsuchiya, T. Taen, T. Yamada, S. Pyon, A. Sugimoto, T. Ekino, Z. Shi, and T. Tamegai, Scientific Reports 4, 4585 (2014).
- Li et al. (2016) M. Li, N. R. Lee-Hone, S. Chi, R. Liang, W. N. Hardy, D. A. Bonn, E. Girt, and D. M. Broun, New Journal of Physics 18, 1 (2016).
- Hashimoto et al. (2009) K. Hashimoto, T. Shibauchi, S. Kasahara, K. Ikada, S. Tonegawa, T. Kato, R. Okazaki, C. J. Van Der Beek, M. Konczykowski, H. Takeya, K. Hirata, T. Terashima, and Y. Matsuda, Physical Review Letters 102, 207001 (2009).
- Torsello et al. (2019) D. Torsello, G. A. Ummarino, L. Gozzelino, T. Tamegai, and G. Ghigo, Physical Review B 99, 134518 (2019).
- Hirschfeld et al. (1993) P. J. Hirschfeld, W. O. Putikka, and D. J. Scalapino, Physical Review Letters 71, 3705 (1993).
- Özcan et al. (2006) S. Özcan, P. J. Turner, J. R. Waldram, R. J. Drost, P. H. Kes, and D. M. Broun, Physical Review B 73, 64506 (2006).
- Quinlan et al. (1994) S. M. Quinlan, D. J. Scalapino, and N. Bulut, Physical Review B 49, 1470 (1994).
- Sun et al. (2017) Y. Sun, A. Park, S. Pyon, T. Tamegai, and H. Kitamura, Physical Review B 96, 140505 (2017).
- Coldea and Watson (2018) A. I. Coldea and M. D. Watson, Annual Review of Condensed Matter Physics 9, 125 (2018).
- Yi et al. (2019) M. Yi, H. Pfau, Y. Zhang, Y. He, H. Wu, T. Chen, Z. R. Ye, M. Hashimoto, R. Yu, Q. Si, D.-H. Lee, P. Dai, Z.-X. Shen, D. H. Lu, and R. J. Birgeneau, Physical Review X 9, 041049 (2019).
- Rhodes et al. (2018) L. C. Rhodes, M. D. Watson, A. A. Haghighirad, D. V. Evtushinsky, M. Eschrig, and T. K. Kim, Physical Review B 98, 180503 (2018).
- Rhodes et al. (2020) L. C. Rhodes, M. D. Watson, A. A. Haghighirad, D. V. Evtushinsky, and T. K. Kim, Physical Review B 101, 235128 (2020).
- Nabeshima et al. (2021) F. Nabeshima, Y. Kawai, N. Shikama, Y. Sakishita, A. Suter, T. Prokscha, S. E. Park, S. Komiya, A. Ichinose, T. Adachi, and A. Maeda, Physical Review B 103, 184504 (2021).
- Coldea et al. (2019) A. I. Coldea, S. F. Blake, S. Kasahara, A. A. Haghighirad, M. D. Watson, W. Knafo, E. S. Choi, A. McCollam, P. Reiss, T. Yamashita, M. Bruma, S. C. Speller, Y. Matsuda, T. Wolf, T. Shibauchi, and A. J. Schofield, npj Quantum Materials 4, 2 (2019).
- (70) M. Nakajima, K. Yanase, M. Kawai, D. Asami, T. Ishikawa, F. Nabeshima, Y. Imai, A. Maeda, and S. Tajima, arXiv:2103.13659.
- Zhang et al. (2018) P. Zhang, K. Yaji, T. Hashimoto, Y. Ota, T. Kondo, K. Okazaki, Z. Wang, J. Wen, G. D. Gu, H. Ding, and S. Shin, Science 360, 182 (2018).