The Fermi GBM Gamma-Ray Burst Spectral Catalog: 10 Years of Data
Abstract
We present the systematic spectral analyses of gamma-ray bursts (GRBs) detected by the Fermi Gamma-Ray Burst Monitor (GBM) during its first ten years of operation. This catalog contains two types of spectra; time-integrated spectral fits and spectral fits at the brightest time bin, from 2297 GRBs, resulting in a compendium of over 18000 spectra. The four different spectral models used for fitting the spectra were selected based on their empirical importance to the shape of many GRBs. We describe in detail our procedure and criteria for the analyses, and present the bulk results in the form of parameter distributions both in the observer frame and in the GRB rest frame. 941 GRBs from the first four years have been re-fitted using the same methodology as that of the 1356 GRBs in years five through ten. The data files containing the complete results are available from the High-Energy Astrophysics Science Archive Research Center (HEASARC).
Keywords:
gamma rays: bursts — methods: data analysisI Introduction
Gamma-ray bursts (GRBs) have been studied extensively since their discovery in the 1960s, but many aspects of their prompt emission remain a mystery. The bimodal distribution of GRB durations admits a natural division between short and long classes of bursts, with a dividing line at = 2 s (Kouveliotou et al. 1993), where is the time between the 5% and 95% values of the total fluence. The prompt gamma-ray episode is known to be followed by radiation at all wavelengths, in the manner of an expanding fireball explosion, fading in time and energy. The observed flux originates in a relativistic jet, which is inferred by energetic and compactness constraints (Cavallo & Rees 1978), as well as observations of achromatic jet breaks in the temporal power-law decay observed in some afterglow light curves. However, the composition of the jet is yet unknown and could be baryon or magnetic field dominated (Veres et al. 2013; Burgess et al. 2014). The mechanism that accelerates the emitting particles (usually assumed to be electrons and positrons) to their inferred power-law energy distributions is also not well understood. Finally, the process that can produce the enormous observed fluxes of gamma-rays extremely efficiently has yet to be determined.
As we are now entering the multi-messenger era of astronomy, new and exciting observations are just beginning to yield results. The nearly simultaneous observation of a short GRB with the gravitational signature of a coalescing binary neutron star system by the Laser Interferometer Gravitational-wave Observatory (LIGO)/Virgo gravitational-wave detectors (Abbott et al. 2017b), the Fermi Gamma-Ray Burst Monitor (GBM) (Abbott et al. 2017a; Goldstein et al. 2017; Ubertini et al. 2019) and INTEGRAL (Savchenko et al. 2017) on August 17, 2017, has confirmed that at least some short bursts originate in such mergers of compact objects. This observation kicked off one of the most extensive follow-up campaigns in astronomy, covering nearly all wavelengths. GRB 170817A was unusual in many respects, not the least of which that it was extraordinarily under-luminous. Comparison with the spectral properties of the ensemble of short bursts, though, shows the otherwise ordinary nature of this extraordinary burst (Goldstein et al. 2017). Other than being extremely under-luminous, the spectral properties of GRB 170817A fall nearly in the median of the observed flux, fluence, and duration distributions. The distributions used in this comparison were drawn from the data set that comprises this Catalog, showing just one use of these data. The numerous discoveries still to come can only be judged relative to the expected properties of their cohorts. It is for this purpose that we have assembled these data; to serve as a benchmark for future discoveries in the studies of GRBs.
In 10 years, GBM has triggered on 2356 GRBs (von Kienlin et al. 2020), of which, 2297 are useful for spectroscopy and are included in this Catalog. All of the data from these bursts are available online at the HEASARC 11 1 https://heasarc.gsfc.nasa.gov/W3Browse/fermi/fermigbrst.html website. As with the 2-year (Goldstein et al. 2012) and 4-year (Gruber et al. 2014) Catalogs, the analyses presented herein are comprised of two spectra for each burst: a ‘fluence’ spectrum that represents the entire duration of emission and a ‘peak flux’ spectrum that depicts the brightest portion of each burst, on a fixed timescale of 1.024 s for long GRBs and 64 ms for short GRBs. The selection of fluence time bins for each of these two classes is made by including every (energy-integrated) time bin that has flux that is at least 3.5 sigma in excess of the background model for that bin. We fit 4 spectral functions to each spectrum: power law (PLAW), exponentially cut-off power law (COMP), the Band GRB function (Band et al. 1993) and smoothly-broken power law (SBPL), as described in the previous Catalogs. These form a set of empirical spectral functions that have 2, 3, 4, and 5 free parameters, respectively. The best fit of these should not by any means be considered the true spectral form of the incident photons, because they are not motivated by any theoretical guidance; but rather they serve as a model-independent basis for inter-comparison between different bursts, even those observed by different instruments. For each spectral fit, we assign a rating (GOOD), based upon the uncertainties of the fitted functional parameters. In this Catalog, we introduce two-sided uncertainties for each fitted parameter, where these could be determined. Thus, assignment of a spectral fit to the GOOD category requires not-to-be-exceeded limits on both tails of the error distribution (Sec. III.1). Finally, based upon goodness of fit criteria, we determine which function provided the BEST fit to the spectral data.
II Analysis Method
II.1 Instrument and Data
Fermi GBM consists of 14 detector modules: 12 Sodium Iodide (NaI) detectors, covering the energies 8 - 1000 keV, and two Bismuth Germanate (BGO) detectors, covering 200 keV to 40 MeV (Meegan et al. 2009). The NaI detectors are distributed in four clusters of three detectors on each corner of the spacecraft and oriented in such a way that enables the prime GRB scientific objectives of all-sky coverage and burst localization. The two BGO detectors are positioned on opposite sides of the spacecraft, also for full-sky coverage. The spectroscopy data products each have 128 channels of energy resolution, with CSPEC data being accumulated at fixed time intervals, and time-tagged event (TTE) data recording the time and energy of each count. The TTE data type is the most flexible, since it can be binned arbitrarily in time, and comprises the majority of data used for the analyses in this work. Since November 27, 2012, GBM has been operating in a mode in which TTE data are collected all the time. Previously, TTE data collection was initiated by a trigger, which occurs when the GBM flight software detects a significant rise above a preset threshold in the counting rates in two or more detectors in one of several energy and time ranges. When operating in this mode, TTE pre-burst data, which is being constantly accumulated in a ring buffer, is frozen and scheduled for transmission to accompany the triggered TTE data. Before the transition to continuous TTE data collection, if the burst was so bright as to fill up the finite-sized TTE ring buffer or the pre-burst TTE were somehow corrupted, it would be difficult to reconstruct the entire time history and in such cases, CSPEC or CTIME data could be used.
II.2 Data Selection
Data selection is identical to that as described in Gruber et al. 2014. In brief, up to three NaI detectors with observing angles to the source less than are selected, along with the BGO detector that has the smallest observing angle of the burst. For each of these, standard energy ranges that avoid unmodeled effects, such as an electronic roll-off at low energies and high-energy overflow bins are selected. Each data set is binned according to whether the burst is long (1.024 s binning) or short (0.064 s binning), where the boundary between the long or short classes is defined by s. Next, a background model (polynomial in time) is chosen to fit regions of the light curve that bracket the emission interval. Although the individual energy channels are fitted separately, the background model shares the polynomial order (up to 4) chosen by the analyst to best represent the general trend of the non-burst portions of the data. The resulting model is then interpolated over the entire light curve, including the region(s) where the burst is active. The background uncertainty in each energy channel of each time bin is typically dominated by the uncertainties of the fitted temporal model parameters, except at the highest energies, where Poisson errors dominate.
In order to autonomously determine the time bins that comprise the burst source selections, we combine the individual NaI detector rate histories by summing over the selected detectors. This produces a single rate history (count s-1) for each burst, where the source rates are added coherently and the background incoherently, thus improving the source statistics. We do the same with the interpolated background rate histories. We convert each of these into integrated light curves by multiplying each energy channel by the energy bin width and summing over the energy bins. The count rates are converted into counts by multiplying each time bin by the bin width. The signal-to-noise ratio (S/N) for each time bin is calculated by subtracting the background counts from the total counts, and dividing by the square root of the background counts. The source region is determined by those time bins that have a S/N in excess of 3.5 , relative to the background model. The sum of the rate histories over these (possibly discrete) time bins defines the spectrum for the ‘fluence’ (F) sample. The time bin with the highest S/N selects the spectrum for the ‘peak flux’ (P) sample. The source selections are propagated to each detector’s light curve, including that of the BGOs.
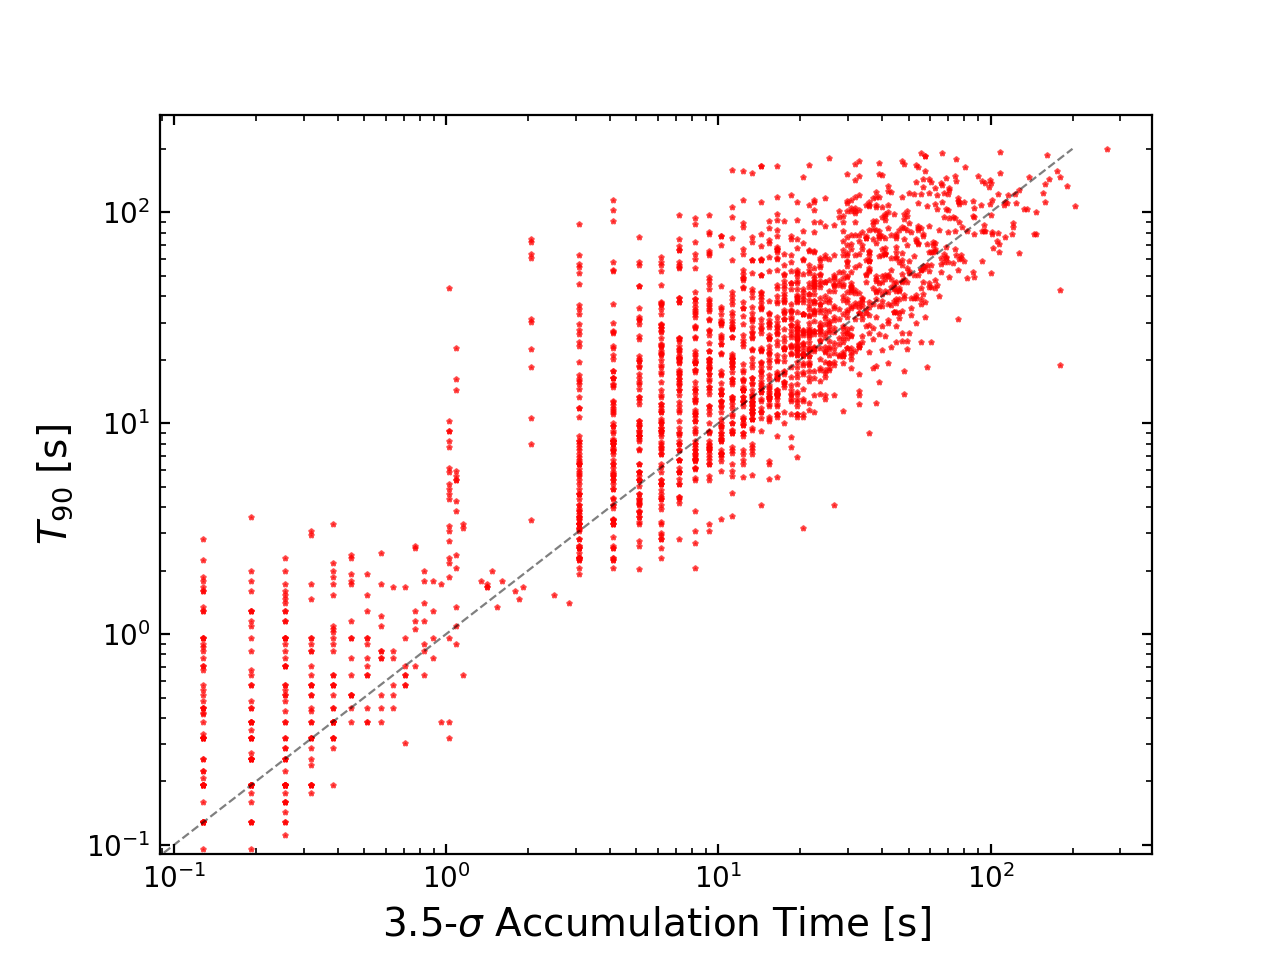
The sum of the duration of the selected time bins is defined as the ‘accumulation time’, which serves as a proxy for the duration of the burst, as seen in panel (a) of Figure 1. Notably, this can be modeled as the sum of two Gaussians, much like the more familiar distribution (Koshut et al. 1996). Panel (b) shows the accumulation times for the short GRBs ( s, Kouveliotou et al. 1993) as a separate histogram. Interestingly, there is very little overlap of the short GRB distribution (in grey) into the accumulation time distribution of long GRBs. Finally, panel (c) shows that there are substantial differences between and the accumulation time. One difference is that of the burst fluence is omitted in the , by design, resulting in a considerable number of bursts that fall below the line of equality (dashed). The other main difference is that the accumulation time omits quiescent portions of the light curve, so many bursts fall above the equality line (accumulation time shorter than ).
The data is then joint fit with RMfit22 2 https://fermi.gsfc.nasa.gov/ssc/data/analysis/rmfit/ (currently at version 4.3.2, available at the Fermi Science Support Center), using a set of standard model functions (section II.4). For a fit statistic, we have chosen a variant of the Cash-statistic likelihood (Cash 1979), called C-Stat in RMfit and pstat in Xspec (Arnaud et al. 2011). C-Stat assumes the background model uncertainty to be negligible, which is a good approximation for the propagated uncertainties of a background model that is interpolated to a time interval much shorter than the intervals the model is based upon. Since the background uncertainties would ordinarily be combined with signal uncertainties using quadratic sum, the signal always dominates the total uncertainties. One can account for the Gaussian uncertainties in the background correctly by using the pgstat statistic in Xspec. This statistic was not provided by RMfit at the time of the publication of the most recent GBM Spectroscopy Catalog (Gruber et al. 2014).
II.3 Detector Response Matrices
Performing spectral analysis successfully is highly dependent upon the correct modeling of the
detector response matrices. The response matrices in turn are dependent upon the source
position, relative to each detector normal. Since the Fermi spacecraft is in constant motion
while in sky survey mode (the default mode), the detector response is a function of time.
GBM uses OGIP33
3
The FITS standard is maintained by the NASA HEASARC Office of
Guest Investigators Program FITS Working Group:
https://heasarc.gsfc.nasa.gov/docs/heasarc/ofwg/ofwg_intro.html
standard response
Flexible Image Transport System (FITS) files for the response matrices. This standard
allows for multiple RESPONSE extensions in a single file, to represent a time sequence.
For long spectral accumulations ( s), each matrix is weighted by the fraction of
the total counts for the corresponding period of time covered by the matrix and then
the weighted matrices are summed together.
The GBM response generator creates a new response matrix for every 2 degrees of slew.
These files are distinguished from single-matrix files by the ‘.rsp2’ filename extension.
The standard GBM burst data product, however, has only contained the single-matrix files
(with extension ‘.rsp’) by default since launch. Only the bursts longer than about 20 s
require rsp2 files, so these were generated on an as-needed basis. Several types of errors
were found while this Catalog was being generated. The first and most important of these
was that the rsp2 files were not systematically updated whenever a burst localization was
changed. The improvement in location accuracy could have come from other spacecrafts, days
after the trigger, for example. Or else,
the GBM team may decide to refine the location analysis after discussion of the burst trigger.
Given the inherent latency in obtaining a ‘final’ location, it was possible to
create an initial set of response
files using a localization that was superseded by a refined analysis. We have gone through
the entire set of bursts in this Catalog to fix this and other errors that had manifested.
Where the new matrix files had significant differences, we have redone the spectral analyses. The updated response files are available at the HEASARC website.
II.4 Models
For consistency between the several previous editions of GBM (and BATSE) Spectroscopy Catalogs, we chose four spectral models to fit the spectra of GRBs in our sample. All models are formulated in units of photon flux with energy (E) in keV and multiplied by a normalization constant A (photon s-1 cm-2 keV-1). Both COMP and BAND are parameterized such that the characteristic energy is given as the energy of the peak in the differential spectrum (). The pivot energy () normalizes the model to the energy range under consideration and helps reduce cross-correlation of other parameters. In all cases, is held fixed at 100 keV.
- •
PLAW: A single power-law, with two free parameters; normalization () and power law index ()
(1) - •
COMP: An exponentially-attenuated power law (‘comptonized’), with normalization (), low-energy power-law index () and characteristic energy ()
(2) - •
BAND: The Band GRB function, with normalization (), low-energy power-law index (), high-energy power-law index () and characteristic energy ()
(3) - •
SBPL: A smoothly broken power law, with normalization (), low-energy power-law index (), high-energy power-law index (), a characteristic break energy () and the break scale (), in decades of energy. As in Gruber et al. 2014, we keep the value of fixed at 0.3.
(4) where:
II.5 Probability Density Histogram
The spectral parameter distributions presented in the following section are histogrammed probability density plots, that were created via Monte Carlo sampling from the probability density function (PDF) of each quantity from each GRB (Goldstein et al. 2016). In brief, for a quantity of interest from a total of N GRBs in our sample, we first determine the edges of our bins, then we take a sample from each of the N PDFs and place them in corresponding bins. This is done for a number of iterations (typically 1000), randomly sampling from the PDFs and recording the counts in each bin for each iteration. This process creates a PDF for each bin of the histogram, from which we choose the median as the centroid of the bin and the error bars represent the 68% credible interval centered at the median. This Monte Carlo sampling method allows us to represent the underlying distribution more accurately, especially at the extremes of the distribution where a combination of several low probability densities can produce a finite probability density in the histogram.


III Parameter Distributions
Distributions of the best-fit spectral parameters allow us to place each new burst in relation to the ensemble of all bursts. Comparisons may be made between the F and P spectral fits in general, where differences in the mean and FWHM values of the fitted parameters offer clues as to whether the peak in a burst is somehow special. Additionally, differences between spectral parameter distributions of long and short GRBs may reveal something about the differences between merger versus collapsar jet environments. Many such analyses have been made in the previous Catalogs in this series and will not be discussed here. First, we will establish that this new iteration of the Catalog is not vastly different from the previous ones. Differences between the distributions of long and short bursts will be examined next. Finally, we will cover cases where there are differences that are derived from changes in our analysis protocol, such as the move to capture two-tailed uncertainties in the fitted parameters.
III.1 The GOOD and BEST Sample
We classify fitted burst models as GOOD if the parameter error of all model parameters are within
certain limits; we have chosen our threshold such that 70% of the parameter uncertainties across the board
satisfy the cut-off. Figures 2, 3 and 4,
depicting the cumulative distribution function (CDF) for errors of , and respectively
were used as motivation for this approach. Note that for many GRBs there can be several models which qualify as
GOOD.
We simultaneously require the following criteria to be satisfied in order for a model to be considered GOOD:
- •
Amplitude: Positive relative error 0.44 & Negative relative error 0.83
- •
Low-energy Index: Positive error 0.37 & Negative error 0.51
- •
High-energy Index: Positive error 1.0 & Negative error 0.53
- •
: Positive relative error 0.35 & Negative relative error 0.43
- •
: Positive relative error 1.0 & Negative relative error 1.5
We also identify a BEST model in order to determine which of the GOOD models is the best representation of the burst emission. In addition to the aforesaid constraints for the GOOD sample, we compare the differences in C-Stat (-Stat) per degree of freedom between the various models. The idea of the BEST parameter sample is to obtain the best estimate of the observed properties of a GRB. Besides the necessity of having constrained parameters, already required for the GOOD sample, we compare the difference in C-Stat (C-Stat) per degree of freedom between the various models in order to assess if a statistically more complex model, i.e., a model with more free fit parameters is preferred over a simpler model. If the C-Stat observed in the data exceeds a critical value (C-Statcrit), then the statistically more complex model is preferred. Following the analysis done in Gruber et al. 2014, we use C-Statcrit = 8.58 for PLAW versus COMP and C-Statcrit = 11.83 for COMP versus BAND. Since BAND and SBPL have the same number of degrees of freedom, the model with the lower C-Stat was preferred among them. Applying these criteria, the number of bursts that classify as GOOD and BEST for each model can be seen in Table 1, alongside a comparison with the previous spectral catalog (Gruber et al. 2014).


=-0.75in
| PLAW | COMP | BAND | SBPL | |
| Fluence spectra | ||||
| This Catalog GOOD | 2295 (99.9%) | 1616 (70.3%) | 666 (29.0%) | 1013 (44.0%) |
| Gruber et al. 2014 GOOD | 941 (99.7%) | 684 (72.5%) | 342 (36.2%) | 392 (41.5%) |
| This Catalog BEST | 693 (30.2%) | 1311 (57.0%) | 209 (9.0%) | 82 (3.5%) |
| Gruber et al. 2014 BEST | 282 (29.9%) | 516 (54.7%) | 81 (8.6%) | 62 (6.6%) |
| Peak flux spectra | ||||
| This Catalog GOOD | 2287 (99.5%) | 1047 (45.5%) | 328 (14.2%) | 522 (22.6%) |
| Gruber et al. 2014 GOOD | 932 (98.7%) | 430 (45.6%) | 153 (16.2%) | 196 (20.8%) |
| This Catalog BEST | 1248 (54.3%) | 931 (40.5%) | 79 (3.4%) | 29 (1.2%) |
| Gruber et al. 2014BEST | 514 (54.4%)) | 375 (39.7%) | 25 (2.6%) | 18 (1.9%) |

III.2 Time-integrated (F) Spectral Fits
The time-integrated spectral distributions depict the overall emission properties and do not
take into account any spectral evolution.
Figure 5 shows the /Fluence ratio (in units of area) (Goldstein et al. 2010)
distribution for all COMP GOOD F spectral fits,
with short GRBs highlighted in grey. This ‘energy ratio’ plot further highlights the robustness
of bimodality observed in GRB duration.
The low-energy indices or (from
COMP, BAND or SBPL, as appropriate), as shown in Figure 6a, are distributed
about a -1.1 power law typical of most GRBs. About 17% of the BEST low-energy indices
(Figure 6b) have
, violating the synchrotron “line-of-death” (Preece et al. 1998), while
82% of the indices have , violating the synchrotron slow-cooling
limit (Cohen et al. 1997). The distribution of high-energy indices or (from
BAND or SBPL) in Figure 6c, peak at a slope of about -2.1 and have a long
tail toward steeper indices. The very steep high-energy indices indicate that the spectrum of
these
GRBs closely mimic a COMP model, which is equivalent to a BAND function with a high-energy
index of . Figure 7 shows the difference between the time-integrated
low- and high-energy spectral indices, . This quantity is useful
as the synchrotron shock model (SSM) (Baring 2006) makes predictions of this value in a
number of cases and the power-law index, p, of the electron distribution can be inferred from
.
The GOOD and BEST distributions (shown in
Figure 6e, 6f)
generally peak around 150-200 keV and cover just over two orders of magnitude, which is
consistent with previous findings (Goldstein et al. 2012; Gruber et al. 2014). As discussed
in Kaneko et al. 2006, although the SBPL is parameterized with , the can be
derived from the functional form. We have calculated the for all bursts with a
low-energy index shallower than -2 and a high-energy index steeper than -2. The value of
can strongly affect the measurement of the low-energy index of the spectrum, as
shown in Figure 8. A general trend appears to show that spectra with
smaller values also have smaller values of the low-energy power-law index.
Asymmetric uncertainties for the SBPL have not been calculated for this catalog.
=-0.75in
| Model | Low-energy | High-energy | Photon Flux | Energy Flux | ||
|---|---|---|---|---|---|---|
| Index | Index | (keV) | (keV) | (photons s-1cm-2) | (erg s-1cm-2) | |
| Fluence spectra | ||||||
| PLAW | … | … | … | |||
| COMP | … | … | ||||
| BAND | ||||||
| SBPL | ||||||
| BEST | ||||||
| Peak flux spectra | ||||||
| PLAW | … | … | … | |||
| COMP | … | … | ||||
| BAND | ||||||
| SBPL | ||||||
| BEST |


III.3 Peak Flux (P) Spectral Fits
The peak flux spectrum depicts the brightest portion of each burst, on a fixed
timescale of 1.024 s for long GRBs and 64 ms for short GRBs. The time bin with the
highest significance is chosen for the ‘peak flux’ (P) sample. The
low-energy indices, shown in Figure 9a, have a median value of
about -1.3 and show a bimodal distribution. This is due to the fact that most GRBs
of the P sample are best fit by the PLAW function, as less photon fluence
accumulation leads to a decrease in S/N. About 22% of the BEST low-energy indices
(Figure 9b)
have , violating the synchrotron “line-of-death” , while
70% of the indices have , violating the synchrotron
cooling limit; both of these are significantly larger percentages than those from
the F spectra. The high-energy indices in Figure 9c
peak at about -2.3 and again have a long tail towards steeper indices. The lower
number of GOOD spectral fits compared to the F spectra is likely due to
the poorer statistics resulting from shorter integration times. Shown in
Figure 10 is the distribution for the P
spectra, which suffers a deficit in values compared to the F spectral fits largely
due to the inability of the data to sufficiently constrain the high-energy
power-law index.
In Figure 9e, 9f, we show the distribution for the P spectra. The distribution for the BEST sample peaks at around 250 keV and covers just over two orders of magnitude, which is consistent with previous findings (Goldstein et al. 2012; Gruber et al. 2014). It should be noted that the data over the short timescales in the P spectra do not often favor either the BAND or the SBPL model, resulting in large errors on parameters.
=-0.75in
| Data set | Low-energy | High-energy | Photon Flux | Energy Flux | ||
|---|---|---|---|---|---|---|
| Index | Index | (keV) | (keV) | (photons s-1cm-2) | (erg s-1cm-2) | |
| Fluence spectra | ||||||
| This Catalog BEST | ||||||
| Gruber et al. 2014 | ||||||
| Goldstein et al. 2012 | ||||||
| Kaneko et al. 2006 | … | … | ||||
| Peak flux spectra | ||||||
| This Catalog BEST | ||||||
| Gruber et al. 2014 | ||||||
| Goldstein et al. 2012 | ||||||
| Nava et al. 2011 | … | … | ||||
| Kaneko et al. 2006 | … | … |
Note: a Low-energy index of the peak-flux spectra with curved function only.


III.4 Long vs. Short GRBs
Over the ten years of operations covered in this Catalog, GBM triggered on 395 short GRBs, of the total number of bursts. The idea that short GRBs and long GRBs represent two distinct populations was bolstered by the comparison between their hardness ratios (Kouveliotou et al. 1993; Bhat et al. 2016). Short GRBs are significantly harder, as determined by the ratio of the counts in two broad energy bands (25 – 100, 100 – 300 keV) (Kouveliotou et al. 1993). Spectral fit parameters should reflect this dichotomy in hardness in two ways. First, the median values for should be significantly different, with the higher value being associated with short bursts. Secondly, a low-energy power law index that is higher than another (e.g. vs.) is said to be harder, as a positive uptick requires an increase in higher-energy photons, all other things being equal. Here, we can verify both of these by comparing the median fitted spectral parameters between short and long bursts in Table 4. This is in agreement with results from early on in the mission (Nava et al. 2011).
The hard nature of short bursts is even more dramatic when considering the distributions of the fitted parameters. Figures 12 and 13 compare between long and short GRBs for the fluence and peak-flux spectral fits respectively. In order to improve the sample size of the short burst population, we present fits from the total ensemble of bursts; one for each of the three models that have an energy-related parameter (COMP, BAND and SBPL). Similarly, Figures 14 and 15 compare the low-energy indices between long and short GRBs for all four models (including PLAW) from the fluence and peak-flux spectral fits respectively. Clearly, it is highly improbable that the long and short distributions are the same for the and low-energy index distributions. Figures 16 and 17 compare the high-energy indices between long and short GRBs for BAND and SBPL from the fluence and peak-flux spectral fits respectively. Although the presence of a high-energy power-law component is a clear signal of ‘hardness’, the fitted index itself seems to be invariant between the two classes of GRBs.
=-0.75in
| Long GRBs | Short GRBs | |||||
| Model | Low-energy Index | High-energy Index | (keV) | Low-energy Index | High-energy Index | (keV) |
| Fluence Spectra | ||||||
| PLAW | … | … | … | … | ||
| COMP | … | … | ||||
| BAND | ||||||
| SBPL | ||||||
| Peak Flux Spectra | ||||||
| PLAW | … | … | … | … | ||
| COMP | … | … | ||||
| BAND | ||||||
| SBPL | ||||||


IV Rest-Frame Properties
Calculating the rest-frame energetics is key to understanding the central engine and emission physics of a GRB. Using 10 years of GBM data, and the known redshift for 130 GRBs, we provide one of the largest samples of GRB energetics to date.
GBM is found to detect more long GRBs than short, which is reflected in our redshift sample with 13 short GRBs and 122 long GRBs. The distribution of the redshift for both short GRBs (black) and long GRBs (blue) are shown in Figure 18. GRB 170817A, which was determined to be in coincidence with the neutron star merger event (Abbott et al. 2017a), GW170817, is found to have a much lower redshift () than the rest of the sample.
IV.1 Rest-frame Properties using the BAND Spectral model
We use the BAND model as discussed in Sec. II.4, which provides the peak energy (), amplitude, and the indices of and as well as the measured fluence in the Fermi-GBM bandpass (10-1000 keV). For the GRBs with known redshift (), we calculated the k-corrected, isotropic-equivalent gamma-ray energy of the GRB in the co-moving bolometric bandpass of 1 keV to 10 MeV and the estimated uncertainty on the prompt energy release.
In order to calculate the k-correction, we use the fluence in the Fermi GBM bandpass and expand the spectral model given in (Band et al. 1993) to the co-moving bolometric bandpass of 1 keV to 10 MeV (Bloom et al. 2001). The k-value is defined as
| (5) |
where is the fluence for a range of given energies, keV, MeV, keV, keV. The isotropic energy can then be calculated by
| (6) |
with being the luminosity distance and being the observed fluence. The distribution of the is presented in Figure 19 and shows that the long GRBs have centered around erg. The limited number of short GRBs with redshift does not provide much insight into their distribution but the outlier in this plot is GRB 170817A which was found to have a lower redshift than the other GRBs.
The peak rest frame energy () is determined by , where is the observed peak energy from the F spectra. The distribution of is shown in Figure 19 to span from 10 keV to 3000 keV. Neither short nor long GRBs appear to exhibit a preference for a particular rest frame but there does appear to be a separate group of GRBs with MeV.
Using the spectra of the brightest time bin, we can determine the isotropic luminosity for the GRBs with redshift using
| (7) |
The distribution of , shown in Figure 19, shows that neither the short nor the long GRBs have preference for . However, GRB 170817A has a few order of magnitudes lower than the rest. The , , and with their uncertainties are shown in Table 5.
IV.2 Rest-frame Properties using the COMP Spectral model
The COMP spectral model (Sec. II.4) is also used to determine the , and in a similar way to Sec. IV.1 and using the spectral shape from Eq. 2. The values and uncertainties for , and are presented in Table 5.
The distribution of the in Figure 20, shows that the short and long GRBs do not have a preference for the . However, GRB 170817A is again at the low end of the distribution. The distribution of using the COMP model spans from 10 kev to 3000 keV with a group of GRBs with MeV, similar to the BAND model. The distribution for the COMP model also shows no preference for a value and GRB 170817A has a lower value than the rest of the GRBs.
V Comparison to Previous Analysis
The number of GRBs with GOOD spectral fits presented in this catalog is similar to the total contained in the BATSE 5B spectroscopy catalog (Goldstein et al. 2013). Additionally, the methodology and instrument characteristics are similar, therefore these two data sets can be easily compared.
Of particular interest for determining the emission mechanism that converts the bulk relativistic outflow into radiation is the low-energy power-law index. Under the assumption that the emission is dominated by synchrotron radiation, the low-energy photon index should be no harder than in the case of non-adiabatic cooling, and no harder than in the case of adiabatic cooling (Rybicki & Lightman 1979; Katz 1994). As has been widely noted previously (Preece et al. 1998; González et al. 2003; Medvedev 2006, e.g.), BATSE-detected GRBs had a significant fraction of events that have measured low-energy indices that violate these conditions, and have been termed the synchrotron ‘line-of-death’ problem. A comparison of the GBM data with the BATSE data, shown in Figure 21, indicates some overall agreement in the distribution of the low-energy index, however GBM, on the average, measures a slightly harder index than what was measured in BATSE. The GBM response extends down to 8 keV, whereas the BATSE response extended to 20 keV, therefore, the measurement of the low-energy index by GBM is likely more conclusive in most cases. This leads to an increasingly worrisome case for synchrotron radiation as the primary emission mechanism because fewer GBM bursts are compatible with that interpretation.
Another interesting comparison between the BATSE and GBM bursts is the high-energy power-law index. Figure 22 shows that the GBM measurement of the high-energy index is generally shifted towards harder spectra compared to BATSE. This creates an issue for a sizable fraction of GRBs because the Band function becomes unphysical at a and leads to an infinite flux if extrapolated in energy. Previous studies of early GBM GRBs also detected by the Fermi LAT have shown that in many cases, the high-energy index is biased toward harder values for GBM data (Ackermann et al. 2012). Therefore, the shift in the GBM distribution may result in an issue with the fitting of the spectrum rather than an insight into the true spectrum. Although GBM has an energy range that extends far beyond the data used in the BATSE 5B catalog (40 MeV vs. 2 MeV), the much smaller effective area of GBM may contribute to the bias in fitting the spectral indices.
A spectral feature of GRBs that has been of particular interest to the community is the , since it was previously thought to be an indicator used to standardize GRB energetics for purposes of studying cosmology (Lloyd et al. 2000; Yonetoku et al. 2004; Amati 2006; Ghirlanda, G. et al. 2007). In Figure 23 we show the comparison of measurements between GBM and BATSE. These distributions broadly agree, although it is clear that the larger energy range of the GBM allows the measurement of down to keV and an expanded population of GRBs with values in the MeV range.
VI Summary
The third GBM spectral catalog includes 2297 GRBs detected by GBM during its first 10 years of operation. The spectral properties presented here are from time-integrated and peak-flux analysis, produced using four photon models which were chosen based on their empirical importance to the shape of many GRB spectra. The analysis of each burst was performed as objectively as possible, in an attempt to minimize biased systematic errors inherent in a subjective analyses. We have described subsets of the full results in the form of data cuts based on parameter uncertainties (GOOD models), as well as employing model comparison techniques to select the most statistically preferred model for each GRB (BEST models).
We have illustrated alternative means to classify bursts as long or short; based on their accumulation times (Figure 1) and using the /Fluence ratio (Figure 5). These plots, alongside the classical distribution (von Kienlin et al. 2020), highlight the robustness of bimodalilty observed in GRB distribution. The parameter distributions shown here are largely similar to those in previous studies (Goldstein et al. 2012; Gruber et al. 2014) yet contain some important differences. Importantly, the energy ratio technique can be implemented solely from parameter values found in this Catalog. Bursts with energy ratios are very likely to belong to the short class of bursts. It is also not tied up with issues derived from , which omits of the burst fluence. This is seen clearly in Figure 1c for those values where is less than the accumulation time ( accumulation time is expected, as the latter doesn’t count quiescent portions of the burst).
The Probability Density Histograms presented in section III capture the two-tailed uncertainties of the fitted parameters; Figures 2, 3 and 4, depicting the CDF for errors of , BAND and SBPL respectively, showcase the differences in distribution of positive and negative uncertainties for these parameters. The GOOD criteria cutoffs (sec. III.1) has been altered, accounting for the introduction of asymmetric uncertainties.
The current models for GRB prompt emission can be split into two categories: magnetic (e.g., Lee et al. 2000) or internal/external shock driven (e.g., Rees & Meszaros 1992. The distribution is hence an interesting result; as comparing it to predictions made by the SSM provides useful insights into the emission mechanisms of GRBs. The results obtained here are compatible and in line with results obtained by Preece et al. 2002 and previous GBM catalogs (Goldstein et al. 2012; Gruber et al. 2014). Thus, we conclude that the predictions of the SSM model, in its simplest form, are not reconcilable by observations made by GBM. In its 10 years of operation, GBM has observed 130 GRBs with known redshifts, hence providing one of the largest samples of rest-frame properties (, and ) to date. This helps us assess our current understanding of the central engine and emission physics of a GRB.
This catalog should be treated as a starting point for future research on interesting bursts and ideas. As has been the case in previous GRB spectral catalogs, we hope this catalog will be of great assistance and importance to the search for the physical properties of GRBs and other related studies.
VII Acknowledgments
The UAH coauthors gratefully acknowledge NASA funding from cooperative agreement NNM11AA01A. The USRA coauthors acknowledge NASA funding through co-operative agreement NNM13AA43C. C.M. is supported by an appointment to the NASA Postdoctoral Program at the Marshall Space Flight Center, administered by Universities Space Research Association under contract with NASA. P.V. acknowledges support from NASA grant 80NSSC19K0595. Support for the German contribution to GBM was provided by the Bundesministerium für Bildung und Forschung (BMBF) via the Deutsches Zentrum für Luft und Raumfahrt (DLR) under grant number 50 QV 0301.
=.5in
| COMP | BAND | ||||||||
|---|---|---|---|---|---|---|---|---|---|
| ID | k | Eiso | Liso | E | k | Eiso | Liso | E | |
| (erg) | (erg s-1) | (keV) | (erg) | (erg s-1) | (keV) | ||||
| GRB 080804972 | 1.546 | 2.25e+53 1.19e+52 | 3.70e+52 6.15e+51 | 7.08e+02 2.30e+01 | 1.041 | 1.43e+53 6.08e+51 | 2.24e+52 2.35e+51 | 9.91e+02 2.42e+01 | |
| GRB 080810549 | 1.204 | 4.67e+53 1.57e+52 | 1.12e+53 1.09e+52 | 2.56e+03 8.58e+01 | 1.235 | 4.79e+53 1.56e+52 | 1.14e+53 1.11e+52 | 2.57e+03 7.52e+01 | |
| GRB 080905499 | 1.976 | 3.84e+49 1.17e+51 | 2.54e+50 7.74e+51 | 3.56e+02 5.25e+01 | 1.019 | 1.83e+49 2.40e+48 | 1.32e+50 2.08e+49 | 3.92e+02 5.53e+01 | |
| GRB 080905705 | 1.240 | 4.03e+52 1.77e+53 | 1.49e+52 6.58e+52 | 6.15e+02 5.15e+01 | 1.042 | 3.08e+52 3.44e+51 | 1.23e+52 3.18e+51 | 6.71e+02 3.14e+01 | |
| GRB 080916009 | 1.279 | 4.46e+54 7.66e+52 | 1.01e+54 4.87e+52 | 3.57e+03 4.17e+01 | 1.275 | 4.60e+54 5.18e+52 | 1.03e+54 4.29e+52 | 4.11e+03 4.13e+01 | |
| GRB 080916406 | 1.904 | 3.51e+52 2.05e+51 | 3.92e+51 4.89e+50 | 1.79e+02 2.04e+01 | 1.085 | 1.75e+52 7.83e+50 | 2.21e+51 2.19e+50 | 4.19e+02 2.72e+01 | |
| GRB 080928628 | 1.719 | 2.76e+52 3.96e+51 | 7.86e+51 2.76e+51 | 1.33e+02 1.68e+02 | 1.669 | 2.61e+52 2.34e+51 | 7.12e+51 1.12e+51 | 2.90e+03 3.19e+03 | |
| GRB 081007224 | 1.561 | 1.42e+51 5.15e+50 | 4.29e+50 1.65e+50 | 5.76e+01 5.47e+00 | 1.391 | 1.25e+51 1.01e+50 | 3.82e+50 5.78e+49 | 5.72e+01 5.19e+00 | |
| GRB 081008832 | 1.352 | 1.14e+53 1.65e+52 | 1.44e+52 5.03e+51 | 4.96e+02 3.05e+01 | 1.079 | 8.62e+52 6.14e+51 | 1.11e+52 2.04e+51 | 6.82e+02 3.30e+01 | |
| GRB 081109293 | 2.016 | 3.90e+52 2.88e+51 | 4.15e+51 6.27e+50 | 5.66e+01 1.10e+01 | 2.150 | 4.13e+52 1.87e+51 | 3.90e+51 6.12e+50 | 9.21e+06 1.66e+09 | |
| GRB 081121858 | 1.350 | 3.32e+53 1.58e+52 | 1.22e+53 8.76e+51 | 5.65e+02 1.44e+01 | 1.034 | 2.41e+53 8.14e+51 | 9.13e+52 7.60e+51 | 8.61e+02 1.50e+01 | |
| GRB 081221681 | 1.083 | 4.44e+53 7.83e+51 | 1.20e+53 4.40e+51 | 2.83e+02 1.33e+00 | 1.090 | 4.33e+53 3.51e+51 | 1.18e+53 2.89e+51 | 2.88e+02 1.11e+00 | |
| GRB 081222204 | 1.213 | 2.87e+53 1.17e+52 | 1.53e+53 9.20e+51 | 5.55e+02 8.43e+00 | 1.053 | 2.27e+53 5.61e+51 | 1.27e+53 5.88e+51 | 6.71e+02 8.14e+00 | |
| GRB 090102122 | 1.139 | 2.65e+53 1.88e+52 | 6.05e+52 4.80e+51 | 1.07e+03 1.80e+01 | 1.119 | 2.59e+53 4.02e+51 | 5.95e+52 2.23e+51 | 1.06e+03 1.72e+01 | |
| GRB 090113778 | 1.390 | 1.88e+52 4.57e+51 | 1.61e+52 4.59e+51 | 3.92e+02 3.08e+01 | 1.111 | 1.35e+52 1.42e+51 | 1.27e+52 1.57e+51 | 5.03e+02 3.73e+01 | |
| GRB 090323002 | 1.240 | 4.86e+54 1.15e+53 | 5.69e+53 2.70e+52 | 2.07e+03 2.36e+01 | 1.189 | 4.73e+54 5.09e+52 | 5.43e+53 2.24e+52 | 2.20e+03 1.86e+01 | |
| GRB 090328401 | 1.521 | 1.30e+53 9.39e+51 | 1.76e+52 1.36e+51 | 1.13e+03 4.38e+01 | 1.358 | 1.18e+53 1.34e+51 | 1.58e+52 4.40e+50 | 1.24e+03 3.93e+01 | |
| GRB 090423330 | 1.047 | 7.58e+52 1.51e+52 | 1.63e+53 8.66e+52 | 6.10e+02 1.08e+01 | 1.085 | 6.44e+52 6.46e+51 | 1.58e+53 2.66e+52 | 6.58e+02 8.70e+00 | |
| GRB 090424592 | 1.171 | 4.79e+52 1.49e+51 | 1.75e+52 5.55e+50 | 2.46e+02 3.98e+00 | 1.067 | 4.21e+52 3.77e+50 | 1.58e+52 1.95e+50 | 2.63e+02 2.97e+00 | |
| GRB 090510016 | 4.247 | 4.65e+52 2.11e+51 | 3.64e+53 2.06e+52 | 8.07e+03 4.40e+02 | 4.116 | 4.47e+52 1.06e+51 | 3.52e+53 1.49e+52 | 8.98e+03 3.49e+02 | |
| GRB 090516353 | 1.389 | 1.18e+54 6.35e+52 | 1.39e+53 1.73e+52 | 7.26e+02 2.65e+01 | 1.257 | 1.04e+54 4.00e+52 | 1.33e+53 2.10e+52 | 8.37e+02 1.95e+01 | |
| GRB 090519881 | 1.639 | 2.62e+53 2.19e+52 | 1.02e+53 2.08e+52 | 7.82e+03 5.42e+02 | 1.606 | 2.57e+53 1.64e+52 | 1.00e+53 1.94e+52 | 7.69e+03 5.16e+02 | |
| GRB 090618353 | 1.370 | 3.27e+53 3.59e+51 | 2.48e+52 5.21e+50 | 2.30e+02 3.29e+00 | 1.104 | 2.59e+53 1.61e+51 | 2.02e+52 3.58e+50 | 3.23e+02 3.30e+00 | |
| GRB 090902462 | 1.593 | 4.00e+54 1.51e+52 | 7.88e+53 7.45e+51 | 2.98e+03 1.63e+01 | 1.599 | 4.02e+54 1.16e+52 | 7.91e+53 7.22e+51 | 2.98e+03 1.57e+01 | |
| GRB 090926181 | 1.311 | 2.47e+54 3.11e+52 | 9.28e+53 1.47e+52 | 1.04e+03 5.84e+00 | 1.089 | 2.09e+54 1.08e+52 | 7.92e+53 8.77e+51 | 1.17e+03 4.57e+00 | |
| GRB 090926914 | 1.052 | 4.06e+52 2.40e+51 | 4.15e+51 9.12e+50 | 1.84e+02 2.56e+00 | 1.019 | 3.55e+52 7.89e+50 | 3.94e+51 3.53e+50 | 1.90e+02 2.05e+00 | |
| GRB 090927422 | 1.052 | 4.91e+52 2.89e+51 | 5.31e+51 1.17e+51 | 1.95e+02 2.56e+00 | 1.026 | 1.21e+51 2.29e+50 | 7.29e+51 1.45e+51 | 4.17e+02 4.14e+01 | |
| GRB 091003191 | 1.459 | 1.25e+53 8.38e+51 | 5.70e+52 3.88e+51 | 7.03e+02 2.66e+01 | 1.156 | 1.02e+53 1.58e+51 | 4.77e+52 8.85e+50 | 8.21e+02 2.11e+01 | |
| GRB 091020900 | 1.255 | 8.59e+52 6.67e+53 | 3.54e+52 2.75e+53 | 6.19e+02 4.88e+01 | 1.112 | 7.50e+52 3.77e+51 | 3.44e+52 2.45e+51 | 6.61e+02 2.75e+01 | |
| GRB 091024372 | 1.662 | 5.69e+52 4.40e+51 | 9.49e+51 2.20e+51 | 3.63e+03 9.02e+02 | 1.909 | 6.52e+52 3.71e+51 | 1.09e+52 1.89e+51 | 3.64e+03 8.96e+02 | |
| GRB 091127976 | 1.510 | 1.97e+52 5.40e+50 | 8.91e+51 2.61e+50 | 5.28e+01 1.55e+00 | 1.467 | 1.70e+52 1.99e+50 | 7.51e+51 9.91e+49 | 8.71e+01 1.61e+00 | |
| GRB 091208410 | 1.533 | 4.00e+52 2.17e+51 | 2.84e+52 1.59e+51 | 9.21e+01 1.28e+01 | 1.174 | 2.48e+52 1.17e+51 | 2.04e+52 8.68e+50 | 2.56e+02 1.31e+01 | |
| GRB 100117879 | 1.212 | 1.16e+51 7.20e+50 | 1.09e+52 7.07e+51 | 6.28e+02 5.29e+01 | 1.020 | 9.75e+50 1.49e+50 | 8.70e+51 1.95e+51 | 6.25e+02 5.11e+01 | |
| GRB 100206563 | 1.977 | 8.83e+50 3.00e+50 | 1.27e+52 4.33e+51 | 6.39e+02 6.36e+01 | 1.148 | 5.40e+50 3.42e+49 | 7.77e+51 4.91e+50 | 7.48e+02 7.17e+01 | |
| GRB 100414097 | 1.567 | 7.99e+53 3.82e+52 | 1.10e+53 5.98e+51 | 1.57e+03 1.54e+01 | 1.282 | 6.56e+53 4.69e+51 | 9.24e+52 2.23e+51 | 1.58e+03 1.46e+01 | |
| GRB 100615083 | 1.639 | 1.26e+53 4.42e+51 | 1.81e+52 1.35e+51 | 1.28e+02 7.50e+00 | 1.157 | 6.77e+52 2.25e+51 | 9.71e+51 5.30e+50 | 3.43e+02 1.04e+01 | |
| GRB 100625773 | 1.290 | 9.87e+50 1.30e+50 | 5.88e+51 9.92e+50 | 7.00e+02 6.19e+01 | 1.126 | 8.61e+50 6.47e+49 | 5.88e+51 7.79e+50 | 7.02e+02 6.33e+01 | |
| GRB 100724029 | 1.664 | 2.01e+54 2.40e+52 | 1.21e+53 2.88e+51 | 8.20e+02 8.16e+00 | 1.159 | 1.46e+54 8.38e+51 | 8.99e+52 1.78e+51 | 1.11e+03 7.70e+00 | |
| GRB 100728095 | 1.257 | 1.08e+54 3.44e+52 | 6.89e+52 3.64e+51 | 7.45e+02 7.82e+00 | 1.041 | 8.95e+53 9.80e+51 | 5.95e+52 2.44e+51 | 7.99e+02 6.11e+00 | |
| GRB 100728439 | 1.892 | 9.35e+52 2.57e+53 | 6.13e+52 1.68e+53 | 6.26e+01 6.03e+04 | 1.069 | 3.50e+52 2.42e+51 | 2.05e+52 2.09e+51 | 4.76e+02 1.85e+01 | |
| GRB 100814160 | 1.249 | 1.07e+53 9.32e+51 | 1.87e+52 1.96e+51 | 3.31e+02 1.05e+01 | 1.022 | 7.60e+52 2.71e+51 | 1.14e+52 1.15e+51 | 3.81e+02 8.03e+00 | |
| GRB 100816026 | 1.175 | 8.93e+51 7.52e+50 | 7.16e+51 6.09e+50 | 2.41e+02 7.08e+00 | 1.019 | 6.79e+51 2.24e+50 | 5.44e+51 2.06e+50 | 2.54e+02 6.07e+00 | |
| GRB 100906576 | 1.173 | 2.43e+53 5.28e+52 | 6.16e+52 1.36e+52 | 6.11e+02 2.28e+01 | 1.155 | 2.39e+53 8.52e+51 | 5.58e+52 3.40e+51 | 6.11e+02 2.14e+01 | |
| GRB 101213451 | 1.423 | 9.57e+51 3.12e+51 | 7.98e+50 2.88e+50 | 4.93e+02 3.38e+01 | 1.081 | 7.10e+51 3.26e+50 | 5.96e+50 8.87e+49 | 4.85e+02 3.03e+01 | |
| GRB 101219686 | 1.420 | 3.90e+51 5.15e+50 | 4.61e+50 1.31e+50 | 9.00e+01 6.81e+00 | 1.023 | 2.01e+51 1.04e+50 | 2.70e+50 4.05e+49 | 1.28e+02 4.63e+00 | |
| GRB 110106893 | 1.063 | 2.43e+51 1.22e+51 | 5.50e+50 3.21e+50 | 2.12e+02 1.49e+01 | 1.067 | 2.43e+51 2.07e+50 | 6.27e+50 1.76e+50 | 2.12e+02 1.45e+01 | |
| GRB 110128073 | 1.715 | 1.73e+52 2.59e+53 | 2.35e+52 3.53e+53 | 3.71e+01 1.55e+03 | 1.794 | 1.92e+52 2.69e+51 | 2.30e+52 7.11e+51 | 1.11e+05 3.49e+05 | |
| GRB 110213220 | 1.461 | 9.56e+52 5.74e+51 | 2.83e+52 1.84e+51 | 2.77e+02 1.20e+01 | 1.285 | 8.41e+52 3.49e+51 | 2.49e+52 1.14e+51 | 2.77e+02 1.18e+01 | |
| GRB 110731465 | 1.245 | 5.72e+53 3.13e+52 | 2.37e+53 1.68e+52 | 1.23e+03 1.69e+01 | 1.075 | 4.96e+53 9.07e+51 | 2.03e+53 8.08e+51 | 1.33e+03 1.40e+01 | |
| GRB 110818860 | 1.418 | 2.43e+53 2.00e+52 | 7.65e+52 1.00e+52 | 7.94e+02 5.79e+01 | 1.152 | 1.92e+53 1.33e+52 | 7.48e+52 8.41e+51 | 1.57e+03 7.45e+01 | |
| GRB 111107035 | 1.474 | 1.97e+53 1.80e+52 | 5.53e+52 7.57e+51 | 7.09e+02 5.79e+01 | 1.124 | 4.40e+52 6.45e+51 | 2.06e+52 5.14e+51 | 1.03e+03 7.68e+01 | |
| GRB 111117510 | 1.608 | 5.35e+51 1.49e+53 | 5.97e+52 1.66e+54 | 1.16e+03 1.11e+02 | 1.164 | 4.01e+51 3.53e+50 | 4.02e+52 5.67e+51 | 1.25e+03 1.03e+02 | |
| GRB 111228657 | 1.933 | 2.05e+52 1.44e+51 | 2.67e+51 2.42e+50 | 3.92e+01 1.25e+00 | 1.722 | 1.60e+52 2.92e+50 | 2.26e+51 9.76e+49 | 4.01e+01 2.05e+00 | |
| GRB 120118709 | 1.108 | 6.54e+52 4.23e+51 | 1.96e+52 4.08e+51 | 1.70e+02 3.06e+00 | 1.169 | 5.76e+52 2.14e+51 | 1.82e+52 2.09e+51 | 2.19e+02 3.02e+00 | |
| GRB 120119170 | 1.250 | 4.24e+53 2.01e+52 | 8.54e+52 4.65e+51 | 4.99e+02 1.05e+01 | 1.060 | 3.45e+53 4.72e+51 | 7.35e+52 2.57e+51 | 5.86e+02 6.07e+00 | |
| GRB 120326056 | 1.212 | 4.35e+52 2.68e+51 | 1.91e+52 1.84e+51 | 1.24e+02 5.59e+00 | 1.215 | 3.54e+52 1.08e+51 | 1.62e+52 9.85e+50 | 1.75e+02 3.09e+00 | |
| GRB 120624933 | 1.498 | 3.91e+54 7.15e+52 | 3.11e+53 1.08e+52 | 2.04e+03 2.45e+01 | 1.336 | 3.61e+54 2.35e+52 | 2.87e+53 6.60e+51 | 2.31e+03 2.17e+01 | |
| GRB 120711115 | 1.869 | 2.17e+54 1.89e+52 | 2.07e+53 4.76e+51 | 3.18e+03 4.23e+01 | 1.940 | 2.26e+54 1.14e+52 | 2.11e+53 4.52e+51 | 3.59e+03 4.59e+01 | |
| GRB 120712571 | 1.243 | 2.14e+53 1.29e+52 | 1.18e+53 1.44e+52 | 7.85e+02 1.96e+01 | 1.060 | 1.75e+53 1.04e+52 | 8.77e+52 1.16e+52 | 1.34e+03 3.37e+01 | |
| GRB 120716712 | 1.144 | 2.64e+53 1.20e+52 | 7.19e+52 4.79e+51 | 4.19e+02 6.46e+00 | 1.071 | 2.26e+53 5.27e+51 | 5.92e+52 3.46e+51 | 4.59e+02 5.29e+00 | |
| GRB 120729456 | 2.190 | 2.16e+52 2.40e+51 | 5.46e+51 7.67e+50 | 1.24e+03 4.57e+03 | 2.247 | 2.23e+52 1.11e+51 | 5.76e+51 5.60e+50 | 5.76e+05 7.78e+06 | |
| GRB 120811649 | 1.114 | 7.57e+52 6.20e+51 | 3.95e+52 5.27e+51 | 2.03e+02 3.93e+00 | 1.156 | 7.01e+52 3.20e+51 | 3.12e+52 3.07e+51 | 2.23e+02 3.73e+00 | |
| GRB 120907017 | 1.054 | 2.15e+51 9.08e+50 | 2.44e+51 1.02e+51 | 2.53e+02 3.03e+01 | 1.054 | 2.08e+51 3.27e+50 | 2.42e+51 4.43e+50 | 2.38e+02 2.21e+01 | |
| GRB 120909070 | 1.287 | 8.09e+53 3.11e+52 | 1.67e+53 2.16e+52 | 9.84e+02 2.43e+01 | 1.074 | 6.53e+53 2.59e+52 | 1.42e+53 1.49e+52 | 1.50e+03 2.86e+01 | |
| GRB 120922393 | 1.357 | 5.83e+53 2.46e+52 | 9.99e+52 1.30e+52 | 8.19e+02 2.43e+01 | 1.075 | 4.46e+53 1.77e+52 | 8.05e+52 8.44e+51 | 1.25e+03 2.86e+01 | |
| GRB 121011469 | 1.982 | 1.59e+53 1.00e+52 | 4.15e+52 5.65e+51 | 1.13e+03 1.38e+02 | 2.364 | 2.11e+53 7.90e+51 | 5.40e+52 5.30e+51 | 1.53e+04 1.20e+03 | |
| GRB 121128212 | 1.170 | 1.55e+53 6.30e+51 | 7.84e+52 7.89e+51 | 1.92e+02 3.85e+00 | 1.136 | 1.25e+53 2.81e+51 | 7.48e+52 2.94e+51 | 2.46e+02 2.87e+00 | |
| GRB 121211574 | 1.017 | 1.63e+51 4.62e+50 | 1.21e+51 4.79e+50 | 2.04e+02 1.39e+01 | 1.026 | 1.59e+51 1.63e+50 | 1.12e+51 2.09e+50 | 1.98e+02 1.03e+01 | |
| GRB 130215063 | 2.434 | 4.18e+52 2.43e+51 | 2.08e+51 2.59e+50 | 4.11e+02 1.30e+02 | 2.369 | 4.42e+52 1.03e+51 | 2.11e+51 2.37e+50 | 5.39e+03 1.13e+03 | |
| GRB 130420313 | 1.252 | 3.64e+52 6.52e+51 | 4.31e+51 5.27e+50 | 1.32e+02 3.14e+00 | 1.216 | 3.53e+52 1.27e+51 | 4.18e+51 4.36e+50 | 1.31e+02 3.04e+00 | |
| GRB 130427324 | 1.576 | 7.43e+53 3.76e+51 | 1.38e+53 8.06e+50 | 1.11e+03 5.45e+00 | 1.485 | 7.05e+53 8.28e+50 | 1.32e+53 3.95e+50 | 1.16e+03 4.98e+00 | |
| GRB 130518580 | 1.375 | 2.17e+54 4.59e+52 | 8.83e+53 2.23e+52 | 1.33e+03 1.46e+01 | 1.136 | 1.85e+54 1.76e+52 | 7.86e+53 1.10e+52 | 1.58e+03 1.20e+01 | |
| GRB 130528695 | 1.103 | 4.67e+52 1.25e+52 | 1.33e+52 3.69e+51 | 2.73e+02 6.94e+00 | 1.095 | 4.62e+52 1.47e+51 | 1.25e+52 8.00e+50 | 2.71e+02 6.65e+00 | |
| GRB 130610133 | 1.304 | 9.09e+52 1.06e+52 | 1.49e+52 3.17e+51 | 9.45e+02 1.60e+02 | 1.289 | 8.90e+52 7.37e+51 | 1.48e+52 2.88e+51 | 8.81e+02 6.16e+01 | |
| GRB 130612141 | 1.194 | 7.59e+51 1.03e+51 | 7.69e+51 1.49e+51 | 8.71e+01 8.23e+00 | 1.315 | 6.86e+51 6.90e+50 | 6.88e+51 1.01e+51 | 1.74e+02 1.00e+01 | |
| GRB 130702004 | 1.133 | 4.75e+50 1.82e+49 | 5.21e+49 3.83e+48 | 1.20e+01 1.13e+00 | 3.559 | 1.50e+51 4.26e+49 | 1.64e+50 1.21e+49 | 7.80e+03 2.75e+02 | |
| GRB 130925173 | 1.520 | 5.50e+52 1.64e+51 | 5.79e+50 6.35e+49 | 3.13e+01 8.09e-01 | 1.353 | 4.15e+52 3.44e+50 | 5.20e+50 2.68e+49 | 1.14e+02 1.61e+00 | |
| GRB 131004904 | 1.241 | 8.57e+50 1.29e+50 | 2.78e+51 8.32e+50 | 2.03e+02 2.44e+01 | 1.173 | 8.10e+50 9.41e+49 | 2.65e+51 7.12e+50 | 2.03e+02 2.42e+01 | |
| GRB 131011741 | 1.396 | 1.63e+53 1.73e+52 | 3.39e+52 4.10e+51 | 6.25e+02 4.09e+01 | 1.059 | 1.18e+53 5.05e+51 | 2.53e+52 2.77e+51 | 7.87e+02 2.43e+01 | |
| GRB 131105087 | 1.112 | 2.26e+53 3.02e+52 | 3.96e+52 5.64e+51 | 7.23e+02 1.83e+01 | 1.119 | 2.26e+53 5.39e+51 | 3.98e+52 2.19e+51 | 7.16e+02 1.56e+01 | |
| GRB 131108862 | 1.274 | 7.14e+53 2.80e+52 | 2.98e+53 1.30e+52 | 1.25e+03 1.63e+01 | 1.107 | 6.31e+53 8.38e+51 | 2.75e+53 7.24e+51 | 1.35e+03 1.37e+01 | |
| GRB 131231198 | 1.343 | 2.55e+53 3.47e+51 | 4.00e+52 6.77e+50 | 2.92e+02 4.03e+00 | 1.114 | 2.08e+53 1.01e+51 | 3.39e+52 3.82e+50 | 3.63e+02 2.90e+00 | |
| GRB 140206304 | 1.220 | 3.49e+53 1.27e+52 | 2.29e+53 1.03e+52 | 4.52e+02 5.83e+00 | 1.014 | 2.50e+53 5.33e+51 | 1.67e+53 5.12e+51 | 5.69e+02 4.61e+00 | |
| GRB 140213807 | 1.320 | 1.39e+53 3.53e+51 | 3.75e+52 1.25e+51 | 1.90e+02 4.10e+00 | 1.154 | 1.06e+53 1.45e+51 | 3.04e+52 5.60e+50 | 2.51e+02 3.27e+00 | |
| GRB 140304557 | 1.107 | 1.32e+53 1.72e+52 | 1.37e+53 2.74e+52 | 7.71e+02 3.14e+01 | 1.058 | 1.12e+53 9.40e+51 | 1.37e+53 2.87e+52 | 8.91e+02 1.85e+01 | |
| GRB 140423356 | 1.411 | 7.79e+53 2.87e+52 | 7.90e+52 1.03e+52 | 4.95e+02 1.59e+01 | 1.054 | 5.03e+53 2.05e+52 | 4.94e+52 9.58e+51 | 1.03e+03 1.98e+01 | |
| GRB 140506880 | 1.095 | 1.21e+52 3.88e+51 | 1.03e+52 3.25e+51 | 3.72e+02 2.53e+01 | 1.088 | 1.21e+52 8.63e+50 | 9.39e+51 5.15e+50 | 3.73e+02 2.63e+01 | |
| GRB 140508128 | 1.332 | 2.70e+53 9.35e+51 | 1.07e+53 3.96e+51 | 5.23e+02 1.21e+01 | 1.110 | 2.24e+53 3.24e+51 | 9.23e+52 1.68e+51 | 5.88e+02 1.09e+01 | |
| GRB 140512814 | 1.282 | 9.41e+52 5.87e+52 | 8.69e+51 5.43e+51 | 1.20e+03 5.82e+01 | 1.363 | 1.00e+53 1.61e+51 | 9.24e+51 3.86e+50 | 1.20e+03 5.71e+01 | |
| GRB 140606133 | 1.713 | 6.76e+51 2.11e+51 | 2.32e+51 7.31e+50 | 7.37e+02 1.13e+02 | 1.283 | 5.17e+51 2.29e+50 | 1.76e+51 8.41e+49 | 7.97e+02 1.03e+02 | |
| GRB 140620219 | 1.313 | 1.07e+53 6.07e+51 | 2.82e+52 3.25e+51 | 2.11e+02 1.07e+01 | 1.146 | 8.19e+52 3.78e+51 | 1.97e+52 1.68e+51 | 3.96e+02 1.22e+01 | |
| GRB 140623224 | 1.172 | 4.13e+52 4.61e+51 | 9.11e+51 1.75e+51 | 9.54e+02 1.38e+02 | 1.198 | 4.18e+52 4.34e+51 | 8.65e+51 1.66e+51 | 9.26e+02 8.26e+01 | |
| GRB 140703026 | 1.193 | 2.63e+53 2.49e+52 | 8.04e+52 9.89e+51 | 8.65e+02 3.47e+01 | 1.118 | 2.44e+53 1.12e+52 | 7.38e+52 7.54e+51 | 9.05e+02 2.32e+01 | |
| GRB 140801792 | 1.037 | 6.67e+52 2.98e+51 | 3.28e+52 1.66e+51 | 2.77e+02 2.64e+00 | 1.026 | 6.40e+52 8.24e+50 | 3.11e+52 7.36e+50 | 2.81e+02 2.11e+00 | |
| GRB 140808038 | 1.087 | 1.01e+53 7.58e+51 | 1.43e+53 1.26e+52 | 5.04e+02 6.46e+00 | 1.029 | 8.65e+52 3.04e+51 | 1.26e+53 6.68e+51 | 5.38e+02 6.15e+00 | |
| GRB 140907672 | 1.076 | 2.97e+52 8.09e+51 | 4.23e+51 1.29e+51 | 3.08e+02 1.03e+01 | 1.074 | 2.94e+52 1.04e+51 | 3.69e+51 3.28e+50 | 3.03e+02 7.81e+00 | |
| GRB 141004973 | 1.663 | 2.51e+51 2.80e+50 | 2.35e+51 2.53e+50 | 4.37e+01 6.64e+00 | 1.259 | 1.74e+51 2.21e+50 | 1.49e+51 1.52e+50 | 2.85e+02 5.56e+01 | |
| GRB 141005217 | 1.197 | 1.91e+52 1.82e+52 | 1.72e+52 1.65e+52 | 2.93e+02 1.10e+01 | 1.022 | 1.53e+52 7.71e+50 | 1.46e+52 9.87e+50 | 3.55e+02 1.02e+01 | |
| GRB 141028455 | 1.462 | 8.52e+53 2.11e+52 | 3.01e+53 1.04e+52 | 9.76e+02 1.80e+01 | 1.122 | 6.75e+53 8.70e+51 | 2.41e+53 6.00e+51 | 1.39e+03 1.53e+01 | |
| GRB 141220252 | 1.037 | 2.98e+52 5.96e+51 | 2.64e+52 5.30e+51 | 4.15e+02 1.01e+01 | 1.039 | 2.99e+52 9.56e+50 | 2.65e+52 1.01e+51 | 4.14e+02 9.11e+00 | |
| GRB 141221338 | 1.460 | 2.92e+52 4.84e+51 | 1.75e+52 3.52e+51 | 2.26e+02 2.87e+01 | 1.093 | 1.94e+52 1.78e+51 | 1.32e+52 1.86e+51 | 4.46e+02 3.20e+01 | |
| GRB 141225959 | 1.626 | 2.66e+52 3.27e+51 | 4.32e+51 7.29e+50 | 3.42e+02 1.93e+01 | 1.024 | 1.55e+52 9.67e+50 | 2.42e+51 3.81e+50 | 4.95e+02 2.70e+01 | |
| GRB 150101641 | 1.837 | 8.02e+48 2.36e+48 | 3.53e+49 1.04e+49 | 3.24e+01 6.74e+00 | 1.157 | 4.20e+48 1.01e+48 | 2.22e+49 3.32e+48 | 1.41e+02 4.86e+01 | |
| GRB 150301818 | 1.322 | 3.77e+52 6.51e+51 | 1.15e+52 2.34e+51 | 4.61e+02 2.87e+01 | 1.078 | 2.95e+52 1.79e+51 | 9.32e+51 1.08e+51 | 5.68e+02 2.75e+01 | |
| GRB 150314205 | 1.310 | 1.03e+54 2.39e+52 | 5.10e+53 1.29e+52 | 9.57e+02 7.90e+00 | 1.073 | 8.59e+53 6.37e+51 | 4.26e+53 5.72e+51 | 1.05e+03 5.76e+00 | |
| GRB 150403913 | 1.473 | 1.11e+54 2.54e+52 | 4.74e+53 1.35e+52 | 1.31e+03 2.11e+01 | 1.202 | 9.56e+53 9.41e+51 | 4.09e+53 7.27e+51 | 1.66e+03 1.70e+01 | |
| GRB 150514774 | 1.321 | 1.35e+52 8.30e+50 | 6.07e+51 3.93e+50 | 1.17e+02 5.91e+00 | 1.233 | 1.11e+52 3.16e+50 | 5.04e+51 1.43e+50 | 1.42e+02 4.22e+00 | |
| GRB 150727793 | 1.690 | 3.18e+51 5.11e+50 | 2.31e+50 4.79e+49 | 1.95e+02 1.83e+01 | 1.011 | 1.68e+51 9.20e+49 | 1.19e+50 2.70e+49 | 2.74e+02 1.71e+01 | |
| GRB 150821406 | 1.474 | 1.81e+53 9.04e+51 | 8.74e+51 5.74e+50 | 4.94e+02 1.71e+01 | 1.148 | 1.41e+53 1.96e+51 | 7.04e+51 3.68e+50 | 5.94e+02 1.48e+01 | |
| GRB 151027166 | 1.608 | 5.57e+52 3.99e+51 | 9.85e+51 7.95e+50 | 3.65e+02 2.45e+01 | 1.138 | 3.79e+52 1.25e+51 | 6.96e+51 4.02e+50 | 5.10e+02 2.80e+01 | |
| GRB 151111356 | 1.006 | 5.97e+52 2.49e+52 | 1.53e+52 1.03e+52 | 5.34e+02 5.03e+01 | 1.015 | 6.01e+52 3.87e+51 | 1.51e+52 3.61e+51 | 5.33e+02 9.65e+00 | |
| GRB 160509374 | 1.426 | 1.20e+54 2.37e+52 | 1.90e+53 4.16e+51 | 7.71e+02 9.88e+00 | 1.146 | 9.98e+53 5.74e+51 | 1.60e+53 1.77e+51 | 9.30e+02 8.02e+00 | |
| GRB 160623209 | 2.521 | 3.97e+51 1.73e+51 | 5.67e+50 2.82e+50 | 1.36e+03 4.63e+03 | 2.710 | 4.32e+51 3.38e+50 | 6.25e+50 1.27e+50 | 5.90e+04 1.58e+05 | |
| GRB 160624477 | 2.435 | 8.83e+50 2.48e+50 | 7.37e+51 2.27e+51 | 1.73e+03 5.47e+02 | 1.822 | 6.62e+50 6.19e+49 | 5.50e+51 8.99e+50 | 1.71e+03 4.88e+02 | |
| GRB 160625945 | 1.515 | 6.01e+54 5.06e+52 | 1.47e+54 1.46e+52 | 1.13e+03 6.45e+00 | 1.214 | 5.00e+54 1.62e+52 | 1.26e+54 6.67e+51 | 1.32e+03 5.37e+00 | |
| GRB 160629930 | 1.163 | 5.89e+53 1.04e+53 | 1.11e+53 2.22e+52 | 1.20e+03 2.14e+01 | 1.074 | 5.41e+53 1.75e+52 | 1.01e+53 9.16e+51 | 1.26e+03 1.93e+01 | |
| GRB 160804065 | 1.183 | 2.65e+52 2.41e+51 | 1.41e+51 2.51e+50 | 1.24e+02 4.18e+00 | 1.152 | 2.34e+52 5.39e+50 | 1.15e+51 1.81e+50 | 1.32e+02 2.81e+00 | |
| GRB 160821937 | 1.576 | 2.27e+49 5.16e+48 | 1.34e+50 4.26e+49 | 4.43e+01 2.75e+01 | 1.208 | 1.41e+49 2.10e+48 | 9.34e+49 2.09e+49 | 1.07e+02 2.79e+01 | |
| GRB 161014522 | 1.031 | 1.06e+53 5.66e+51 | 5.82e+52 5.79e+51 | 6.46e+02 1.44e+01 | 1.035 | 1.07e+53 5.48e+51 | 5.78e+52 5.23e+51 | 6.49e+02 1.28e+01 | |
| GRB 161017745 | 1.255 | 8.25e+52 1.70e+52 | 3.41e+52 8.16e+51 | 7.19e+02 4.08e+01 | 1.080 | 7.07e+52 4.82e+51 | 2.90e+52 3.91e+51 | 8.35e+02 4.06e+01 | |
| GRB 161117066 | 1.105 | 2.58e+53 1.09e+52 | 1.45e+52 1.64e+51 | 2.06e+02 3.05e+00 | 1.096 | 2.36e+53 3.05e+51 | 1.34e+52 7.46e+50 | 2.17e+02 1.72e+00 | |
| GRB 161129300 | 1.623 | 2.00e+52 2.72e+51 | 2.81e+51 4.71e+50 | 2.41e+02 4.26e+01 | 1.083 | 1.20e+52 5.94e+50 | 1.86e+51 1.94e+50 | 3.52e+02 2.24e+01 | |
| GRB 161228553 | 1.272 | 1.43e+50 3.83e+49 | 1.53e+49 4.32e+48 | 1.86e+02 1.66e+01 | 1.069 | 1.13e+50 6.53e+48 | 1.27e+49 1.39e+48 | 2.00e+02 1.91e+01 | |
| GRB 170113420 | 1.717 | 3.30e+52 1.98e+52 | 2.13e+52 1.32e+52 | 3.34e+02 5.88e+01 | 1.402 | 2.65e+52 4.49e+51 | 1.54e+52 4.84e+51 | 3.16e+02 3.67e+01 | |
| GRB 170214649 | 1.295 | 4.43e+54 7.84e+52 | 3.42e+53 1.12e+52 | 1.70e+03 1.12e+01 | 1.186 | 4.14e+54 2.30e+52 | 3.36e+53 8.43e+51 | 1.81e+03 9.64e+00 | |
| GRB 170405777 | 1.215 | 2.87e+54 5.51e+52 | 5.40e+53 1.94e+52 | 1.20e+03 9.29e+00 | 1.059 | 2.52e+54 2.94e+52 | 4.80e+53 1.76e+52 | 1.41e+03 7.77e+00 | |
| GRB 170607971 | 1.329 | 1.20e+52 3.47e+50 | 3.18e+51 1.78e+50 | 1.74e+02 9.03e+00 | 1.165 | 1.02e+52 3.49e+50 | 2.77e+51 1.71e+50 | 2.26e+02 1.19e+01 | |
| GRB 170705115 | 1.293 | 1.42e+53 4.47e+51 | 7.28e+52 4.16e+51 | 3.37e+02 9.03e+00 | 1.177 | 1.25e+53 4.29e+51 | 6.59e+52 4.05e+51 | 4.37e+02 1.19e+01 | |
| GRB 170817529 | 1.070 | 3.32e+46 2.79e+46 | 1.93e+47 1.73e+47 | 2.17e+02 5.66e+01 | 1.004 | 3.12e+46 6.72e+45 | 1.63e+47 5.64e+46 | 2.17e+02 5.42e+01 | |
| GRB 170903534 | 1.249 | 1.00e+52 1.14e+52 | 3.14e+51 3.60e+51 | 1.79e+02 1.34e+01 | 1.185 | 9.53e+51 6.82e+50 | 2.95e+51 5.53e+50 | 1.80e+02 1.34e+01 | |
| GRB 171010792 | 1.418 | 2.99e+53 1.65e+51 | 1.19e+52 1.44e+50 | 1.83e+02 1.43e+00 | 1.096 | 2.21e+53 5.96e+50 | 9.50e+51 1.12e+50 | 2.59e+02 1.30e+00 | |
| GRB 171222684 | 1.278 | 3.54e+52 5.95e+51 | 1.08e+52 3.24e+51 | 5.98e+01 4.14e+00 | 2.029 | 6.34e+52 3.03e+51 | 1.20e+52 2.00e+51 | 6.94e+02 3.44e+00 | |
| GRB 180205184 | 1.338 | 9.62e+51 1.54e+51 | 5.27e+51 1.14e+51 | 8.48e+01 1.70e+01 | 1.874 | 1.53e+52 1.31e+51 | 9.56e+51 1.37e+51 | 3.40e+04 4.26e+05 | |
| GRB 180314030 | 1.054 | 1.13e+53 1.06e+52 | 1.49e+52 1.93e+51 | 2.52e+02 4.49e+00 | 1.034 | 1.04e+53 2.10e+51 | 1.24e+52 7.43e+50 | 2.60e+02 2.86e+00 | |
| GRB 180620660 | 1.637 | 6.69e+52 3.79e+51 | 1.33e+52 1.24e+51 | 2.72e+02 1.70e+01 | 1.204 | 5.09e+52 2.05e+51 | 1.04e+52 1.03e+51 | 8.80e+02 8.12e+01 | |
References
- Abbott et al. (2017a) Abbott, B. P., Abbott, R., Abbott, T. D., et al. 2017a, ApJ, 848, L13
- Abbott et al. (2017b) —. 2017b, Physical Review Letters, 119, 161101
- Ackermann et al. (2012) Ackermann, M., Ajello, M., Baldini, L., et al. 2012, The Astrophysical Journal, 754, 121
- Amati (2006) Amati, L. 2006, Monthly Notices of the Royal Astronomical Society, 372, 233
- Arnaud et al. (2011) Arnaud, K., Smith, R., & Siemiginowska, A. 2011, Handbook of X-ray Astronomy (Cambridge University Press)
- Band et al. (1993) Band, D., Matteson, J., Ford, L., et al. 1993, ApJ, 413, 281
- Baring (2006) Baring, M. G. 2006, ApJ, 650, 1004
- Bhat et al. (2016) Bhat, N. P., Meegan, C. A., von Kienlin, A., et al. 2016, ApJS, 223, 28
- Bloom et al. (2001) Bloom, J. S., Frail, D. A., & Sari, R. 2001, AJ, 121, 2879
- Burgess et al. (2014) Burgess, J. M., Preece, R. D., Ryde, F., et al. 2014, ApJ, 784, L43
- Cash (1979) Cash, W. 1979, ApJ, 228, 939
- Cavallo & Rees (1978) Cavallo, G., & Rees, M. J. 1978, MNRAS, 183, 359
- Cohen et al. (1997) Cohen, E., Katz, J. I., Piran, T., et al. 1997, ApJ, 488, 330
- Ghirlanda, G. et al. (2007) Ghirlanda, G., Nava, L., Ghisellini, G., & Firmani, C. 2007, A&A, 466, 127
- Goldstein et al. (2016) Goldstein, A., Connaughton, V., Briggs, M. S., & Burns, E. 2016, ApJ, 818, 18
- Goldstein et al. (2010) Goldstein, A., Preece, R. D., & Briggs, M. S. 2010, ApJ, 721, 1329
- Goldstein et al. (2013) Goldstein, A., Preece, R. D., Mallozzi, R. S., et al. 2013, ApJS, 208, 30
- Goldstein et al. (2012) Goldstein, A., Burgess, J. M., Preece, R. D., et al. 2012, ApJS, 199, 19
- Goldstein et al. (2017) Goldstein, A., Veres, P., Burns, E., et al. 2017, ApJ, 848, L14
- González et al. (2003) González, M. M., Dingus, B. L., Kaneko, Y., et al. 2003, Nature, 424, 749
- Gruber et al. (2014) Gruber, D., Goldstein, A., Weller von Ahlefeld, V., et al. 2014, ApJS, 211, 12
- Kaneko et al. (2006) Kaneko, Y., Preece, R. D., Briggs, M. S., et al. 2006, ApJS, 166, 298
- Katz (1994) Katz, J. I. 1994, ApJ, 432, L107
- Koshut et al. (1996) Koshut, T. M., Paciesas, W. S., Kouveliotou, C., et al. 1996, ApJ, 463, 570
- Kouveliotou et al. (1993) Kouveliotou, C., Meegan, C. A., Fishman, G. J., et al. 1993, ApJ, 413, 101
- Lee et al. (2000) Lee, H. K., Wijers, R. A. M. J., & Brown, G. E. 2000, Phys. Rep., 325, 83
- Lloyd et al. (2000) Lloyd, N. M., Petrosian, V., & Mallozzi, R. S. 2000, The Astrophysical Journal, 534, 227
- Medvedev (2006) Medvedev, M. V. 2006, The Astrophysical Journal, 637, 869
- Meegan et al. (2009) Meegan, C., Lichti, G., Bhat, P. N., et al. 2009, ApJ, 702, 791
- Nava et al. (2011) Nava, L., Ghirlanda, G., Ghisellini, G., & Celotti, A. 2011, A&A, 530, A21
- Preece et al. (2002) Preece, R. D., Briggs, M. S., Giblin, T. W., et al. 2002, ApJ, 581, 1248
- Preece et al. (1998) Preece, R. D., Briggs, M. S., Mallozzi, R. S., et al. 1998, ApJ, 505, L23
- Rees & Meszaros (1992) Rees, M. J., & Meszaros, P. 1992, MNRAS, 258, 41
- Rybicki & Lightman (1979) Rybicki, G. B., & Lightman, A. P. 1979, Radiative Processes in Astrophysics (Wiley-VCH)
- Savchenko et al. (2017) Savchenko, V., Ferrigno, C., Kuulkers, E., et al. 2017, ApJ, 848, L15
- Ubertini et al. (2019) Ubertini, P., Bazzano, A., Natalucci, L., et al. 2019, Rendiconti Lincei. Scienze Fisiche e Naturali, doi:10.1007/s12210-019-00767-y
- Veres et al. (2013) Veres, P., Zhang, B.-B., & Mészáros, P. 2013, ApJ, 764, 94
- von Kienlin et al. (2020) von Kienlin, A., Meegan, C. A., Paciesas, W. S., et al. 2020, arXiv e-prints, arXiv:2002.11460
- Yonetoku et al. (2004) Yonetoku, D., Murakami, T., Nakamura, T., et al. 2004, The Astrophysical Journal, 609, 935