Formation and fate of the born-again planetary nebula HuBi 1
Abstract
We present the first 3D radiation-hydrodynamic simulations on the formation and evolution of born-again planetary nebulae (PNe), with particular emphasis to the case of HuBi 1, the inside-out PN. We use the extensively-tested guacho code to simulate the formation of HuBi 1 adopting mass-loss and stellar wind terminal velocity estimates obtained from observations presented by our group. We found that, if the inner shell of HuBi 1 was formed by an explosive very late thermal pulse (VLTP) ejecting material with velocities of 300 km s-1, the age of this structure is consistent with that of 200 yr derived from multi-epoch narrow-band imaging. Our simulations predict that, as a consequence of the dramatic reduction of the stellar wind velocity and photon ionizing flux during the VLTP, the velocity and pressure structure of the outer H-rich nebula are affected creating turbulent ionized structures surrounding the inner shell. These are indeed detected in Gran Telescopio Canarias MEGARA optical observations. Furthermore, we demonstrate that the current relatively low ionizing photon flux from the central star of HuBi 1 is not able to completely ionize the inner shell, which favors previous suggestions that its excitation is dominated by shocks. Our simulations suggest that the kinetic energy of the H-poor ejecta of HuBi 1 is at least 30 times that of the clumps and filaments in the evolved born-again PNe A 30 and A 78, making it a truly unique VLTP event.
Keywords:
stars: evolution — stars: low-mass — stars: mass-loss — stars: AGB and post-AGB — (ISM:) planetary nebulae: general — (ISM:) planetary nebulae: individual (HuBi 1)1 Introduction
HuBi 1 is part of the selected group of planetary nebulae (PNe) named born-again PNe that are thought to have experienced a very late thermal pulse (Schönberner 1979; Iben et al. 1983, VLTP; e.g.,). During this specific evolutionary phase, the He-burning shell at the surface of the central star of a PN (CSPN) reaches the conditions to ignite He into C and O through an explosive event. This thermonuclear event ejects H-deficient and C-rich material inside the old H-rich PN (see, e.g., Miller Bertolami et al. 2006, and references therein) rendering the star as a C-rich [Wolf-Rayet] ([WR]) type star (Górny & Tylenda 2000).
Recent works have presented stark evidence of the dramatic changes experienced by the CSPN of born-again PNe (Evans et al. 2020, see, e.g., the case of the Sakurai’s Object;), and in particular HuBi 1. Guerrero et al. 2018 demonstrated that in less than 50 yr its CSPN declined its brightness in about 10 mag changing its atmosphere and, as a consequence, producing changes in the ionization structure of its surrounding PN.
HuBi 1 has a double-shell structure (see Fig. 1). The outer shell with an angular radius of arcsec is dominated by emission from recombination lines of H i and He i, whilst its inner shell with arcsec is dominated by emission from forbidden lines (Guerrero et al. 2018). The inner shell has a notable inverted ionization structure, with the emission from higher ionization species such as O++ and He++ encompassing that from lower ionization species such as N+, O+ and S+ (Guerrero et al. 2018, Montoro-Molina et al., in preparation). Such unusual inverted ionization structure gave HuBi 1 the title of inside-out PN.
Guerrero et al. 2018 used multi-epoch observations of HuBi 1, state-of-the-art stellar atmosphere models of its CSPN from the powr code (see Sander et al. 2015, and references therein)11 1 http://www.astro.physik.uni-potsdam.de/~wrh/PoWR/powrgrid1.php and modern stellar evolution models from Miller Bertolami 2016 to predict different aspects of the evolution of this PN and its progenitor star. In particular, these authors found that a model that experienced a mass-loss rate during the VLTP () of 7.6 M⊙ yr-1 fits the evolutionary status of the CSPN of HuBi 1, with an ejected mass during the VLTP () of 8 M⊙. Guerrero et al. 2018 estimated that currently the wind velocity of the CSPN has a velocity of 360 km s-1 with a mass-loss rate of M⊙ yr-1. These authors also estimated a relatively low ionizing photon flux of s-1, which led them to propose that the outer shell is recombining.

In Rechy-García et al. 2020 we have studied HuBi 1 using integral-field spectroscopic Multi-Espectrógrafo en GTC de Alta Resolución para Astronomía (Gil de Paz et al. 2018, MEGARA;) mounted on the Gran Telescopio Canarias (GTC). The unrivaled tomographic capability of these MEGARA observations have unveiled the kinematic signature of the inner shell in HuBi 1, revealing that it was ejected about 200 yr ago and currently has an expansion velocity of 300 km s-1.
The MEGARA observations showed that the inner structure is apparently distributed in a shell-like morphology, very different to what is observed in other born-again PNe. For example, Hubble Space Telescope (HST) and IR observations of A 30, A 58 and A 78 have revealed that the H-deficient material ejected during the VLTP has a marked bipolar morphology. The material in the born-again ejecta of these PNe is distributed in a disk-like structure and a bipolar ejection that resembles a jet (Borkowski et al. 1993; Borkowski et al. 1995; Clayton et al. 2013; Fang et al. 2014). In particular, for the cases of the more evolved born-again PN A 30 and A 78, the ring-like structure appears to have been disrupted by the complex interactions with the stellar wind and ionizing photon flux from their CSPNe (see Toalá et al. 2021, and references therein).
Our group presented the first attempt to model the formation of born-again PNe in Fang et al. 2014. In that work we presented 2D radiation-hydrodynamic numerical simulations tailored to the born-again PNe A 30 and A 78 in comparison with a study of the expansion of their H-deficient clumps and filaments inside their old PNe. Those simulations demonstrated that adopting a velocity of 20 km s-1 during the VLTP can help explaining the distribution of the H-poor knots, the dynamical age (1000 yr) and evolution of A 30 and A 78. Our simulations showed that the C-rich material will be disrupted by a combination of effects. Hydrodynamical instabilities, mainly Rayleigh-Taylor will break the VLTP material into clumps and filaments. These will be subsequently ionized and photoevaporated by the increasing UV flux from the CSPN. Finally, the current fast stellar wind will also play a role in dragging the material with the denser and slower clumps remaining close to the CSPN.
In this paper we present 3D radiation-hydrodynamic numerical simulations of the formation and evolution of born-again PNe, with emphasis to HuBi 1. The simulations are use to explain the formation of HuBi 1 and to peer into its further evolution. This is assessed by adopting different initial conditions for the VLPT ejecta in the simulations (2 cases are explored). A comparison with more evolved born-again PNe is also attempted.
This paper is organized as follows. In Section 2 we present the code used to run our simulations and describe the initial conditions. Section 3 describes the different numerical results obtained from the simulations. A discussion is presented in Section 4 and a summary of the work is presented in Section 5.
2 Simulations
We used the extensively-tested radiation-hydrodynamic 3D code guacho (Esquivel et al. 2009; Esquivel & Raga 2013) to model the formation and evolution of the born-again PN HuBi 1. guacho includes a modified version of the ionizing radiation transfer presented in Raga et al. 2009. It solves the gas-dynamic equations with a second order accurate Godunov-type method, using a linear slope-limited reconstruction and the HLLC approximate Riemann solver (Toro et al. 1994) implemented on a uniform Cartesian grid.
Simultaneously with the Euler equations, we solve the rate equation for neutral and ionized hydrogen
| (1) |
where u is the flow velocity, , and are the electron, neutral hydrogen and ionized hydrogen number densities, is the recombination coefficient, is the the collisional ionization coefficient and is the H photoionization rate due to a central source. The photoionizing rate is computed with a Monte-Carlo ray tracing method, described in Esquivel & Raga 2013 and Schneiter et al. 2016.
We define the ionization fraction as
| (2) |
with the total number density defined as . The ionization fraction is used to estimate the radiative cooling, which is added to the energy equation using the prescription described in Esquivel & Raga 2013.
The simulations presented here have been performed on a 3D cartesian grid with a resolution of =(600, 600, 600) on a box of (0.60.60.6) pc3 in physical size, that is, a cell resolution of 0.001 pc. The injection cells correspond to the innermost 0.01 pc in the simulation.
2.1 Initial conditions - old PN formation
We started with an homogeneous ISM with initial density and temperatures of =1 cm-3 and 100 K, respectively. We first model the creation of the old H-rich PN of HuBi 1. For this, we first launch a slow wind corresponding to the AGB stage with mass-loss rate M⊙ yr-1 and a velocity of 15 km s-1 for a total time of yr. This creates a density distribution with a dependence with radius of as commonly obtained for the AGB phase (Villaver et al. 2002, see, e.g.,). No photoionization flux is included during this phase.
| Phase | duration | Note | |||
|---|---|---|---|---|---|
| (M⊙ yr-1) | (km s | (yr) | |||
| AGB | 15 | Run A and B | |||
| post-AGB | 2000 | 2300 | Run A and B | ||
| VLTP1 | 20 | 20 | Run A | ||
| VLTP2 | 300 | 20 | Run B | ||
| pVLTP | 360 | Run A and B |

Secondly, a post-AGB phase which creates the old PN is modeled by injecting a fast wind with a velocity of =2000 km s-1 and a mass-loss rate of M⊙ yr-1. An ionizing photon flux of s-1 is adopted for this phase. Figure 2 shows an illustration of the evolution with time of the stellar wind parameters in these two phases.
The simulation is run until the shell of the PN reaches a radius of 0.18 pc so that by the time the born-again event occurs it could reach a 0.2 pc similarly to what is currently observed in HuBi 122 2 The angular radius of HuBi 1 is 8 arcsec which is 0.2 pc (see Fig. 1) at a distance of 5.3 kpc (Frew et al. 2016).. The formation of the old H-rich PN occurs during and in Figure 2.


At this point, the fast wind has carved the AGB material into a dense shell. This interaction creates the classic adiabatically-shocked hot bubble that fills the PN (e.g., Toalá & Arthur 2016, and references therein). At the same time, the strong photon flux ionizes the material. The number density (), temperature (), gas velocity () and ionization fraction () at this point are illustrated in Figure 3.
2.2 The born-again phase and subsequent evolution


The stellar evolution model presented for HuBi 1 in Guerrero et al. 2018 predicts that its CSPN experienced a mass-loss rate during the VLTP of M⊙ yr-1. Following the multi-epoch study of the Sakurai’s Object, we will adopt a duration for the VLTP of 20 yr (Evans et al. 2020). However, the velocity of the H-poor ejected material is an unknown parameter. One might argue that as the star goes back to the region of the AGB stars in the Hertzsprung–Russell diagram, a similar velocity as that reported for those kind of stars should be adopted (Ramstedt et al. 2020, 20 km s-1; see), but the VLTP is an explosive event in nature.
To assess both scenarios we ran two simulations. Run A will be performed with km s-1 and Run B with km s-1, similar to what is observed for the H-poor ejecta in HuBi 1 (Rechy-García et al. 2020). No ionizing photon flux will be considered during this phase. Figure 2 illustrates the variations of the mass-loss rate and velocity during this phase (between and ) in comparison with the previous phases. As a result of the high-mass loss rate during the VLTP phase and its short duration we will create a dense shell surrounding the CSPN with an extension of 0.02 pc in radius.
A final post-VLTP (pVLTP) phase will be modelled by adopting the stellar wind parameters currently exhibited by the CSPN of HuBi 1 reported in Guerrero et al. 2018. A pVLTP wind velocity of km s-1 with a mass-loss rate of M⊙ yr-1 for both Run A and B. This wind is expected to sweep the VLTP ejecta creating a dense inner shell and giving rise to the double shell morphology. The ionizing photon flux of s-1 reported by Guerrero et al. 2018 will be adopted for this last phase.
Figure 2 illustrate the variations of the mass-loss rate and stellar wind velocity from the AGB phase to the pVLTP for the two simulations which corresponds to .


3 Results
Figures 4, 5, 6, 7 and 8 show the evolution with time of , , , and of the gas for the two simulations presented here, Run A and B. For simplicity, =0 has been set to the end of the VLTP in all subpanels of these figures. These subpanels thus represent snapshots at different times after the onset of the pVLTP.
Figure 4 and 5 show that the dense VLTP material expands into the low-density, hot bubble created by the previously fast wind. By 50 yr of evolution into the pVLTP phase, the two simulations show the formation of a dense shell with radius between 0.02 and 0.03 pc (Fig. 4).
It is important to note that due to the sudden variation of the stellar wind parameters and the ionizing photon flux, the inner edge of the hot bubble experiences noticeable changes. In particular, the ram pressure of the wind in the VLTP is not as high as that of the fast wind that fed the previous PN phase, which created the hot bubble (see Fig. 3 top left panel). As a result, the hot bubble falls back to smaller radii when the star evolves into the VLTP phase, creating instabilities that develop with time. Such effects are more evident in the gas velocity and pressure (Fig. 6 and 7), with turbulent structures appearing at 100 yr after the pVLTP evolution, and are still noticeable after 300 yr and to some extent in the most evolved panel at 800 yr of Run A. There is no apparent effect in the ionization fraction of these turbulent structures (see Fig. 8), implying that they are completely ionized in our simulations.
The relatively small variation in velocity between the VLTP and pVLTP phases in both simulations is not enough to produce the hydrodynamic instabilities (e.g., Rayleigh-Taylor) reported in other works (Stute & Sahai 2006; Toalá & Arthur 2016). As a consequence, our numerical results show the expansion of a smoothed shell expanding inside the old PN.
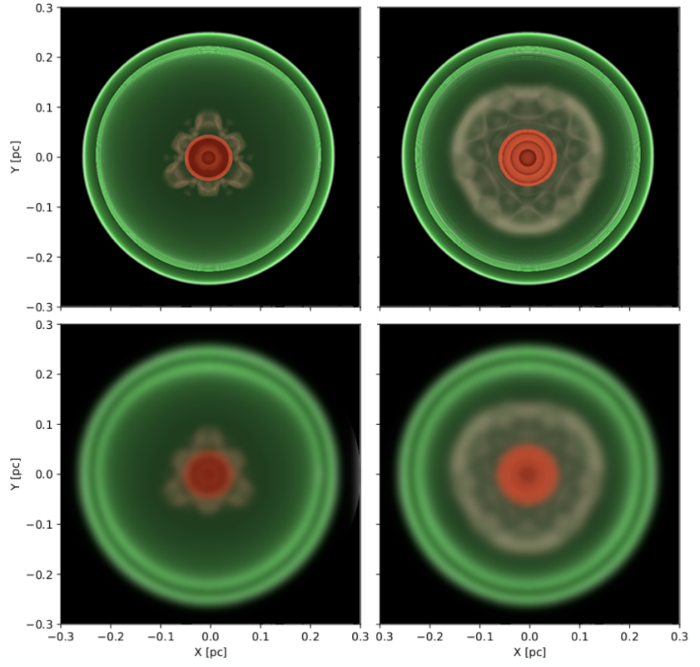
Finally volume density renderings were created to mimic nebular images for both simulations at an integration time when the inner shell has a radius of 0.05 pc. The top-left panel of Figure 9 shows the case of Run A at 600 yr after the pVLTP evolution, while the top right panel shows Run B at 100 yr of evolution. The rendered images were produced with the yt software (Turk et al 2011) that allows to create images by casting rays through the 3D volume and integrating the radiation transfer equations with a transfer function that can be selected or modified by the user. Typically, the transfer function is chosen with transparency and/or colors that depend on the value of the field that is being rendered. The images presented in Fig. 9 use an opacity that varies linearly with density (denser is more opaque), considering only the densest regions, which correspond to number densities between and .
We use a brown (low density) to green (high density) tinge for the material injected before the born-again phase, and superimposed it with a red tinge and the same opacity law for the material injected after the born-again phase. We must note that is not possible to make a quantitative comparison with the observations, as the emission detected arises from recombination and forbidden lines, which are proportional to the density squared and depend on the ionization stage of each particular element. This would require a detailed description of the ionization structure that is beyond the scope of the present paper. To allow a fairer comparison with the available NOT images, a Gaussian filter was apply to reduce the spatial resolution of the rendered images to . The synthetic images in the bottom panels of Figure 9 reproduce the double shell morphology of HuBi 1, revealing an additional clumpy intermediate structure which is present in Figure 1, particularly in the contrast enhanced [N ii] image in its right panel.
4 Discussion
The born-again phase is one of the most unknown phases of stellar evolution. Its duration seems to depend on different factors such as mixing and diffusion as discussed in Miller Bertolami et al. 2006. However, some efforts assessing the mass lost during this phase and the velocity of the ejected H-poor material have been presented in the literature (see Guerrero et al. 2018; Toalá et al. 2021, and references there). This can certainly help driving theoretical results.
The results of our simulations for HuBi 1 suggest that it is more accurate to assume that the H-poor material was ejected inside the old PN in an explosive event with velocities close as those currently observed. Run B predicts that if this is the case, the material ejected during the VLTP in HuBi 1 must have occurred 100 yr, which is rather consistent with the kinematical age estimated by Rechy-García et al. 2020. Run B also suggests that the small difference in velocity between the VLTP and the pVLTP does not allow the shell to experience the formation of hydrodynamical instabilities, in particular, Rayleigh-Taylor. As a result, the inner shell of HuBi 1 appears to be a smooth shell-like structure. Our simulations predict that the inner shell will not develop hydrodynamic instabilities capable of disrupting it. In contrast, the simulations presented in Fang et al. 2014 for A 30 and A 78 suggest that the combination of these physical processes facilitate the disruption of their dense VLTP shells. This simulation took into account the fast evolution of their central early-type [WC] stars, which currently exhibit stellar wind velocity of 3000 km s-1 and high ionizing photon fluxes.
We have shown that the relatively low ionization photon flux of 1044 s-1 suggested from the stellar atmosphere modelling of the CSPN of HuBi 1 is not able to completely ionize the born-again inner shell. In our simulations the H-poor ejecta has a ionization fraction close to 0.5. This strengthens Guerrero et al. 2018’s suggestion that the emission from this shell must come from shock physics. A careful analysis of the optical emission spectrum will address this issue (Montoro-Molina et al., in preparation).
Figure 9 suggests that the structures detected between 2 arcsec5 arcsec in the [N ii] image surrounding the born-again ejecta of HuBi 1 (see Fig. 1 right panel) have been formed as a result of the sudden and large variation of the stellar wind parameters of its CSPN. These turbulent structure appears to be completely ionized, unlike the inner shell. Indeed Figure 1 in Guerrero et al. 2018 suggests that this is the case. To explore the velocity structure of this emission, we have examined the GTC MEGARA integral field spectroscopic data published recently by our team in Rechy-García et al. 2020. The results are illustrated in Figure 10, a colour-composite picture of HuBi 1 in the [N ii] 6548,6584 emission lines where the green colour corresponds to [N ii] emission at the systemic velocity of HuBi 1, the blue colour to the approaching structure in the systemic velocity range from to km s-1, and the red colour to the receding structure in the systemic velocity range from to km s-1. Other emission lines detected in the MEGARA data cube, such H and [S ii], show similar velocity structures, but the former suffers from thermal broadening, while the later has a smaller signal-to-noise level than the [N ii] image presented here.
Figure 10 shows that the structure surrounding the inner shell of HuBi 1 has a somewhat complex velocity structure. Some emission at the systemic velocity of HuBi 1 might have formed as illustrated by our simulations, gas falling back due to the reduction in ram pressure generating instabilities in the ionized structure. However, there seems to be a bipolar structure not reported before in HuBi 1. This bipolar structure does not appear to be collimated, but extended at a certain point. A detailed analysis of the velocity of this structure using our available GTC MEGARA observations is under preparation (Montoro-Molina et al., in preparation).

4.1 Consequences for other born-again PNe
The simulation of Run A reaches a radius for the inner shell of 0.05 pc after 600 yr of evolution, which is notably different to the age of 200 yr proposed by Rechy-García et al. 2020. The model can neither reproduce the reported expansion velocities of the inner shell in HuBi 1, regardless of the injection of a pVLTP wind 20 times faster, which can not provide sufficient kinetic energy to accelerate the shell up to the observed velocities (Rechy-García et al. 2020, 300 km s-1;), whereas the momentum provided by the radiation pressure is negligible. Still, it is appropriate to discuss the numerical results of Run A as a slow expanding VLTP wind might have been the case for A 30 and A78, where after 1000 yr of evolution in the born-again phase dense knots and filaments are still located close to their CSPN with expansion velocities 50 km s-1 (Meaburn & Lopez 1996; Meaburn et al. 1998).
The 2D Radiation-hydrodynamic simulations presented in Fang et al. 2014 showed that it is possible to reproduce the morphology of the H-deficient clumps and filaments in A 30 and A 78 only if the velocity during the VLTP phase in these objects was 20 km s-1, followed by a fast subsequent evolution of the stellar wind parameters reaching terminal velocities as high as 3000 km s-1, which is what is currently reported from these sources (Guerrero et al. 2012; Toalá et al. 2015, see). The interactions between the fast pVLTP and slow VLTP winds are dominated by Rayleigh-Taylor instabilities that create a pattern of slow clumps and filaments lagging close to the CSPN, whilst evaporated material can reach velocities of a few times 100 km s-1 with distances almost reaching the outer H-rich PNe.
The notable differences between the most evolved born-again PNe discovered so far and the inside out PN HuBi 1 might suggest that the explosive VLTP might have had different injection energies. The kinetic energy imprinted in the H-deficient material ejected inside the old PN should be directly related to the He mass ignited during the VLTP (born-again) event. Assuming that the total mass ejected in these born-again PNe is the same, the kinetic energy of the H-deficient material in HuBi 1 is 30 times larger than the slowly moving (50 km s-1) dense clumps in A 30 and A 78. The later suggest that the thermonuclear conditions of the VLTP were quite different between these systems.
We are currently preparing a grid of stellar evolution models accounting for different parameters such as initial mass, rotation, metallicity, mixing length (Rodríguez-González et al. 2021, in prep.) using the Modules for Experiments of Stellar Astrophysics (Paxton et al. 2011, mesa;). These will help us to assess possible different conditions occurring during the VLTP. Furthermore, increasing the number of identified born-again PNe is most needed to shed some light into this short but unique and physically complex evolution phase of low-mass stars.
5 Summary
We presented the first 3D radiation-hydrodynamic numerical simulations of the formation and evolution of a born-again PNe, with particular application to the inside-out PN HuBi 1. We adapted the stellar wind parameters and ionization photon flux reported by Guerrero et al. 2018 for the CSPN of HuBi 1 to produce tailored numerical simulations. Since the velocity of the H-poor material ejected during the VLTP phase is unknown, two different simulations were presented to explore its effects: in Run A we adopted an expansion velocity =20 km s-1, similar to that is reported for AGB stars, while in Run B we adopted a higher velocity =300 km s-1, consistent with that reported from optical observations in HuBi 1. Our findings can be summarized as follows:
- •
Our explosive case, Run B, makes a good job reproducing the morphological features in HuBi 1. These simulations predict that the inner shell of HuBi 1 was formed as a result of the born-again event which occurred about 100 yr ago, consistent with kinematic estimations from GTC MEGARA observations. Slower ejections can not imprint the necessary kinematic energy to accelerate the H-deficient material to the observed velocity of 300 km s-1.
- •
Our simulations show that the small variation in velocity between the VLPT and the pVLTP material so far observed will not produce instabilities that break the inner shell in contrast to the more evolved born-again PNe A 30 and A 78. This produces a smooth inner shell consistent with that seeing in optical observations.
- •
The extreme changes experienced by the CSPN of HuBi 1 are obviously responsible of the double shell morphology seen in optical observations (Fig. 1 and 10). Moreover, the variation in the stellar wind parameters diminishs dramatically the wind’s ram pressure, producing noticeable changes to the adiabatically shocked hot region originally created at the first PN phase. The hot bubble falls back by the time the star enters the VLTP phase, producing turbulent structures which are observable as clumps and filaments of ionized material at intermediate regions between the two shells. We propose this is the origin of the structures detected in the [N ii] image of HuBi 1 in the intermediate regions between 2 and 5 arcsec.
- •
Our simulations demonstrate that the current photon flux of 1044 s-1 is not capable of producing the complete photoionization of the inner shell of HuBi 1. This result strengthens the suggestion of Guerrero et al. 2018 that this structure is dominated by shocks.
- •
We suggest that the explosive VLTP in HuBi 1 might have been at least 30 times more energetic than that in the born-again PNe A 30 and A 78. Dense clumps in A 30 and A 78 have been detected very close to the CSPN with velocities as low as 50 km s-1 which have survived for about 1000 yr. Such differences puts under scrutiny the physics involved in producing the VLTP and suggests a wealth of initial conditions in this scenario.
Acknowledgements
JAT thanks funding by Fundación Marcos Moshinsky (Mexico) and the Direcciónn General de Asuntos del Personal Académico (DGAPA) of the Universidad Nacional Autónoma de México (UNAM) project IA100720. V.L. gratefully acknowledges support from the CONACyT Research Fellowship program. BMM and MAG acknowledge support of the Spanish Ministerio de Ciencia, Innovación y Universidades (MCIU) grant PGC2018-102184-B-I00. AE acknowledges support from DGAPA-PAPIIT (UNAM) grant IN 109518. This work has made extensive use of NASA’s Astrophysics Data System.
Data availability
The data underlying this work are available in the article. Our results will be shared on reasonable request to the first author.
References
- Borkowski et al. (1995) Borkowski, K. J., Harrington, J. P., & Tsvetanov, Z. I. 1995, ApJ, 449
- Borkowski et al. (1993) Borkowski, K. J., Harrington, J. P., Tsvetanov, Z., et al. 1993, ApJ, 415, L47
- Clayton et al. (2013) Clayton, G. C., Bond, H. E., Long, L. A., et al. 2013, ApJ, 771, 130
- Esquivel & Raga (2013) Esquivel, A. & Raga, A. C. 2013, ApJ, 779, 111
- Esquivel et al. (2009) Esquivel, A., Raga, A. C., Cantó, J., et al. 2009, A&A, 507, 855
- Evans et al. (2020) Evans, A., Gehrz, R. D., Woodward, C. E., et al. 2020, MNRAS, 493, 1277
- Fang et al. (2014) Fang, X., Guerrero, M. A., Marquez-Lugo, R. A., et al. 2014, ApJ, 797, 100
- Freeman et al. (2014) Freeman, M., Montez, R., Kastner, J. H., et al. 2014, ApJ, 794, 99
- Frew et al. (2016) Frew, D. J., Parker, Q. A., & Bojičić, I. S. 2016, MNRAS, 455, 1459
- Gil de Paz et al. (2018) Gil de Paz, A., Carrasco, E., Gallego, J., et al. 2018, Proc. SPIE, 10702, 1070217
- Górny & Tylenda (2000) Górny S. K., Tylenda R., 2000, A&A, 362, 1008
- Guerrero et al. (2018) Guerrero, M. A., Fang, X., Miller Bertolami, M. M., et al. 2018, Nature Astronomy, 2, 784
- Guerrero et al. (2012) Guerrero, M. A., Ruiz, N., Hamann, W.-R., et al. 2012, ApJ, 755, 129
- Iben et al. (1983) Iben, I., Kaler, J. B., Truran, J. W., et al. 1983, ApJ, 264, 605
- Meaburn et al. (1998) Meaburn, J., Lopez, J. A., Bryce, M., et al. 1998, A&A, 334, 670
- Meaburn & Lopez (1996) Meaburn, J. & Lopez, J. A. 1996, ApJ, 472, L45
- Miller Bertolami (2016) Miller Bertolami, M. M. 2016, A&A, 588, A25
- Miller Bertolami et al. (2006) Miller Bertolami, M. M., Althaus, L. G., Serenelli, A. M., et al. 2006, A&A, 449, 313
- Paxton et al. (2011) Paxton, B., Bildsten, L., Dotter, A., et al. 2011, ApJS, 192, 3
- Raga et al. (2009) Raga, A. C., Henney, W., Vasconcelos, J., et al. 2009, MNRAS, 392, 964
- Ramstedt et al. (2020) Ramstedt, S., Vlemmings, W. H. T., Doan, L., et al. 2020, A&A, 640, A133
- Rechy-García et al. (2020) Rechy-García, J. S., Guerrero, M. A., Santamaría, E., et al. 2020, ApJ, 903, L4
- Sander et al. (2015) Sander, A., Shenar, T., Hainich, R., et al. 2015, A&A, 577, A13
- Schneiter et al. (2016) Schneiter, E. M, Esquivel, A., Villarreal-D’Angelo, C. S., Velázquez, P. F, Raga, A.C, Costa, A., 2016, MNRAS, 457, 1666
- Schönberner (1979) Schoenberner, D. 1979, A&A, 79, 108
- Soker (1994) Soker, N. 1994, AJ, 107, 276
- Stute & Sahai (2006) Stute, M. & Sahai, R. 2006, ApJ, 651, 882
- Tafoya et al. (2017) Tafoya, D., Toalá, J. A., Vlemmings, W. H. T., et al. 2017, A&A, 600, A23
- Toalá et al. (2021) Toalá, J. A., Jiménez-Hernández, P., Rodríguez-González, J. B., et al. 2021, arXiv:2102.12884
- Toalá & Arthur (2018) Toalá, J. A. & Arthur, S. J. 2018, MNRAS, 478, 1218
- Toalá & Arthur (2016) Toalá, J. A. & Arthur, S. J. 2016, MNRAS, 463, 4438
- Toalá et al. (2015) Toalá, J. A., Guerrero, M. A., Todt, H., et al. 2015, ApJ, 799, 67
- Toro et al. (1994) Toro, E. F., Spruce, M., & Speares, W. 1994, Shock Waves, 4, 25
- Turk et al (2011) Turk M. J., Smith B. D., Oishi J. S., Skory S., Skillman S. W., Abel T., Norman M. L., 2011, ApJS, 192, 9
- Villaver et al. (2002) Villaver, E., García-Segura, G., & Manchado, A. 2002, ApJ, 571, 880