Is the Bremer Deep Field reionised, at z 7?2021Is the Bremer Deep Field reionised, at z 7?–References
Abstract
We show herein that the population of star forming galaxies in the Bremer Deep Field (BDF) have enough ionising power to form two large ionised bubbles which could be in the process of merging into a large one with a volume of 14000 cMpc3. The sources identified in the BDF have been completed with a set of expected low luminosity sources at z 7. We have estimated the number of ionising photons per second produced by the different star forming galaxies in the BDF. This number has been compared with the number that would be required to ionise the bubbles around the two overdense regions. We have used, as reference, ionising emissivities derived from the AMIGA cosmological evolutionary model. We find that even using the most conservative estimates, with a Lyman continuum escape fraction of 10 the two regions we have defined within the BDF would be reionised. Assuming more realistic estimates of the ionising photon production efficiency, both bubbles would be in the process of merging into a large reionised bubble, such as those that through percolation completed the reionisation of the universe by z = 6. The rather small values of the escape fraction required to reionise the BDF are compatible with the low fraction of faint Ly emitters identified in the BDF. Finally, we confirm that the low luminosity sources represent indeed the main contributors to the BDF ionising photon production.
Keywords:
cosmology: dark ages, reionisation, first stars; galaxies: starburst; galaxies: high-redshift;1 Introduction
Many high redshift sources are known from various surveys made in the past decades. Most of the detections have been done through broad band searches (Stark et al. 2010; Bouwens et al. 2010; Bouwens et al. 2006; Steidel et al. 2005), but also with narrow band filters tuned to the Lyman line (Chanchaiworawit et al. 2017; Ouchi et al. 2008; Ouchi et al. 2010). However the number of spectroscopic confirmations of the sources detected in the various surveys is rather scarce (Calvi et al. 2019; Castellano et al. 2018; Harikane et al. 2018). In particular, Vanzella et al. 2011 discovered spectroscopically two sources in the Bremer Deep Field (BDF) at redshift 7. Furthermore, Castellano et al. 2018 detected an additional source at a similar redshift within the same field.
There are quite a few high-z proto-clusters discovered in the past few years (Castellano et al. 2016; Chanchaiworawit et al. 2019; Toshikawa et al. 2012; Harikane et al. 2018; Oteo et al. 2018; Abdullah et al. 2018; Jiang et al. 2018; Higuchi et al. 2019; Harikane et al. 2019). Their importance in the reionisation process has indeed been recognised. Interestingly, the relative fraction of volume occupied by proto-clusters increases with (Chiang et al. 2017). Besides, proto-clusters represent a collection of sources that together could produce sufficient ionising photons, such that a fraction of them could escape contributing to the reionisation of the universe through the creation of ionised bubbles.
Papers discussing the presence of ionised bubbles are appearing more often lately, such as Tilvi et al. 2020 that shows evidence of a bubble ionised by 3 Lyman alpha emitting galaxies at . Also, Meyer et al. 2020 have found a double peaked Ly source producing its own ionised bubble at . We have also recently characterised an ionised bubble powered by a proto-cluster at (Rodríguez Espinosa et al. 2020). Finally, Castellano et al. 2018 have explored the conditions around the three Ly Emitters (LAE) they had identified in the Bremer Deep Field (BDF). While the detection of three LAE’s at would point to the presence of a large enough re-ionised bubble allowing for Ly to escape, the non-detection of any Ly emission from other 14 Lyman Break Galaxies (LBG) identified in the field was apparently at odds with this scenario. Castellano et al. 2018 analysed the possibility that the three Ly Emitters (LAE) in the BDF could produce large ionised bubbles around them, concluding that only after a very long period of continuous star formation, and assuming rather large values of the ionising continuum escape fraction, the ionised bubbles would reach such a size that Ly photons would be able to escape the region unaffected by scattering in the intergalactic medium (IGM). They considered different options to explain the leakage of Ly photons from only the three bright emitters, assuming that the faint LBGs could be more evolved, or located in the outskirts of the overdense region, still surrounded by neutral gas.
In this paper we re-examine the data in Castellano et al. 2018 to check whether the complete collection of sources in the two overdense regions of the BDF would be capable of reionising two large bubbles around them. To this end, we have added the ionising flux from all the sources in each of the two regions of the BDF, including a set of still undetected, yet expected, low luminosity sources.
As we will discuss later, cosmological evolutionary models require only very low values of the ionising continuum escape fraction to explain the complete reionisation of the universe by (around 5% to 10% in average). These low values of are compatible with low values of the Ly photon escape fraction in the line of sight, as shown by Chisholm et al. 2018. As a good example, there is the prototypical Lyman Break Galaxy analogue Haro 11, with and values reported by Verhamme et al. 2017. Chisholm et al. 2018 considered indeed that in scenarios with low extinction, both and should be intrinsically very similar, though the scattering of Ly photons by neutral clouds yields a non-predictable behaviour of the Ly emission (see for example Dijkstra et al. 2016). If the remain low, in line with the expected range, EW(Ly) values would be well below the detection limit reported by Castellano et al. 2018 (around 30 Å at ). Furthermore, while the destruction, by resonant scattering, of Ly photons is a complex process, that depends largely on both the geometry and kinematics of the neutral gas close to the star-forming regions, we think that the lack of Ly emission from the LBGs does not prevent the leakage of ionising photons when the full solid angle is considered. Therefore, the LBG galaxies could contribute, in a significant way, to the reionisation of the IGM even if they do not show Ly emission along the line of sight.
To estimate the size of the ionised bubbles in the BDF, we have considered the two pointings reported by Castellano et al. 2018. Then, we have derived the Ly escape fraction of the three LAEs using the calibration by Sobral & Matthee 2019. Knowing the and the Ly fluxes from these three bright galaxies, we have derived the number of intrinsic ionising continuum photons. As for the medium and low luminosity sources, their ionising fluxes have been derived from the UV continuum using our own evolutionary models. Finally, we have used the AMIGA model (Salvador-Solé et al. 2017) to derive values of the expected ionising emissivity at z , with which we have compared the ionising fluxes from the BDF.
Section 2 reviews the BDF field and the different sources within it. In particular, we have done an estimation of the number of low luminosity sources, based on the surface density derived by Bouwens et al. 2015 at z . Section 3 shows the derivation of the number of ionising continuum photons produced by the different sources in the region. Finally, in Section 4 we use the expected emissivity at from the AMIGA model (Salvador-Solé et al. 2017), and considering the volumes of both regions, we compute the minimum number of continuum ionising photons required to ionise each region and explore the possible fomation of an even larger reionised bubble enclosing most of the BDF. We finish with the Conclusions in Section 5. All units are in concordance cosmology units, namely ( = 0.7, =0.3, and Km/s/Mpc). Magnitudes are given in the AB system (Oke & Gunn 1983). For cosmological calculations we have used the CosmoCal webtool kindly made available by Wright 2006, and the Cosmological Calculator for a Flat Universe built by Nick Gnedin at Fermilab (https://home.fnal.gov/gnedin/cc/).
2 Characterising the observed Bremer Deep Field (BDF)
The fields observed by Vanzella et al. 2011 and Castellano et al. 2018 were relatively small, around pMpc2 each, much smaller than the full Bremer Deep Field (BDF), which extends over pMpc2. The observations consisted of two pointings around BDF 521 and BDF 3299, respectively. In what follows we will analyse separately the population of sources in these two pointings. As indicated in Castellano et al. 2016 each specific pointing covered 3.94 and 3.82 squared arcmin, respectively. Castellano et al. 2018 indicated that most of the galaxies identified should be within the redshift range . We have derived the volumes assuming the difference in distances between these limiting redshifts. Making use of the Cosmocalc (Wright 2006), and of the Cosmological Calculator for a Flat Universe by N. Gnedin we arrive to the volumes of each of the two pointings, namely 1718 cMpc3 for the region containing BDF 521 and 1660 cMpc3 for the region containing BDF 3229.

Within these two specific pointings Castellano et al. 2018 found 17 sources, three of which are Ly emitters, while the rest are Lyman Break Galaxies with no Ly emission detected. For the three LAEs there is spectroscopy (Castellano et al. 2018; Vanzella et al. 2011), from which we have used both the Ly fluxes and their equivalent widths.
| MAB range | Surface Density | # Group 1 | # Group 2 | # Corrected 1 | # Corrected 2 |
|---|---|---|---|---|---|
| arcmin-2 | 3.94 arcmin2 | 3.82 arcmin2 | overdensity | overdensity | |
| 27.45 - 27.95 | 3.17 | ||||
| 27.95 - 28.45 | |||||
| 28.45 - 28.95 | |||||
| 28.95 - 29.45 | |||||
| 29.45 - 29.95 |
2.1 Number of low luminosity sources in the BDF
Low luminosity galaxies are recognised as key elements in the process of re-ionising the Universe (Bouwens et al. 2015; Robertson et al. 2015; Rodríguez Espinosa et al. 2020). To derive the number of low luminosity sources expected in the BDF we have used the typical surface density values of high-redshift star-forming galaxies given in Bouwens et al. 2015 for the universe at , as listed in their Appendix Table A1. The surface density and number of sources are included, for completeness, in Table 1. Castellano et al. 2016 also claim that the overdensity in the observed field ranges from 3 to 4. Thus, we will assume an overdensity of 3.5 in what follows. Therefore, the derivation of the number of low luminosity sources has been done multiplying the surface density, in number of sources per arcmin2, by the surface of the observed fields, 3.94 arcmin2 and 3.82 arcmin2, respectively. Then, the average number of low luminosity sources in the BDF has been multiplied by 3.5, which is the average overdensity in the two small BD Fields that we have assumed according to Castellano et al. 2016. The results are given in Table 1. Note that, the lowest luminosity in this case, m, corresponds to an absolute rest-frame UV magnitude of M. It has been shown, that there are no cut offs in the UV luminosity function down to M (Bouwens et al. 2017; Yue et al. 2018). Thus the results obtained herein for the low luminosity sources are rather conservative. Finally, we would like to mention that using the surface densities from Bouwens et al. 2015 we should expect to find barely one source brighter than 25.95. Note that, as expected, in the reduced BDF there is indeed only one source with mAB = 25.97, which is BDF2883.
| Name | Group | EWo | FluxLyα | LLyα | LLyα,intr | Q | |
|---|---|---|---|---|---|---|---|
| Å | erg s-1 | erg s-1 | erg s-1 | s-1 | |||
| BDF521 | 1 | ||||||
| BDF2195 | 1 | ||||||
| BDF3299 | 2 |
3 Number of ionising continuum photons from the sources in the BDF
To check whether the entire collection of sources reported in Castellano et al. 2018, with the addition of the low luminosity sources that we have derived, is capable of producing two ionised bubbles or even a large one encompassing the whole region, we have first computed the number of ionising continuum photons 1) from the three LAEs, 2) from the rest of the galaxies reported by Castellano et al. 2018, that we will call mid luminosity sources, and 3) from the expected low luminosity sources that we have derived from the field surface density at (Bouwens et al. 2015).

3.1 Number of Lyman continuum photons from the three LAEs in the BDF
There are three Ly emitting galaxies in the BDF, two BDF521 and BDF3299, reported by Vanzella et al. 2011 and an additional one, BDF 2195, identified by Castellano et al. 2018. These three sources have redshifts derived from the spectroscopy, namely for BDF521 and BDF2195 , and for BDF3299 (Castellano et al. 2018; Vanzella et al. 2011). Moreover, for these sources we have also the measured rest-frame equivalent widths (EWo) (Castellano et al. 2018). To derive the number of ionising photons emitted per second from the observed Ly fluxes we need first to estimate the Ly escape fraction, . Sobral & Matthee 2019 derived a correlation between the Ly equivalent width and the escape fraction of high-redshift galaxies, yielding an empirical relation of both parameters. Using that relation we have derived the values of for the 3 LAEs. From the escape fractions and the observed Ly fluxes we get the intrinsic Ly luminosities. Finally, we have computed the effective number of ionising photons per second (Q), i.e. the value corresponding to the intrinsic Ly luminosities assuming case B conditions, using the expression erg s-1 (Osterbrock 1989). This relation does not depend on the properties of the ionising stars, nor on evolutionary models, but just on the physical conditions of the gas, and is based on a ratio which is usually assumed for star-forming regions (see Dopita & Sutherland 2003 and Hayes 2019). The results are listed in Table 2. Note that the intrinsic number of Lyman continuum photons (Q) being emitted by the massive stars will be larger by a factor , since the escaping LyC photons do not participate in the ionisation of the gas traced by the Ly emission.
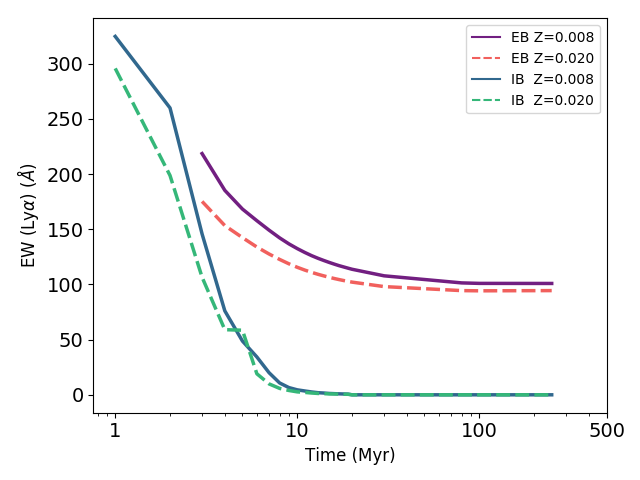
We want to remark that the correlation by Sobral & Matthee 2019 implies that the intrinsic values of the Ly equivalent widths converge in average around EW(Ly) Å. Indeed, most of the galaxies used to derive this correlation show intrinsic (once corrected from the escape fraction) EW(Ly) values within the range Å. These high equivalent width values can only be achieved when stars with very high ionising power dominate the overall emission. We show in Fig. 2 (top) the predicted evolution of EW(Ly) by Otí-Floranes & Mas-Hesse 2010 for a very short–lived starburst, and for a long–lasting episode forming massive stars at a constant rate during hundreds of Myr (a similar behaviour was presented by Charlot & Fall 1993 with a diferent set of models). Values of EW(Ly) above 200 Å are predicted only during the first Myr after the onset of a massive star formation episode, but are not compatible with a starburst having formed stars at a stable rate during more than around 50 Myr, at least for metallicities above . Most of the Ly emitters at high redshift analysed by Sobral & Matthee 2019 should therefore be experiencing very young massive star formation episodes, or a sudden, recent increase of their otherwise lower, long lasting star formation rate.
The ionising power of a massive star cluster is generally defined in the literature as = Q / L1500, in units of erg-1 Hz (see Mas-Hesse & Kunth 1991) for an analysis of the evolution of the equivalent parameter as a function of the star formation scenario). Since we are dealing with Ly equivalent widths in Å, the following conversion applies: EW(Ly) (Å). The average intrinsic value derived by Sobral & Matthee 2019, EW(Ly) Å, corresponds to log () = 25.43 erg-1 Hz. We show in Fig. 2 (bottom) the evolution of for an instantaneous burst and an extended episode of star formation.
3.2 The number of Lyman continuum photons from the medium Luminosity galaxies in the BDF
| Name | Group | MAB | L1500 | Q | |
|---|---|---|---|---|---|
| erg s-1 cm-2 Å-1 | erg s-1 Å-1 | s-1 | |||
| BDF2009 | 1 | 26.89 | 13.75 | 6.89 | 0.65 |
| BDF994 | 1 | 27.11 | 11.23 | 5.69 | 0.53 |
| BDF2660 | 1 | 27.27 | 9.69 | 4.91 | 0.46 |
| BDF1310 | 1 | 27.32 | 9.26 | 4.69 | 0.44 |
| BDF187 | 1 | 27.33 | 9.17 | 4.65 | 0.43 |
| BDF1899 | 1 | 27.35 | 9.00 | 4.56 | 0.42 |
| Total Group 1 | 2.930.15 | ||||
| BDF2883 | 2 | 25.97 0.08 | 32.10 | 16.08 | 1.51 |
| BDF401 | 2 | 26.43 0.08 | 21.01 | 10.53 | 0.99 |
| BDF1147 | 2 | 27.26 | 9.78 | 4.72 | 0.46 |
| BDF2980 | 2 | 27.30 | 9.43 | 4.72 | 0.44 |
| BDF647 | 2 | 27.31 | 9.34 | 4.68 | 0.44 |
| BDF2391 | 2 | 27.33 | 9.17 | 4.59 | 0.43 |
| BDF1807 | 2 | 27.36 | 8.92 | 4.47 | 0.42 |
| BDF2192 | 2 | 27.40 | 8.60 | 4.31 | 0.41 |
| Total Group 2 | 5.110.64 |
To derive the number of ionising continuum photons generated by the Lyman Break Galaxies in the BDF, we have computed first their luminosities in the rest UV band. We expect that all the sources are within a redshift range . This assumes that the galaxies in the observed BDF are part of the same structure (Castellano et al. 2018). Indeed, as there is no spectroscopic confirmation, precise redshifts of the sources are not known. For convenience, we will assume the central wavelength of the Y105 filter, used for their discovery, as corresponding to the continuum at rest 1310 Å, at the redshift of 7.008. We have derived the directly from the AB magnitudes given by Castellano et al. 2018 correcting the fluxes to the rest-frame wavelength, and computing assuming that is valid for all galaxies. We have assumed that (corresponding to the mean UV continuum slope expected from a population of young, massive stars, with no extinction), and have used the predictions from the evolutionary models of Otí-Floranes & Mas-Hesse 2010, as available in their webtool11 1 http://sfr.cab.inta-csic.es/index.php, to estimate the number of Lyman continuum photons being produced by the stars, for each value of the UV continuum luminosity. This webtool allows to estimate the intrinsic number of continuum ionising photons emitted by the starburst as a function of various parameters, including , and for different star formation scenarios.
Since the LBGs have no Ly emission detected, we do not have any hint that these galaxies could be experiencing a very young star formation episode. If we assume these galaxies are in any case experiencing a recent, or still active, episode of massive star formation, their intrinsic EW(Ly) (or ) values should be in between the predictions for the two scenarios considered in Fig. 2: a very young instantaneous burst or an extended episode having already reached an equilibrium between the birth an death of the most massive stars, i.e., active during more than around the last 50M̃yr. After this time, the EW(Ly)ẽvolves very slowly and can be considered constant for up to around 1G̃yr, longer than the age of the universe at (see also the predictions by Charlot & Fall 1993). Otí-Floranes & Mas-Hesse 2010 predict that the Ly equivalent width would converge to EW(Ly) Å (or log() erg-1 Hz) for metallicities in the range . The weak dependence on metallicity is related to the fact that as the massive stellar population stabilises with time, both the ionising and the UV continuum flux of low metallicity stars increase when compared to solar metallicity, so that the effect on the EW(Ly) is partially compensated.
We have therefore assumed as our initial scenario the more conservative option of an extended star forming process having reached the equilibrium phase. In Table 3 we list the derived luminosities at rest 1500 Å, , and the corresponding number of ionising continuum photons (Q) value, as estimated with the webtool for extended episodes at 250 Myr, assuming an intrinsic EW(Ly) Å. Note that we have corrected Q from the standard 30% destruction factor assumed by the Otí-Floranes & Mas-Hesse 2010 models, not applicable to high-redshift, low dust galaxies. We insist that since we are dealing with equivalent widths, which are tracing the ionising power per UV luminosity unit, our estimates are essentially independent on the precise history of star formation, but are only scaled to the UV continuum luminosity. The same Q values would be derived for star formation episodes with stable rates during the last 50 to 500 Myr. On the other hand, the predictions for an instantaneous burst should provide the expected upper limit if the star formation rate has suffered a very recent, significant increase in the last Myr.
The assumed intrinsic Ly value (EW(Ly) Å, or log erg-1 Hz) is very similar to the canonical values of Kennicutt 1998, log = 25.11 erg-1 Hz (see Bouwens et al. 2016). We want to stress that most of these values are well constrained by the predictions of our evolutionary models as shown in Fig. 2.
| mAB | L1500 | Q | Q | |
|---|---|---|---|---|
| s-1 cm-2 Å-1 | s-1 | s-1 | s-1 | |
| 27.70 | 6.74 | 3.38 | 3.64 | 3.53 |
| 28.20 | 4.25 | 2.13 | 3.52 | 3.41 |
| 28.70 | 2.68 | 1.34 | 2.20 | 2.14 |
| 29.20 | 1.69 | 0.85 | 4.72 | 4.57 |
| 29.70 | 1.07 | 0.54 | 2.42 | 2.35 |
| Total | 16.49 | 15.99 |
3.3 The output from the low luminosity sources
Likewise, we have derived the number of Lyman continuum photons for the expected, non-detected, lower luminosity sources, which play an essential role in producing the ionising photons required to re-ionise the Universe (Bouwens et al. 2015; Higuchi et al. 2019; Tilvi et al. 2020). First, we have computed the luminosity at 1500 Å corresponding to the middle AB magnitude for each of the magnitude ranges listed in Table 1, following the same procedure as in the previous section. Thus, using a similar methodology as in the case of the medium luminosity galaxies, we have derived the expected number of ionising continuum photons corresponding to each AB magnitude bin, considering the total number of expected galaxies in each magnitude range as listed in Table 1. We list in Table 4 the derived number of intrinsic ionising continuum photons expected from the low luminosity galaxies. When compared with the contributions by the LAEs and LBGs in the sample, it becomes evident that faint galaxies indeed dominate the release of ionising photons to the IGM, as already proposed by Bouwens et al. 2016, Castellano et al. 2018 and Robertson et al. 2013. We would like finally to remind that these estimates should be considered as lower limits, since we have assumed extended star formation episodes in their equilibrium phase, as for the LBGs in the previous section, with canonical values for the ionising photon production efficiency. We’ll discuss in Sect. 4.1 the effect of other possible scenarios.
| Q | Q | |
|---|---|---|
| LAEs | ||
| Mid Luminosity | ||
| Low Luminosity | ||
| Total |
4 Discussion
A non-zero Lyman continuum escape fraction implies that the escaping photons will be able to ionise regions farther out from the galaxy or galaxies that contain the massive stars producing the ionising photons. Adding to the number of ionising continuum photons produced by the LAEs the contribution by the medium and low luminosity star forming galaxies for both Group 1 and Group 2 in the BDF, we arrive to a total number of ionising continuum photons of s-1, for Group 1 and s-1 for Group 2, as listed in Table 5. We remark that for the LAEs we don’t yet know the intrinsic number of ionising continuum photons emitted per second, since it depends on the actual LyC escape fraction.
The next step is to derive the minimum number of ionising continuum photons necessary to fully ionise the volumes of both Group 1 and Group 2. We get these values by multiplying the ionising emissivities derived from the AMIGA model (Salvador-Solé et al. 2017) by the volumes of Group 1 and Group 2. AMIGA, the Analytic Model of Intergalactic-medium and Galaxies, is a very complete and detailed self-consistent model of galaxy formation, particularly well suited to monitor the intertwined evolution of both luminous sources and the IGM. It computes the instantaneous emission at all the relevant wavelengths of normal galaxies, including their intrinsic ionising power, using the evolutionary synthesis models by Bruzual & Charlot 2003, assuming a Salpeter Initial Mass Function. The parameters in the AMIGA model have been tuned to reproduce as well as possible the properties of high redshift star forming galaxies, including the contribution of very low metallicity Pop III stars in the early epochs. Therefore, the average ionising emissivities derived from AMIGA should provide a fair estimate of the number of ionising continuum photons necessary to ionise the IGM at . AMIGA distinguishes between the most usual case of single reionisation, plus the less usual case of double reionisation. These emissivities, as derived from AMIGA, are 0.26 s for the single reionisation scenario, and 0.36 s for the double reionisation case.
Though the AMIGA simulations include already the presence of clumpiness, the predicted emissivities correspond to average values over the IGM at . Since the two regions we are considering in the BDF seem to be overdense by a factor 3 – 4 (Castellano et al. 2016), we consider that the density of ionising photons should also be larger by a factor to fully reionise the local IGM. We have therefore multiplied the emissivities derived from AMIGA by 3.5 to properly take this effect into account. Moreover, since the average ionised fraction of the IGM predicted by AMIGA at z is only for both the single and the double reionisation scenarios, we have divided the emissivities by this value to account for a fully reionised IGM.
The emissivities after these corrections are 1.28 s for single reionisation and 1.75 s for double reionisation. Finally, multiplying these emissivities by the volumes of each of the Groups we derive the minimum number of continuum ionising photons per second required to completely ionise those volumes. The resulting values are 2.20 s-1 for Group 1 and 2.12 s-1 for Group 2 in the case of single reionisation. For the case of double reionisation the values are 3.01 s-1 for Group 1 and 2.91 s-1 for Group 2, as listed in Table 6.
The total number of photons available for reionising the circumgalactic medium (CGM) will depend on the Lyman continuum escape fraction, . We can constrain the average value required to fully reionise the volumes around Group 1 and Group 2 by comparing the yield of ionising photons we have derived with the predictions by AMIGA, i.e., by solving equation 1:
| (1) |
The first term of equation 1 corresponds to the intrinsic number of ionising continuum photons produced by the massive stars in the medium and low luminosity galaxies. The second term concerns the LAEs. In the case of the LAES, to derive the intrinsic number of Lyman continuum photons we have to divide the effective number by . Then, we multiply these two terms by the Lyman continuum escape fraction to get the number of continuum ionising photons available to ionise the IGM. Finally, the term at the other side of equation 1 is the emissivity derived from the AMIGA model, multiplied by the volumes of each Group, and corrected by both the overdensity and ionisation fraction at .
| s-1 | s-1 | |||
| Group 1 | 2.20 0.09 | 3.01 0.09 | 0.08 | 0.10 |
| Group 2 | 2.12 0.08 | 2.91 0.08 |
The results, as shown in Table 6, indicate that the volumes of Group 1 and Group 2 in the BDF would be completely ionised if the escape fractions of Lyman continuum photons are as low as 0.08 for Group 1 and 0.12 for Group 2, in the case of single reionisation. For the case of double reionisation the two groups would be fully ionised if the are 0.10 and 0.14 respectively. These are rather low values of the average Lyman continuum escape fractions. Our method allows to constrain the average value, but we want to stress that values for specific galaxies can vary significantly. Finkelstein et al. 2019 proposed that should be inversely correlated with the halo mass of the individual galaxies, thus becoming significantly higher for galaxies with M⊙ (see their Figure 2). Since the main contributors to the ionising power in the BDF are the low luminosity galaxies, we interpret our results in the sense that the derived values should represent the typical values for the low mass galaxies.
Such low values of are consistent with the fact that there are only three LAEs in the BDF. According to Chisholm et al. 2018 we should expect similar low values of and in galaxies with low extinction by dust, as should be the case at (Hayes et al. 2011). With an average , and following (Chisholm et al. 2018) and the calibration by Sobral & Matthee 2019 we would expect EW(Ly) Å, which is too low to be detected on the BDF observations. Nevertheless, the large dispersion expected in (Dijkstra et al. 2016) would support the presence of some galaxies with larger values of the Ly escape fraction, which would come out as the the three LAEs identified in the BDF.
4.1 A large ionised bubble in the BDF
We want to stress that our analysis has been rather conservative when deriving the number of intrinsic ionising photons emitted by the galaxies in the BDF. The calibration of vs. the rest–frame EW(Ly) by Sobral & Matthee 2019 for the LAEs implies an average intrinsic value of the Ly equivalent around Å, corresponding to log erg-1 Hz, while Harikane et al. 2018 finds an average log erg-1 Hz (and ) for a large sample of LAEs at . On the other hand, as discussed above, the assumed intrinsic Ly value EW(Ly) Å for the LBGs corresponds to log erg-1 Hz. Bouwens et al. 2016 derived average values log erg-1 Hz for a sample of galaxies with Spitzer H IRAC observations at , with an intrinsic scatter of dex for individual galaxies. The UV continuum bluest galaxies in the sample reached log erg-1 Hz, indicating that cannot be in excess of 0.13. Stark et al. 2015 derived log erg-1 Hz from the CIV observations of A1703-zd6, a galaxy at with Ly EWo Å (Schenker et al. 2012), and Stark et al. 2017 derived Log erg-1 Hz for three luminous () galaxies at , 7.48 and 7.73. Moreover, Bouwens et al. 2015 estimate log = erg-1 Hz for faint galaxies at , with an associated , to properly match the reionisation timeline of the Universe. Finally, Wilkins et al. 2016 constrained log during the reionisation epoch to the range erg-1 Hz by combining the BlueTides cosmological hydrodynamical simulation with a range of stellar population synthesis models.
Large values of the intrinsic EW(Ly) or can be associated to very young star formation episodes (or to a sudden increase of the star formation rate in the last Myr), or either to the presence of very low metallicity stars. Schaerer 2003 showed that for metallicities down to the intrinsic values of EW(Ly) can reach up to EW(Ly) Å for stable star formation rates in the equilibrium phase, and even higher values for lower metallicities and/or larger values of the Initial Mass Function upper mass limit. Combining all these observational results and model predictions, we consider that the intrinsic EW(Ly) values of the LAEs, LBGs and low luminosity galaxies we have used in our calculations could realistically be increased by a factor 4 at most. Keeping , as constrained by the results discussed above, this would lead to a total number of ionising continuum photons released to the IGM of s-1, for Group 1 and s-1 for Group 2, i.e., a total Q s-1.
Comparing these numbers with the AMIGA emissivities listed in Table 6 we conclude that an IGM volume 4.6 times (single reionisation) or 3.4 times (for double reionisation) larger than the volumes of Group 1 and Group 2 together, would become reionised assuming larger, but still realistic, values of the ionising power for the star–forming galaxies in the two BDF overdensities. Since the volume comprising both overdensities (extended over 30 arcmin2) would be roughly a factor larger than the added volume of both groups, there would be enough ionising photons released to the IGM for the two ionised bubbles around them to merge in a single, very large re-ionised bubble.
We conclude that realistic, rather small values of the Lyman continuum escape fractions would allow to completely reionise the overdense regions of the BDF within a single, large ionised bubble, such as those that through percolation completed the reionisation of the universe by . On the other hand, the still required presence of neutral gas around the star forming regions in these galaxies, evidenced by the low values of the escape fractions, would explain the scarcity of detected faint Ly emitters, since the observed EW(Ly) values would remain, on average, rather low.
5 Conclusions
We have looked for the reionisation status of the Intergalactic Medium around two overdense groups of star–forming galaxies in the Bremer Deep Field. To this end, we have considered all the sources in the BDF, including galaxies that are expected but have not yet been detected. These are low luminosity sources, for which we have estimated their numbers in the BDF assuming the average surface density at from Bouwens et al. 2015 and an overdensity of , as estimated by Castellano et al. 2016. Then we have derived the number of intrinsic ionising photons from the bright Ly emitters and the medium luminosity Lyman Break Galaxies identified by Castellano et al. 2018, to which we have added the contribution of the expected low luminosity sources. Even adopting conservative estimates for the ionising continuum photons produced by the massive stars in all these sources, known and expected, we conclude that there would be enough photons to ionise two large bubbles, one per Group in the BDF, with average LyC escape fraction as low as for Group 1 and 0.12 for Group 2. With less conservative, but more realistic, estimates of the ionising power, the two bubbles would be merging into a large ionised bubble comprising most of the galaxies in the BDF. These low values of the LyC escape fraction indicate that there are still substantial amounts of neutral hydrogen surrounding the star forming regions in these galaxies. The inferred low values of the would explain the scarcity of faint Ly emitters found within the nonetheless completely reionised bubbles. We confirm previous hints indicating that the low luminosity sources are indeed the ones that dominate the reionisation of the BDF. Finally, we note that a scenario with a double reionisation would require only slightly larger LyC escape fractions than the more commonly assumed single reionisation.
Data Availability
All the LAEs Fluxes and restframe EW(Ly) values, as well as the medium Luminosity LBG magnitudes are available in Castellano et al. 2018. The low luminosity sources data are new in this paper.
Acknowledgements
We are very grateful to Sonia Torrejón de Pablos for having computed the EW(Ly) predictions plotted in Figure 2. We are also very grateful to Dr. Alberto Manrique (U. of Barcelona) for sharing his values of the AMIGA emissivities. JMRE acknowledges the Spanish State Research Agency under grant number AYA2017-84061-P and is indebted to the Severo Ochoa Programme at the IAC. JMMH is funded by Spanish State Research Agency grants PID2019-107061GB-C61 and MDM-2017-0737 (Unidad de Excelencia María de Maeztu CAB).
References
- Abdullah et al. (2018) Abdullah M. H., Wilson G., Klypin A., 2018, ApJ, 861, 22
- Bouwens et al. (2006) Bouwens R. J., Illingworth G. D., Blakeslee J. P., Franx M., 2006, ApJ, 653, 53
- Bouwens et al. (2010) Bouwens R. J., et al., 2010, ApJ, 725, 1587
- Bouwens et al. (2015) Bouwens R. J., et al., 2015, ApJ, 803, 34
- Bouwens et al. (2016) Bouwens R. J., Smit R., Labbé I., Franx M., Caruana J., Oesch P., Stefanon M., Rasappu N., 2016, ApJ, 831, 176
- Bouwens et al. (2017) Bouwens R. J., Oesch P. A., Illingworth G. D., Ellis R. S., Stefanon M., 2017, ApJ, 843, 129
- Bruzual & Charlot (2003) Bruzual G., Charlot S., 2003, MNRAS, 344, 1000
- Calvi et al. (2019) Calvi R., et al., 2019, MNRAS, 489, 3294
- Castellano et al. (2016) Castellano M., et al., 2016, ApJ, 818, L3
- Castellano et al. (2018) Castellano M., et al., 2018, ApJ, 863, L3
- Cerviño et al. (2002) Cerviño M., Mas-Hesse J. M., Kunth D., 2002, A&A, 392, 19
- Chanchaiworawit et al. (2017) Chanchaiworawit K., et al., 2017, MNRAS, 469, 2646
- Chanchaiworawit et al. (2019) Chanchaiworawit K., et al., 2019, ApJ, 877, 51
- Charlot & Fall (1993) Charlot S., Fall S. M., 1993, ApJ, 415, 580
- Chiang et al. (2017) Chiang Y.-K., Overzier R. A., Gebhardt K., Henriques B., 2017, ApJ, 844, L23
- Chisholm et al. (2018) Chisholm J., et al., 2018, A&A, 616, A30
- Dijkstra et al. (2016) Dijkstra M., Gronke M., Venkatesan A., 2016, ApJ, 828, 71
- Dopita & Sutherland (2003) Dopita M. A., Sutherland R. S., 2003, Astrophysics of the diffuse universe
- Finkelstein et al. (2019) Finkelstein S. L., et al., 2019, ApJ, 879, 36
- Harikane et al. (2018) Harikane Y., et al., 2018, ApJ, 859, 84
- Harikane et al. (2019) Harikane Y., et al., 2019, ApJ, 883, 142
- Hayes (2019) Hayes M., 2019, Lyman Alpha Emission and Absorption in Local Galaxies. Springer Berlin Heidelberg, Berlin, Heidelberg, pp 319–398, doi:10.1007/978-3-662-59623-4˙4, https://doi.org/10.1007/978-3-662-59623-4_4
- Hayes et al. (2011) Hayes M., Schaerer D., Östlin G., Mas-Hesse J. M., Atek H., Kunth D., 2011, ApJ, 730, 8
- Higuchi et al. (2019) Higuchi R., et al., 2019, ApJ, 879, 28
- Jiang et al. (2018) Jiang L., et al., 2018, Nature Astronomy, 2, 962
- Kennicutt (1998) Kennicutt Robert C. J., 1998, ApJ, 498, 541
- Leitherer et al. (1999) Leitherer C., et al., 1999, The Astrophysical Journal Supplement Series, 123, 3
- Mas-Hesse & Kunth (1991) Mas-Hesse J. M., Kunth D., 1991, A&AS, 88, 399
- Meyer et al. (2020) Meyer R. A., Laporte N., Ellis R. S., Verhamme A., Garel T., 2020, Monthly Notices of the Royal Astronomical Society, 500, 558
- Oke & Gunn (1983) Oke J. B., Gunn J. E., 1983, ApJ, 266, 713
- Osterbrock (1989) Osterbrock D. E., 1989, Annals of the New York Academy of Sciences, 571, 99
- Oteo et al. (2018) Oteo I., et al., 2018, ApJ, 856, 72
- Otí-Floranes & Mas-Hesse (2010) Otí-Floranes H., Mas-Hesse J. M., 2010, A&A, 511, A61
- Ouchi et al. (2008) Ouchi M., et al., 2008, ApJS, 176, 301
- Ouchi et al. (2010) Ouchi M., et al., 2010, ApJ, 723, 869
- Robertson et al. (2013) Robertson B. E., et al., 2013, The Astrophysical Journal, 768, 71
- Robertson et al. (2015) Robertson B. E., Ellis R. S., Furlanetto S. R., Dunlop J. S., 2015, ApJ, 802, L19
- Rodríguez Espinosa et al. (2020) Rodríguez Espinosa J. M., et al., 2020, MNRAS, 495, L17
- Salvador-Solé et al. (2017) Salvador-Solé E., Manrique A., Guzman R., Rodríguez Espinosa J. M., Gallego J., Herrero A., Mas-Hesse J. M., Marín Franch A., 2017, ApJ, 834, 49
- Schaerer (2003) Schaerer D., 2003, A&A, 397, 527
- Schenker et al. (2012) Schenker M. A., Stark D. P., Ellis R. S., Robertson B. E., Dunlop J. S., McLure R. J., Kneib J.-P., Richard J., 2012, ApJ, 744, 179
- Sobral & Matthee (2019) Sobral D., Matthee J., 2019, A&A, 623, A157
- Stark et al. (2010) Stark D. P., Ellis R. S., Chiu K., Ouchi M., Bunker A., 2010, MNRAS, 408, 1628
- Stark et al. (2015) Stark D. P., et al., 2015, MNRAS, 454, 1393
- Stark et al. (2017) Stark D. P., et al., 2017, MNRAS, 464, 469
- Steidel et al. (2005) Steidel C. C., Adelberger K. L., Shapley A. E., Erb D. K., Reddy N. A., Pettini M., 2005, ApJ, 626, 44
- Tilvi et al. (2020) Tilvi V., et al., 2020, ApJ, 891, L10
- Toshikawa et al. (2012) Toshikawa J., et al., 2012, ApJ, 750, 137
- Vanzella et al. (2011) Vanzella E., et al., 2011, ApJ, 730, L35
- Verhamme et al. (2017) Verhamme A., Orlitová I., Schaerer D., Izotov Y., Worseck G., Thuan T. X., Guseva N., 2017, A&A, 597, A13
- Wilkins et al. (2016) Wilkins S. M., Feng Y., Di-Matteo T., Croft R., Stanway E. R., Bouwens R. J., Thomas P., 2016, MNRAS, 458, L6
- Wright (2006) Wright E. L., 2006, PASP, 118, 1711
- Yue et al. (2018) Yue B., et al., 2018, ApJ, 868, 115