Spin-glass behavior in Shastry-Sutherland lattice of TmCuInPreprint: AIP/123-QED
Abstract
The spinglass behavior in the ferromagnetic phase of was investigated by dc, acmagnetization, and non-equilibrium dynamics characterizations. An argon arcmelted polycrystalline sample of the compound of was found to adopt the type tetragonal structure (space group ). The temperature variation of dcmagnetization exhibits a ferromagnetic behavior with Curie temperature = 32.5 K. The zero field cooled (ZFC) and field cooled (FC) magnetic curves show the thermomagnetic irreversible behavior below . The field dependence of irreversible temperature follows the AlmeidaThouless line. The frequency and acdriven field dependent anomalies in acsusceptibility results indicate the existence of a spinglass state in . The time dependence of magnetization further supports the spinglass behavior observed in . The frequency dependence of the freezing temperature in the real part of acsusceptibility has been analyzed on the basis of a powerlaw divergence and VogelFulcher law. The obtained results reveal that belongs to the ferromagnetic canonical spinglass class of compounds.
Keywords:
Ferromagnet, Magnetic irreversibility, Spinglass, Magnetic relaxationTernary rare-earth based RTX (R = rare-earth, T = transition metals, and X = p block elements), magnetic materials have been intensively studied because of their exotic physical properties RTX; R2TX3; R2T2X; book1. Among them, the series of compounds are of interest due to their diversity of magnetic properties due to the crystal structure. Till date, compounds are mainly reported to form into two types of crystal structure, namely tetragonal and orthorhombic R2T2X; USi2; RE2Cu2In. The tetragonal structure of with space group is well known as the ShastrySutherland lattice systems. The arrangement of rare earth ions as triangles in the ShastrySutherland lattice favours the occurrence of magnetic frustration Ce2Pd2Sn; Pr2Pd2In; Er2Pd2Sn. It is reported that the tetragonal structure of exhibits ferromagnetic spinglass anomalies Gd2Au2Cd.
The geometrically frustrated lattice in a magnetic system can exhibit spinglass behavior. Since last few decades, spinglass studies remain an attractive topic in magnetism Binder; Mydosh; book. Tm-based intermetallic compounds have been paid significant attention in the search for low temperature magnetic properties due to their relatively low transition temperature. In this paper, the magnetic properties of have systematically been investigated. The obtained ferromagnetic spinglass behavior is reported.
A polycrystalline sample of was prepared by the standard arc-melting technique on a water-cooled copper hearth under high purity Argon atmosphere. The high-purity ( 99.9 wt %) elements with the stoichiometric 2:2:1 ratio was melted. The ingot was flipped and remelted several times to improve the homogeneity and reaction among the constituents. The weight loss of the melted ingots was less than 0.5 wt.%. The melted ingot of was then wrapped in tantalum foil and was kept in a highly evacuated sealed quartz tube. The sample was annealed at 973 K for a week. The crystal structure of the annealed sample was confirmed from the powder x-ray diffraction (XRD) pattern using a Rigaku Diffractometer with copper K radiation. The dcmagnetization and acmagnetic susceptibility were measured by using a DynacoolPhysical Properties Measurement System (PPMS), from QuantumDesign, San Diego.

The powder XRD data at room temperature collected on the polycrystalline sample of were analyzed by Rietveld structural refinement using FULLPROF software rietveld; fullprof. Fig. 1 shows the XRD pattern of along with the Rietveld fitted profile. The Rietveld refinement of the XRD data reveals that shows single phase compound of type tetragonal crystal structure with space group . The obtained crystallographic parameters from the Rietveld refinement are listed in Table 1. The observed crystallography parameters are very close to the values previously reported USi2; R2Cu2In. There are two TmTm bond distances in the structure. The shortest one measures 0.3656 nm (shown as dotted line) while the longer one measures 0.3864 nm (shown as solid line).
| a | 7.399(2) Å | |||
| b | 7.399(2) Å | |||
| c | 3.697(2) Å | |||
| V | 202.368(2) Å3 | |||
| Atomic coordinates for | ||||
| Atom | Wyckoff | |||
| Tm | 0.1747(1) | 0.6747(1) | 1/2 | |
| Cu | 0.6212(1) | 0.1212(1) | 0 | |
| In | 0 | 0 | 0 |

The zero field cooled (ZFC) and field cooled (FC) dcmagnetization as function of temperature for different external applied magnetic fields starting from 0.25 kOe to 5 kOe of are shown in Fig. 2. FC magnetization shows a typical ferromagnetic behavior with transition temperature = 32.5 K. The obtained value is in good agreement with the earlier report RE2Cu2In; Tm2Cu2In. The ZFC and FC curves start to diverge below a certain temperature, called the irreversible temperature (). It is seen that strongly depends on the applied magnetic field. The experimentally obtained for different applied magnetic fields was estimated from the ZFC and FC magnetization. Inset of Fig. 2 shows the phase diagram by plotting of verses . This phase diagram follows the AlmeidaThouless line for strong irreversibility characteristics AT; GT. The results of dcmagnetization and the AlmeidaThouless line have provided indications for the presence of spinglass behavior in the compound.
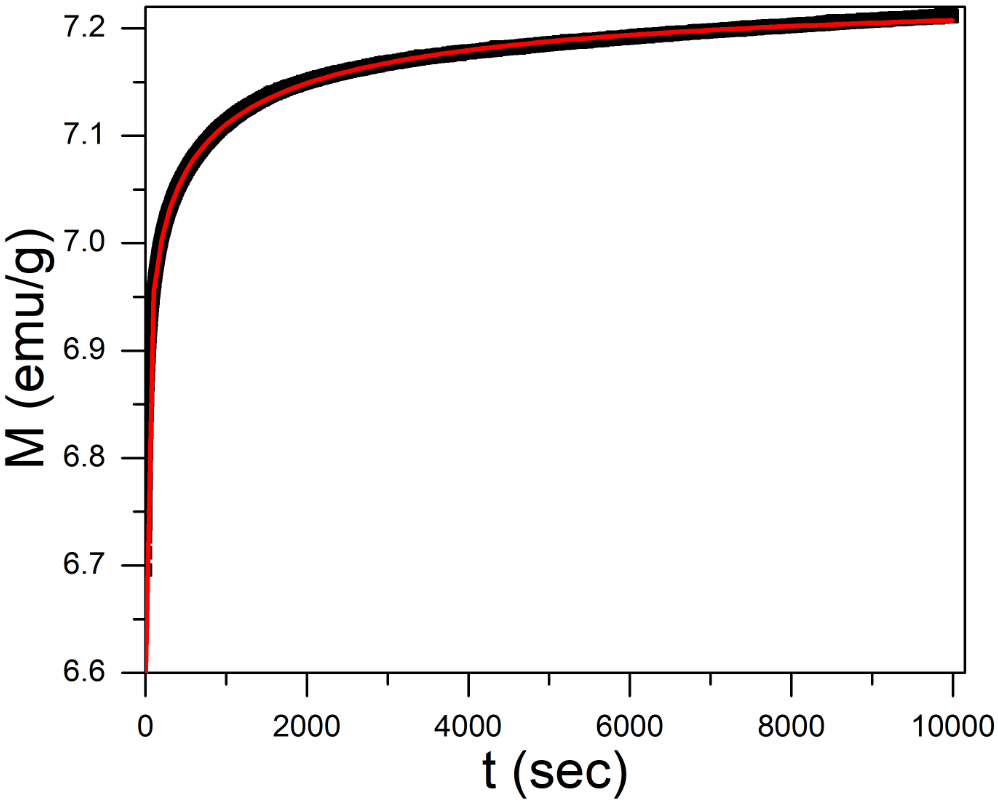
Spinglass behavior may also be characterized by the magnetic relaxation method. The relaxation process can be measured by both ZFC and FC conditions. In this present case, it is measured under ZFC condition. Here, the sample was cooled without external magnetic field from the paramagnetic region to 6 K (below the freezing temperature). After reaching the desired temperature, a waiting time of 60 sec was observed and the time evolution of the magnetization [M(t)] was recorded under a tiny applied magnetic field. Fig. 3 shows the time dependence of magnetization measured at 6 K in ZFC condition under the field value of 500 Oe. As seen in Fig. 3, the magnetization increases slowly with time and does not saturate even after a time of 10000 s. The time dependence of the magnetization is explained by the standard stretched exponential function, as follows mt1; mt2.
| (1) |
where is the spontaneous magnetization and is related with the glassy component of magnetization. and are the characteristic parameters for relaxation time constant, and stretching exponent respectively. The LSQ fitted line of Eq. 1 to the experimental data in Fig. 3 yielded the parameters = 7.2 emu/g, = 0.6 emu/g, the relaxation time = 175 sec and = 0.30. For a typical spinglass system, the value of lies between 0 and 1 mt3; DeltaTf. As per earlier reports, our result supports that exhibits a spinglass state.
.
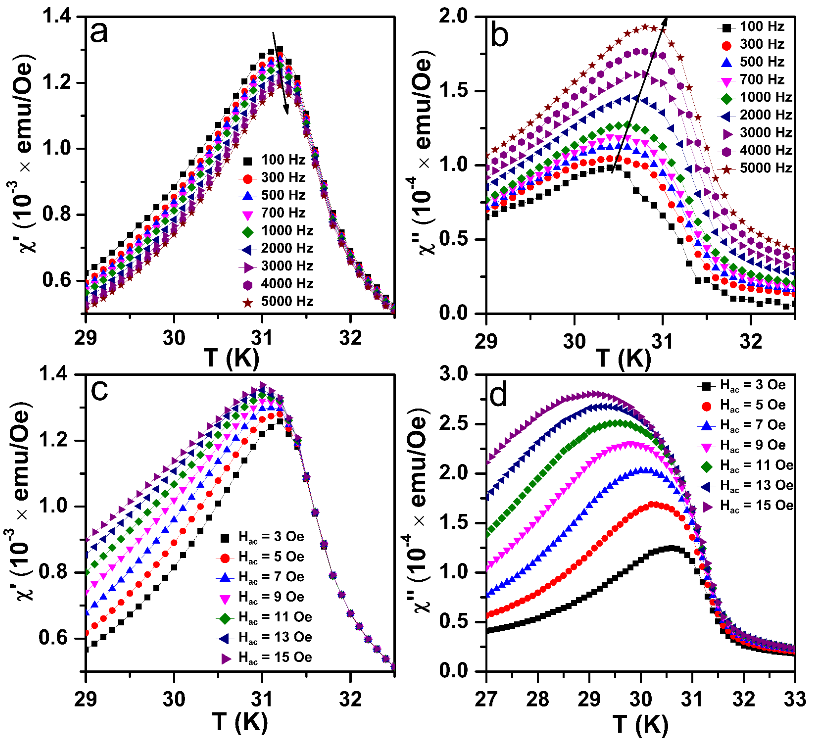
The acmagnetic susceptibility is an important characterization to confirm and categorize spinglass systems. Figs. 4(a) and (b) show the temperature dependence of the real () and imaginary () parts of the acmagnetic susceptibility for different frequencies, respectively, where the dcmagnetic field was zero and acdriven field () = 3 Oe. As seen in Fig. 4(a), shows a pronounced peak around the spinglass transition temperature. The peak temperature is known as the spin freezing temperature (). It is observed that slowly shifts to higher temperature with increasing frequency. Similarly, a frequency dependent peak is also observed in . The magnitude of the peak of increases with increasing the frequency, which is related to the dissipation process in the system. These results further confirm the spinglass behavior in the system.
To further explore the spinglass state in , temperature dependent acsusceptibility was measured under various acdriven field (). Fig. 4(c) and (d) show the and of the acmagnetic susceptibility for different and at a constant frequency of 1000 Hz with zero dcmagnetic field respectively. As shown in Fig. 4(c) and (d), the position of the peak in and depend on . Both and shifts to low temperature and the magnitude increases with increasing . These observations also confirm the ferromagnetic spinglass behavior in .

.
The acmagnetic susceptibility results confirm that follows spinglass type transition with a freezing temperature 31.1 K. In a typical spinglass system, the frequency dependence of is used to compare the relative shift in freezing temperature per decade of frequency by the following expression DeltaTf:
| (2) |
Here, = , and log10 = log10 - log10 with 2 = 100 Hz and 2 = 1000 Hz. It is found a value of = 0.0008 for , which lies typically in the range of a canonical spin glass system DeltaTf. This result revealed that a suitable characterization of is based on the canonical spinglass state.
The frequency dependence of for follows the conventional powerlaw divergence of a critical slowing down and is given by the relation Binder; Mydosh; TF;
| (3) |
where is the relaxation time corresponding to the measured frequency () and is a characteristic relaxation time of single spin flip. is known as the spinglass temperature as frequency tends to zero. is the critical exponent of correlation length, = ((/)-1) and = . is known as the dynamic critical exponent and is an important parameter of the spinglass system. The critical exponent lies between 4 and 12 for a typical spinglass system. Eq. 3 can be written as:
| (4) |
where = . The frequency dependence of obtained from is plotted as loglog of inverse frequency against and is shown in Fig. 5(a). The intercept and slope of the linear fit to log()log() are used to calculate the value of and respectively. From the best fit, = 1.04 10-15 s and = 4.8 are obtained. The value of supports, the observation of spinglass system in . The obtained value of for is close to the typical value of 10-12 10-13 s for canonical spinglass systems.
A spinglass system is also categorised using the dynamical Vogel-Fulcher scaling law Mydosh; VF. The frequency dependence of from is described by:
| (5) |
where where stand for the Boltzmann constant, = 1/ is the characteristic attempt frequency, Ea is thermal activation energy, and is known as the Vogel-Fulcher temperature. To conveniently fit the data, Eq. 5 can be rewritten as:
| (6) |
According to this equation, a plot of 1/ln is made. The slope and intercept of the linear fit are used to estimate and respectively. The best fit yielded a value of = 11.75 K and = 30.77 K. The ratio of ()/ is less than 1 confirming the system is in canonical spinglass behavior. However, ()/ is generally found to be relatively large in cluster spinglass state. This result revealed that exhibits ferromagnetic canonical spinglass state for the geometrical frustration in the crystal structure.
.1 Summary
In summary, we have successfully prepared a polycrystalline sample of the intermetallic compound , which crystallize in the type of tetragonal structure. The spinglass behavior in the ferromagnet found below its characteristic freezing temperature = 31.1 K, has been confirmed by dcmagnetization and acsusceptibility measurements. The spinglass behavior in has also been suggested by the magnetic relaxation behavior. The canonical spinglass state in was suggested from the experimental data of frequency dependence of in acsusceptibility. The experiment results are discussed with the theoretical model of power divergence method and VogelFulcher law. This observation revealed that the investigated compound exhibits ferromagnetic canonical spinglass state due to the geometrically frustration in the structure likely due to the formation of distorted triangles by the magnetic rare-earth ions.
Acknowledgements
This work is supported by Global Excellence and Stature (UJ-GES) fellowship, University of Johannesburg, South Africa. DFR thanks OWSD and SIDA for the fellowship towards PhD studies. AMS thanks the URC/FRC of UJ for assistance of financial support.
DATA AVAILABILITY
The data that support the findings of this study are available from the corresponding author upon reasonable request.
References
References
- (1) S. Gupta, and K.G. Suresh, J. Alloys Compd., 618 (2015) 562606.
- (2) Y. Zhang, J. Alloys Compd., 787 (2019) 11731186.
- (3) P. Zhi-Yan, C. Chong-De, B. Xiao-Jun, S. Rui-Bo, Z. Jian-Bang, and D. Li-Bing, Chin. Phys. B, 22 (2013) 056102.
- (4) H. S. Li, and J. M. D. Coey, ”Magnetic properties of ternary rare-earth transition-metal compounds”, Handbook of magnetic materials 6 (1991) 183.
- (5) M. Y. Lukachuk, and R. Pöttgen, Z. Kristallogr, Cryst. Mater., 218 (2003) 767787.
- (6) I. R. Fisher, Z. Islam, and P. C. Canfield, J. Magn. Magn. Mater 202 (1999) 1-10.
- (7) J. G. Sereni, M. G. Berisso, G. Schmerber, and J. P. Kappler, Phys. Rev. B 81 (2010) 184429.
- (8) P. Fischer, T. Herrmannsdörfer, T. Bonelli, F. Fauth, L. Keller, E. Bauer, and M. Giovannini, J. Phys. Condens. Matter 12 (2000) 7089.
- (9) G. Saucedo Salas, S. Baidyanath, A. Strydom, S. Calder, and H. Nair, Bulletin of the American Physical Society (2020).
- (10) S. Rayaprol, and R. Pöttgen, Phys. Rev. B 73 (2006) 214403.
- (11) K. Binder and A.P. Young, Rev. Mod. Phys. 58 (1986) 801.
- (12) J. A. Mydosh, Spin Glasses (Taylor and Francis, London), 1993.
- (13) Spin Glasses and Random Fields, edited by A. P. Young (World Scientific, Singapore), 1997.
- (14) H. M. Rietveld, J. Appl. Crystallogr., 2 (1969) 65.
- (15) J. Rodriguez-Carvajal, Fullprof Suite http://www. ill. eu/sites/fullprof/ (2017).
- (16) Y. M. Kalychak, V.I. Zaremba, V.M. Baranyak, P. Y. Zavalii, V. A. Bruskov, L. V. Sysa L.V., and O. V. Dmytrakh, Izv. Akad. Nauk SSSR, Neorg. Mater., 26 (1990) 7476.
- (17) Y. Zhang, Y. Yang, X. Xu, L. Hou, Z. Ren, X. Li, and G. Wilde, J. Phys. D: Appl. Phys. 49 (2016) 145002.
- (18) J. R. L. de Almeida and D. J. Thouless, J. Phys. A 11 (1978) 983.
- (19) M. Gabay and G. Toulouse, Phys. Rev. Lett. 47 (1981) 201.
- (20) S. Ghara, B. G. Jeon, K. Yoo, K. H. Kim, and A. Sundaresan, Phys. Rev. B 90 024413 (2014).
- (21) A. Bhattacharyya, S. Giri, and S. Majumdar, Phys. Rev. B 83 134427 (2011).
- (22) D. Chu, G. G. Kenning, and R. Orbach, Phys. Rev. Lett. 72 3270 (1994).
- (23) J. A. Mydosh, Spin Glasses: An Experimental Introduction (Taylor and Francis, London, 1993), Chap. 3.
- (24) P. C. Hohenberg and B. I. Halperin, Rev. Mod. Phys. 49 (1977) 435.
- (25) J. Souletie and J. L. Tholence, Phys. Rev. B 32 (1985) 516.