Lattice dynamics of the Ta2Ni(Se1-xSx)5 excitonic insulator Preprint: This is a preprint of an article published in the Physical Review B with the Editor’s Suggestion.Preprint: The final authenticated version is available online at \doi10.1103/PhysRevB.104.045102.
Abstract
Recently, we employed electronic polarization-resolved Raman spectroscopy to reveal the strongly correlated excitonic insulator (EI) nature of Ta2NiSe5 [Volkov et al., npj Quant. Mater. 6, 52 (2021)], and also showed that for Ta2Ni(Se1-xSx)5 alloys the critical excitonic fluctuations diminish with sulfur concentration exposing a cooperating lattice instability that takes over for large [Volkov et al., arXiv:2104.07032]. Here we focus on the lattice dynamics of the EI family Ta2Ni(Se1-xSx)5 (, …, 1). We identify all Raman-active optical phonons of (fully symmetric) and (-quadrupole-like) symmetries ( point group) and study their evolution with temperature and sulfur concentration. We demonstrate the change of selection rules at temperatures below the orthorhombic-to-monoclinic transition at that is related to the EI phase. We find that decrease monotonically from 328 K for Ta2NiSe5 to 120 K for Ta2NiS5 and that the magnitude of lattice distortion also decreases with the sulfur concentration . For , the two lowest-frequency B2g phonon modes show strongly asymmetric lineshapes at high temperatures due to Fano interference with the broad excitonic continuum present in a semimetallic state. Within the framework of extended Fano model, we develop a quantitative description of the interacting exciton-phonon excitation lineshape, enabling us to derive the intrinsic phonon parameters and determine the exciton-phonon interaction strength, that affects the transition temperature . While at low temperatures the intrinsic phonon parameters are in good agreement with the ab initio calculations and the anharmonic decay model, their temperature dependencies show several anomalous behaviors: (i) Frequencies of B2g phonons harden pronouncedly upon cooling in vicinity of for semimetals and, in contrast, soften monotonically for Ta2NiS5 semiconductor; (ii) The lifetime of certain phonons increases strongly below for revealing the gap opening in the broken symmetry phase; (iii) For most modes, the intensity shows rather strong temperature dependence hat we relate to the interplay between electronic and phononic degrees of freedom. For Ta2NiSe5 we also observe signatures of the acoustic mode scattered assisted by the structural domain walls formed below . Based on our results, we additionally present a consistent interpretation of the origin of oscillations observed in time-resolved pump-probe experiments.
I Introduction
In a narrow-gap semiconductor or semimetal, if the exciton binding energy exceeds the band gap, the Coulomb attraction between electrons and holes favors spontaneous formation of a macroscopic number of excitons. These bosonic quasiparticles then form a coherent state, opening an interaction-induced gap and leading to a insulating phase, named excitonic insulator Kohn 1967; Halperin and Rice 1968; Kohn and Sherrington 1970. If the electron and hole states belong to bands of different symmetry, the resulting excitonic insulator state is expected to break the crystal lattice symmetry.
Consider the case of a semimetal. If the band gap is indirect, i.e. the valence band maximum and the conduction band minimum are located at different places in the -space, condensation of excitons leads to a charge-density-wave (CDW) state and accompanying crystal distortion which breaks translational symmetry Kohn and Sherrington 1970. The CDW wavevector is then given by the spanning vector that connects the valence band maximum to the conduction band minimum. One such example is semimetal 1T-TiSe2, which has been proposed to hold an excitonic insulating state below 190 K Pillo et al. 2000; Cercellier et al. 2007; Monney et al. 2011; Kogar et al. 2017. In contrast, if the band gap is direct, excitonic condensation only results in lattice distortion which breaks point-group symmetry. In this situation, the size of the unit cell does not change but its shape changes. Ta2NiSe5 is a candidate for excitonic insulator of this kind.
Ta2NiSe5 shows a second-order structural phase transition at K Lu et al. 2017; Salvo et al. 1986. In the high temperature phase, this material has a orthorhombic structure (point group ); in the low-temperature phase, the structural is monoclinic (point group ) with the angle between and directions deviating from 90∘, Fig. 1. Below , the valence-band top flattens as discovered by angle-resolved photoemission spectroscopy (ARPES) studies Wakisaka et al. 2009; Seki et al. 2014; Watson et al. 2020. Band flatness at low temperature is viewed as a characteristic feature of the excitonic insulator ground state. Moreover, studies of nonequilibrium dynamics have demonstrated photoinduced enhancement of excitonic order Mor et al. 2017; Murakami et al. 2017, photoinduced multistage phase transitions Liu et al. 2021, ultrafast reversal of excitonic order Ning et al. 2020, and coherent order-parameter oscillations Werdehausen et al. 2018.

The lattice degrees of freedom play an important role in the physics of Ta2NiSe5. In particular, the orthorhombic-to-monoclinic structural change can be induced via electron-phonon coupling Kaneko et al. 2013 even if the origin of the transition is excitonic Mazza et al. 2020. Moreover, a recent study combining ultrafast experiments with calculations proposes that the phase transition in Ta2NiSe5 is structural in its nature Baldini et al. 2020. Thus, understanding the underlying phsyics of excitonic insulator candidates requires the lattice dynamics to be examined in a detailed way. Interestingly, substitution of Se with S results in a whole family of compounds Ta2Ni(Se1-xSx)5, where the orthorhombic-to-monoclinic transition has been suggested to be suppressed with Lu et al. 2017. While it is known, that S substitution leads to an enhanced direct band gap Chiba et al. 2019, which is detrimental to the EI state, its effects on the lattice modes has not been systematically studied.
Because the inversion symmetry of Ta2Ni(Se1-xSx)5 is preserved across , the soft mode of this zero-wavevector structural transition, if any, is Raman active. Polarization resolved low frequency Raman spectroscopy, therefore, is particularly suitable for studying the physics of the phase transition, and for evaluating the contribution of the lattice vibrations to the transition. This experimental method offers both the high energy resolution and the ability to selectively probe bosonic excitations in different symmetry channels Hayes and Loudon 1978.
In this work, we present a systematic study of the lattice dynamics for the family of Ta2Ni(Se1-xSx)5 (, 0.25, 0.67, and 1) pristine crystals and alloys to quantitatively explore the spectral parameters of the phonons. We find the change of selection rules, indicating an orthorhombic-to-monoclinic structural transition at , which is finite for all . The transition temperature and the magnitude of lattice distortion both decrease with sulfur concentration .
For Ta2Ni(Se1-xSx)5 with , the two lowest-energy symmetry-breaking B2g phonon modes exhibit strong asymmetric lineshape above the transition temperature, resulting from the coupling between these modes and an excitonic continuum of the same symmetry. We develop an extended model to analyze the physics of this Fano-type interference effect. Using this model, we disentangle the excitonic and phononic contributions to the Raman response, and illustrate the effect of the coupling between them: apart from renormalizing the bare phononic and excitonic responses, this effect also results in an additional interference term in the total Raman response. We find that the B2g phonon modes exhibit no intrinsic softening on cooling towards the transition temperature. In contrast, the excitonic response shows clear soft-mode behavior Volkov et al. 2021a; Volkov et al. 2021b. Additionally, many modes exhibit an anomalous increase in linewidth above , suggesting the closing of the EI gap. For Ta2NiSe5 below , we also observe signatures of the acoustic excitations with finite momenta, enabled by the formation of a quasi-periodic structure of domain walls.
For Ta2NiS5 , on the contrary, the phonon modes in the symmetry-breaking channel maintain symmetric lineshape, but their frequency anomalously decreases upon cooling. Because the structural change for Ta2NiS5 is very weak, no anomaly of phonon frequency or width is detected around its structural transition temperature.
For all compositions, we find that most phonons exhibit strong dependence of their intensity on temperature, and present arguments in favor of this being a result of a coupling to electronic excitations.
Additionally, we perform density functional theory (DFT) calculations of the lattice dynamics for Ta2NiSe5 and Ta2NiS5 . The phonon frequencies agree well with the experiment, and the obtained displacement patterns of the optical modes allow to explain the differences of the couplings of the three non-symmetric phonons to the excitonic continuum.
Finally, we demonstrate that our results are consistent with the modes observed in time-resolved experiments. We show however, that the signatures of the Fano-shaped phonons and the excitonic continuum above may be hard to observe in that type of experiments.
The rest of this paper is organized as follows. In Sec. II we describe the sample preparation and experimental setup. In Sec. III we show an overview of the phonon spectra of Ta2Ni(Se1-xSx)5 family, and compare the measured phonon frequencies at low temperatures with the calculated values. In Sec. IV from the temperature dependence of the phonon intensity we obtain phase transition temperatures, which are compared with the resistance measurements. In Sec. V we analyze the Fano interference feature of B2g-symmetry Raman response. In Sec. VI we present the temperature dependence of phonon-mode parameters: the results for B2g-symmetry modes are given in SubSec. VI.1, and those for Ag-symmetry modes are given in SubSec. VI.2. In Sec. VII we convert Raman response from frequency domain to time domain, and discuss relevant time-resolved studies on Ta2NiSe5. In Sec. VIII we provide a summary of the observations and their implications. Further discussion is provided in appendices: the methods used for the estimation of laser heating rate in Appendix. A; the mathematical formalism for the generalized Fano model in Appendix B, and more illustration of this model in Appendix C; the fitting results of the anharmonic decay model for the phonon modes in Appendix D.
II Experimental
Single crystals of Ta2Ni(Se1-xSx)5 family were grown by chemical vapor transport method. Elemental powders of tantalum, nickel, selenium and sulfur were mixed with stoichiometric ratio and then sealed in an evacuated quartz ampule with a small amount of iodine as the transport agent. The mixture was placed in the hot end of the ampule (950∘C) under a temperature gradient of about 10∘C/cm. After about a week mm-sized needle-like single crystals were found at the cold end of the ampule. The crystals are shiny and cleave easily. We used x-ray diffraction and electron dispersive X-ray spectroscopy to verify the exact composition of the crystals and their uniformity. The samples for resistance and Raman measurements are from the same batch.
The resistance is measured along a axis in a four-probe configuration using a Quantum Design PPMS system.
The TEM images of domain structures are taken on a FEI Titan Themis G2 system using a Gatan double-tilt cryo-stage.
For Raman measurements, the samples were cleaved in ambient conditions to expose the plane; the cleaved surfaces were then examined under a Nomarski microscope to find a strain-free area. Raman-scattering measurements were performed in a quasi-back-scattering geometry from the samples mounted in a continuous helium-gas-flow cryostat.
For acquisition of the low frequency Raman response required for this study, we used a custom fast f/4 high resolution 500/500/660 mm focal lengths triple-grating spectrometer (with 1800 mm-1 master holographic gratings comprised of (i) aberration corrected subtractive stage providing a reliable 12 orders-of-magnitude stray light rejection at as low frequency as 4 cm-1 from the elastic line, (ii) a third stage monochromator, and (iii) a liquid-nitrogen-cooled charge-coupled device (CCD) detector (Princeton Instruments). All the acquired data were corrected for the spectral response of the spectrometer. Three slit configurations were used: 100 m slit width providing 0.19 meV spectral resolution; 50 m slit width rendering 0.10 meV spectral resolution; and, for high resolution data, 25 m slit width rendering 0.06 meV spectral resolution.
For polarization optics, a Glan-Taylor polarizing prism (Melles Griot) with a better than 10-5 extinction ratio to clean the laser excitation beam and a broad-band 50 mm polarizing cube (Karl Lambrecht Corporation) with an extinction ratio better than 1:500 for the analyzer was used. Two polarization configurations were employed to probe excitations in different symmetry channels. The relationship between the scattering geometries and the symmetry channels Hayes and Loudon 1978 is given in Table 1.
| Scattering | Symmetry Channel | Symmetry Channel |
|---|---|---|
| Geometry | (D2h group) | (C2h group) |
| aa | Ag | Ag |
| ac | B2g | Ag |
The 647 nm line from a Kr+ ion laser was used for excitation. Incident light was focused to an elongated along the slit direction 50100 m2 spot. For data taken below 310 K, laser power of 8 mW was used. To reach temperature above 310 K, we kept the environmental temperature at 295 K and increased laser power to reach higher sample temperature in the excitation spot. All reported data were corrected for laser heating in two mutually consistent ways [Appendix. A]: (i) by Stokes/anti-Stokes intensity ratio analysis, based on the principle of detailed balance, (ii) by checking laser power that is inducing the phase transition. In addition to that, we performed a thermoconductivity model calculation that suggests a linear scaling of the heating rate with the beam spot size.
The first-principle calculations were performed using DFT within Projector Augmented-Wave (PAW) formalism Blöchl 1994 and Perdew-Burke-Ernzerhof (PBE) parametrized exchange-correlation energy functional Perdew et al. 1996. For Ta2NiSe5, we used the implementation of the Quantum ESPRESSO package Giannozzi et al. 2017, using the pseudopotentials generated by Dal Corso Dal Corso 2014 and with grimme-d3 Van-der-Waals correction Grimme 2006 included. For Ta2NiS5, the implementation of the Vienna Ab initio Simulation Package (VASP) code Kresse and Furthmüller 1996; Kresse and Furthmüller 1996 was used. The phonon frequencies for both cases were calculated by finite displacement method as implemented in PHONOPY Togo and Tanaka 2015. The initial structures subject to relaxation for Ta2NiSe5 and Ta2NiS5 have been taken from experiments on the high-temperature orthorhombic phase, Ref.Nakano et al. 2018a and Ref.Sunshine and Ibers 1985, respectively.
III Overview
In this section we show an overview of the phonon spectra of Ta2Ni(Se1-xSx)5 family, and compare the measured phonon frequencies at low temperatures with the calculated values.
The phonon spectra of Ta2Ni(Se1-xSx)5 family (=0, 0.25, 0.67, and 1) are summarized in Fig. 2. For stoichometric compositions at high temperature, we observe modes in geometry and modes in geometry, in agreement with the 8 Ag and 3 B2g Raman-active phonon modes expected in the high-temperature orthorhombic phase (space group ): the Ag modes appear in scattering geometry and the B2g modes in scattering geometry [Table. 1]. Except for the Ta2NiS5 sample, the two lowest-energy B2g modes, B and B, exhibit strongly broadened and asymmetric lineshapes at high temperature. This anomalous broadening is almost absent for Ta2NiS5 (note the logarithmic intensity scale in Fig. 2).

At low temperature, a transition into a monoclinic phase (space group ) occurs. In the low-temperature phase, because of the mirror symmetry breaking, all Raman-active phonon modes appear in both and scattering geometries [Table. 1]. All of the expected Raman-active modes were observed: they are identified by dashed lines in Fig. 2; the additional weak spectral features result from the second-order scattering. For example, the weak feature at 34.1 meV in scattering geometry for Ta2NiSe5 corresponds to a second-order scattering feature of the 16.8 meV B mode.
The measured phonon frequencies for Ta2NiSe5 and Ta2NiS5 at 35 K generally match well with the calculated values [Table. 2]. As the calculations were carried out in the orthorhombic phase, this suggests that monoclinicity by itself does not strongly affect the phonon frequencies. Larger than 10% discrepancies between the measured and calculated values appear only for the B and B modes of Ta2NiSe5 and the B mode of Ta2NiS5. As discussed in Sec. V, these modes exhibit an anomalous behavior that can be attributed to their strong coupling to the excitons.
| Ta2NiSe5 | Ta2NiS5 | |||
|---|---|---|---|---|
| Mode | Exp. | Calc. | Exp. | Calc. |
| A | 4.22 | 4.22 | 5.01 | 4.82 |
| B | 8.66 | 7.61 | 6.50 | 7.66 |
| A | 12.28 | 11.87 | 16.13 | 15.18 |
| B | 15.25 | 10.14 | 16.41 | 16.20 |
| A | 16.76 | 15.53 | 19.13 | 18.27 |
| B | 18.38 | 19.39 | 32.96 | 33.23 |
| A | 22.17 | 21.91 | 33.82 | 33.82 |
| A | 24.14 | 24.09 | 36.50 | 36.36 |
| A | 27.02 | 26.34 | 40.07 | 40.13 |
| A | 29.39 | 29.01 | 43.10 | 43.07 |
| A | 36.32 | 37.47 | 49.49 | 49.62 |
For the alloy compositions ( and 0.67), the phonon modes show larger linewidth compared with that for the stoichometric compositions. Moreover, the B and A-A modes exhibit two distinct frequencies: one close to the frequency of that mode in Ta2NiSe5, and the other close to the frequency in Ta2NiS5. Such behavior is commonly observed for alloys in which the frequencies of the same phonon mode in the two end-point materials differ substantially Elliott et al. 1974; Barker and Sievers 1975; Bergman and Nemanich 1996. The doping dependence of the phonon frequencies measured at 35 K is presented in Fig. 3. The frequencies of the phonon modes for Ta2NiSe5 are consistent with the recent experimental studies Kim et al. 2016; Yan et al. 2019; Kim et al. 2020; Kim et al. 2021a; Kim et al. 2021b and the calculated values Subedi 2020.

IV Phase transition
In this section we deduce the phase transition temperatures from the observed change in selection rules in Raman response and compare the results with the resistance measurements.
Below , the 11 phonon modes are allowed by symmetry to appear in both scattering geometries [Table.1]; thus, 8 additional modes appear in geometry and 3 in . We call the appearance of phonon modes below in the orthogonal to allowed above scattering geometry as phonon-mode ”leakage”. As shown in Fig. 2, all four samples exhibit phonon-mode ”leakage” at low temperature, indicating presence of a point group symmetry breaking structural phase transition.
In Fig. 4 we show the temperature dependence of the ”leakage” of A and B modes for Ta2Ni(Se1-xSx)5 family. The ”leakage” of other modes is given in Sec. VI. For each sample, the ”leakage” of different modes appear below the same temperature.
We assign the temperature of the ”leakage” onset as the structural phase transition temperature . The phase transition temperatures for Ta2Ni(Se1-xSx)5 family are given in Table 3. The transition temperatures decrease with sulfur doping . Moreover, for larger sulfur content the phonon intensities in the ’forbidden’ scattering geometry also decrease. This quantity is proportional to the square of the order parameter (OP), which can be represented by, e.g., the deviation of the angle between and axes [Fig. 1 (b)] from 90∘. While the general monotonic growth of the leakage intensity on cooling is consistent with these expectations, the details of temperature dependence can vary for different modes [Fig. 4(a)]. The decreasing trend of the phonon intensity in the ’forbidden’ scattering geometry with sulfur content therefore indicates that the structural distortion becomes weaker with higher sulfur concentration.
| Sulfur Content | Transition Temp. (K) |
|---|---|
| 0 | 3285 |
| 0.25 | 26010 |
| 0.67 | 17010 |
| 1 | 12010 |
A complementary way to determine the phase transition temperature was demonstrated in Lu et al. 2017, where anomalies in the temperature dependence of resistance have been detected at . In Fig. 5 we show the resistance data analysis for the samples from the same batch as used for the Raman measurements. For Ta2NiSe5 and Ta2Ni(Se0.75S0.25)5, the temperature at which the temperature derivative of resistance displays a kink and that of transport activation gap shows a peak, coincides with the Raman-determined transition temperature. For Ta2Ni(Se0.33S0.67)5 and Ta2NiS5, though, the features in resistance data are less pronounced. The latter can be anticipated from their much more insulating character, potentially masking a small change of resistance due to transition on top of a large background resistance.

V Fano Interference in the B2g symmetry channel
In this section we analyze the asymmetric lineshape of the B2g-symmetry phonon modes observed for in the high temperature phase. We describe the asymmetric lineshape and its temperature dependence in SubSec. V.1. To fit the spectra, we develop a generalized Fano model, discussed in SubSec. V.2, in which the asymmetric broadening results from the coupling of the phonon modes to an excitonic continuum. Besides the optical phonon modes, the excitonic continuum also couples to the acoustic phonon mode. We discuss how such coupling enhances the transition temperature , and leads to softening of the B2g -symmetry acoustic mode in SubSec. V.3. The appearance of a quasi-periodic domain wall structure below introduces additional complexity, and in SubSec. V.4, we discuss how the fitting model must be modified to account for low-energy spectral features which are absent above . The fitting results for Ta2NiSe5, relevant to the excitonic continuum, are presented and interpreted in SubSec. V.5 (those related to the intrinsic phonon properties are shown later in Sec. VI). It is demonstrated that the strengths of the interactions between individual phonons and excitonic continuum are consistent with the displacement patterns deduced from ab initio calculations. For comparison, the fitting results for the alloy compositions are given in SubSec. V.6.
V.1 Temperature dependence of asymmetric Fano lineshapes
The temperature dependence of the spectra measured in scattering geometry for Ta2NiSe5 is shown in Fig. 6. Above , the B and B modes have noticeably asymmetric lineshapes, while the lineshape of the B mode remains quite symmetric. Upon approaching on cooling, the spectral weight of low-frequency continuum displays an enhancement, and the apparent linewidths of the B and B modes increase. Below , the modes recover the conventional Lorentzian lineshapes.

An asymmetric lineshape arises due to Fano interference when a sharp phonon interacts with a broad continuum. In this case, the continuum is due to the overdamped exciton fluctuations Volkov et al. 2021a; Volkov et al. 2021b, and the exciton-phonon interaction is caused by modulation of electronic bands near the Fermi surface by the B2g-symmetry lattice vibrations.
V.2 The generalized Fano model for data above
We describe the Fano model that includes the coupling between the B phonon modes and the continuum; more details can be found in Appendix B.
We first discuss the Raman response of the phonons. The Raman scattering intensity is related to the fluctuation spectrum of the phonon coordinate Barker and Loudon 1972, which is given by the imaginary part of the phonon coordinate susceptibility times the Bose factor. The phononic Raman response function consequently has the form:
| (1) |
where is the light-scattering vertex for the phonon, is the mode’s bare frequency, and is the half width at half maximum (HWHM) which is related to the oscillator lifetime.
An exciton in a gapped system (a semiconductor or insulator) is expected to have a sharply peaked response at the exciton energy described by a bosonic response function similar to the Eq. (1). The most important difference for a semimetal is the presence of a gapless continuum of interband particle-hole excitations enabling the decay of the exciton into unbound particle-hole pairs (Landau damping). To describe the continuum in data, we find it sufficient to assume a purely relaxational dynamics (corresponding to strong overdamping) for the excitonic response. This leads to the form
| (2) |
where controls the overall intensity determined by the light-scattering vertex and the excitonic density of states, is the frequency of the over-damped excitation, and is the relaxation rate, typically much larger than . Note that for the purpose of the fitting description below is a single parameter denoting the temperature-dependent peak frequency in the broad response function . For a purely excitonic transition this peak represents the soft mode: is the condition for bare excitonic transition temperature at , where the static excitonic susceptibility diverges (see Eq. (54)).
In the absence of the exciton-phonon interaction between the modes the respective phononic and excitonic responses [Eqs.(1) and (2)] simply sum up. The exciton-phonon interaction, however, couples these dynamical responses: in particular, a bilinear coupling of the exciton and the B2g phonon coordinates is expected Kaneko et al. 2013 (note that the bare phonons are diagonal normal modes and thus no bilinear interaction between them is present). The resulting response can be obtained by solving the coupled equations of motion [Appendix B]. Each of the responses and get renormalized by the interaction, and in addition, the response of the phonon coordinate to the exciton one, , becomes finite. The latter leads to an essential interference term in the total Raman response function Fano 1961; Klein 1983; Blumberg et al. 1994.
To appreciate the effect of renormalization, we first consider a simplified case in which the excitonic continuum couples to a single sharp phonon mode () [Appendix C]. Then, solving the coupled dynamical equations, one obtains the full Raman response function
| (3) |
could be broken down into a sum of three contributions:
| (4) |
where the first two terms correspond to the phonon response proportional to square of light coupling vertex and the excitonic continuum proportional to , respectively, while the third one, that is proportional to the combination, is the interference term appearing due to the exciton-phonon coupling with strength Blumberg et al. 1994.
We first discuss the phonon response in the presence of the coupling with the excitonic continuum. As we will show now, the coupling to the continuum of overdamped excitonic excitations renormalizes the bare linewidth to
| (5) |
thus, the bare can be neglected altogether 11 1 Note that the interaction-induced linewidth is often significantly larger than the bare width , which is the case for presented data above . Consequently, an analysis of the phonon lineshape that does not explicitly include the interaction with the continuum (e.g. by simply adding the intensities of Fano-shaped phonons and the continuum) would lead to an erroneous large intrinsic phonon linewidth. The renormalized phonon response is given by
| (6) |
Comparing Eq. (6) to Eq. (1) for the bare phonon, the phonon frequency renormalization is 22 2 Note that the cubic term in the denominator can be neglected as long as the frequency is not far from .. On increasing coupling strength , the phononic response maximum shifts to .
For the excitonic response the renormalization effects are most significant. Those are best illustrated by the low-frequency slope of the excitonic response function . In the absence of exciton-phonon interaction the low frequency slope for the bare response is equal to (see Eq. (2)), while the interaction is rapidly enhancing the slope as
| (7) |
leading to a critical value at , when the excitonic spectral weight is pushed to the lowest frequencies and thus causing the divergence in the static susceptibility
| (8) |
signifying the enhancement of the excitonic phase transition temperature, caused by coupling to the optical phonon.
Finally, the mutual response of the exciton and phonon coordinates appearing due to the coupling between them, leads to the sign-changing interference term
| (9) |
The sign of this term depends on phase difference between the exciton and phonon oscillators. Because the phase of driven by light phononic oscillator is flipping to the opposite one at the resonant frequency, the sign of this term changes close to the bare phonon frequency . Thus, this term is chiefly responsible for a skewed, asymmetric shape of the resulting Fano feature. Depending on the sign of the peak is skewed to the left or to the right of the original phonon frequency. Note that even for weak coupling this term can have an appreciable magnitude close to the phonon energy.
To analyze the actual measured low-frequency data shown in Fig. 6, we use the model with three B2g optical phonon modes, all interacting with the excitonic continuum, see for details Appendix B. As above, the total Raman response can be similarly decomposed into three contributions, Eq. (4): the first two describing the renormalized phononic and excitonic responses, respectively, with the third one arising due to the interference effects. In Fig. 7, an example of such decomposition is shown for the data taken at 380 K, along with the deduced bare responses (without the effect of coupling), and . The renormalized phonon features become broader due to the interaction with the continuum and their frequencies shift. Most importantly, the coupling noticeably increases the excitonic response at low frequencies. The sign-changing interference term enhances the asymmetric lineshape of the combined response.

To fit the spectra, first, we determine the parameter of the excitonic continuum (Eq. (2)) by fitting the phonon free region of spectra between 25 and 40 meV. As expected, this quantity remains temperature-independent [Fig. 10(b)]. Second, we perform a global fitting of the spectral region below 22 meV for all measured temperatures. We assume (consistently with the expectation due to anharmonic effects, see Eq. (16-17) below) the linewidth of the three B2g-symmetry phonon modes to be a linear function of temperature above . For spectra below , we fit the ”leaked” phonon modes with the Lorentzian lineshapes, and account for their contribution in the global fitting.
V.3 The coupling between excitonic continuum and acoustic modes
Besides the optical phonon modes, the excitonic continuum also couples to the acoustic phonon modes. The acoustic branch has a linear dispersion ( is sound velocity) at small wavectors ; its coupling to light and to the excitonic continuum both vanish in the long-wavelength limit Gallais and Paul 2016: and ( and are constants). However, the acoustic mode has important contribution to the enhancement of the phase-transition temperature Böhmer et al. 2014. The the diverging condition for static Raman susceptibility is defined by coupling to all modes, optical and acoustic:
| (10) |
in which
| (11) |
This equation determines the symmetry-breaking phase transition temperature .
Because the spectroscopic Fano feature associated with the coupling between the long-wavelength longitudinal acoustic mode and the excitonic continuum lies at frequencies far below accessibility of Raman experiment, the constant cannot be derived directly from an interference feature of a typical Raman spectra. Nevertheless, the coupling constant has observable consequences already above . In particular, the acoustic mode has been shown to soft on cooling towards Nakano et al. 2018b. This softening does not result from intrinsic instability of the acoustic modes; rather, it is caused by the coupling of the acoustic mode to the softening excitonic excitations [Eq. (2)].
To demonstrate this point, we solve for the lowest-energy pole of the Green’s function for the interacting phononic and excitonic excitations assuming an infinitesimal . The energy of the pole gives the renormalized (experimentally-measured) sound velocity above [Eq. (57) of Appendix B]:
| (12) |
in which is the bare sound velocity in the absence of coupling to the excitons. Eq. (10) enables us to rewrite Eq. (12) as
| (13) |
From Eq. (13), it is clear that the sound velocity softens to zero at in the absence of any intrinsic ferroelastic instability. The renormalization of the sound velocity above can be estimated by using Eq. (13). Using the low-temperature value of the sound velocity Nakano et al. 2018b, we can then calculate with the parameters obtained from the Fano fits, i.e. without free parameters. The result yields , which is in remarkable agreement with the experimental ratio . The agreement between the estimated and experimentally-determined values suggests that in Ta2NiSe5, the softening of the acoustic mode results solely from the coupling to the softening excitonic excitations.
V.4 The generalized Fano model for data below
Below , especially around 300 K, this model appears to be insufficient to account for an additional low-frequency spectral weight, see Fig. 6(e) and Fig. 8. To understand the origin of this spectral feature below a few meV, we recall that below formation of quasi-periodic structural domains have been observed by transmission electron microscopy (TEM) Salvo et al. 1986; Liu et al. 2021. Such quasi-periodic structure can take a recoil of quasi-momenta, enabling Raman coupling to acoustic mode at finite momentum , where is the periodicity of the domain pattern, causing the appearance of the additional spectral feature at frequency . Therefore, fitting this ultra-low-frequency spectral feature provides an independent approach to determine the coupling constant between the acoustic lattice excitations and the excitonic continuum, and hence define the constant that controls the enhancement of the transition temperature to due to coupling between excitons and longitudinal strain fields of the same symmetry. This low-energy feature due to recoil on the quasi-periodic structure of domain walls is best seen about 30 K below , when the excitonic continuum is sufficiently suppressed but still adequate to provide a Fano-interference feature.
In Fig. 9 we compare two TEM images from plane of Ta2NiSe5 measured above and below . The domains have stripe shape, aligned parallel to the -axis. The average spacing between these stripes along -axis direction is on the order of 200 . For the purpose of spectral analysis, we will assume that the spacing between stripes in units of the crystal unit cell constant follows the Poisson distribution
| (14) |
where is average inter-domain distance in the number of -direction unit cells.

We deduce the unrenormalized speed of sound from the dispersion of the acoustic mode measured by inelastic x-ray scattering at temperatures far away from : meV Å, see Ref. Nakano et al. 2018b. We also note that at high temperatures the acoustic excitations away from long-wavelength limit are significantly broadened Nakano et al. 2018b.
Recognizing that the low-frequency feature is inhomogeneously broadened by random distribution of the stripe distances, for the fitting procedure to the measured response function we perform summation over the distribution function:
| (15) |
in which each is the full response function containing coupling to acoustic mode for domain walls lattice constants apart, see Eq. (51) in Appendix. As a reminder, for each individual component, the frequency and HWHM are proportional to ; the light-scattering vertex and coupling are proportional to .
V.5 The fitting results for Ta2NiSe5
The fits to the data, as well as the phononic and excitonic components, are shown in Fig. 6. For the 300 K and 265 K spectra below we also include the acoustic contribution due to coupling via quasi-periodic structure of domain walls. In Fig. 8 we show the acoustic contribution at 300 K. The coupling of the excitonic continuum to the acoustic components enhances the low-energy response. The parameter meV Å is consistent with Eq. (10) for .
The spectral parameters: frequency, FWHM and integrated intensity, – of the three B2g phonon modes are shown in SubSection. VI.2. The rest of the fitting parameters are given in Fig. 10.
The temperature dependence of the coupling strength between the individual phonon modes and the excitonic continuum are detailed in Fig. 10(a). The ratios of the coupling strength to the phonon frequency for the B and B modes above are 0.32 and -0.34, respectively. These ratios are an order of magnitude larger than the typical values for stable systems with similar phonon frequency Kung et al. 2017; Chauvière, L. and Gallais, Y. and Cazayous, M. and Méasson, M. A. and Sacuto, A. and Colson, D. and Forget, A. 2011; Blumberg et al. 1994. On the contrary, the exciton-phonon interaction with the B mode is weak. The signs of the coupling for the B and B modes are opposite. For these two modes, the magnitude of coupling is temperature independent above , but decreases and saturates on cooling below . The temperature dependence of the coupling strength is influenced mainly by two factors: the screening effect of free carriers, reduced below due to the emergence of a pronounced spectral gap Larkin et al. 2017; Volkov et al. 2021a, and the change of the crystal structure below .

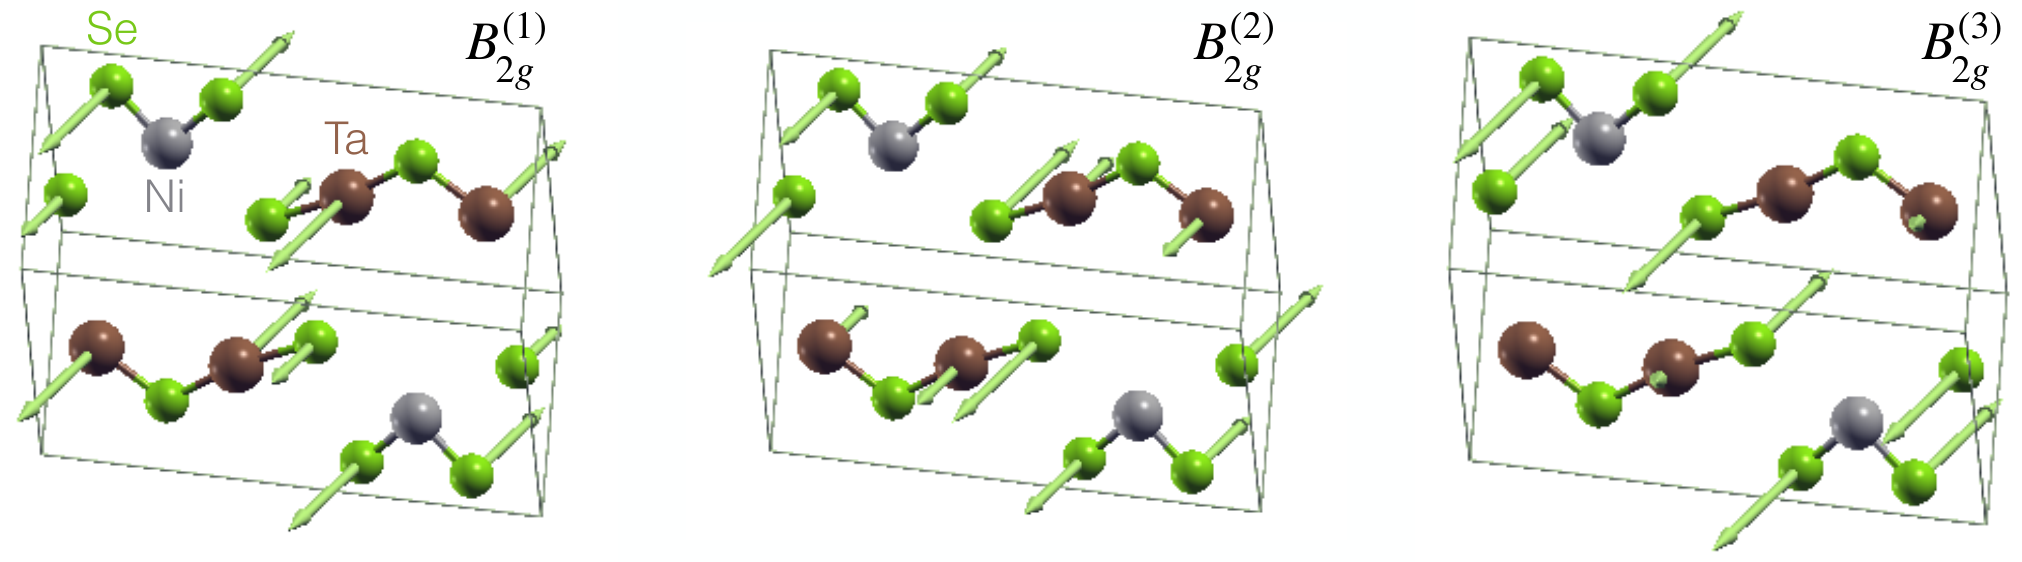
The difference in magnitude of the exciton-phonon coupling for B and B modes can be readily understood from the corresponding displacement patterns obtained from the DFT calculations for Ta2NiSe5 and shown in Fig. 11. The calculated patterns are consistent with those reported in other studies Nakano et al. 2018b; Baldini et al. 2020. While both the B modes involve displacements of Ta and Se, the B mode involve a displacement of Se almost exclusively (the Ni atoms are at the inversion centers and thus do not contribute to the Raman-active phonon modes). As the electronic bands in Ta2NiSe5 close to the Fermi level are believed to be predominantly formed by Ta and Ni electrons Kaneko et al. 2013; Mazza et al. 2020; Watson et al. 2020, with much smaller contribution of Se, it appears natural that the B mode does not couple to the low-energy electronic degrees of freedom. Furthermore, the vibration of the Ta atoms for B and B displacements are in anti-phase, which can explain the opposite signs of the exciton-phonon coupling for these modes.
The temperature dependence of the light-scattering vertex and the frequency at which the continuum has maximum intensity are shown in Fig. 10(b). Above , the quantity linearly decreases on cooling; below , it rapidly increases and saturates at low temperature.
V.6 The fitting results for Ta2Ni(Se1-xSx)5 with = 0.25 and 0.67
To compare with the results for Ta2NiSe5, we also fit the polarization spectra for the alloy compositions ( = 0.25 and 0.67) above their transition temperature. We are not able to perform a Fano analysis below for two reasons: (a) we have no knowledge of the domain structure and the sound velocity; and (b) we cannot properly subtract the leakage of the Ag modes. In Fig. 12 we show one characteristic Fano fit for Ta2Ni(Se0.75S0.25)5 and Ta2Ni(Se0.33S0.67)5, respectively. The fitting parameters are given in Fig. 13.

The results are similar to the case of Ta2NiSe5: for the coupling strength, we find positive , negative , and negligible ; the light-scattering vertex has no temperature dependence above the transition temperature; the energy at which the excitonic continuum has maximum intensity, , decreases linearly on cooling above the transition temperature. Extrapolating to zero value of , we obtain K for Ta2Ni(Se0.75S0.25)5 and K for Ta2Ni(Se0.33S0.67)5.
In Table. 4 we present the doping dependence of the relevant physical quantities above the transition temperature for Ta2Ni(Se1-xSx)5 family. Because the coupling strength increases with sulfur doping, determining the intrinsic phonon parameters, especially the linewidth, becomes more difficult for Ta2Ni(Se0.75S0.25)5 and Ta2Ni(Se0.33S0.67)5.
| x=0 | x=0.25 | x=0.67 | |
|---|---|---|---|
| (arb. units) | 7.22 | 7.36 | 7.48 |
| (meV) | 2.45 | 2.61 | 3.61 |
| (meV) | -4.03 | -4.61 | -5.87 |
VI Temperature dependence of the intrinsic phonon parameters
In this section we present the temperature dependence of intrinsic phonon-mode parameters: energies, intensities and linewidths. The results for B2g-symmetry modes are given in SubSec. VI.1, and those for Ag-symmetry modes are given in SubSec. VI.2.
VI.1 B2g-symmetry Phonon Modes
VI.1.1 Ta2NiSe5
In Fig. 14 we show the temperature dependence of the spectral parameters for B2g-symmetry phonon modes in Ta2NiSe5: the bare phonon frequency, FWHM, and integrated intensity.
Below , the temperature dependence of both frequency and FWHM of the phonon modes can be accounted for by standard model assuming anharmonic decay into two phonons with identical frequencies and opposite momenta Klemens 1966:
| (16) |
and
| (17) |
We note that a low value of indicated high quality of the crystals.
Above , however, the slope of the FWHM increases for the three phonon modes, and the FWHM becomes larger than the value predicted by the anharmonic decay model. The appearance of additional decay channels above is related to the presence of gapless particle-hole pairs. Indeed, above Ta2NiSe5 is gapless spectroscopicallyVolkov et al. 2021a, while below a gap rapidly develops at low energies, suppressing the damping due to particle-hole pairs. Because the Fano model used for fitting takes into account the damping due to exciton-phonon interaction, existence of additional damping above suggests the importance of the interactions beyond that model, i.e. nonlinear ones.
More noticeable is that the frequencies of the B and B modes exhibit a large increase on cooling from around 350 K to . The frequency of the B mode, however, does not show such anomaly. Only B and B modes exhibit this anomaly; interestingly (1) they are allowed to couple to interband scattering by symmetry selection rules and (2) their corresponding vibration involve motion of Ni atoms and hence they couple to the electronic bands near Fermi level. Although B mode can also couple to the interband scattering, its vibrational pattern almost does not contain motion of Ni atoms.
As for the integrated intensity, B and B modes have around 2-fold increase of intensity on cooling below , while B mode shows temperature-independent intensity. Two factors could influence the intensity. First, the interaction-induced gap opening up below should play a major role. The system gradually changes from a semimetal at high temperature to an insulator at low temperature. The screening effect, which reduces the light-scattering vertex, and in turn, the intensity for phonon modes, is suppressed on cooling. This factor therefore favors increase of intensity on cooling. Second, the structural change below could play also a role. The ion positions are shifted within the unit cell below , and the vibrational patterns of the three B2g modes are modified. Therefore, the polarizability induced by lattice vibrations, which is proportional to the phonon intensity, also change with temperature. The fact that B mode shows temperature-independent intensity might be related to its unique vibrational pattern.
VI.1.2 The alloy compositions (=0.25, 0.67)
In Fig. 15 and 16 we show the temperature dependence of the B2g-mode spectral parameters for Ta2Ni(Se0.75S0.25)5 and Ta2Ni(Se0.33S0.67)5, respectively. Although we do not perform Fano analysis for the data below , we use Lorentzian lineshape to fit the B mode at low-enough temperatures, at which the lineshape is essentially symmetric. For the B and B modes, because they are not well separated from the leakage of Ag modes, it is difficult to reliably obtain their spectral parameters.


For the alloy compositions, the increase of the FWHM slope above is not as strong as in the case of Ta2NiSe5. Moreover, although for Ta2NiSe5 the large frequency increase of the B mode on cooling happens in a 20 K energy range, the frequency increase for the alloy compositions happens in a much larger energy range.
VI.1.3 Ta2NiS5
Ta2NiS5 is a semiconductor that, in contrast to Ta2NiSe5 , does not show signatures of an excitonic insulator like the flattening of valence band dispersion Mu et al. 2018; Chiba et al. 2019. Consistent with its semiconductor nature, we observe no excitonic continuum and in turn no asymmetric lineshape for the phonon modes, Fig. 2(c-d). In Fig. 17 we zoom in on the temperature dependence of the phonons in scattering geometry. The three B2g-symmetry phonon modes exhibit conventional Lorentzian lineshapes, and the linewidth has almost 4-fold decrease on cooling from 315 K to 35 K. Moreover, the B and B modes show softening behavior on cooling.

In Fig. 18 we show the temperature dependence of the spectral parameters for the B2g-symmetry phonon modes for Ta2NiS5: the frequency, FWHM, and the integrated intensity. These spectral parameters are obtained by fitting the measured spectral features with Lorentzian lineshapes.
The behavior of the B2g-symmetry modes is not consistent with the anharmonic decay model: for B and B modes, the frequency anomalously decreases on cooling; for B mode, the decrease of FWHM on cooling is too steep to be accounted by the anharmonic decay model. Hence, we suggest that there is a change in the phonon self energy, which must affect the the apparent mode frequency. For the B and B modes, whose frequency is below 30 meV, the energy decreases on cooling; for the B mode, whose frequency is above 30 meV, the energy increases on cooling.
The integrated intensity of B mode is temperature-independent, while that of the other modes increases on cooling. However, different from the case of Ta2NiSe5, in which the increase of the intensity happens below , the intensity increase of the Ta2NiS5 modes is through the whole measured temperature range.
VI.2 Ag-symmetry phonon modes
In this subsection we discuss the properties of the full-symmetric phonon modes; the relevant results are shown in Fig. 19 with respect to the overall spectral weight distribution in the Ag channel, and in Figs. 20 and 21 regarding the spectral parameters of the individual Ag modes. In Fig. 21 we compare the temperature dependence of the spectral parameters (frequency, FWHM, and integrated intensity) of the Ag-symmetry phonon modes for Ta2NiSe5 and Ta2NiS5 crystals. The temperature dependence of both frequency and FWHM above for these modes can be accounted by the anharmonic decay model [Eq. (16-17)].
The FWHM of the Ag-symmetry modes (except for A and A) for Ta2NiSe5 exhibit an anomalous increase above the transition temperature, which we attribute to enhanced electron-phonon scattering rate in its semimetal phase. However, the modes of Ta2NiS5 show no anomaly of FWHM, because it is a semiconductor with a direct gap observed throughout the measured temperature range.
The intensity of most modes has more than 2-fold increase on cooling, with a few exceptions: for Ta2NiSe5, the intensity of the A mode is independent of temperature, while the intensity of the A phonon mode decreases on cooling; for Ta2NiS5, the intensities of the A and A modes are temperature independent.
The enhancement of intensity on cooling in the semimetallic samples could in principle be related to the change of electronic structure (less screening effect) below . However, an interesting insight can be further obtained by computing the integral (Fig. 19). In the limit this integral is proportional to the static susceptibility in the scattering geometry, which is expected to be approximately constant as a function of temperature since there is no instability in Ag channel. On cooling, the phonon intensity is enhanced [Fig. 21], while the electronic continuum is suppressed [Fig. 2(a)]. However, the integral is essentially temperature independent at 70 meV. This conservation implies that the enhancement of the phonon intensity is balanced by the reduction of the electronic intensity. Note that these effects occur at temperatures below , where the continuum in B2g symmetry is strongly suppressed, indicating the opening of a gap. On the other hand, strong correlation effects have been shown to lead to a non-zero intensity within the gap Volkov et al. 2021a. Thus, the peculiar balance between the electronic and phononic contributions at low energies implies an unconventional coupling of the electronic modes to the Ag phonons in the correlated excitonic insulator state.


For comparison, in Fig. 20 we show the temperature dependence of the spectral parameters for the A mode for Ta2Ni(Se1-xSx)5 with and 0.67. Because of the difficulty caused by broad lineshape and two-frequency behavior of the phonon modes for alloy compositions, only the lowest-frequency A mode, which are well separated from other modes in frequency, renders reliable fitting results. For Ta2Ni(Se0.75S0.25)5, some linewidth broadening is observed above , which is weaker than for Ta2NiSe5. However, for Ta2Ni(Se0.33S0.67)5 almost no broadening is observed.
VII Relation to time-resolved experiments
In this section we convert Raman response from frequency domain to time domain, and discuss relevant time-resolved studies on Ta2NiSe5.
We first discuss the appearance of B2g-symmetry excitations in the time domain, obtained by inverse Fourier transform of the Raman response, see Fig. 22. Above the transition temperature, the phonon-exciton interaction significantly broadens the spectral features [Fig. 22(a)]; as a result the deduced time-resolved response decays fast and essentially dies out before 5 ps [Fig. 22(b)]. For the bare phononic response, the time-domain signal beyond 4 ps is dominated by the oscillation of 2 THz mode [Fig. 22(c)], corresponding to the B phonon. The signal of the bare excitonic response shows a pure relaxational behavior [Fig. 22(d)]. Comparing Fig. 22(b) and (c), we note that it is difficult to identify the Fano interference feature from time-domain signal, because such interference exhibits no distinct characters in the time domain, except for that the oscillations are strongly damped. Indeed, in ultrafast studies, the interference nature is not revealed even after Fourier transform of the time-domain data to the frequency domain Werdehausen et al. 2018; Ning et al. 2020; Baldini et al. 2020. The likely reason for that is the high pump fluence used, causing the exciton and phonon responses decouple already on the very early time scales.
Below the transition temperature, the energy at which the continuum has maximum response moves to higher energy, and the phonon-exciton coupling strength is reduced. Consequently, the interference effect is suppressed and the combined response is essentially the same as the bare phononic response [Fig. 22(f-g)]. The bare excitonic response still has a pure relaxational time dependence, with very short lifetime [Fig. 22(d) and (h)].
For comparison, in Fig. 23 we present the time-domain signal for the Ag-symmetry excitations. Above the transition temperature, although multiple oscillations are simultaneously present at short time scale, beyond 10 ps the time-domain signal is dominated by the oscillation of 1 THz [Fig. 23(b)], corresponding to the A phonon mode whose spectral width is much smaller than others [Fig. 23(a)]. At low temperature, the difference between the spectral widths of various modes is reduced [Fig. 23(c)]; hence, these modes have comparable lifetime and multiple oscillations survive beyond 10 ps [Fig. 23(d)].
In relation to the ultra-fast studies of Ta2NiSe5 Werdehausen et al. 2018; Andrich et al. 2020; Bretscher et al. 2021; Liu et al. 2021, the Raman results are consistent with the ultra-fast data under low fluence. One ultra-fast work Werdehausen et al. 2018 provides evidence for coupling between the A mode and the amplitude mode of the condensate under high-fluence pumping. We note that in our studies we can unambiguously identify the amplitude mode with the excitonic continuum we observe. Above the transition temperature, the overdamped excitonic mode softens on cooling towards ; just below the transition temperature, its energy increases on further cooling. Such temperature dependence of mode energy is characteristic of an amplitude mode while the optical B2g phonons only harden on cooling. In Fig. 24 we present the time-domain signal corresponding to the excitonic mode around the transition temperature.

Additionally, a mode associated with the phase of the excitonic order parameter may exist. The electron-phonon coupling and exchange interactions modify the otherwise sombrero-shape free-energy landscape, reducing the continuous U(1) symmetry to a discrete Z2 symmetry, leading to a finite energy of the phase mode. A recent pump-probe microscopy study suggests that the phase-mode energy is smaller than the A-mode energy (around 4 meV) Andrich et al. 2020. However, we do not observe any mode down to 0.4 meV at low temperature [Fig. 22(e)]. Furthermore, the phase oscillations of the order parameter should harden above , which would have manifested itself in the low-energy range of the spectra. Such signatures are not observed, either [Fig. 6]. Therefore, existence of the phase mode below 4 meV is not supported by the Raman data.
VIII Conclusions
We have employed polarization resolved Raman spectroscopy to conduct a systematic spectroscopic study of the lattice dynamics in Ta2Ni(Se1-xSx)5 (, …, 1) family of the excitonic insulators.
We identify and classify by symmetry all the Raman active phonon modes of Ag and B2g symmetries. A change in selection rules is detected at temperature , indicating the orthorhombic-to-monoclinic structural phase transition related to the excitonic insulator state Volkov et al. 2021a; Volkov et al. 2021b. We find that the symmetry breaking transition persists for entire Ta2Ni(Se1-xSx)5 family with monotonically decreasing from 328 K for to 120 K for . Its signatures in the resistivity data, however, become weak or undetectable for large sulfur concentration that we attribute to the weakness of the symmetry breaking at large , demonstrated by the decrease of phonon intensity in the ’forbidden’ scattering geometry.
For , the two lowest-frequency -quadrupole-symmetry B and B phonon modes show strongly asymmetric lineshapes at high temperatures, which is indicative of coupling between the phonons and an excitonic continuum of the same symmetry Volkov et al. 2021a; Volkov et al. 2021b. Within the framework of extended Fano model, we develop a quantitative description of the observed lineshapes, enabling us to disentangle the excitonic and phononic contributions to the spectra, to derive the intrinsic phonon parameters and determine the exciton-phonon interaction strength, that affects the transition temperature Volkov et al. 2021b. The displacement patterns obtained from ab-initio calculations explain the trends in the deduced exciton-phonon coupling values. At the remnant excitonic continuum demonstrates signatures of coupling to the finite-momentum B2g -symmetry acoustic phonons, allowed due to scattering on a quasi-periodic structural of domain walls. We have also shown that the coupling to the excitonic continuum explains the acoustic mode softening observed in Nakano et al. 2018b; Volkov et al. 2021b.
The intrinsic parameters of the optical phonons for Ta2NiSe5 and Ta2NiS5 at low temperatures are mostly in good agreement with anharmonic decay model and DFT calculations. For alloy compositions a two-mode behavior is found for most modes, where signatures appear at two frequencies, corresponding to the ones in Ta2NiSe5 and Ta2NiS5. However, several types of anomalous behavior have been observed in the temperature dependencies. For , the B and B modes anomalously harden close to (e.g., Fig. 14), indicating an interaction with continuum beyond Fano model description Volkov et al. 2021a. For Ta2NiS5 (Fig. 18) the B and B modes do not show Fano shapes, but the frequencies of these modes anomalously soften on cooling, although never going critical. Finally, the intensity of the most modes is strongly temperature dependent. Interestingly, for Ta2NiSe5 we observe that the sum of electronic and phononic contributions to the static susceptibility is conserved (Fig. 19), pointing to an unexpected electron-phonon coupling mechanism within the excitonic insulator state.
In addition, based on our results we have provided an interpretation of recent time-resolved pump-probe experiments and discussed the signatures expected from the modes we have observed, see Figs. 22, 23 and 24. Overall, this work provides a comprehensive study lattice dynamics in Ta2Ni(Se1-xSx)5; more generally, the unconventional behaviors we observed point to the importance of the effects of electron-phonon coupling in correlated semimetals.
Acknowledgements.
M.Y. and P.A.V. contributed equally to this work. We acknowledge discussions with K. Haule. We are grateful to Y. Kauffmann for help with TEM measurements. The spectroscopic work conducted at Rutgers was supported by NSF Grant No. DMR-1709161 (M.Y. and G.B). P.A.V. acknowledges the Postdoctoral Fellowship support from the Rutgers University Center for Materials Theory. The sample growth and characterization work conducted at the Technion was supported by the Israel Science Foundation Grant No. 320/17 (H.L., I.F. and A.K.). H.L. was supported in part by a PBC fellowship of the Israel Council for Higher Education. The work at NICPB was supported by the Estonian Research Council Grant No. PRG736 an by the European Research Council (ERC) under Grant Agreement No. 885413. M.K. was supported by NSF DMREF grant DMR-1629059.Appendix A Estimation of heating in excitation laser spot
We use three methods to estimate the heating rate, a measure of the temperature increase per unit laser power in the focused laser spot (KmW): (i) Stokes/anti-Stokes Raman scattering intensity ratio analysis; (ii) monitoring laser power that is inducing the phase transition; and (iii) a thermoconductivity model calculation. We use data for Ta2NiSe5 as an example to illustrate these methods.
For the first method, we note that the Stokes scattering cross section and Anti-Stokes cross section are related by the detailed balance principle Hayes and Loudon 1978
| (18) |
in which stands for the Bose factor
| (19) |
where is the reduced Planck’s constant, is frequency, is the Boltzmann’s constant, and is the temperature in the laser spot.
We studied the Stokes and Anti-Stokes cross section relation for the scattering geometry at 295 K environmental temperature with various laser power. In Fig. 25 we show the results measured with 8 mW laser power as an example. The Raman responses calculated from Stokes and Anti-Stokes cross sections match well with the temperature at the laser spot being 307 K. We use Eq. (21) with the phonon intensity integrated from 7.5 to 8.5 meV to calculate the temperature at the laser spot. By a linear fit to the power dependence of the laser-spot temperature, we find the heating rate to be 1.290.17 K mW.

For the second method, we gradually increase laser power at 295 K environmental temperature. We find that when the laser power is in the range of 264 mW, the domain stripes, which are visible across the sample surface under laser illumination, disappear inside the laser spot. Moreover, the temperature dependence of phonon width and intensity has a sudden change. We assume that at this laser power, the temperature at the laser spot reaches the transition temperature 328 K Salvo et al. 1986; Lu et al. 2017, yielding the heating rate of 1.250.20 K mW. We note that for Ta2NiS5, we do not observe domain stripes below its transition temperature 120 K. Its transition temperature is identified by the sudden change of phonon intensity, see Fig. 18(b) for example.

For the third method, we consider a heated region shown in Fig. 26 of a rectangular shape, with the dimensions given by the beam spot size and the penetration depth. The static heat equation takes the form:
| (22) |
where is the power density. We ignore the cooling provided by the helium gas flow above the sample surface, so that there is no heat flow at the boundary, while deep inside the bulk the temperature should reach the base temperature . Equation (22) can be solved using Green’s function of the Laplace equation and image method to satisfy the first boundary condition. In the latter, we extend the equation formally to half-space and add an ”image” power density
| (23) |
The solution is then given by:
| (24) |
where . The solution decays as at large distances and thus satisfies the second boundary condition of Eq. (22). An analytical result can be obtained for
| (25) |
at in the limit , where is the laser power and is the transmission coefficient of the sample. Performing the integral one obtains
| (26) |
Qualitatively, the result can be understood as follows. Due to the anisotropic shape of the heated region, right below it most heat is transferred along the axis. However, the one-dimensional heat equation would result in a linear solution , depending on the cutoff scale . It can be estimated from the condition of the heat flow to the lateral direction being equal to the heat flow along . Approximating the temperature gradient along as one gets the condition
| (27) |
that results in the estimate
| (28) |
Equating the total heat flow outside this region to the input power one obtains the estimate
| (29) |
Overall, one notices that the temperature increase scales with the linear size of the spot. The laser heating power is then determined as ; for the actual estimate we thus need to find the transmission coefficient first.
The transmission coefficient can be calculated from the complex index of refraction by the relationship :
| (30) |
in which and are the real and imaginary part of . The complex index of refraction can be obtained from the complex dielectric constant by the relationship :
| (31) |
where and are the real and imaginary part of . The imaginary part can be calculated from the real part of the optical conductivity :
| (32) |
in which the unit of is cm-1 and that of is cm-1. The polarization of the incoming light is along a-axis of the sample. Because the quantities and are 8.13 and 2.47 cm-1 respectively at the laser wavelength Larkin et al. 2017, we find t=0.64.
The experimentally measured thermal conductivity Zhang et al. 2021 at 295 K is = 208 mWK-1cm-1 and = 57.4 mWK-1cm-1.
The length scales cm and cm is determined by the m2 laser spot. The length is the skin depth, which is calculated from the imaginary part of the index of refraction :
| (33) |
in which the unit of is cm-1 and that of is cm. At the laser wavelength, =1.5, and we find cm (70 nm).
The known values for the variables in Eq. (26) are summarized in Table 5. Because is unknown, we cannot use Eq. (26) to calculate the laser heating rate. However, if the heating rate is 1.29 K mW at 295 K, as determined from the Stokes/anti-Stokes analysis, the value for should be 1.38 mWK-1cm-1.
| Quantity (unit) | a-axis | c-axis |
|---|---|---|
| (mWK-1cm-1) | 208 | 57.4 |
| (10-3cm) | 5 | 10 |
An estimate for the electronic contribution to thermal conductivity could be calculated from the electric resistivity by virtue of Wiedemann-Franz law:
| (34) |
in which mWK-2 is the Lorenz number. The resistivity along b axis at 295 K is cm Arima et al. 2020, and we find = 0.0308 mWK-1cm-1. The ratio of to is consistent with the ratios obtained along a and c axes Zhang et al. 2021. Moreover, that is consistent with the quasi-2D structure of the system Sun et al. 2009.
To illustrate that the laser heating rate is strongly temperature dependent, we use Eq. (26) to calculate the heating rate as a function of temperature. The temperature dependence of and are taken from Ref. Zhang et al. 2021. We assume that the ratio of to is temperature independent, and fix this ratio to be . In Fig. 27 we show the calculated heating rate. Because of such assumption, the laser heating rate at 295 K is the same as that determined from the Stokes/anti-Stokes analysis.
Appendix B The fitting model for the Fano interference
Above , the B and B phonon modes of Ta2NiSe5 exhibit strongly asymmetric Fano lineshapes. To analyze the physics of this Fano interference features, we propose a model describing three phonon modes individually coupled to broad excitonic continuum. The total Raman response is described in the following way:
| (35) |
where denotes the vertices for light scattering process (the subscript ”T” denotes ”Transpose”), in which . comprises the Green’s functions for the interacting phononic and excitonic excitations that can be obtained by solving the Dyson equation:
| (36) |
In Eq. (36)
| (37) |
is the bare Green’s function and
| (38) |
is the exciton-phonon interaction. Here the bare phononic Green’s function
| (39) |
correspond to the B-symmetry phonon modes (i=1,2,3),
| (40) |
represents the excitonic continuum, and denotes exciton interaction strength with the corresponding phonons. For phononic equation, the parameters and have the meaning of the mode frequency and the half width at half maximum (HWHM), respectively. For the excitonic equation, is the energy of the overdamped excitations and represents the relaxation rate. The quantity denotes the energy at which the excitonic continuum has maximum intensity.
The bare phononic and excitonic responses are
| (41) |
and
| (42) |
These two expressions are related to Eqsw. (1-2) in the main text.
The renormalized phononic and excitonic responses, and , as well as the interference term are calculated from the renormalized Green’s function :
| (43) |
where represents the interference between the phononic modes and the continuum.
The phononic term is calculated from the 3x3 phononic block:
| (44) |
the excitonic term results from the 1x1 excitonic block:
| (45) |
and the interference term is given by the off-diagonal block
| (46) |
These three terms, as defined, satisfy Eq. (4):
| (47) |
For the spectra below , especially at about 300 K, this model cannot properly account for the low frequency Raman response. This additional spectral feature is related to Raman coupling to the longitudinal acoustic excitations at finite momenta in the presence of quasi-periodic domain walls, detailed in the main text. The Green’s function of each individual acoustic mode has form similar to the phononic Green’s function:
| (48) |
Its light-scattering vertex and coupling to the excitonic continuum are both proportional to the square root of wavevector: and . The frequency and the HWHM are both proportional to the wavevector: and .
After introducing this mode, Eqs. (37-38) extend to
| (49) |
| (50) |
and the vertex for light-scattering process becomes .
Then the total response function containing coupling to acoustic mode for domain walls lattice constants apart is given by
| (51) |
Due to the requirement of causality, the real part of susceptibility should be an even function while the imaginary part should be an odd function. Therefore, the static Raman susceptibility is purely real. The total static Raman susceptibility is given by
| (52) |
The bare phononic static Raman susceptibility can be obtained from
| (53) |
Similarly, the bare excitonic static Raman susceptibility is given by
| (54) |
For temperature-independent , the temperature dependence of directly follows that of .
Using the Green’s function , which describes the interacting phononic (both optical and acoustic) and excitonic excitations, we can evaluate the renormalization of sound velocity above . Because the relevant frequencies for the acoustic mode are much lower than that of the optical or excitonic modes, we can keep only in the bare acoustic mode’s Green’s function:
| (55) |
in which finite linewidths of phonon modes are neglected. The pole of this Green’s function is obtained by requiring the determinant of inverse to be zero:
| (56) |
Identifying as , in which represents the renormalized sound velocity above , we have
| (57) |
Appendix C Illustration of the fitting model for the Fano interference

To provide more insights into the fitting model described in Appendix B, we consider a simplified case in which only one phonon mode couples to an excitonic continuum. When exciton-phonon interaction is zero, the total Raman response is reduced to the sum of the excitonic component and the phononic component:
| (58) |
in which stands for .
In Fig. 28 we show the excitonic continuum coupling with the B and B phonon modes in an individually way to illustrate the effect of coupling. First we discuss the renormalization effect. The renormalized phonon mode shifts in energy and broadens in lineshape. If we neglect the bare phonon width for simplicity, the central energy of the renormalized phonon mode, , can be expressed as
| (59) |
For both the B and B phonon modes, is smaller than ; therefore is smaller than , meaning the renormalized phonon mode shifts to lower energy. Interestingly, at frequency the renormalized excitonic continuum has the same intensity as the unrenormalized continuum; below the excitonic response is enhanced while above the excitonic response is suppressed.

Second we discuss the interference effect. For the interference term, corresponding to the off-diagonal elements of the renormalized Green’s function, there is a frequency at which it changes the sign. The frequency has the following expression
| (60) |
We note that is a bit larger than . The shape of the interference term is controlled by sign of : for positive , below the zero-intensity point the interference term has positive intensity while the intensity is negative above the zero-intensity point; for negative , the opposite is true. Far away from the resonance, the interference term decays to zero because the phonon mode has negligible intensity at such high energy.
Finally we note that when is much larger than and , the Raman response is In Fig. 29 we show how the coupling strength , and the energy at which the excitonic continuum has maximum intensity influence the combined Raman response. The lineshape becomes more asymmetric with increasing [Fig. 29 (a)]. When is varied, we find that the lineshape becomes more asymmetric for smaller [Fig. 29 (b)].
approximately . Therefore, can be determined by fitting the data at large .
Appendix D The fitted parameters of the anharmonic decay model for Ta2NiSe5 and Ta2NiS5
The temperature dependence of both frequency and FWHM for the most phonon modes of Ta2NiSe5 and Ta2NiS5 modes can be accounted by the anharmonic decay model [Eq. (16-17)]. The values for the parameters from fitting are summarized in Table 6.
| Mode | ||||
|---|---|---|---|---|
| Ta2NiSe5 | ||||
| A | 4.235(16) | 0.0038(10) | 0.06(4) | 0.0014(15) |
| B | 8.721(5) | 0.0290(11) | 0.073(15) | 0.019(3) |
| A | 12.484(12) | 0.0405(22) | 0.09(3) | 0.025(6) |
| B | 15.35(4) | 0.070(15) | 0.05(10) | 0.09(4) |
| A | 17.077(12) | 0.191(5) | 0.08(5) | 0.114(23) |
| B | 18.45(3) | 0.050(16) | 0.11(10) | 0.08(5) |
| A | 22.28(3) | 0.082(15) | 0.12(8) | 0.05(4) |
| A | 24.287(11) | 0.129(6) | 0.05(3) | 0.072(15) |
| A | 27.17(4) | 0.137(16) | 0.23(11) | 0.09(5) |
| A | 29.62(6) | 0.21(3) | 0.18(16) | 0.12(9) |
| A | 36.75(14) | 0.30(8) | 0.3(4) | 0.09(24) |
| Ta2Ni(Se0.75S0.25)5 | ||||
| A | 4.277(16) | 0.0039(9) | 0.12(5) | 0.0025(34) |
| B | 8.758(7) | 0.0322(15) | 0.252(21) | 0.028(4) |
| Ta2Ni(Se0.33S0.67)5 | ||||
| A | 4.630(12) | 0.0048(8) | 0.10(2) | 0.0012(11) |
| B | 8.739(19) | 0.032(4) | 0.479(26) | 0.022(4) |
| Ta2NiS5 | ||||
| A | 5.025(10) | 0.0040(7) | 0.068(25) | 0.0014(19) |
| A | 16.198(4) | 0.0610(13) | 0.051(9) | 0.0359(26) |
| A | 19.276(11) | 0.134(4) | 0.11(3) | 0.070(11) |
| A | 33.92(4) | 0.111(19) | 0.28(11) | 0.15(6) |
| A | 36.634(10) | 0.138(5) | 0.056(28) | 0.112(16) |
| A | 40.29(20) | 0.21(12) | 0.6(7) | 0.3(4) |
| A | 43.39(6) | 0.29(4) | 0.01(14) | 0.17(9) |
| A | 49.72(3) | 0.23(3) | 0.04(10) | 0.45(8) |
References
- Kohn (1967) W. Kohn, Excitonic phases, Physical Review Letters 19, 439 (1967).
- Halperin and Rice (1968) B. I. Halperin and T. M. Rice, Possible anomalies at a semimetal-semiconductor transition, Rev. Mod. Phys. 40, 755 (1968).
- Kohn and Sherrington (1970) W. Kohn and D. Sherrington, Two kinds of bosons and bose condensates, Rev. Mod. Phys. 42, 1 (1970).
- Pillo et al. (2000) T. Pillo, J. Hayoz, H. Berger, F. Lévy, L. Schlapbach, and P. Aebi, Photoemission of bands above the Fermi level: The excitonic insulator phase transition in , Phys. Rev. B 61, 16213 (2000).
- Cercellier et al. (2007) H. Cercellier, C. Monney, F. Clerc, C. Battaglia, L. Despont, M. G. Garnier, H. Beck, P. Aebi, L. Patthey, H. Berger, and L. Forró, Evidence for an Excitonic Insulator Phase in , Phys. Rev. Lett. 99, 146403 (2007).
- Monney et al. (2011) C. Monney, C. Battaglia, H. Cercellier, P. Aebi, and H. Beck, Exciton Condensation Driving the Periodic Lattice Distortion of , Phys. Rev. Lett. 106, 106404 (2011).
- Kogar et al. (2017) A. Kogar, M. S. Rak, S. Vig, A. A. Husain, F. Flicker, Y. I. Joe, L. Venema, G. J. MacDougall, T. C. Chiang, E. Fradkin, J. van Wezel, and P. Abbamonte, Signatures of exciton condensation in a transition metal dichalcogenide, Science 358, 1314 (2017).
- Lu et al. (2017) Y. F. Lu, H. Kono, T. I. Larkin, A. W. Rost, T. Takayama, A. V. Boris, B. Keimer, and H. Takagi, Zero-gap semiconductor to excitonic insulator transition in , Nat. Commun. 8, 14408 (2017).
- Salvo et al. (1986) F. D. Salvo, C. Chen, R. Fleming, J. Waszczak, R. Dunn, S. Sunshine, and J. A. Ibers, Physical and structural properties of the new layered compounds and , J. Less Common. Met. 116, 51 (1986).
- Wakisaka et al. (2009) Y. Wakisaka, T. Sudayama, K. Takubo, T. Mizokawa, M. Arita, H. Namatame, M. Taniguchi, N. Katayama, M. Nohara, and H. Takagi, Excitonic Insulator State in Probed by Photoemission Spectroscopy, Phys. Rev. Lett. 103, 026402 (2009).
- Seki et al. (2014) K. Seki, Y. Wakisaka, T. Kaneko, T. Toriyama, T. Konishi, T. Sudayama, N. L. Saini, M. Arita, H. Namatame, M. Taniguchi, N. Katayama, M. Nohara, H. Takagi, T. Mizokawa, and Y. Ohta, Excitonic Bose-Einstein condensation in above room temperature, Phys. Rev. B 90, 155116 (2014).
- Watson et al. (2020) M. D. Watson, I. Marković, E. A. Morales, P. Le Fèvre, M. Merz, A. A. Haghighirad, and P. D. C. King, Band hybridization at the semimetal-semiconductor transition of enabled by mirror-symmetry breaking, Phys. Rev. Research 2, 013236 (2020).
- Mor et al. (2017) S. Mor, M. Herzog, D. Golež, P. Werner, M. Eckstein, N. Katayama, M. Nohara, H. Takagi, T. Mizokawa, C. Monney, and J. Stähler, Ultrafast electronic band gap control in an excitonic insulator, Phys. Rev. Lett. 119, 086401 (2017).
- Murakami et al. (2017) Y. Murakami, D. Golež, M. Eckstein, and P. Werner, Photoinduced enhancement of excitonic order, Phys. Rev. Lett. 119, 247601 (2017).
- Liu et al. (2021) Q. M. Liu, D. Wu, Z. A. Li, L. Y. Shi, Z. X. Wang, S. J. Zhang, T. Lin, T. C. Hu, H. F. Tian, J. Q. Li, T. Dong, and N. L. Wang, Photoinduced multistage phase transitions in Ta2NiSe5, Nature Communications 12, 2050 (2021).
- Ning et al. (2020) H. Ning, O. Mehio, M. Buchhold, T. Kurumaji, G. Refael, J. G. Checkelsky, and D. Hsieh, Signatures of Ultrafast Reversal of Excitonic Order in , Phys. Rev. Lett. 125, 267602 (2020).
- Werdehausen et al. (2018) D. Werdehausen, T. Takayama, M. Höppner, G. Albrecht, A. W. Rost, Y. Lu, D. Manske, H. Takagi, and S. Kaiser, Coherent order parameter oscillations in the ground state of the excitonic insulator , Science Advances 4, aap8652 (2018).
- Kaneko et al. (2013) T. Kaneko, T. Toriyama, T. Konishi, and Y. Ohta, Orthorhombic-to-monoclinic phase transition of Ta2NiSe5 induced by the Bose-Einstein condensation of excitons, Phys. Rev. B 87, 035121 (2013).
- Mazza et al. (2020) G. Mazza, M. Rösner, L. Windgätter, S. Latini, H. Hübener, A. J. Millis, A. Rubio, and A. Georges, Nature of Symmetry Breaking at the Excitonic Insulator Transition: , Phys. Rev. Lett. 124, 197601 (2020).
- Baldini et al. (2020) E. Baldini, A. Zong, D. Choi, C. Lee, M. H. Michael, L. Windgaetter, I. I. Mazin, S. Latini, D. Azoury, B. Lv, A. Kogar, Y. Wang, Y. Lu, T. Takayama, H. Takagi, A. J. Millis, A. Rubio, E. Demler, and N. Gedik, The spontaneous symmetry breaking in Ta2NiSe5 is structural in nature (2020), arXiv:2007.02909 [cond-mat.str-el] .
- Chiba et al. (2019) Y. Chiba, T. Mitsuoka, N. L. Saini, K. Horiba, M. Kobayashi, K. Ono, H. Kumigashira, N. Katayama, H. Sawa, M. Nohara, Y. F. Lu, H. Takagi, and T. Mizokawa, Valence-bond insulator in proximity to excitonic instability, Phys. Rev. B 100, 245129 (2019).
- Hayes and Loudon (1978) W. Hayes and R. Loudon, Scattering of Light by Crystals (John Wiley and Sons, New York, 1978).
- Volkov et al. (2021a) P. A. Volkov, M. Ye, H. Lohani, I. Feldman, A. Kanigel, and G. Blumberg, Critical charge fluctuations and emergent coherence in a strongly correlated excitonic insulator, npj Quant. Mater. 6, 52 (2021a).
- Volkov et al. (2021b) P. A. Volkov, M. Ye, H. Lohani, I. Feldman, A. Kanigel, and G. Blumberg, Failed excitonic quantum phase transition in Ta2Ni(Se1-xSx)5, An accompanying paper (2021b), arXiv:2104.07032 [cond-mat.str-el] .
- Blöchl (1994) P. E. Blöchl, Projector augmented-wave method, Phys. Rev. B 50, 17953 (1994).
- Perdew et al. (1996) J. P. Perdew, K. Burke, and M. Ernzerhof, Generalized gradient approximation made simple, Phys. Rev. Lett. 77, 3865 (1996).
- Giannozzi et al. (2017) P. Giannozzi, O. Andreussi, T. Brumme, O. Bunau, M. B. Nardelli, M. Calandra, R. Car, C. Cavazzoni, D. Ceresoli, M. Cococcioni, N. Colonna, I. Carnimeo, A. D. Corso, S. de Gironcoli, P. Delugas, R. A. DiStasio, A. Ferretti, A. Floris, G. Fratesi, G. Fugallo, R. Gebauer, U. Gerstmann, F. Giustino, T. Gorni, J. Jia, M. Kawamura, H.-Y. Ko, A. Kokalj, E. Küçükbenli, M. Lazzeri, M. Marsili, N. Marzari, F. Mauri, N. L. Nguyen, H.-V. Nguyen, A. O. de-la Roza, L. Paulatto, S. Poncé, D. Rocca, R. Sabatini, B. Santra, M. Schlipf, A. P. Seitsonen, A. Smogunov, I. Timrov, T. Thonhauser, P. Umari, N. Vast, X. Wu, and S. Baroni, Advanced capabilities for materials modelling with quantum ESPRESSO, Journal of Physics: Condensed Matter 29, 465901 (2017).
- Dal Corso (2014) A. Dal Corso, Pseudopotentials periodic table: From H to Pu, Computational Materials Science 95, 337 (2014).
- Grimme (2006) S. Grimme, Semiempirical gga-type density functional constructed with a long-range dispersion correction, J. Comput. Chem. 27, 1787 (2006).
- Kresse and Furthmüller (1996) G. Kresse and J. Furthmüller, Efficiency of ab-initio total energy calculations for metals and semiconductors using a plane-wave basis set, Computational Materials Science 6, 15 (1996).
- Kresse and Furthmüller (1996) G. Kresse and J. Furthmüller, Efficient iterative schemes for ab initio total-energy calculations using a plane-wave basis set, Phys. Rev. B 54, 11169 (1996).
- Togo and Tanaka (2015) A. Togo and I. Tanaka, First principles phonon calculations in materials science, Scripta Materialia 108, 1 (2015).
- Nakano et al. (2018a) A. Nakano, K. Sugawara, S. Tamura, N. Katayama, K. Matsubayashi, T. Okada, Y. Uwatoko, K. Munakata, A. Nakao, H. Sagayama, R. Kumai, K. Sugimoto, N. Maejima, A. Machida, T. Watanuki, and H. Sawa, Pressure-induced coherent sliding-layer transition in the excitonic insulator Ta2NiSe5, IUCrJ 5, 158 (2018a).
- Sunshine and Ibers (1985) S. A. Sunshine and J. A. Ibers, Structure and physical properties of the new layered ternary chalcogenides tantalum nickel sulfide (Ta2NiS5) and tantalum nickel selenide (Ta2NiSe5), Inorganic Chemistry 24, 3611 (1985).
- Elliott et al. (1974) R. J. Elliott, J. A. Krumhansl, and P. L. Leath, The theory and properties of randomly disordered crystals and related physical systems, Rev. Mod. Phys. 46, 465 (1974).
- Barker and Sievers (1975) A. S. Barker and A. J. Sievers, Optical studies of the vibrational properties of disordered solids, Rev. Mod. Phys. 47, S1 (1975).
- Bergman and Nemanich (1996) L. Bergman and R. J. Nemanich, Raman Spectroscopy for Characterization of Hard, Wide-Bandgap Semiconductors: Diamond, GaN, GaAlN, AlN, BN, Annu. Rev. Mater. Sci. 26, 551 (1996).
- Kim et al. (2016) S. Y. Kim, Y. Kim, C.-J. Kang, E.-S. An, H. K. Kim, M. J. Eom, M. Lee, C. Park, T.-H. Kim, H. C. Choi, B. I. Min, and J. S. Kim, Layer-Confined Excitonic Insulating Phase in Ultrathin Crystals, ACS Nano 10, 8888 (2016).
- Yan et al. (2019) J. Yan, R. Xiao, X. Luo, H. Lv, R. Zhang, Y. Sun, P. Tong, W. Lu, W. Song, X. Zhu, and Y. Sun, Strong Electron–Phonon Coupling in the Excitonic Insulator , Inorganic Chemistry 58, 9036 (2019), pMID: 31246443.
- Kim et al. (2020) M.-J. Kim, A. Schulz, T. Takayama, M. Isobe, H. Takagi, and S. Kaiser, Phononic soft mode behavior and a strong electronic background across the structural phase transition in the excitonic insulator , Phys. Rev. Research 2, 042039 (2020).
- Kim et al. (2021a) K. Kim, H. Kim, J. Kim, C. Kwon, J. S. Kim, and B. J. Kim, Direct observation of excitonic instability in Ta2NiSe5, Nature Communications 12, 1969 (2021a).
- Kim et al. (2021b) K. Kim, H. Kim, J. Kim, C. Kwon, J. S. Kim, and B. J. Kim, Author Correction: Direct observation of excitonic instability in Ta2NiSe5, Nature Communications 12, 2998 (2021b).
- Subedi (2020) A. Subedi, Orthorhombic-to-monoclinic transition in due to a zone-center optical phonon instability, Phys. Rev. Materials 4, 083601 (2020).
- Barker and Loudon (1972) A. S. Barker and R. Loudon, Response functions in the theory of raman scattering by vibrational and polariton modes in dielectric crystals, Rev. Mod. Phys. 44, 18 (1972).
- Fano (1961) U. Fano, Effects of configuration interaction on intensities and phase shifts, Phys. Rev. 124, 1866 (1961).
- Klein (1983) M. V. Klein, Electronic Raman scattering, in Light Scattering in Solids I, Vol. 8, edited by M. Cardona (Springer-Verlag, Berlin, 1983) Chap. 4, pp. 147–202.
- Blumberg et al. (1994) G. Blumberg, M. V. Klein, L. Börjesson, R. Liang, and W. N. Hardy, Investigation of the temperature dependence of electron and phonon Raman scattering in single crystal YBa2Cu3O6.952, J. Supercond. 7, 445 (1994).
- (48) Note that the interaction-induced linewidth is often significantly larger than the bare width , which is the case for presented data above . Consequently, an analysis of the phonon lineshape that does not explicitly include the interaction with the continuum (e.g. by simply adding the intensities of Fano-shaped phonons and the continuum) would lead to an erroneous large intrinsic phonon linewidth.
- (49) Note that the cubic term in the denominator can be neglected as long as the frequency is not far from .
- Gallais and Paul (2016) Y. Gallais and I. Paul, Charge nematicity and electronic raman scattering in iron-based superconductors, Comptes Rendus Physique 17, 113 (2016).
- Böhmer et al. (2014) A. E. Böhmer, P. Burger, F. Hardy, T. Wolf, P. Schweiss, R. Fromknecht, M. Reinecker, W. Schranz, and C. Meingast, Nematic Susceptibility of Hole-Doped and Electron-Doped Iron-Based Superconductors from Shear Modulus Measurements, Phys. Rev. Lett. 112, 047001 (2014).
- Nakano et al. (2018b) A. Nakano, T. Hasegawa, S. Tamura, N. Katayama, S. Tsutsui, and H. Sawa, Antiferroelectric distortion with anomalous phonon softening in the excitonic insulator , Phys. Rev. B 98, 045139 (2018b).
- Kung et al. (2017) H.-H. Kung, M. Salehi, I. Boulares, A. F. Kemper, N. Koirala, M. Brahlek, P. Lošťák, C. Uher, R. Merlin, X. Wang, S.-W. Cheong, S. Oh, and G. Blumberg, Surface vibrational modes of the topological insulator observed by Raman spectroscopy, Phys. Rev. B 95, 245406 (2017).
- Chauvière, L. and Gallais, Y. and Cazayous, M. and Méasson, M. A. and Sacuto, A. and Colson, D. and Forget, A. (2011) Chauvière, L. and Gallais, Y. and Cazayous, M. and Méasson, M. A. and Sacuto, A. and Colson, D. and Forget, A., Raman scattering study of spin-density-wave order and electron-phonon coupling in Ba(Fe1-xCox)2As2, Phys. Rev. B 84, 104508 (2011).
- Larkin et al. (2017) T. I. Larkin, A. N. Yaresko, D. Pröpper, K. A. Kikoin, Y. F. Lu, T. Takayama, Y.-L. Mathis, A. W. Rost, H. Takagi, B. Keimer, and A. V. Boris, Giant exciton Fano resonance in quasi-one-dimensional , Phys. Rev. B 95, 195144 (2017).
- Klemens (1966) P. G. Klemens, Anharmonic Decay of Optical Phonons, Phys. Rev. 148, 845 (1966).
- Mu et al. (2018) K. Mu, H. Chen, Y. Li, Y. Zhang, P. Wang, B. Zhang, Y. Liu, G. Zhang, L. Song, and Z. Sun, Electronic structures of layered single crystals revealed by high-resolution angle-resolved photoemission spectroscopy, J. Mater. Chem. C 6, 3976 (2018).
- Andrich et al. (2020) P. Andrich, H. M. Bretscher, Y. Murakami, D. Golež, B. Remez, P. Telang, A. Singh, L. Harnagea, N. R. Cooper, A. J. Millis, P. Werner, A. K. Sood, and A. Rao, Imaging the coherent propagation of collective modes in the excitonic insulator candidate Ta2NiSe5 at room temperature (2020), arXiv:2003.10799 [cond-mat.str-el] .
- Bretscher et al. (2021) H. M. Bretscher, P. Andrich, P. Telang, A. Singh, L. Harnagea, A. K. Sood, and A. Rao, Ultrafast melting and recovery of collective order in the excitonic insulator Ta2NiSe5, Nature Communications 12, 1699 (2021).
- Zhang et al. (2021) Y.-S. Zhang, J. A. N. Bruin, Y. Matsumoto, M. Isobe, and H. Takagi, Thermal transport signatures of the excitonic transition and associated phonon softening in the layered chalcogenide Ta2NiSe5 (2021), arXiv:2103.13782 [cond-mat.str-el] .
- Arima et al. (2020) H. Arima, Y. Naito, K. Kudo, N. Katayama, H. Sawa, M. Nohara, Y. F. Lu, K. Kitagawa, H. Takagi, Y. Uwatoko, and K. Matsubayashi, Resistive anisotropy of candidate excitonic insulator under pressure, J. Phys.: Conf. Ser. 1609, 012001 (2020).
- Sun et al. (2009) K. Sun, M. A. Stroscio, and M. Dutta, Graphite c-axis thermal conductivity, Superlattices and Microstructures 45, 60 (2009).