REST: Relational Event-driven Stock Trend ForecastingDOI: 10.1145/3442381.3450032ISBN: 978-1-4503-8312-7/21/04Proceedings of the Web Conference 2021 (WWW ’21), April 19–23, 2021, Ljubljana, SloveniaConference: Proceedings of the Web Conference 2021; April 19–23, 2021; Ljubljana, SloveniaThanks: *Work done while Wentao Xu was an intern at Microsoft Research
Abstract.
Stock trend forecasting, aiming at predicting the stock future trends, is crucial for investors to seek maximized profits from the stock market. Many event-driven methods utilized the events extracted from news, social media, and discussion board to forecast the stock trend in recent years. However, existing event-driven methods have two main shortcomings: 1) overlooking the influence of event information differentiated by the stock-dependent properties; 2) neglecting the effect of event information from other related stocks. In this paper, we propose a relational event-driven stock trend forecasting (REST) framework, which can address the shortcoming of existing methods. To remedy the first shortcoming, we propose to model the stock context and learn the effect of event information on the stocks under different contexts. To address the second shortcoming, we construct a stock graph and design a new propagation layer to propagate the effect of event information from related stocks. The experimental studies on the real-world data demonstrate the efficiency of our REST framework. The results of investment simulation show that our framework can achieve a higher return of investment than baselines.
Keywords:
Computational Finance, Stock Trend Forecasting, Event-driven, Graph-based Learning1. Introduction
Among various investment channels, the stock market has been demonstrating its significant profit potential in the long run. Stock trend forecasting, aiming at forecasting the future price trends of stocks, plays as one of the fundamental techniques and has attracted soaring attention from human wisdom (Sutkatti and TORSE 2019). According to the Efficient Market Hypothesis (Malkiel and Fama 1970), the stock price can truly and instantly reflect the stock value, and the significant price fluctuation indicates the reaction to emerging important stock-related information, usually in the form of events. Motivated by this phenomenon, together with a rising variety of sources to obtain published event information, such as news (Nassirtoussi et al. 2015; Ding et al. 2016; Hu et al. 2018; Duan et al. 2018; Liu et al. 2018; Deng et al. 2019; Vargas et al. 2017), social media (Yang et al. 2015; Zhou et al. 2016; Xu and Cohen 2018; Wu et al. 2018), and discussion board (Li et al. 2014; Nguyen et al. 2015; Zimbra et al. 2015), many efforts had been investigating how to mine the valuable patterns from the event information for stock trend forecasting (Li et al. 2017).
However, most of the existing event-driven methods overlook two implicit but critical characteristics of the event information: Stock-dependent Influence as well as Cross-stock Influence:
- •
Stock-dependent Influence An event’s effect on a stock is not only determined by the event but also could be differentiated by the stock-dependent properties. As a result, similar events would have different effects on different stocks. For example, the event of CEO’s resignation is undoubtedly a negative signal for a fast-growing company. On the contrary, it is inclined to be interpreted as a positive sign for a company struggling for a long time to find new growth points. However, most existing event-driven methods pay little attention to such crucial stock-dependent event influence.
- •
Cross-stock Influence Besides directly-associated stocks, an event could yield a similar or even more significant influence on those stocks with no explicit connection. For example, as shown in Figure 1(a), given an event of published performance growth about a company , it is a positive signal to the stock price of ; meanwhile, since this event may indicate a prosperous market environment of the entire industry belonged to, it could exert the similar positive influence to another stock within the same industry. Nonetheless, most of the existing event-driven methods omit such implicit but significant cross-stock influence invoked by events.

To address these shortcomings of existing event-driven methods, in this paper, we propose a novel relational event-driven stock trend forecasting (REST) framework. Specifically, to consider stock-dependent influence, besides directly modeling the event representations from its detailed textual information, we propose to explore the stock-dependent context of the event for directly related stocks at the same time. This way, we can capture the same event’s diverse influence on various stocks given stock-dependent contexts. More concretely, to model the stock context, we take the historical events of this stock into account and consider the subsequent reaction of stock prices to historical events. By capturing the fluctuation of one company’s stock price and transaction volume after each of its related events, we can model the investors’ feedback to this company’s historical events, therefore enabling our REST framework to differentiate similar events’ influences different companies.
Furthermore, to facilitate modeling the event’s cross-stock influence, we construct a stock graph, where the nodes in the graph are stocks, and the edges are the relations between stocks. This graph can propagate the effect of event information directly related to one stock to other inter-connected stocks. A straightforward way to propagate event information on the stock graph is to leverage the Graph Convolutional Networks (GCN) (Kipf and Welling 2017). However, based on our observations, the propagation of the event effect on the stock graph is complicated, and the traditional GCN can not appropriately model it. Thus, in our REST framework, we design a new propagation layer to model the complex cross-stock influence inspired by a couple of characteristics observed in the real-world:
- (O1)
An event has variant effects on the stocks connected with different relations. As shown in Figure 1(b), when company was announced that there is a violation in its company operation, its downstream company may bear the same risk of a stock price drop, while its competitor company may contrarily translate this violation exposure event as a positive signal. Therefore, our new propagation layer separately models the effect of event propagation through different relations and combines them for the trend prediction.
- (O2)
The propagation strength of the event effect between two stocks is dynamic. We observed that the event effect’s propagation strength is highly dependent on the dynamically changing contexts of the corresponding pair of related stocks. For example, as shown in Figure 1(a), once company announces a remarkable performance growth in the annual report, the public tends to feel optimistic about company , in the same growing industry, if the annual report of the company has not released yet. On the other hand, if has already published its annual report before , the performance growth of may have very limited influence on ’s stock price, as shown in Figure 1(c). Hence, our new propagation layer models the dynamic propagation strength of influence by taking each stock pair’s dynamic context into account.
- (O3)
The effect of the event information could take a multi-hop propagation. For example, as shown in Figure 1(d), an emerging event in terms of brilliant performance growth on stock could imply a positive effect to the stock , which is in the same industry as stock , as well as another positive signal to stock , which is the downstream company of stock and one-more step further to . In this paper, we can naturally model the multi-hop influence of events by stacking the propagation layer we designed.
To evaluate our proposed REST framework, we conduct extensive experiments over the real-world data, and experimental results show that our framework can outperform the existing stock trend forecasting methods. Moreover, we simulate the stock investment using a trading strategy, and the investment results show that our framework can achieve a higher investment return than the baselines. Finally, we conduct the sensitive tests to further study the effect of different components in our framework and the case study to explain why our framework outperforms the baselines.
In summary, the contributions of our work include:
- •
We proposed constructing the stock context with the historical events and the corresponding market feed-backs, which is efficient for modeling the various influences of similar events to different stocks.
- •
The REST framework we proposed can learn the effect of event information from other related stocks. It can adequately model some essential characteristics we observed in the propagation of event effects.
- •
We conducted both experimental evaluation and investment simulation on real-world data, and the results and analysis verify the validity and rationality of our framework.
2. Related Work
In recent years, stock trend forecasting has attracted much attention because of its vital stock investment role. We can categorize most of the existing stock trend forecasting work into two categories: the Event-driven Methods and the Technical Analysis.
2.1. Event-driven Methods
According to the efficient market hypothesis (Malkiel and Fama 1970), people know that an event that happens on a stock would change the stock information of this stock, affecting its stock price. There are many efforts to mine the event information from various sources, such as news (Nassirtoussi et al. 2015; Ding et al. 2016; Hu et al. 2018; Duan et al. 2018; Liu et al. 2018; Deng et al. 2019; Vargas et al. 2017), social media (Si et al. 2013; Yang et al. 2015; Zhou et al. 2016; Xu and Cohen 2018; Wu et al. 2018), and discussion board (Li et al. 2014; Nguyen et al. 2015; Zimbra et al. 2015). These methods can discover the implicit rules governing the market beyond price data. News is a type of widespread event’s source for stock trend forecasting task. (Hu et al. 2018) proposed to mine news sequence directly from the text with hierarchical attention mechanisms; (Duan et al. 2018) utilized a target-specific abstract-guided news document representation model to learn the signal in the news thoroughly; (Deng et al. 2019) proposes a novel knowledge-driven temporal convolutional network (KDTCN) to tackle the problem of stock trend prediction and explanation with abrupt changes. Besides, social media (e.g., Twitter) and discussion board (e.g., Yahoo! Finance forum) are also important sources of event information for stock trend forecasting. (Yang et al. 2015) proposed a methodology to extract social sentiment from influential Twitter users within a financial community and provided a more robust predictor of financial markets; (Xu and Cohen 2018) mined the information in tweets data and used a deep generative model for stock movement prediction; (Wu et al. 2018) proposed a novel Cross-model attention based Hybrid Recurrent Neural Network (CH-RNN), which can leverage stock price trend representations to attend daily social text representations through a cross-modal attention interaction; (Nguyen et al. 2015) predicted stock price movement based on the sentiment analysis of event information in the Yahoo! Finance forum.
Although there were many efforts in exploiting the event information for stock trend forecasting, existing event-driven methods ignore the stock-dependent influence and the cross-stock influence of event information. Our REST framework can overcome the shortages of previous work and learn the stock-dependent influence and cross-stock influence of event information compared with existing methods.
2.2. Technical Analysis
Technical analysis (Edwards et al. 2018) is another category of methods for stock trend forecasting, which is orthogonal to event-driven methods. The technical analysis predicts the stock trend based on the historical time-series of market data, such as trading price and volume. This type of approach aims to discover the trading patterns that can leverage for future predictions. Autoregressive (AR) (Li et al. 2016) and ARIMA (Ariyo et al. 2014) models are the most widely used model in this direction, both for linear and stationary time-series. However, the non-linear and non-stationary nature of stock prices limits the applicability of AR and ARIMA models. With the recent rapid development of deep learning, some studies attempted to apply deep neural networks to catch the intricate patterns of the market trend (Ticknor 2013; Patel et al. 2015). To further model the long-term dependency in time series, recurrent neural networks (RNN), especially Long Short-Term Memory (LSTM) network (Hochreiter and Schmidhuber 1997), had also been employed in financial perdition (Rather et al. 2015; Gao 2016; Akita et al. 2016; Bao et al. 2017). Specifically, (Zhang et al. 2017) proposed a new State Frequency Memory (SFM) recurrent network to discover the multi-frequency trading patterns for stock price movement prediction; (Li et al. 2019) presented a multi-task recurrent neural network with high-order Markov random fields (MRFs) to predict stock price movement direction; (Feng et al. 2019a) leveraged adversarial training to simulate the stochasticity during model training. Besides, to improve the performance of technical analysis, some recent efforts (Chen et al. 2018; Feng et al. 2019b; Kim et al. 2019; Matsunaga et al. 2019) leveraged Graph Neural Networks (Kipf and Welling 2017; Veličković et al. 2018) to capture the relationships between different stocks.
However, technical analysis is not sensitive to the abrupt changes in stock price caused by external event information of stock (Deng et al. 2019), limiting its performance on the stock trend forecasting.
3. Preliminaries
In this section, we will introduce some concepts in our proposed relational event-driven stock trend forecasting framework and formally define the problem of stock trend forecasting.
Definition 1.
Stock Context. The stock market is dynamic, and the stock context of a stock is also dynamic. To better represent the stock context, we define the stock context as the combination of stock’s historical events and these events’ feedback.
Definition 2.
Event’s Feedback. An event’s feedback is the relative change of price and transaction volume on the stock that this event happened.
Example 1.
Table 1 shows the example of the feedback of a performance growth event on the stock Changan Automobile, and this event happened on Jan. 28th, 2016. There are stock price and transaction volume data on a day, which are opening price (Open), closing price (Close), highest price (High), lowest price (Low), trading volume (Volume) and volume weighted average price (VWAP) (Berkowitz et al. 1988). Thus, this event’s feedback on the stock Changan Automobile is a -dimensional vector, which is the relative change of price and transaction volume data. The event’s feedback can differentiate the influences of similar events on different companies, which is significant for us to learn the distinct effect of event information for each stock.
Definition 3.
Stock Graph. We define the stock graph as a directed graph , where denote the set of stocks in the market and is the set of relations between two stocks. is the set of adjacent matrices. For an adjacent matrix ( and ) of relation , means there is a relation from stock to stock and indicates there is no a relation from stock to stock .
Definition 4.
Stock Price Trend. The stock price trend is usually defined as the future change rate of the stock price (Hu et al. 2018; Qin and Yang 2019; Yang et al. 2020). In this paper, we define the stock price trend for stock at date as the stock price change rate of the next day:
| (1) |
where could be specified by different values, such as opening price, closing price and volume weighted average price (VWAP), and we use closing price in our work.
| Open | Close | High | Low | Volume | VWAP | |
|---|---|---|---|---|---|---|
| Feedback |
Problem 1.
Stock Trend Forecasting. Given the stock-specific information (e.g., the textual information from news and social media, the historical stock price) of stock at date , the goal of stock trend forecasting is to forecast the stock price trend .
4. Our REST Framework
In this section, we elaborate on our relational event-driven stock trend forecasting (REST) framework. Figure 2 is the illustration of our REST framework. In Section 4.1, we utilize an event information encoder to learn the representation of event information. To model the stock-dependent influence, in Section 4.2, we learn the context of each stock; in Section 4.3, we use the event information and the stock context to learn the stock-dependent effect of event information on a stock. After that, to model the cross-stock influence, in Section 4.4, we propagate the effect of event information on the stock graph with a propagation layer we designed. Our proposed propagation layer can model the three observations in propagating the event effect, which is mentioned in Section 1.
4.1. Event Information Encoder
We first learn the representation of event information of a stock on a day. Figure 2(a) shows the event information encoder that we use to learn the representation of event information, including the type-specific event encoder and event sequence encoder.
4.1.1. Type-specific Event Encoder
We utilize a type-specific event encoder to learn the embedding of an event. The events of stocks can categorize into many types according to their content, which may describe the company’s performance, the result of litigation, and clarification of rumors. For each event, we have a type embedding and a sequence of token embeddings [, , …], where represents the type of this event, and represents the -th token in its content. We need to learn which word contributes most to the stock trend for each type of event. We introduce a type-specific multi-head attention mechanism to aggregate the tokens weighted by an assigned attention value, to reward the tokens offering important signal. Specifically,
| (2) |
| (3) |
| (4) |
We first feed the token through a fully connected layer to get a hidden representation . We measure the importance of token on this type as the similarity of with the type embedding and calculate a normalized attention weight through a softmax function. Thus our model can learn the token importance of a specific type of event. Furthermore, we employ multi-head attention (Vaswani et al. 2017) to jointly attend to information from different representation subspaces at different positions. That is, times independent attention mechanisms execute the calculation of Equation 3 to get the weight , and then concatenate the weighted sum vector of tokens to get the event embedding .
4.1.2. Event Sequence Encoder
Due to the influence of an event on the stock price would last for several days, we should also consider the events in the past couple of days when we predict the stock trend of date . For the event embedding sequence [, , …, ] of stock in the latest days, we feed them into a one-layer LSTM (Hochreiter and Schmidhuber 1997) and take the last hidden state as the representation of event information of stock :
| (5) |
Since the LSTM network can capture the long-term dependency in the events’ sequence, the representation contains the information of any one of the events in the latest days. We can also rewrite the event information of all stocks on date as a matrix , where the -th row of is the event information of stock .
4.2. Stock Context Encoder
The stock market is dynamic, and the stock context would influence not only the event information’s effect on the directly-associated stock but also the propagation of event effects on the stock graph. In order to better represent the stock context, we not only use historical events [, , …, ] of stock in the past days, but also utilize the corresponding feedbacks of historical events [, , …, ]. We use the same type-specific event encoder in Section 4.1.1 to learn the representation of historical events. Moreover, Section 3 has introduced the definition of an event’s feedback, which is the relative change of stock price and transaction volume after an event happens.
As shown in Figure 2(b), we feed the sequences of historical events [, , …, ] and feedbacks of historical events [, , …, ] to two different LSTMs, and concatenate the last hidden states and of these two LSTMs as the stock context :
| (6) | ||||
It is crucial to notice that when we forecast the stock trend on date , we do not know the stock future price and transaction volume at date , so the feedbacks of events happened on the date is unknown. Therefore, the historical events and the corresponding feedbacks we use to learn the context do not include the events that happened on the date . We will explore the influence of the stock context in Section 5.5.1.
4.3. Learning the Stock-dependent Influence
To learn the effect of event information on the stocks differentiated by the stock-dependent properties (stock-dependent influence), we utilize the representation of event information and the stock context to learn the effect of one stock’s event information on this stock. In other words, we learn the strength of event information’s effect on a stock. Formally, we learn the strength of event information’s effect from the stock context and the event information :
| (7) |
where is a single-layer feed-forward neural network and represents concatenation. We use the concatetion because it can retain complete information of the event and stock context. is a diagonal matrix where is the effect’s strength of stock ’s event information to stock . After that, we left multiply event information by the strength of event effect to learn the effect of event information:
| (8) |
where is the effect of event information and its -th row is the effect of stock ’s event information on stock .
4.4. Learning the Cross-stock Influence
To address the limitation of existing event-driven work that can not learn the effect of events from other related stocks (cross-stock influence). We construct a stock graph defined in Section 3, where the nodes in the graph are stocks, and the edges are stock relations, such as the industry relation and the downstream relation. We will introduce the details of the stock relations we used in Section 5.1. After that, we design a novel propagation layer to propagate the effect of event information from related stocks in the stock graph. When we design the propagation layer, we pay close attention to modeling the following observations in the propagation of event effect: (O1) different relations result in different event effects; (O2) the dynamic strength of the event effect between two stocks; (O3) the propagation of event effect on multi-hop path. Given a matrix of the effect of event information on date , we progressively design our propagation layer to propagate the effect of event information and realize to model these three observations.
4.4.1. GCN Propagation Layer
We first utilize the aggregator in Graph Convolutional Networks (GCN) (Kipf and Welling 2017) to propagate the effect of event information from related stocks:
| (9) |
where and is the adjacent matrix for all relations, that is, indicates there is an arbitrary relation from stock to stock . is a diagonal degree matrix with entries , and is used to normalize .
After the GCN propagation, the -th row of contains all the effect of event information of stock ’s neighbor stocks. Then we can learn the effect of events of related stocks from the matrix .
4.4.2. Relational GCN Propagation Layer (O1)
Different relations between two stocks result in different event effects, but the straightforward GCN propagation can not distinguish the impacts of different relations. To remedy this problem, we adopt the idea in the relational GCN (Schlichtkrull et al. 2018) to learn the influence of different relations:
| (10) |
where is the adjacent matrix of relation , and is the mapping matrix for relation . In the relational GCN propagation layer, we map the effect of event information with a relation-specific mapping matrix before propagating the event effect, and represents the event effect propagated with relation . Thus, the relational GCN propagation layer can learn the propagation of event effects under different relations.
4.4.3. Dynamic Propagation Layer (O2)
The GCN propagation layer and relational GCN propagation layer use a fixed weight or to propagate the event effect from stock to stock . However, the real-world stock market is dynamic, and the strength of the event effect between two stocks is also dynamic. To model this observation, we propose to use the dynamic propagated weights to propagate the effect of event information:
| (11) |
where is the matrix of dynamic propagated weights.
We utilize the stock context to learn the dynamic weights . We learn the dynamic propagated weight of relation from the stock ’s neighbor stock () to with the context of these two stocks:
| (12) |
The function can have many different forms, in this paper, we adopt the form of function shown above, where is a single-layer feed-forward neural network for the relation and is the concatenation. If a stock is not the neighbor of stock (), we set the propagated weight as .
4.4.4. Multi-hop Propagation (O3)
The effect of event information will propagate through the multi-hop path. Therefore, we stack more propagation layers to gather the neighboring stocks’ event effect with a distance of more than one hop. More formally, we propagate the event effect from the neighbor stocks of hops to gather the event effect from the neighbor stocks of hops:
| (13) |
As shown in Figure 2 (d), after performing propagation layers, we obtain the event effect from the neighbor stocks of different distances: [, , …, ]. To jointly learn the effect of original event information and the event effect of the neighbors of different distances, we leverage the layer-aggregation mechanism (Xu et al. 2018) to concatenate the effect of all event information of each stock:
| (14) |
By doing so, we cannot only learn the event effect from the neighbors of different distances but also can control the distance of event effect propagation by adjusting the hyper-parameter . We will study the effect of the propagating distance in Section 5.5.2.
4.5. Stock Trend Forecasting
We feed the effect of all event information (the -th row of the matrix ) of stock to a dense layer, and output our REST framework’s stock trend forecasting of stock on date :
| (15) |
4.6. Optimization
We leverage the stochastic gradient descent (SGD) algorithm to optimize our REST framework by minimizing the mean squared error (MSE) loss function with regularization:
| (16) |
where is the set of dates in the training period, and is the set of stocks in date . The is the stock trend prediction of stock at date , and the is the ground truth stock trend of stock at date . is the regularization parameter; represents all of the parameters in our framework, including the parameters in neural networks, type embeddings, and token embeddings.
5. EXPERIMENTS
In this section, we study our relational event-driven stock trend forecasting framework with experiments. We aim to answer the following research questions via the experiments:
- •
RQ1: How is the performance of our REST framework?
- •
RQ2: Can our framework achieve a higher investment return in the investment simulation on real-world datasets?
- •
RQ3: How is the effect of different components (i.e., the stock context, the multi-hop propagation) in our framework?
- •
RQ4: How does the REST perform in real-world case?
5.1. Data Collection and Preprocessing
Datasets
We evaluate our REST framework on the stocks in two popular and representative stock indexes: CSI 300 and CSI 500. CSI 300 index consists of the largest and most liquid stocks, reflecting the market’s overall performance. CSI 500 index consists of the largest remaining stocks after excluding the CSI 300 Index constituents, reflecting the small-mid cap stocks. We collected the stock data, including the event data, stock relations, event’s feedback, and the label of stock price trend from 2013 to 2018. We split the stock data by time to a training period from 2013 to 2016, a validation period of 2017, and a test period of 2018.
Event Data
We collected the event information from the company’s announcements11 1 The announcement data are crawled from a company data website: http://www.cninfo.com.cn., which have predefined types and have less noise than the event information extracted in the news or social media. We extracted its company name, type of content, content (abstract), and publication timestamp as an event for each announcement. We clear the content of announcements by converting decimals to integers and removing the tokens whose frequency is lower than 5; therefore, we can vastly reduce the scale of token vocabulary. The event data we collected are from 2013 to 2018, and we collected and events for the stocks in the CSI 300 index and CSI 500 index, respectively.
Stock Relations
To construct the stock graphs for the stocks in CSI 300 and CSI 500 indexes, we collect four types of stock relations22 2 We collect the stock relations from a publicly available API tushare: https://tushare.pro/., which are listed as follows:
- -
Industry: there is an industry relation between two stocks when they are in the same industry (e.g., Car, Bank, and Electronics).
- -
Business: there is a business relation between two stocks when they have the same business. (e.g., wine, phone, and stainless steel)
- -
Shareholder: we only consider the top shareholders of each stock. There is a shareholder relation between two stocks when these two stocks have the same shareholder.
- -
Downstream/Upstream: there is a downstream/upstream relation between two stocks when these two stocks’ business has a downstream/upstream relation.
Event’s Feedback
To obtain each event’s feedback, we collect the daily stock price and volume data of stocks in CSI 300 and CSI 500 indexes33 3 We collect daily stock price and volume data from http://xueqiu.com.. There are 6 stock price and volume data on each day, which are the opening price, closing price, highest price, lowest price, volume weighted average price (VWAP) and trading volume. We calculate the relative change of stock price and volume data after an event happened as the event’s feedback. Thus, the feedback of each event is a 6-dimensional vector.
Label of the Stock Price Trend
We use the stock price trend defined on Equation 1 as the stock trend label on each day. For better training our framework, we apply normalization on the original labels of the same date. Specifically, we calculate the mean and standard deviation of stock labels on the same date. Then, we subtract the mean and divide by the standard deviation for each stock’s label on this date.
![[Uncaptioned image]](2102.07372v2/legend.png)
5.2. Experimental Setting
5.2.1. Evaluation Metrics
We use three standard evaluation metrics of regression to evaluate the results of stock trend forecasting, which are Root Mean Squared Error (RMSE), Mean Absolute Error (MAE) and Median Absolute Error (MedAE). RMSE is calculated by: ; MAE is the mean value of absolute error between labels and predictions: ; MedAE is the median of absolute error between labels and predictions: . We repeat the testing procedure ten times for all the experimental results and report the average value to eliminate the fluctuations caused by different initialization.
5.2.2. Hyper-parameters Setting
In the type-specific text encoder, we set the dimension of type embeddings and token embeddings to , and the number of head in multi-head attention is ; thus, the dimension of event embedding is . The number of hidden units in the three LSTMs of our framework is . We set the distance of event propagation on CSI 300 and CSI 500 to and , respectively. The regularization parameter is and the numbers of training epoch is .
5.2.3. Compared Methods
We compare our REST framework with the following stock trend forecasting methods:
- •
ARIMA (Brown 2004): ARIMA uses the historical stock trend’s series of each stock as input to forecast the stock future trend.
- •
TGCN (Matsunaga et al. 2019): TGCN leverages a variant of graph convolutional networks (Kipf and Welling 2017) to propagate the historical price information on the stock graph for stock trend forecasting. It only uses historical price data and does not use the event information.
- •
HAN (Hu et al. 2018): A model that utilizes the hierarchical attention mechanism over media information for stock trend forecasting.
- •
Event-driven: The Event-driven method directly feeds the original event information in Section 4.1 into a dense layer and output the prediction of the stock price trend.
- •
Event-driven_sd: The Event-driven_sd method directly feeds the effect of event information in Section 4.3 into a dense layer and output the prediction of the stock price trend. The Event-driven_sd method can learn the stock-dependent influence compared with the Event-driven method.
- •
GCN (Kipf and Welling 2017): GCN model uses the GCN propagation layer in Section 4.4.1 to propagate the effect of event information on the stock graph.
- •
Relational GCN (Li et al. 2020): This method uses the Relational GCN propagation layer in Section 4.4.2 to propagate the effect of event information. It can learn the different event effects under different relations compared with the GCN model.
- •
RESTl=1: This method uses the dynamic propagation layer in Section 4.4.3 to propagate the effect of event information on the stock graph. Nevertheless, it can not propagate the effect of event information through the multi-hop path.
| Method | CSI 300 | CSI 500 | ||||
|---|---|---|---|---|---|---|
| RMSE | MAE | MedAE | RMSE | MAE | MedAE | |
| ARIMA (Brown 2004) | ||||||
| TGCN (Matsunaga et al. 2019) | ||||||
| HAN (Hu et al. 2018) | ||||||
| Event-driven | ||||||
| Event-driven_sd | ||||||
| GCN (Kipf and Welling 2017) | ||||||
| Relational GCN (Li et al. 2020) | ||||||
| RESTl=1 | ||||||
| REST | ||||||
5.3. Performance Comparison (RQ1)
Table 2 shows the results of our REST framework and the compared methods on CSI 300 and CSI 500. Our REST framework can achieve the lowest RMSE, MAE, and MedAE compared with the previous methods. The Event-driven_sd method is better than the Event-driven method, thus considering the stock-dependent influence of event information is essential. The GCN model has better results than the Event-driven_sd, which demonstrates that propagating the effect of event information can improve the performance of the stock trend forecasting. When we compare the GCN model and the Relational GCN model, we can find that learning the propagated event effect under different relations is vital. The comparison between the results of the Relational GCN model and RESTl=1 model shows that the dynamic propagated weights learned from the stock context are better than the fixed propagated weights. Finally, our REST’s results are better than the RESTl=1 model, which verifies the effectiveness of the multi-hop propagation.
5.4. Investment Simulation (RQ2)
To further evaluate our framework’s effectiveness, we conduct a trading strategy to simulate the stock investment. In detail, we rank the stocks on date from high to low according to their stock trend predictions, then select the top stocks to evenly invest and sell the holding shares of the stocks which rank behind . We consider a transaction cost of for the buying shares and for the selling shares for approximating real-world trading. We use two financial metrics to evaluate the investment simulation result: the Annual Return and Sharpe Ratio (Sharpe 1966):
- •
Annual Return (AR) is a standard profit indicator in finance, which is the return that an investment provides over a year.
- •
Sharpe Ratio (SHR) measures the performance of an investment compared to a risk-free asset, after adjusting for its risk. It is defined as: , where is the return of given portfolio and denotes the risk-free return. is the expected value, and is the variance.
The number of stocks we select to invest evenly is , , , and , respectively. Figure 3 shows the simulation results of the Annual Return and the Sharpe Ratio. Our REST framework can gain the highest Annual Return and Sharpe Ratio. The Event-driven_sd method has a higher investment return than the Event-driven method, so the stock-dependent influence of event information is vital for stock trend forecasting. The GCN model has a higher investment return than the Event-driven_sd model, which means the propagation of event information can make the forecasting more accurate. The investment results of Relational GCN show the effectiveness of learning the propagated event effect under different relations; the investment results of the RESTl=1 model demonstrate that dynamic propagated weights learned from the stock context can achieve a higher investment return; the comparison between the results of the RESTl=1 model and our REST framework verify the effectiveness of multi-hop propagation.
| Stock Context | CSI 300 | CSI 500 | ||||
|---|---|---|---|---|---|---|
| RMSE | MAE | MedAE | RMSE | MAE | MedAE | |
| REST | ||||||
| REST | ||||||
| RESTl=1 | ||||||
| Distance | CSI 300 | CSI 500 | ||||
|---|---|---|---|---|---|---|
| RMSE | MAE | MedAE | RMSE | MAE | MedAE | |
| RESTl=1 | ||||||
| RESTl=2 | ||||||
| RESTl=3 | ||||||
| RESTl=4 | ||||||
5.5. Model Analysis
5.5.1. Effect of the Stock Context (RQ3)
To explore the effect of the stock context described in Section 4.2. We observe the performance of RESTl=1’s variants: 1) REST merely uses the historical events to learn the stock context; 2) REST only uses the historical events’ feedbacks to learn the stock context. We summarize the results in Table 3, and have the following observations:
- •
From the comparison between REST and REST, we can find that using historical events’ feedbacks to learn the stock context is better than historical events. It verifies the effectiveness of the historical events’ feedbacks in the stock trend forecasting.
- •
Using historical events and historical events’ feedbacks simultaneously can achieve the best performance. Thus we need to jointly use historical events and historical events’ feedbacks to learn the stock context.
5.5.2. Effect of the Distance of Event Propagation (RQ3)
To study the effect of multi-hop propagation’s distance in Section 4.4.4, we vary the number of propagation layer of the REST framework from to and observe the results on CSI 300 and CSI 500. Table 4 summarizes the experiments. Then we have the following observations:
- •
Increasing the distance of propagation is capable of boosting the performance substantially. When , the RESTl=2 achieves the lowest MAE and MedAE on CSI 500; when , the RESTl=3 achieves the best RMSE, MAE and MedAE on CSI 300, and lowest RMSE on CSI 500.
- •
When we further increase the number of propagation layers to , we observe that our framework’s performance will reduce. It suggests that is a sensitive hyper-parameter, and too much of the propagation layer can not further improve stock trend forecasting.
5.5.3. Case Study (RQ4)
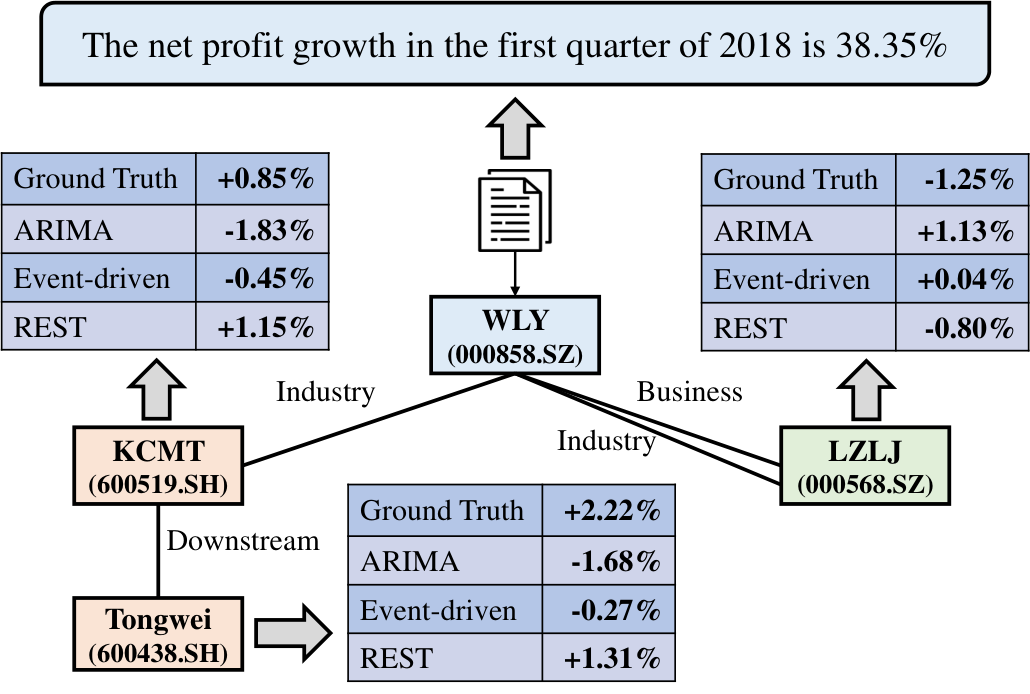
To illustrate our REST framework’s effectiveness, we dig into a specific case study on three companies: WLY, KCMT, and LZLJ. While belonging to the same general industry, these three stocks connect yield complicated competitive relations, making it quite hard to discern the influence of one company’s events on the others.
For example, on April 28, 2018, the stock WLY released a performance announcement that the net profit growth in the first quarter of 2018 is 38.35%. Such a positive event of WLY can intuitively imply a bullish trend of the corresponding industry. However, complicated competition between different companies can lead to diverse stories. Particularly, while the stock KCMT, whose primary products are distinct as WLY, can benefit from this positive event, another stock, LZLJ, having the same type of product thus the more competitive position as WLY, could suffer from the adverse effects of the positive event of WLY.
We observe the forecasting results of different methods on the closest trading day after this event happened. Figure 4 illustrates the ground truth of the stock price trend and the forecasting results of ARIMA, Event-driven, and REST. The ARIMA forecasts the stock trend with historical stock trend series only, and the Event-driven method can not learn the cross-stock influence of event information, so they both fail to make the correct forecastings. However, our REST framework can propagate the effect of event information with the propagation layer we designed. Thus, our REST framework can make the correct forecasting on the KCMT and LZLJ. The effect of WLY’s event on other related stock is difficult to be found by ordinary people unless experts with rich domain knowledge. Our REST framework can make the correct numerical prediction while the experts can only forecast a rise or a fall.
Moreover, our REST framework can propagate the event information through multi-hop paths, so our framework can also make correct forecasting on the stock Tongwei, which is the downstream company of KCMT.
6. Conclusion and Future Work
Stock trend forecasting is vital for investors to seek maximized profits from financial investment. In this paper, we proposed a relational event-driven framework (REST) to forecast the stock trend. Our proposed framework can address some shortcomings of existing event-driven work. The first shortcoming is existing methods overlook the influence of event effect differentiated by the stock-dependent properties (stock-dependent influence). The second one is that existing methods only use one stock’s information to predict its stock price trend, overlooking the effect of event information from other different stocks on the stock trend of this stock (cross-stock influence). The experiment results on real-world stock market data demonstrated the effectiveness of our framework. The results of the investment simulation show that our REST framework can achieve a higher investment return.
In the future, we would mine more abundant and diverse stock information from the Web, such as the news, social media, and other stock related information, and fuse different kinds of stock information to forecasting the stock price trend. We would also explore the techniques of unsupervised learning and apply unsupervised learning to stock trend forecasting.
Acknowledgments
Wentao Xu and Jian Yin are supported by the National Natural Science Foundation of China (U1711262, U1711261,U1811264,U1811261,
U1911203,U2001211), Guangdong Basic and Applied Basic Research Foundation (2019B1515130001), Key R&D Program of Guangdong Province (2018B010107005). Jian Yin is the corresponding author.
References
- (1)
- Akita et al. (2016) Ryo Akita, Akira Yoshihara, Takashi Matsubara, and Kuniaki Uehara. 2016. Deep learning for stock prediction using numerical and textual information. In 2016 IEEE/ACIS 15th International Conference on Computer and Information Science (ICIS). IEEE, 1–6.
- Ariyo et al. (2014) Adebiyi A Ariyo, Adewumi O Adewumi, and Charles K Ayo. 2014. Stock price prediction using the ARIMA model. In 2014 UKSim-AMSS 16th International Conference on Computer Modelling and Simulation. IEEE, 106–112.
- Bao et al. (2017) Wei Bao, Jun Yue, and Yulei Rao. 2017. A deep learning framework for financial time series using stacked autoencoders and long-short term memory. PloS one 12, 7 (2017), e0180944.
- Berkowitz et al. (1988) Stephen A Berkowitz, Dennis E Logue, and Eugene A Noser Jr. 1988. The total cost of transactions on the NYSE. The Journal of Finance 43, 1 (1988), 97–112.
- Brown (2004) Robert Goodell Brown. 2004. Smoothing, forecasting and prediction of discrete time series. Courier Corporation.
- Chen et al. (2018) Yingmei Chen, Zhongyu Wei, and Xuanjing Huang. 2018. Incorporating Corporation Relationship via Graph Convolutional Neural Networks for Stock Price Prediction. In Proceedings of the 27th ACM International Conference on Information and Knowledge Management. ACM, 1655–1658.
- Deng et al. (2019) Shumin Deng, Ningyu Zhang, Wen Zhang, Jiaoyan Chen, Jeff Z Pan, and Huajun Chen. 2019. Knowledge-Driven Stock Trend Prediction and Explanation via Temporal Convolutional Network. In Companion Proceedings of The 2019 World Wide Web Conference. ACM, 678–685.
- Ding et al. (2016) Xiao Ding, Yue Zhang, Ting Liu, and Junwen Duan. 2016. Knowledge-driven event embedding for stock prediction. In Proceedings of coling 2016, the 26th international conference on computational linguistics: Technical papers. 2133–2142.
- Duan et al. (2018) Junwen Duan, Yue Zhang, Xiao Ding, Ching-Yun Chang, and Ting Liu. 2018. Learning Target-Specific Representations of Financial News Documents For Cumulative Abnormal Return Prediction. In Proceedings of the 27th International Conference on Computational Linguistics. 2823–2833.
- Edwards et al. (2018) Robert D Edwards, John Magee, and WH Charles Bassetti. 2018. Technical analysis of stock trends. CRC press.
- Feng et al. (2019a) Fuli Feng, Huimin Chen, Xiangnan He, Ji Ding, Maosong Sun, and Tat-Seng Chua. 2019a. Enhancing Stock Movement Prediction with Adversarial Training. IJCAI (2019).
- Feng et al. (2019b) Fuli Feng, Xiangnan He, Xiang Wang, Cheng Luo, Yiqun Liu, and Tat-Seng Chua. 2019b. Temporal relational ranking for stock prediction. ACM Transactions on Information Systems (TOIS) 37, 2 (2019), 27.
- Gao (2016) Qiyuan Gao. 2016. Stock market forecasting using recurrent neural network. Ph.D. Dissertation. University of Missouri–Columbia.
- Hochreiter and Schmidhuber (1997) Sepp Hochreiter and Jürgen Schmidhuber. 1997. Long short-term memory. Neural computation 9, 8 (1997), 1735–1780.
- Hu et al. (2018) Ziniu Hu, Weiqing Liu, Jiang Bian, Xuanzhe Liu, and Tie-Yan Liu. 2018. Listening to chaotic whispers: A deep learning framework for news-oriented stock trend prediction. In Proceedings of the Eleventh ACM International Conference on Web Search and Data Mining. ACM, 261–269.
- Kim et al. (2019) Raehyun Kim, Chan Ho So, Minbyul Jeong, Sanghoon Lee, Jinkyu Kim, and Jaewoo Kang. 2019. Hats: A hierarchical graph attention network for stock movement prediction. arXiv preprint arXiv:1908.07999 (2019).
- Kipf and Welling (2017) Thomas N. Kipf and Max Welling. 2017. Semi-Supervised Classification with Graph Convolutional Networks. In International Conference on Learning Representations (ICLR).
- Li et al. (2019) Chang Li, Dongjin Song, and Dacheng Tao. 2019. Multi-task Recurrent Neural Networks and Higher-order Markov Random Fields for Stock Price Movement Prediction: Multi-task RNN and Higer-order MRFs for Stock Price Classification. In Proceedings of the 25th ACM SIGKDD International Conference on Knowledge Discovery & Data Mining. ACM, 1141–1151.
- Li et al. (2016) Lili Li, Shan Leng, Jun Yang, and Mei Yu. 2016. Stock Market Autoregressive Dynamics: A Multinational Comparative Study with Quantile Regression. Mathematical Problems in Engineering 2016 (2016).
- Li et al. (2017) Qing Li, Yan Chen, Jun Wang, Yuanzhu Chen, and Hsinchun Chen. 2017. Web media and stock markets: A survey and future directions from a big data perspective. IEEE Transactions on Knowledge and Data Engineering 30, 2 (2017), 381–399.
- Li et al. (2014) Qing Li, TieJun Wang, Ping Li, Ling Liu, Qixu Gong, and Yuanzhu Chen. 2014. The effect of news and public mood on stock movements. Information Sciences 278 (2014), 826–840.
- Li et al. (2020) Wei Li, Ruihan Bao, Keiko Harimoto, Deli Chen, Jingjing Xu, and Qi Su. 2020. Modeling the Stock Relation with Graph Network for Overnight Stock Movement Prediction. 4491–4497.
- Liu et al. (2018) Qikai Liu, Xiang Cheng, Sen Su, and Shuguang Zhu. 2018. Hierarchical Complementary Attention Network for Predicting Stock Price Movements with News. In Proceedings of the 27th ACM International Conference on Information and Knowledge Management, CIKM 2018, Torino, Italy, October 22-26, 2018. 1603–1606. https://doi.org/10.1145/3269206.3269286
- Malkiel and Fama (1970) Burton G Malkiel and Eugene F Fama. 1970. Efficient capital markets: A review of theory and empirical work. The journal of Finance 25, 2 (1970), 383–417.
- Matsunaga et al. (2019) Daiki Matsunaga, Toyotaro Suzumura, and Toshihiro Takahashi. 2019. Exploring Graph Neural Networks for Stock Market Predictions with Rolling Window Analysis. arXiv preprint arXiv:1909.10660 (2019).
- Nassirtoussi et al. (2015) Arman Khadjeh Nassirtoussi, Saeed Aghabozorgi, Teh Ying Wah, and David Chek Ling Ngo. 2015. Text mining of news-headlines for FOREX market prediction: A Multi-layer Dimension Reduction Algorithm with semantics and sentiment. Expert Systems with Applications 42, 1 (2015), 306–324.
- Nguyen et al. (2015) Thien Hai Nguyen, Kiyoaki Shirai, and Julien Velcin. 2015. Sentiment analysis on social media for stock movement prediction. Expert Systems with Applications 42, 24 (2015), 9603–9611.
- Patel et al. (2015) Jigar Patel, Sahil Shah, Priyank Thakkar, and Ketan Kotecha. 2015. Predicting stock market index using fusion of machine learning techniques. Expert Systems with Applications 42, 4 (2015), 2162–2172.
- Qin and Yang (2019) Yu Qin and Yi Yang. 2019. What you say and how you say it matters: Predicting stock volatility using verbal and vocal cues. In Proceedings of the 57th Annual Meeting of the Association for Computational Linguistics. 390–401.
- Rather et al. (2015) Akhter Mohiuddin Rather, Arun Agarwal, and VN Sastry. 2015. Recurrent neural network and a hybrid model for prediction of stock returns. Expert Systems with Applications 42, 6 (2015), 3234–3241.
- Schlichtkrull et al. (2018) Michael Schlichtkrull, Thomas N Kipf, Peter Bloem, Rianne Van Den Berg, Ivan Titov, and Max Welling. 2018. Modeling relational data with graph convolutional networks. In European Semantic Web Conference. Springer, 593–607.
- Sharpe (1966) William F Sharpe. 1966. Mutual fund performance. The Journal of business 39, 1 (1966), 119–138.
- Si et al. (2013) Jianfeng Si, Arjun Mukherjee, Bing Liu, Qing Li, Huayi Li, and Xiaotie Deng. 2013. Exploiting topic based twitter sentiment for stock prediction. In Proceedings of the 51st Annual Meeting of the Association for Computational Linguistics (Volume 2: Short Papers). 24–29.
- Sutkatti and TORSE (2019) Rashmi Sutkatti and D TORSE. 2019. Stock market forecasting techniques: A survey. International Research Journal of Engineering and Technology 6, 5 (2019).
- Ticknor (2013) Jonathan L Ticknor. 2013. A Bayesian regularized artificial neural network for stock market forecasting. Expert Systems with Applications 40, 14 (2013), 5501–5506.
- Vargas et al. (2017) Manuel R Vargas, Beatriz SLP De Lima, and Alexandre G Evsukoff. 2017. Deep learning for stock market prediction from financial news articles. In 2017 IEEE International Conference on Computational Intelligence and Virtual Environments for Measurement Systems and Applications (CIVEMSA). IEEE, 60–65.
- Vaswani et al. (2017) Ashish Vaswani, Noam Shazeer, Niki Parmar, Jakob Uszkoreit, Llion Jones, Aidan N Gomez, Łukasz Kaiser, and Illia Polosukhin. 2017. Attention is all you need. In Advances in Neural Information Processing Systems. 5998–6008.
- Veličković et al. (2018) Petar Veličković, Guillem Cucurull, Arantxa Casanova, Adriana Romero, Pietro Liò, and Yoshua Bengio. 2018. Graph Attention Networks. International Conference on Learning Representations (2018). https://openreview.net/forum?id=rJXMpikCZ accepted as poster.
- Wu et al. (2018) Huizhe Wu, Wei Zhang, Weiwei Shen, and Jun Wang. 2018. Hybrid Deep Sequential Modeling for Social Text-Driven Stock Prediction. In Proceedings of the 27th ACM International Conference on Information and Knowledge Management, CIKM 2018, Torino, Italy, October 22-26, 2018. 1627–1630. https://doi.org/10.1145/3269206.3269290
- Xu et al. (2018) Keyulu Xu, Chengtao Li, Yonglong Tian, Tomohiro Sonobe, Ken-ichi Kawarabayashi, and Stefanie Jegelka. 2018. Representation Learning on Graphs with Jumping Knowledge Networks. In Proceedings of the 35th International Conference on Machine Learning (Proceedings of Machine Learning Research), Vol. 80. PMLR, Stockholmsmässan, Stockholm Sweden, 5453–5462.
- Xu and Cohen (2018) Yumo Xu and Shay B Cohen. 2018. Stock movement prediction from tweets and historical prices. In Proceedings of the 56th Annual Meeting of the Association for Computational Linguistics (Volume 1: Long Papers), Vol. 1. 1970–1979.
- Yang et al. (2020) Linyi Yang, Tin Lok James Ng, Barry Smyth, and Riuhai Dong. 2020. HTML: Hierarchical Transformer-based Multi-task Learning for Volatility Prediction. In Proceedings of The Web Conference 2020. 441–451.
- Yang et al. (2015) Steve Y Yang, Sheung Yin Kevin Mo, and Anqi Liu. 2015. Twitter financial community sentiment and its predictive relationship to stock market movement. Quantitative Finance 15, 10 (2015), 1637–1656.
- Zhang et al. (2017) Liheng Zhang, Charu Aggarwal, and Guo-Jun Qi. 2017. Stock price prediction via discovering multi-frequency trading patterns. In Proceedings of the 23rd ACM SIGKDD International Conference on Knowledge Discovery and Data Mining. ACM, 2141–2149.
- Zhou et al. (2016) Zhenkun Zhou, Jichang Zhao, and Ke Xu. 2016. Can online emotions predict the stock market in China?. In International conference on web information systems engineering. Springer, 328–342.
- Zimbra et al. (2015) David Zimbra, Hsinchun Chen, and Robert F Lusch. 2015. Stakeholder analyses of firm-related web forums: Applications in stock return prediction. ACM Transactions on Management Information Systems (TMIS) 6, 1 (2015), 1–38.