Quantifying Visual Image Quality: A Bayesian View
Abstract
Image quality assessment (IQA) models aim to establish a quantitative relationship between visual images and their perceptual quality by human observers. IQA modeling plays a special bridging role between vision science and engineering practice, both as a test-bed for vision theories and computational biovision models, and as a powerful tool that could potentially make profound impact on a broad range of image processing, computer vision, and computer graphics applications, for design, optimization, and evaluation purposes. IQA research has enjoyed an accelerated growth in the past two decades. Here we present an overview of IQA methods from a Bayesian perspective, with the goals of unifying a wide spectrum of IQA approaches under a common framework and providing useful references to fundamental concepts accessible to vision scientists and image processing practitioners. We discuss the implications of the successes and limitations of modern IQA methods for biological vision and the prospect for vision science to inform the design of future artificial vision systems11 1 The detailed model taxonomy can be found at http://ivc.uwaterloo.ca/research/bayesianIQA/..
1 Introduction
The goal of research in objective image quality assessment (IQA) is to develop computational models that can automatically predict perceived image quality by human observers. Although assessing image quality appears to be an easy task for humans, the underlying mechanisms are not well understood, making model prediction a challenging task. The research in IQA plays a special role as a bridge between vision science and engineering practice. On the one hand, IQA offers an excellent test-bed for evaluating vision theories and computational biovision models. In contrast to many traditional vision research that typically focuses on qualitative explanations of certain observed vision behaviors, the task of IQA provides a strong test for the “quantitative” prediction power of visual processing hypotheses with a broad space of interests. On the other hand, IQA is an essential component in all image processing, computer vision, and computer graphics applications for which human eyes are the ultimate receivers. IQA models are not only used as the criteria to evaluate and compare algorithms and systems, but also serve as the guide to drive the design and optimization of perceptually inspired algorithms and systems. Therefore, advancement in IQA research may make fundamental impact on the development of numerous real-world technologies that involve image processing, computer vision, and computer graphics.
There has been an accelerated development in IQA research, especially in the past 20 years. A good number of subject-rated image quality databases have been constructed and made public that enable IQA algorithms to be trained and tested for a variety of application scenarios athar:19. Several design principles have emerged and have been shown to be effective at creating IQA algorithms, many of which are well correlated with perceptual image quality when tested using the current public image quality databases athar:19. The achievement is worth celebrating, especially when compared with what we had 20 years ago, when simple numerical measures such as the peak-signal-to-noise-ratio (PSNR), a direct mapping of the mean-squared-error (MSE) to the logarithm scale, could compete on a par with then state-of-the-art perceptual quality metrics vqeg:2000.
Despite the demonstrated success, several outstanding challenges remain in the fundamentals of IQA research. First, a well-structured problem formulation is missing that not only provides a unified framework to understand the connections between IQA models, but also identifies potential ways for future development. Second, the multi-discipline nature of IQA research gives rise to misconceptions and ambiguities concerning some basic IQA terminologies. In particular, visual quality is frequently confused with perceptual similarity, perceptual metric, and image aesthetics, resulting in vague optimization goals, inconsistent psychophysical experimental protocols, and inadequate evaluation criteria. Third, many algorithms are derived in ad-hoc manner where assumptions are implicit, making it extremely challenging to fairly evaluate competing hypotheses and recognize their limitations. Fourth, while it seems obvious that a successful IQA model has to relate to the visual processing system in some way, many methods fail to draw a connection to vision science. As a result, it is often difficult to make an intuitive sense of how and why an IQA model works. With a growing number of new IQA models emerging each year, we have seen more “symptoms” arising from the aforementioned fundamental issues. For example, some recent IQA techniques are reported as “unreasonably effective” and “unexpectedly powerful” zhang:18.
The Bayesian theory has found profound applications in vision science by offering a principled yet simple computational framework for perception that accounts for a large number of perceptual effects and visual behaviors knill:96. Meanwhile, Bayesian inference and estimation theories have been employed extensively in a wide variety of computer vision, image processing, computer graphics, and machine learning methods prince:12. In this paper, we attempt to bridge the gap between the two, by laying out a generic conceptual framework for quantifying image quality from a Bayesian perspective. We provide a general formulation of the objective IQA problem, highlighting a branch of statistical models that underpin the existing IQA methods. We discuss two types of Bayesian networks for IQA with distinct definitions on visual image quality. We also identify common source of prior information for developing artificial vision systems, and discuss a series of examples in which researchers have used a specific type of prior knowledge. Finally, we describe existing evaluation criteria, from intuitive sanity check to sophisticated analysis-by-synthesize approaches. Given the space constraints, we do not dive into great technical details, but point interested readers to further readings athar:19; chandler:13; wang:06a; wang:11; wang:16a; zhai:20.
2 Bayesian View of Image Quality Assessment
The goal of IQA is to determine the subjective quality rating given an image . The problem can be formulated as a Bayesian inference problem, where the objective is to determine the probability distribution , which may be followed by a decision making process that generates a deterministic estimate of . There are generally two distinct approaches to solving the inference problem.
The first approach firstly solves the inference problem by determining the quality level-conditional densities for each quality level and the prior label probabilities . Then one can use Bayes’ theorem in the form
| (1) |
to find the posterior quality distribution xue:13a. The denominator in Bayes’ theorem can be found in terms of the quantities appearing in the numerator, because
| (2) |
The models generated from this approach is known as generative models, because by sampling from them it is possible to generate synthetic data points in the input space. However, due to the lack of training data and effective learning methods, generative models have not drawn much attention from IQA researchers. As a result, we focus on the second approach in this review.
Alternatively, the second approach aims to determine the posterior quality probabilities directly. This approach is simpler in the sense that we do not need to model the image space, of which we only have limited understanding. However, building an accurate model of still requires sampling and performing subjective tests on all possible images, neither of which is feasible in practice. Therefore, most existing IQA models are focused on the following problem: Given a set of training data comprising input images (and optionally some side-information) and their corresponding target quality scores , find a posterior quality distribution that best approximates in the human visual system (HVS). It should be noted that can be regarded as a point estimate of as the latter would be fully recovered by if we sample all possible data . The problem is further simplified by assuming the training data are independent and identically distributed, so that the predictive distribution can be parametrized de:17 as
| (3) |
where , and represent the parameters of the HVS model, the quality rating generation process and the posterior distribution over parameters, respectively. Given the enormous space of , the computation of the integral in Equation 3 is prohibitively expensive. As a result, a common practice is to approximate the predictive distribution by a point estimate , where
| (4) |
The specific form of the likelihood function is not known in practice. To fully specify the problem, it is usually assumed that the likelihood function follows a Gaussian distribution
| (5) |
where and represent the mean and variance of the Gaussian distribution, respectively. It is easy to show that the maximum likelihood solution of is equivalent to the best least-square solution with respect to the mean opinion score (MOS) under this assumption.
Direct estimation of kang:14 from a set of training data is problematic, because of the fundamental conflict between the enormous size of the image space and the limited scale of affordable subjective testing. Specifically, a typical “large-scale” subjective test allows for a maximum of several hundreds or a few thousands of test images to be rated. Given the combination of source images, distortion types and distortion levels, realistically only a few dozens of source images (if not fewer) can be included, which is the case in all known subject-rated databases. By contrast, digital images live in an extremely high dimensional space, where the dimension equals the number of pixels, which is typically in the order of hundreds of thousands or millions. Therefore, a few thousands of samples that can be evaluated in a typical subjective test are deemed to be extremely sparsely distributed in the space. Furthermore, it is difficult to justify how a few dozens of source images can provide a sufficient representation of the variations of real-world image content. As a result, the fundamental problem in the objective IQA is to develop a meaningful prior parameter distribution , which encodes the configuration of the HVS.
Over the past decades, various IQA models have been developed where the key difference lies in the assumptions about the prior distribution . In general, three types of knowledge may be used for the design of image quality measures, as shown in Figure 1. Most systems attempt to incorporate knowledge about the HVS, which can be further divided into bottom-up knowledge and top-down assumptions. The former includes the computational models that have been developed to account for a large variety of physiological and psychophysical visual experiments heeger:92; olshausen:97. The latter refers to those general hypotheses about the overall functionalities of the HVS wang:04a.
Knowledge about the possible distortion processes is another important information source in the design of objective IQA models. This type of information generally includes the appearance of certain distortion pattern and the distribution of distortion processes in practice. For example, one can explicitly construct features that are aware of particular artifacts, such as blocking wang:02a, blurring wang:04b, and ringing marziliano:04, and then assign penalties to these distortions. Also, it is much easier to create distorted image examples that can be used to train these models, so that more accurate image quality prediction can be achieved. This type of knowledge is typically deployed in IQA models that are specifically designed to handle a specific artifact type.
The third type is knowledge about the visual world to which we are exposed. It essentially summarizes what natural images should, or should not, look like. It is known that there exist strong statistical regularities of the natural images simoncelli:01. If an observed image significantly violates such statistical regularities, then the image is considered unnatural and is presumably of low quality. The statistical properties of natural images, which are often referred to as Natural Scene Statistics (NSS), have profound impact on the research in the general-purpose IQA wang:11 and are still making significant impacts in the deep learning era. In computational neuroscience, it has long been conjectured that the HVS is highly adapted to the natural visual environment barlow:61, and therefore, the modeling of natural scenes and the HVS are dual problems sheikh:05.
3 Full-Reference Image Quality Assessment

Pioneering work on perceptual image processing and IQA dates back at least to the 1970’s, when Mannos and Sakrison investigated a family of visual fidelity measures in the context of rate-distortion optimization mannos:74. Since then, researchers started to connect image quality with perceptual fidelity. Assuming the test image is generated from a pristine image, early IQA methods assess image quality by comparing the two images and producing a quantitative score that describes the degree of similarity/fidelity or, conversely, the level of error/distortion between them. The equivalence between image quality and perceptual fidelity makes intuitive sense, because the test image is more likely to have high quality as it looks closer to the reference image. Although “image quality” is frequently used for historical reasons, the more precise term for this type of metric would be image similarity or fidelity measurement, or full-reference (FR) IQA.
The FR IQA problem can be explained by Equation 3, where each observation consists of a pair of images. Given an original image of acceptable (or perhaps pristine) quality and its altered version, a test image , that undergoes a distortion process , FR IQA models aim to estimate the quality conditional probability distribution . The probabilistic graphical model of FR IQA models is shown in Figure 2. By assuming the quality label generation process follows a Gaussian distribution
| (6) |
and a point estimate of , we reduce the FR IQA problem to finding a deterministic perceptual similarity measure , where we have encoded our prior knowledge by .
The simplest and widely used FR IQA is the MSE, which still remains a popular quantitative criterion for assessing image quality wang:09. Suppose that and are distorted and reference images, where is the number of pixels and and are the values of the -th samples in and , respectively. The MSE between the images is
| (7) |
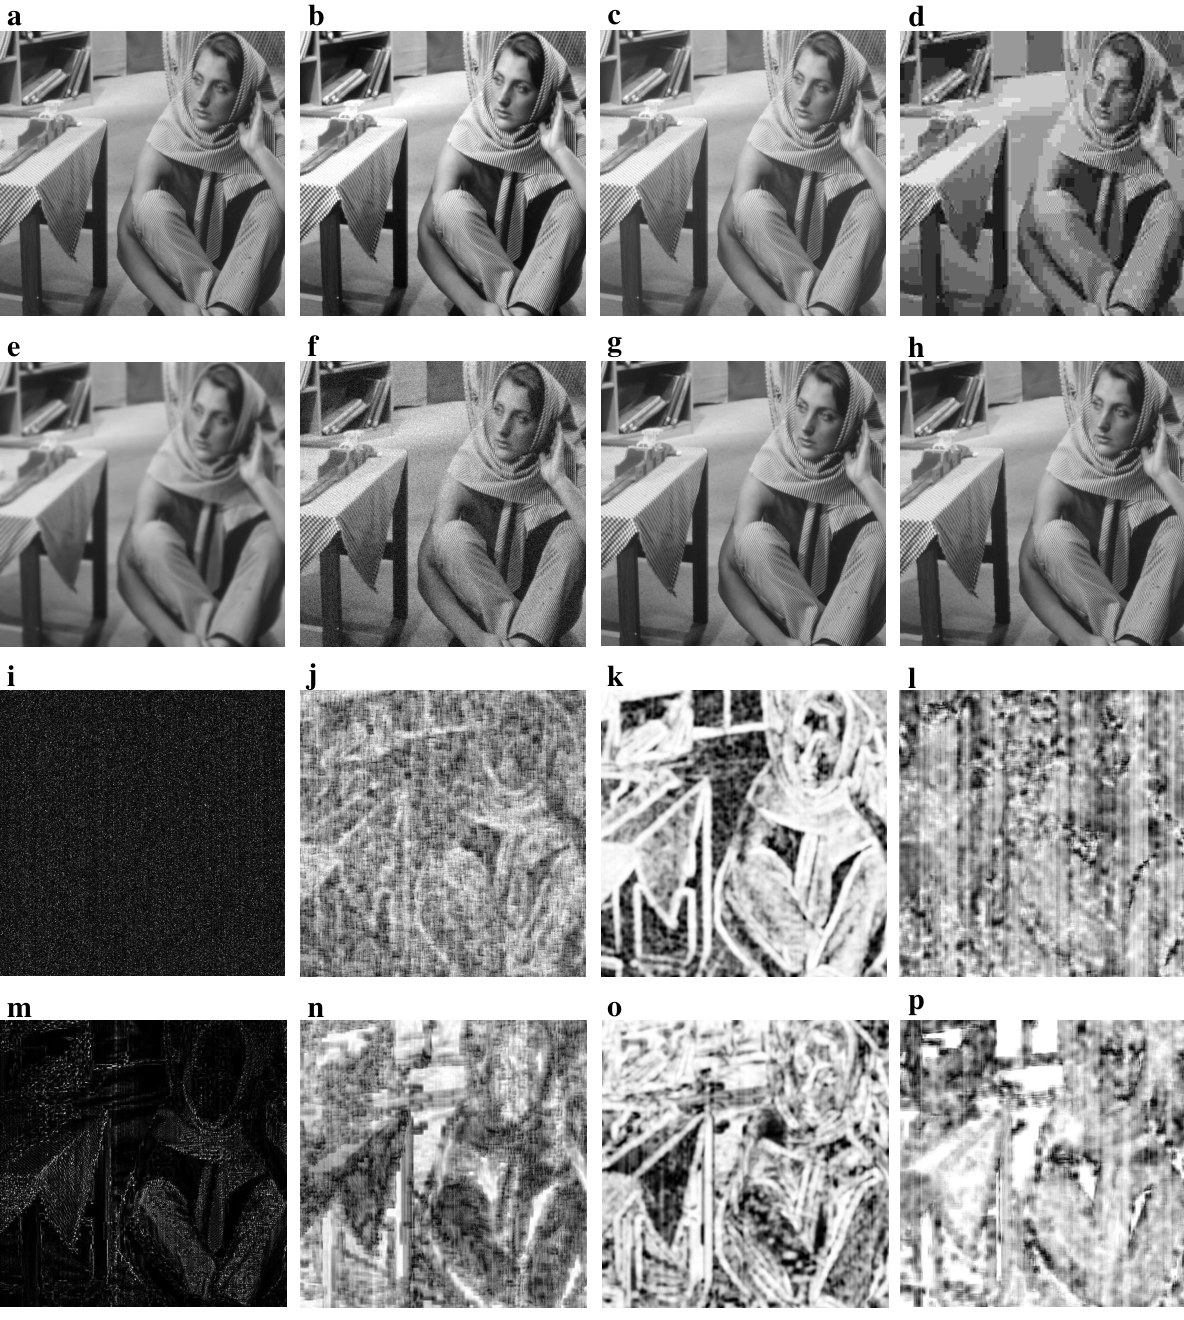
In this case, the prior knowledge is encoded by the functional form of MSE, which can be denoted by . Since the functional form is deterministic, we have and for any function . Consequently, the posterior distribution converges to the prior distribution for any likelihood function and dataset as long as . The use of MSE as an image quality measure is appealing because it is simple to calculate, has clear physical meanings, and is mathematically convenient in the context of optimization. Unfortunately, MSE is not very well matched to perceived visual quality wang:09. An illustrative example is shown in Figure 3a-h, where the original “Barbara” image is altered with different distortions, each adjusted to yield nearly identical MSE relative to the original image. Despite this, the images can be seen to have drastically different perceptual quality. The failure of MSE in predicting image quality arises from neglecting the knowledge about natural images, distortion processes, and the HVS. In the last four decades, a great deal of effort has gone into the development of FR IQA methods that take advantage of these knowledge. We summarize these techniques in the subsequent section.
3.1 Error Visibility Paradigm
Given the reference image, it is straightforward to compute the numerical errors between the reference and test images. Error visibility methods predict image quality as the visibility of such errors based on psychophysical and physiological models of the HVS. Almost all early well-known perceptual image quality models carlson:80; daly:92; lubin:93; lubin:95; mannos:74; safranek:89; teo:94; watson:87; watson:93; watson:97 followed this error visibility paradigm, which was well laid out as early as 1993 ahumada:93 and later refined wang:04a. Specifically, it has been found that the HVS is relatively insensitive to certain types of visual patterns. First of all, the HVS is known to have different sensitivity to the spatial frequency content in visual stimuli. The relationship between the sensitivity of the HVS and the spatial frequency content in visual stimuli can be modeled by the contrast sensitivity function (CSF) watson:93, which peaks at a spatial frequency around four cycles per degree of visual angel and drops significantly with both increasing and decreasing frequencies. For example, it can be observed that the crossing pattern on the bamboo chair looks clearer than the high frequency texture on the scarf in Figure 3a. Second, the presence of one signal can sometimes reduce the visibility of another image component. As an illustrative example, the noise signal on the scarf and tablecloth appears to be less visible than the distortion on the girl’s face in Figure 3f, although the Gaussian noise is applied uniformly across the image. The phenomenon is known as the contrast masking effect. In general, a masking effect is strongest when the signal and the masker have similar spatial location, frequency content, and orientations as evident by Figure 3b. Third, the perception of luminance obeys Weber’s law, which can be expressed mathematically as , where is the background luminance, is the just noticeable incremental luminance over the background by the HVS, and is a constant called the Weber fraction. The effect can be observed in Figure 3f, where the noise on the leg of the table appears to be more noticeable than the noise on the floor. Motivated by the different sensitivity of the HVS to visual stimuli, a large number of IQA models in the literature share a similar error visibility paradigm, although they differ in detail.
Figure 4 shows a generic error visibility IQA system framework. The stages of the diagram are as follows.
- •
Pre-processing: This stage typically performs a variety of basic operations to transform input images into the desired format, including spatial registration, color space transformation, point-wise non-linearity, and point spread function (PSF) filtering that mimics eye optics.
- •
CSF Filtering: Some FR IQA models weight the image component according to the CSF immediately after the pre-processing stage (typically implemented using a linear filter that approximates the frequency response of the CSF), while other error visibility models implement CSF as a base-sensitivity normalization factor after channel decomposition.
- •
Channel Decomposition: A large number of neurons in the primary visual cortex are tuned to visual stimuli with specific spatial locations, frequencies, and orientations. Motivated by the observation, these IQA methods have been using localized, band-pass, and oriented linear filters to decompose the input images into multiple channels. A number of signal decomposition methods have been used for IQA, including Fourier decomposition mannos:74, Gabor decomposition nielsen:85; taylor:97, local block-DCT transform watson:93, quadrature mirror filter bank safranek:89, separable wavelet transform bradley:99; chandler:07; lai:00; teo:94; watson:97, polar separable wavelet transform watson:87, and hexagonal orthogonal-oriented pyramid watson:89.
- •
Error Normalization: The error between the decomposed signals in each channel may be normalized by the CSF, and may also be normalized according to a certain masking model, which takes into account the effects of luminance masking and contrast masking. The normalization mechanism may be implemented as a spatially adaptive divisive normalization process heeger:92, and may also be implemented as a spatially varying thresholding function in a channel to convert the error into units of just noticeable difference. The visibility threshold at each point is calculated based on the energy of the reference and/or distorted coefficients in a neighborhood (which may include coefficients from within a spatial neighborhood laparra:16 of the same channel as well as other channels daly:92) and the base-sensitivity for that channel.
- •
Error Pooling: The final stage of FR IQA models combine the normalized error signals over the spatial extent of the image, and across different channels, into a single scalar measure, which describes the overall quality of the distorted image. Most error pooling takes the form of a Minkowski norm as follows ahumada:93; wang:06c:
(8) where is the normalized error of the -th coefficient in the -th channel and is a constant exponent chosen empirically.
Figure 3 shows the quality scores of the “Barbara” image set and the quality map of the white Gaussian noise contaminated image generated by a state-of-the-art error visibility-based IQA model named Normalized Laplacian Pyramid Distance (NLPD) laparra:16, whose error normalization module is learned from subjective labeled data. The predicted quality has a much higher correlation with human perception than MSE.
3.2 Structural Similarity Paradigm
The error visibility paradigm has received broad acceptance in real-world image processing applications. However, it is important to realize the limitations of these methods. A summary of some of the potential problems is as follows.
- •
Most error visibility IQA models are based on linear or quasi-linear operators that have been characterized using restricted and simplistic stimuli such as spots, bars, or sinusoidal gratings. This is problematic for two reasons. First, the HVS consists of many non-linear units that is too complex to model precisely. Second, the stimuli used in the psychophysical experiments are much simpler than natural images, which can be thought of as a superposition of a large number of simple patterns. As a result, the generalization capability of these models remains limited.
- •
Not every error signal leads to quality degradation. Contrast enhancement gives an obvious example (Figure 3b), in which the difference between an original image and a contrast-enhanced image may be easily discerned, but the perceptual quality is not degraded.
- •
The error normalization module in error visibility models relies on psychophysical experiments that are specifically designed to estimate the just noticeable difference. However, there has been little evidence whether such near-threshold models can be generalized to characterize perceptual distortions significantly larger than threshold levels, as is the case in a majority of image processing situations.
- •
The Minkowski-based error pooling implicitly assumes that errors at different locations are statistically independent. However, such dependency cannot always be completely eliminated by linear channel decomposition and masking models.
To overcome these challenges, a different approach was taken by making use of the knowledge about the overall functionality of the HVS wang:02b; wang:04a. The major assumption behind the structural similarity paradigm is that the HVS is highly adapted to extract structural information from the viewing field. It follows that a measurement of structural similarity (or distortion) should provide a good approximation to perceptual image quality. To convert the structure similarity paradigm into an IQA algorithm, it is necessary to define what structural/nonstructural distortions are and how to separate them.
Pioneering the structural similarity approach, Wang et al. proposed to define the nonstructural distortions as those distortions that do not modify the structure of objects in the visual scene, and all other distortions to be structural distortions wang:02b. Figure 3 is instructive in this regard. Although the contrast enhanced/mean shifted distorted images can be easily distinguished from the reference image, the distorted images preserve virtually all of the essential information composing the structures of the objects in the image. Indeed, the reference image can be recovered perfectly via a simple point-wise affine transformation. As a result, luminance shift and contrast change are considered as nonstructural distortions, independent of other structural distortions.
This motivated a spatial domain implementation of the structural similarity idea called the Structural SIMilarity (SSIM) index wang:04a. The system separates the task of similarity measurement into three independent comparisons: luminance, contrast and structure. First, the local luminance of distorted and reference images are estimated by the mean intensity and . The luminance similarity between the two images is defined as
| (9) |
where the constant is included to avoid instability when is very close to zero. Equation 9 is qualitatively consistent with Weber’s law. Second, the standard deviation ( and ) is employed as a round estimation of the signal contrast. The contrast similarity function takes a similar form as luminance comparison
| (10) |
where is another stabilization constant. Similarly, the function qualitatively satisfies the contrast-masking feature of the HVS. Third, the structure of distorted and reference images are defined as the normalized signals ( and (, respectively. It should be noted that the formulation is in accordance with the initial definition that structural distortion is independent of nonstructural distortion. The structure comparison function is defined as follows
| (11) |
where and are a stabilization constant and the correlation coefficient between and , respectively. Finally, the SSIM index is defined as the product of the three terms in Equation 9, 10, and 11. To simplify the expression, is set to , resulting in
| (12) |
The SSIM index is usually applied locally due to the spatially varying image statistical features and image distortions. The overall quality of an image is, by default, computed as the average score across all local windows, though various spatial weighting strategies may be applied, many of which are shown to help improve the quality prediction accuracy wang:06c; wang:10; zhang:16.
The SSIM scores of the “Barbara” image set is shown in Figure 3, from which we can observe that the SSIM index correlate well with human quality perception. Figure 3h shows the SSIM quality map for the noisy image, where brighter indicates better quality. The noise over the region of the subject’s face appears to be much stronger than that in the textured regions. However, the MSE map is completely independent of the underlying image structures. By contrast, the SSIM map gives perceptually consistent prediction.
Motivated by the success of SSIM, several variant models have been proposed by incorporating knowledge about visual psychophysics. Most of them apply the SSIM index in the sub-band at different spatial locations wang:10, orientations sampat:09; zhang:13, and frequency content wang:03; xue:13b; zhang:11 to simulate the characteristics of primary visual cortex. Regardless of its simplicity and the empirical nature of the SSIM formulation, SSIM and its variations perform somewhat surprisingly well in various IQA tests. For example, in a recently published and the most comprehensive IQA performance comparison so far, based on a collection of public domain IQA databases, almost all individual top-performing FR IQA methods were SSIM variations athar:19.
Another line of research explores alternative definitions of structure. Indeed, the definition of structural/non-structural distortions is not unique. For example, Wang et al. extended the scope of non-structural distortions to non-linear luminance transformations and geometric image transformations wang:05a. Recently, Ding et al. defined texture resampling (e.g., replacing one patch of grass with another) as another instance of non-structural distortion ding:20.
3.3 Task-oriented Feature Learning Methods
The structural similarity paradigm is conceptually appealing in the sense that it somehow by-passes the natural image complexity problem and the HVS complexity problem. Indeed, these systems treat the HVS as a black box, and only the input-output relationship is of concern. However, there is no simple unique answer on how to define structure and structural distortion in a perceptually meaningful manner. Furthermore, there is no clear way to define and validate the optimality of the similarity measure . To extend the structural similarity paradigm, other task-driven approaches have been introduced in the past decade, which differ from the structure similarity idea in two important ways. First, the HVS are associated with more well-defined auxiliary tasks such as image recognition and semantic segmentation, as opposed to extracting structural information from the viewing field. Second, the similarity measure is optimized using supervised machine learning methods.
Given some data in a multi-task setting, the task-driven methods estimate the prior distribution by integrating out the task-specific parameters to form the marginal likelihood of the data. Formally, grouping all of the data from each of the tasks as and again denoting by a sample from task , the marginal likelihood of the observed data is given by
| (13) |
where ’s denote the task specific parameters. Maximizing Equation 13 as a function of gives a point estimate for , an instance of a method known as empirical Bayes bernardo:09. Let and denote the feature representations of a pair of distorted image and reference image computed by the task-oriented function, the perceptual similarity index between the image pair is defined as
| (14) |
where is a certain distance measure in the feature domain, which may be either hand-crafted (e.g., the Euclidean distance johnson:16; zhang:18 or multi-scale SSIM gao:17), or learnt from subjective rated images in a maximum a posterior manner bosse:17. By leveraging the abundant training data in computer vision and the power of convolutional neural networks (CNN), these methods have demonstrated the potential to change the landscape of the field of IQA.
3.4 Information Theoretic Paradigm
The error visibility and the structural similarity paradigms have found nearly ubiquitous applications in the design of IQA systems, while both of them aim to derive a model for early sensory processing. It turns out that there exists a distinct way to look at the IQA problem, i.e. from the image formation point of view. The information theoretic paradigm assumes that each reference image (usually its sub-images) is a sample from a very special probability distribution , i.e., the class of natural scenes. Most real-world distortion processes disturb these statistics and make the image signal unnatural, suggesting that each distorted image comes from a distinct probability distribution . As a result, the similarity between and can be measured by some information theoretic distance/divergence between these two probability distributions.
Although the use of information theoretic distances as perceptual similarity seems somewhat arbitrary, there exists a non-trivial connection between the two concepts. Specifically, it has long been hypothesized that the HVS is adapted to optimally encode the visual signals barlow:61; parraga:00. Because not all signals are equally likely, it is natural to assume that the perceptual systems are geared to best process those signals that occur most frequently. Thus, the statistical properties of natural scene have a direct impact to the characteristics of the HVS. Indeed, the statistical image modeling is shown to be the dual problem of the error visibility-based perceptual models sheikh:05.
To implement this idea, one has to specify the mathematical forms of natural image distribution , distorted image distribution , and the information theoretic distance measure , where we have represented our prior knowledge about the source image and the distortion process by . Furthermore, the problem of estimating and from a single sample is severely ill-posed. To simplify the problem, it is often assumed that image statistics are locally homogeneous and the patches within an image are independent and identically sampled from the corresponding distribution. The probability distributions are then estimated from a stack of sub-images within the pair of distorted and reference images. All information theoretic IQA methods can be explained by the framework, although they differ in detail.
As an initial attempt in this paradigm, the Information Fidelity Criterion sheikh:05 models the natural image distribution as a Gaussian Scale Mixture wainwright:00. To derive the model for the distorted image distribution , the method assumes the distortion process to consist a simple signal attenuation and additive Gaussian noise. Finally, the perceptual quality is measured by the mutual information cover:91 between and . As a close variant of the Information Fidelity Criterion, Visual Information Fidelity (VIF) approaches the HVS as a “distortion channel”, which introduces stationary, zero mean, additive white Gaussian noise to the images in the wavelet domain sheikh:06b. Other extended version have adopted other statistical models as the image density model chang:13; wang:05b; wang:06b, estimated the image distributions in other transform domains wang:06b, and employed other probabilistic distance measure as the perceptual similarity measure rehman:12; soundararajan:11; wang:06b.
Figure 3 shows the prediction results of VIF on a set of altered “Barbara” images. In comparison with the reference image, the contrast enhanced image has a better visual quality despite the fact that the ‘distortion’ (in terms of a perceivable difference with the reference image) is clearly visible. A VIF value larger than unity captures the improvement in visual quality. In contrast, the noisy image, the blurred image, and the JPEG compressed image have clearly visible distortions and poorer visual quality, which is captured by a low VIF measure for all three images. The quality map predicted by VIF in Figure 3l is also consistent with human perception.
Despite the demonstrated success, the information theoretic paradigm suffers from two notable limitations. First, the independent and identically distributed assumption barely holds in practice, since neighboring spatial locations are strongly correlated in intensity simoncelli:01. Second, many methods makes explicit/implicit assumptions about the distortion process in order to determine the distorted image distribution. However, given a distorted image and a reference image , the image quality is independent of the distortion process. The unnecessary assumption about the distortion process introduces inductive bias to the IQA models, resulting in less competitive generalization capability.
3.5 Fusion-based Methods
All of the paradigms above are well-motivated, and have achieved great success in predicting subjective quality perception sheikh:06a. However, it has been demonstrated that the performance of these methods fluctuate across different distortions athar:19. Given the diversity of knowledge sources, a natural question is how to make use of different sources of knowledge in one IQA model. To this regard, fusion-based IQA methods are developed to build a “super-evaluator” that exploits the diversity and complementarity of the existing methods for improved quality prediction performance.
Given point estimate of model configurations , most fusion-based methods can be explained by a “mixture of experts” model. The approach assumes the posterior quality distribution have a hierarchical form
| (15) |
where each image has an unknown class , is the -th base IQA model, and weights the predictions of each “expert” in an ensemble. Due to the lack of training data, early researches assume class conditional distribution to be independent of the input image pair. The form of latent variable distribution can be determined empirically ye:14 or learnt from data liu:12; ma:19. There have also been attempts in getting rid of the independence assumption, which unfortunately achieved less impressive results athar:19.
3.6 Discussion
The Relationship between Image Fidelity and Image Quality: The equivalence between image quality and image fidelity relies on a few critical assumptions. First, it is assumed that the reference image is of perfect quality. If the assumption is violated, an image can sometimes be “enhanced” by a distortion. Observers may detect the difference between an original and its distorted version and prefer the distorted version over the original. Second, it is often assumed that there is at least a proportional relationship between the visibility of the distortion and the difference in perceived quality of the image silverstein:96. The assumption may hold for high fidelity, but often fails at low fidelity levels, for example, an image with distinct content could still have a perfect image quality. Furthermore, this assumption does not always hold in practice as certain distortion type may be clearly visible but not so objectionable.
The Quality Definition Problem: Perhaps an even more fundamental problem with the FR IQA models is the definition of image quality. The definition of image quality depends on the definition of pristine image, which usually refers to the image with perfect quality. However, image quality has to be defined in the first place in order for the definition to take effect. Apparently, this has run into a circular definition problem.
4 No-Reference Image Quality Assessment
No-reference (NR) IQA models aim to directly evaluate the quality of an image without referring to an “original” high-quality image. The task is in general extremely challenging for artificial vision systems. Yet, amazingly, this is quite an easy task for human observers. Human observers can easily identify high-quality images versus low-quality images and detect distortions in an image. Furthermore, humans tend to agree with each other to a high extent. These evidences suggest that it is possible to develop a machine vision system to perform NR IQA, though discovering the mechanisms underlying human perceptual IQA is highly challenging.

The NR IQA problem can also be explained by Equation 3 , where each observation consists of only a test image . The probabilistic graphical model of NR IQA models is shown in Figure 5, where we observe two differences from the FR IQA models. First, the original image is not observable. Second, the quality score is assumed to be independent of the reference image conditioned on the test image . Over the past decade, a great number of NR IQA models have been developed, which may be broadly classified into three categories.
4.1 Empirical Statistical Modeling Approach
It has long been conjectured, with abundant supporting evidence, that the role of early biological sensory systems is to remove redundancies in the sensory input, resulting in a set of neural responses that are statistically independent, known as the “efficient coding” principle barlow:61. Assuming that the visual systems have evolved to become optimal and more “comfortable” working with familiar input signals, it follows that an image appearing more frequently in the natural world, or in other words more “natural”, would have better visual quality. To fully specify the hypothesis, one needs also to state which environment shapes the system. Quantitatively, this means specification of a probability distribution over the space of input signals. Following this philosophy, significant efforts have been devoted to determine the prior parameter distribution by estimating the probability density function of test images (and natural images ).
The density estimation problem is very challenging due to the fundamental conflict between the enormous size of the image space and the limited number of images available for observation. There have been two techniques to alleviate the problem, which are summarized as follows:
- •
Dimension Reduction with Hierarchical Model: One method that has been demonstrated to be useful is dimension reduction. The idea is to map the entire image space onto a space of much lower dimensionality by exploiting knowledge of the statistical distribution of “typical” images in the image space. Since natural images have been found to exhibit strong statistical regularities simoncelli:01, it is possible that the cluster of typical natural images may be represented by a low-dimensional manifold, thus reducing the number of sample images that might be needed in the subjective experiments. The dimension reduction approach corresponds to a specific family of image density models
(16) where z is a low dimensional latent variable, and . The probability distribution of pristine images can be modeled either jointly with distorted images mittal:12a; saad:12, or independently as a separate model mittal:12b; moorthy:11; wu:15b. For example, the conditional probability distribution is often modeled by an Asymmetric Generalized Gaussian distribution lasmar:09 in a localized linear transform domain, where spatially distant pixels are assumed to be uncorrelated for simplicity. The reduced sample space in z makes it possible to learn the probability density from data. To avoid under-fitting, most existing algorithms estimate in a non-parametric manner, which makes few assumptions about the form of the distribution. Alternative methods apply the dimension reduction on medium-sized image patches, and learn a parametric model in order to obtain a generative model with explicit mathematical expression hou:14; mittal:12b; wu:15a; zhang:15a. For example, a representative method called NIQE mittal:12b use the Asymmetric Generalized Gaussian distribution to fit by image patches, and assume that the latent variable z follows a multi-variate Gaussian distribution.
- •
Patch-based Density Estimation: It should be noted that the aforementioned natural image statistic models remain overly simplistic, in the sense that they yield insufficiently adequate descriptions of the probability distribution of natural images in the space of all possible images. To overcome the limitation, an alternative method directly learns the probability density function of low-dimensional sub-images by assuming that the image patches are independent and identical samples of (or if the patches come from a pristine image). The research in IQA is constantly searching for the optimal form of the probability distribution. A pioneering method following this approach named CORNIA ye:12 jointly models the probability distribution of both natural images and distorted images by a Gaussian Mixture Model. Despite its simplicity, CORNIA remains as one of the most competitive NR IQA models athar:19. Follow-up works have demonstrated that marginal improvements can be attained by using more powerful probability mixture models xu:16.
Despite the proven efficiency, both approaches make over-simplified empirical assumptions about the image density, which inevitably reduces their accuracy. Over the past five years, we have witnessed an exponential growth in research activity into the advanced training of purely data-driven models. Thanks to the availability of significantly larger data sets and the dedicated hardware unit that can efficiently process large volume of data, it becomes possible to learn a high dimensional image density model with exact log-likelihood computation, exact and efficient sampling, exact and efficient inference of latent variables, and an interpretable latent space kingma:18. These models have demonstrated a significant improvement in log-likelihood on standard benchmarks over the traditional approaches without relying on excessive assumptions. It remains to be seen how much these models can improve the performance of the current NR IQA algorithms.
4.2 Fidelity Model Distillation Approach
Inspired by the remarkable achievement of FR IQA techniques over the past decade, several studies proposed to directly learn the prior distribution from FR IQA models in hope that the NR models could inherit the prior knowledge from them. There exist two sub-categories in the fidelity model distillation method, which differ in their way to make use of FR IQA models.
- •
Learning from Synthetic Quality Labels: The first approach directly adopts the quality prediction of FR IQA models as the ground-truth label and learns the prior distribution in a supervised learning fashion. Given a dataset of pristine images , a distortion simulator , and a FR IQA model , the fidelity model distillation approach firstly generates a set of synthetically distorted images , where . For each pair of distorted and reference images , a synthetic quality score is then derived from the FR IQA measure, which can be denoted collectively as . Assuming the generated data are independent and identically distributed, the prior model parameter is set to the value that maximizes the likelihood function . Various instantiations of the idea have been developed based on different FR IQA models. Many algorithms are built upon standalone FR IQA models for conceptual simplicity kim:16; kim:18; pan:18. To take advantage of all three types of knowledge sources, state-of-the-art models of this kind employ fusion-based FR IQA models as the quality annotator wang:19; ye:14. These models yield high correlation with human opinion scores on the standard distorted images whose distortion process can be faithfully simulated.
- •
Learning to Rank: During the data preparation stage, the distortion simulator typically generates multiple distorted images for each reference image to cover the diversity of distortion processes, suggesting that the training data are not independent and identically distributed. To mitigate the problem, other fidelity model distillation-based models learn from the relations among the training images. Specifically, for each pair of images in the training set, let if and otherwise. Assuming the variability of quality across images is uncorrelated, the reliability of the IQA annotators do not depend on the input image, and the image pairs in the dataset are independent and identically distributed ma:19, one can then obtain the prior parameter distribution by maximizing the likelihood function
(17) To fully specify the optimization problem, one also need to make assumptions about the mathematical form of . Early attempts of this approach models the conditional probability with some standard functions (e.g., step function, standard Normal cumulative distribution function) gao:15, while state-of-the-art algorithms employ hierarchical probabilistic models for better model capacity ma:17 and interpretability ma:19.
In general, the fidelity model distillation-based NR IQA models have to face three major challenges. First, the robustness of this approach heavily relies on the diversity and quality of the synthetic distortion generator, both of which are often questionable in practice. Specifically, only a dozen of distortion types may be simulated, which may be inadequate at representing the diversity of distortions. As a result, this type of models does not generalize well to out-of-distribution distortion types athar:19. Second, their performance is upper-bounded by that of FR IQA models, which may be inaccurate across distortion levels ma:20 and distortion types ponomarenko:15. Third, even if the target FR IQA model performs perfectly on the synthetic distorted image dataset, the approach may suffer from excessive label noise originated from the natural discrepancy between perceptual fidelity and image quality. In particular, a distorted image could correspond to several plausible pristine counterparts, resulting in drastically different perceptual similarity measurements. Without access to the actual original images, the learner may be confused by the diverse quality annotations during the training stage.
4.3 Transfer Learning Approach
This approach is essentially the NR counterpart of the task-oriented feature learning methods for FR IQA. The basic assumption is that the HVS parameter configuration optimized for one visual task may also perform well on a relevant task. Methods of this kind maximize Equation 13 on various visual tasks via maximum likelihood method to obtain a prior estimate for , upon which the posterior distribution is derived. The instantiations of the approach differs in their domain of supplementary tasks.
Motivated by the prevalence of deep learning, most transfer learning-based IQA methods approximate the marginal likelihood of the observed data in the auxiliary task domain with a CNN. When developing the IQA models, researchers typically freeze the convolutional layers optimized for an auxiliary task (which are not retrained), and only retrain the fully connected layers that implement IQA circuits at the top to associate visual representations derived from the convolutional layers with quality annotations. Alternatively, the convolutional layers may be initialized with the auxiliary task-optimized parameters, and are fine-tuned by subject-rated images via a few gradient descent steps. The learning method is equivalent to an empirical Bayes procedure to maximize the marginal likelihood that uses a point estimate for computed by one or a few steps of gradient descent. However, this point estimate is not necessarily the global mode of a posterior due to the non-linearity of the CNN. We can instead understand the point estimate given by truncated gradient descent as the value of the mode of an implicit posterior over resulting from an empirical loss interpreted as a negative log-likelihood, and regularization penalties and the early stopping procedure jointly acting as priors grant:18. It is worth mentioning that the CNN architecture itself has been imposed as the prior knowledge about the connectivity of neurons in primary visual cortex.
The earliest transfer learning-based NR IQA models employ image recognition bosse:17; bianco:18 as the auxiliary task, where abundant subject annotations exist russakovsky:15. Somewhat surprisingly, the pre-trained network already exhibits moderate correlation with subjective quality annotations, suggesting that the task-oriented visual representations are to some degree already quality-aware kim:17b. With minimal fine-tuning, the method achieves much better performance. Another model are optimized in a similar fashion with the pre-training task being image restoration lin:18. The performance and efficiency of these approaches depend highly on the generalizability and relevance of the tasks used for pre-training. To enhance the relevance of the auxiliary task to IQA, a few recent algorithms have the quality prediction sub-task regularized by distortion identification kang:15; ma:18. However, the method is not easily extended for authentically distorted images because there is no well-defined categorization of real-world image distortions. Furthermore, it remains unclear if the HVS performs distortion identification as a explicit visual task. The search for optimal auxiliary tasks in the context of IQA is a subject of ongoing research.
4.4 Discussion
The Knowledge about Distortion Process: The knowledge about distortion process has played an important role in many IQA models, especially in the case of application-specific IQA where efficient algorithms may be developed by assessing the severeness of certain distortions. In the case of general-purpose IQA, however, the use of such knowledge may not be preferable for the following reasons. First, the development of universal distortion model is extremely challenging, because of the constantly evolving distortion process distribution. Indeed, the distortions that can occur are infinitely variable and one cannot predict whether or not a hitherto-unknown distortion type will emerge tomorrow. To account for all possible distortion types, one may have to assume a uniform distribution of the distortion process, which is equivalent to not using any knowledge about image distortions wang:06a. Second, a naïve subject can consistently assess image quality without access to the underlying distortion process, suggesting that the visual systems are capable of judging image quality independent of the knowledge about distortion. By contrast, existing NR IQA methods make use of the knowledge about image distortions in some way (e.g., by assuming the probability density function of distorted images, predicting the distortion type as an auxiliary visual task, or using distortion simulator to generate training data).
The Data Challenge: The success of IQA models strongly depends on the quantity, quality, representativeness, and consistency of training data, all of which are extremely limited in practice. First, the quantity of subject-rated images is bounded by the small capacity for subjective measurements. A typical “large-scale” subjective test allows for a maximum of several hundreds or a few thousands of test images to be rated. Given the enormous space of digital images, a few thousands of subject-rated samples are deemed to be extremely sparsely distributed in the space. Second, the quality of subject ratings is inherently lower than the labels in other visual tasks such as image categorization and segmentation due to the stochastic nature of image quality. More importantly, the quality of subject ratings gradually degrades as the number of test samples in a subjective experiment increases, where the fatigue effect comes into play. Third, the subject-rated images in the existing IQA databases may not be representative of the real-world distorted images, whose distortion process cannot be faithfully reproduced. Fourth, the consistency of subjective image quality among IQA databases is only moderate due to drastically different experimental conditions. Strictly speaking, the quality ratings of an image collected from a subjective experiment are essentially samples from a context conditional quality distribution , where t encodes the information about experiment environment, instruction, training process, presentation order, and experiment protocol. As a result, the subjective quality ratings obtained from different experiments cannot be simply aggregated into a larger IQA dataset . These data challenges constantly arise in IQA research and will remain a challenging issue in the future.
The Fair Comparison Challenge: Given the diversity of design philosophies, it becomes very challenging to fairly compare two competing hypotheses. Specifically, existing IQA algorithms are often trained on different datasets, equipped with different model capacity, and optimized by different learning algorithms. It remains unclear whether the performance gain comes from a more representative dataset, a more powerful model, an advanced machine learning technique, or the superiority of the proposed hypothesis. To ascertain the improvement, we expect more controlled experiments in the future.
The Cognitive Interaction Problem: It is widely known that cognitive understanding and interactive visual processing (e.g., eye movements) influence the perceived quality of images. For instance, the subjective quality rating of an image is shown to be a function of the experiment instruction sheikh:06a. The preference of image content, prior information about image composition, or attention and fixation engelke:11; zhang:16 may also affect the evaluation of the image quality. The incorporation of cognitive process in the IQA is a subject of ongoing research liu:11; zhang:17.

5 Evaluation Methodology
With a significant number of IQA models proposed recently, how to fairly compare their performance becomes a challenge. The existing evaluation methodologies are summarized in Figure 6, and discussed in detail below:
Direct Correlation with Subjective Evaluation: Because the HVS is the ultimate receiver in most applications, subjective evaluation is a straightforward and reliable approach to evaluate image quality. The method constitutes three steps as illustrated in Figure 6a. In the first stage, a number of representative images are selected from the image space. Early researches collect a few dozens of pristine images and distort the source images with distortion simulators that create distorted images of a few pre-set distortion types and quality levels larson:10; ponomarenko:15; ponomarenko:09; sheikh:06a. However, the real-world image distortion may deviate significantly from such simulated images. To this regard, recent studies create datasets of real-world Internet images, which are contaminated by authentic distortions ghadiyaram:15; hosu:20. In the second stage, the selected images are evaluated by a number of subjects. Each subject gives a quality score to each selected image, and the overall subjective quality of the image is typically represented by its mean opinion score (MOS) sheikh:06a. Alternatively, the subjective experiment may be setup in a double stimulus setting, where subjects are provided with two images and are asked to select the one with better quality. The preference data can be aggregated into a global ranking using rank aggregation tools such as maximum likelihood for multiple options ponomarenko:15; ponomarenko:09. In the final stage, the performance of the objective models is evaluated by comparison with subjective scores. Typical evaluation criteria include (1) Pearson linear correlation coefficient after a non-linear monotonic mapping between objective and subjective scores: a parametric measure of prediction accuracy; (2) Spearman rank-order correlation coefficient: a non-parametric measure of prediction monotonicity; and (3) Kendall rank-order correlation coefficient: another non-parametric measure of prediction monotonicity. A major problem with this evaluation methodology is the conflict between the enormous size of the image space and the limited capacity for subjective experiment. Subjective testing is expensive and time-consuming. The largest IQA dataset contains only 10,000 subject-rated images, which are deemed to be sparse samples of the image space.
Rational Test: NR IQA models can also be evaluated in a more economic way without conducting subjective experiment. Existing objective evaluation criteria rely on an image database consisting of pristine images and the synthetic distorted images derived from them.
- •
Pristine/Distorted Image Discriminability Test (D-Test) ma:16: The procedure of D-Test is shown in Figure 6b. Considering the pristine and distorted images as two distinct classes in a meaningful perceptual space, the D-Test aims to test how well an IQA model is able to separate the two classes. For each test IQA model, the procedure seeks a threshold value optimized to yield the maximum correct classification rate. A good NR IQA model should accurately distinguish the pristine images from the distorted ones.
- •
Listwise Ranking Consistency Test (L-Test) winkler:12: The goal is to evaluate the robustness of IQA models when rating images of the same content and with the same distortion type but different distortion levels. A good IQA model should rank these images in the same order. An illustrative example is given in Figure 6c, where different models may or may not produce the same quality rankings in consistency with the image distortion levels. The method assumes that the quality of an image degrades monotonically with the increase of the distortion level for any distortion type, which may not generalize to all distortion processes (e.g., rotation, contrast change, etc.).
- •
Pairwise Preference Consistency Test (P-Test) ma:16: The evaluation method relies on FR IQA models to select image pairs whose quality is clearly discriminable. In contrast to L-Test, this evaluation criteria enables the comparison of IQA models in their cross-content capability. In practice, an image pair is considered to be discriminable in quality if the difference in FR IQA predictions is larger than a certain threshold. The flowchart of P-Test is illustrated in Figure 6d. A good NR IQA model should consistently predict preferences concordant with the discriminable image pairs. The underlying assumption is that the target FR IQA generalize well to the synthetic distortions.
The dependence of these rational tests on distortion simulators limits their effectiveness as a strong benchmark, as a NR IQA model succeeding the sanity check may fail on authentically distorted images. Nevertheless, the objective evaluation methods provide an economic complement to the standard subjective evaluation, which have demonstrated to be especially useful in training machine learning-based NR IQA models.
Analysis by Synthesis: Given the enormous size of the image space, the limited capacity for subjective experiment, and the constantly evolving distortion processes, it seems hopeless to verify IQA models in a comprehensive manner. By contrast, to fail a model can be maximally efficient, for which theoretically only one counterexample is sufficient. Therefore, to accelerate the model comparison process, a complementary proposal is to falsify rather than validate the models. The method dubbed MAximum Differentiation (MAD) competition is illustrated in Figure 6e using MSE and SSIM as examples of competing models. Given two IQA models, MAD competition searches for a pair of images that maximize/minimize the quality in terms of one model (termed the attacker model) while holding the other (termed the defender model) fixed. The problem can be solved by advanced optimization algorithms berardino:17; wang:04c; wang:08, or exhaustive search in a large pool of pre-selected images ma:20. Following the stimuli synthesis, a two alternative forced choice subjective experiment (or its variant) is carried out to disprove the defender model. This procedure is then repeated, but with the attacker/defender roles of the two models reversed. A defender model that better survives attacks from other models in such a MAD wang:08 or group MAD ma:20 competitions, or an attacker model that better attacks/fails other models in such competitions, is considered a better model.
6 Conclusion and Open Problems
We have presented a Bayesian view to the visual image quantification problem. We have demonstrated that existing IQA methods can be explained by a common Bayesian framework with concrete mathematical formulation. To facilitate the understanding and comparison of these approaches, we have made the underlying assumptions explicit. Provided the ill-posed nature of IQA problem, it is essential to incorporate prior knowledge in the design of computational visual models. Depending on the availability of the reference image, two types of probabilistic graphical model can be derived, which define image quality in different ways. Both approaches aim to discover the configuration of the HVS represented by the prior distribution . Despite the variations in design principles and the great diversity of modeling techniques, all existing methods make use of one or more of three types of prior knowledge: knowledge about the HVS; knowledge about high-quality images; and knowledge about image distortions.
Remarkable progress has been made in the past decades in the field of IQA, evidenced by a number of state-of-the-art IQA models achieving high correlations with subjective quality opinions on images when tested using publicly available image quality databases. Nevertheless, this does not necessarily mean that IQA research has reached a level of maturity, especially when facing real-world challenges chandler:13; wang:16a. First, existing IQA models often suffer from generalization problem. It has been observed that the performance of IQA models trained on one database reduces significantly on other benchmark datasets, largely due to the distribution mismatch in the visual content and the distortion process across datasets. The lack of generalized, reliable, and easy-to-use model validation procedure also hinders the development of truly successful IQA systems. Second, most existing IQA models do not exhibit desirable mathematical properties, making it difficult to derive reliable perceptually motivated optimization approaches in image processing, computer vision, and computer graphics applications. Only limited effort has been made on understanding the mathematical properties of IQA measures brunet:11; brunet:12; richter:11. Third, it is highly desirable to reduce the complexity of IQA algorithms, especially for time-sensitive applications such as live broadcasting and video conferencing. Many existing models are far from meeting this challenge.
It is worth noting that the IQA tasks discussed so far have been constrained to an ideal narrow scope that allows for a focused, in-depth discussion. In practice, there is an enormous demand of IQA algorithms and systems, many of which involve novel domain-specific challenges. The application scope includes, but is not limited to, computer graphics lavoue:15, video compression zeng:14, video streaming duanmu:16, camera process fang:20, printing kite:00, visual displays rehman:15, stereo vision lambooij:11, reduced-reference quality assessment wang:11, degraded-reference quality assessment athar:17, multi-exposure fusion ma:15a, dynamic range compression yeganeh:13, texture analysis zujovic:13, spatial interpolation yeganeh:15, video frame-rate conversion nasiri:17, color image reproduction zhang:97, color-to-gray conversion ma:15b, depth quality wang:16b, visual discomfort lambooij:09, image aesthetics deng:17, new media types and environment (virtual reality and augmented reality) kim:19, screen content min:17, point cloud su:19, and 360-degree omnidirectional content xu:20, among many others. Most of these works are in preliminary stages, and there is a large space to be explored in the future.
7 Summary Points
- 1.
Objective image quality assessment (IQA) can be formulated as a Bayesian inference problem, where the key is to obtain the configuration of the human visual system (HVS) encoded by a prior parameter distribution.
- 2.
In general, three types of knowledge may be used in the design of image quality assessment methods: knowledge about the HVS; knowledge about high-quality images; and knowledge about image distortions.
- 3.
Perceptual fidelity is closely related to image quality under certain conditions. Based on this observation, a variety of full-reference IQA models are developed, including the error visibility paradigm, the structural similarity paradigm, the information theoretic paradigm, task-oriented feature learning methods, and fusion-based methods.
- 4.
No-reference IQA models can predict the visual quality of an image without access to its pristine counterpart. Existing methods can be categorized into the empirical statistical modeling approach, the fidelity model distillation approach, and the transfer learning approach.
- 5.
There has been a recent trend in the design principles of IQA methods from knowledge-driven toward data-driven approaches, evident by the dominance of objective prior learnt by Empirical Bayes method over the subjective prior designed by IQA researchers.
- 6.
The generalizability of IQA models, especially data-driven models, strongly depends on the quantity, quality, representativeness, and consistency of training data, which are scarce in practice. Creative methods are desired to mitigate such data challenges, and to overcome the limited capability of evaluation procedures.
Acknowledgments
This work is supported in part by Natural Sciences and Engineering Research Council (NSERC) of Canada under the Discovery Grant, Canada Research Chair program, and Alexander Graham Bell Canada Graduate Scholarship program.
The manuscript has been accepted by Annual Review of Vision Science.
References
- (1) Ahumada AJ. 1993. Computational image quality metrics: A review. SID Digest 24:305–8
- (2) Athar S, Rehman A, Wang Z. 2017. Quality assessment of images undergoing multiple distortion stages. Int. Conf. Image Process. pp. 3175–79. Beijing, China: IEEE
- (3) Athar S, Wang Z. 2019. A comprehensive performance evaluation of image quality assessment algorithms. IEEE Access 7:140030–70
- (4) Barlow HB. 1961. Possible principles underlying the transformation of sensory messages. Sens. Commun. 1:217–34
- (5) Berardino A, Laparra V, Ballé J, Simoncelli EP. 2017. Eigen-distortions of hierarchical representations. Proc. Adv. Neural Inf. Process. Syst. pp. 3530–39. Long Beach, CA: Curran Assoc.
- (6) Bernardo JM, Smith AF. 2009. Bayesian theory. John Wiley & Sons
- (7) Bosse S, Maniry D, Müller KR, Wiegand T, Samek W. 2017. Deep neural networks for no-reference and full-reference image quality assessment. IEEE Trans. Image Process. 27(1):206–19
- (8) Bianco S, Celona L, Napoletano P, Schettini R. 2018. On the use of deep learning for blind image quality assessment. Signal, Image and Video Process. 12(2):355–62
- (9) Bradley AP. 1999. A wavelet visible difference predictor. IEEE Trans. Image Process. 8(5):717–30
- (10) Brunet D, Vrscay ER, Wang Z. 2011. On the mathematical properties of the structural similarity index. IEEE Trans. Image Process. 21(4):1488–99
- (11) Brunet D, Vass J, Vrscay ER, Wang Z. 2012. Geodesics of the structural similarity index. Appl. Math. Lett. 25(11):1921–5
- (12) Carlson CR, Cohen RW. 1980. A simple psychophysical model for predicting the visibility of displayed information. Proc. Soc. Inform. Display 21(3):229–45
- (13) Chandler DM, Hemami SS. 2007. VSNR: A wavelet-based visual signal-to-noise ratio for natural images. IEEE Trans. Image Process. 16(9):2284–98
- (14) Chandler DM. 2013. Seven challenges in image quality assessment: Past, present, and future research. Int. Scholarly Res. Notices 2013: 1–53
- (15) Chang HW, Yang H, Gan Y, Wang MH. 2013. Sparse feature fidelity for perceptual image quality assessment. IEEE Trans. Image Process. 22(10):4007–18
- (16) Cover TM, Thomas JA. 1991. Elements of Information Theory. Wiley-Interscience
- (17) Daly S. 1992. The visible difference predictor: An algorithm for the assessment of image fidelity. Proc. SPIE 1666:2–15
- (18) Deng Y, Loy CC, Tang X. 2017. Image aesthetic assessment: An experimental survey. IEEE Signal Process. Mag. 34(4):80–106
- (19) De Finetti B. 2017. Theory of probability: A critical introductory treatment. John Wiley & Sons
- (20) Ding K, Ma K, Wang S, Simoncelli EP. 2020. Image quality assessment: Unifying structure and texture similarity. arXiv preprint arXiv:2004.07728 [cs.CV]
- (21) Duanmu Z, Zeng K, Ma K, Rehman A, Wang Z. 2016. A quality-of-experience index for streaming video. IEEE J. Sel. Topics Signal Process. 11(1):154–66
- (22) Engelke U, Kaprykowsky H, Zepernick HJ, Ndjiki-Nya P. 2011. Visual attention in quality assessment. IEEE Signal Process. Mag. 28(6):50–9
- (23) Fang Y, Zhu H, Zeng Y, Ma K, Wang Z. 2020. Perceptual quality assessment of smartphone photography. Conf. Comput. Vis. Pattern Recognit. pp. 3677–86. Seattle, WA: IEEE
- (24) Gao F, Tao D, Gao X, Li X. 2015. Learning to rank for blind image quality assessment. IEEE Trans. Neural Netw. Learn. Syst. 26(10):2275–90
- (25) Gao F, Wang Y, Li P, Tan M, Yu J, Zhu Y. 2017. Deepsim: Deep similarity for image quality assessment. Neurocomputing 257:104–14
- (26) Ghadiyaram D, Bovik AC. 2015. Massive online crowdsourced study of subjective and objective picture quality. IEEE Trans. Image Process. 25(1):372–87
- (27) Grant E, Finn C, Levine S, Darrell T, Griffiths T. 2018. Recasting gradient-based meta-learning as hierarchical bayes. arXiv preprint arXiv:1801.08930 [cs.CV]
- (28) Heeger DJ. 1992. Normalization of cell responses in cat striate cortex. Vis. Neurosci. 9(2):181–97
- (29) Hosu V, Lin H, Sziranyi T, Saupe D. 2020. KonIQ-10k: An ecologically valid database for deep learning of blind image quality assessment. IEEE Trans. Image Process. 29:4041–56
- (30) Hou W, Gao X, Tao D, Li X. 2014. Blind image quality assessment via deep learning. IEEE Trans. Neural Netw. Learn. Syst. 26(6):1275–86
- (31) Johnson J, Alahi A, Li F. 2016. Perceptual losses for real-time style transfer and super-resolution. Euro. Conf. Comput. Vis. pp. 694–711. Amsterdam, Netherlands: Springer
- (32) Kang L, Ye P, Li Y, Doermann D. 2014. Convolutional neural networks for no-reference image quality assessment. Conf. Comput. Vis. Pattern Recognit. pp. 1733–40. Columbus, OH: IEEE
- (33) Kang L, Ye P, Li Y, Doermann D. 2015. Simultaneous estimation of image quality and distortion via multi-task convolutional neural networks. Int. Conf. Image Process. pp. 2791–95. Quebec City, QC: IEEE
- (34) Kim HG, Lim HT, Ro YM. 2019. Deep virtual reality image quality assessment with human perception guider for omnidirectional image. IEEE Trans. Circuits Syst. Video Technol. 30(4):917–28
- (35) Kim J, Lee S. 2016. Fully deep blind image quality predictor. IEEE J. Sel. Topics Signal Process. 11(1):206–20
- (36) Kim J, Zeng H, Ghadiyaram D, Lee S, Zhang L, Bovik AC. 2017. Deep convolutional neural models for picture-quality prediction: Challenges and solutions to data-driven image quality assessment. IEEE Signal Process. Mag. 34(6):130–41
- (37) Kim J, Nguyen AD, Lee S. 2018. Deep CNN-based blind image quality predictor. IEEE J. Sel. Topics Signal Process. 30(1):11–24
- (38) Kingma DP, Dhariwal P. 2018. Glow: Generative flow with invertible 1x1 convolutions. Proc. Adv. Neural Inf. Process. Syst. pp. 10215–24. Montreal, QC: Curran Assoc.
- (39) Kite TD, Evans BL, Bovik AC. 2000. Modeling and quality assessment of halftoning by error diffusion. IEEE Trans. Image Process. 9(5):909–22
- (40) Knill DC, Richards W. 1996. Perception as Bayesian inference. Cambridge University Press
- (41) Lai YK, Kuo CC. 2000. A Haar wavelet approach to compressed image quality measurement. J. Vis. Commun. Image Represen. 11(1):17–40
- (42) Lambooij M, Fortuin M, Heynderickx I, IJsselsteijn W. 2009. Visual discomfort and visual fatigue of stereoscopic displays: A review. J. Imag. Sci. Tech.. 53(3):30201.1–14
- (43) Lambooij M, IJsselsteijn W, Bouwhuis DG, Heynderickx I. 2011. Evaluation of stereoscopic images: Beyond 2D quality. IEEE Trans. Broadcast. 57(2):432–44
- (44) Laparra V, Ballé J, Berardino A, Simoncelli EP. 2016. Perceptual image quality assessment using a normalized Laplacian pyramid. Electron. Imag. 2016(16):1–6
- (45) Larson EC, Chandler DM. 2010. Most apparent distortion: Full-reference image quality assessment and the role of strategy. J. Electron. Imag. 19(1):011006
- (46) Lasmar NE, Stitou Y, Berthoumieu Y. 2009. Multiscale skewed heavy tailed model for texture analysis. Int. Conf. Image Process. pp. 2281-84. Cairo, Egypt: IEEE
- (47) Lavoué G, Mantiuk R. Quality assessment in computer graphics. In Deng C, Ma L, Lin W, Ngan KN. Visual Signal Quality Assessment: Quality of Experience, Springer: Cham. 2015. pp. 243–86
- (48) Lin KY, Wang G. 2018. Hallucinated-IQA: No-reference image quality assessment via adversarial learning. Conf. Comput. Vis. Pattern Recognit. pp. 732–41. Salt Lake City, UT: IEEE
- (49) Liu H, Heynderickx I. 2011. Visual attention in objective image quality assessment: Based on eye-tracking data. IEEE Trans. Circuits Syst. Video Technol. 21(7):971–82
- (50) Liu TJ, Lin W, Kuo CC. 2012. Image quality assessment using multi-method fusion. IEEE Trans. Image Process. 22(5):1793–807
- (51) Lubin J. The use of psychophysical data and models in the analysis of display system performance. In Watson AB. Digital Images and Human Vision MIT Press. 1993. pp. 163–78
- (52) Lubin J. A visual discrimination model for imaging system design and evaluation. In Peli E. Vision Models for Target Detect. Recognit. World Scientific. 1995. pp. 245–83
- (53) Ma K, Zeng K, Wang Z. 2015. Perceptual quality assessment for multi-exposure image fusion. IEEE Trans. Image Process. 24(11):3345–56
- (54) Ma K, Zhao T, Zeng K, Wang Z. 2015. Objective quality assessment for color-to-gray image conversion. IEEE Trans. Image Process. 24(12):4673–85
- (55) Ma K, Duanmu Z, Wu Q, Wang Z, Yong H, Li H, Zhang L. 2016. Waterloo exploration database: New challenges for image quality assessment models. IEEE Trans. Image Process. 26(2):1004–16
- (56) Ma K, Liu W, Liu T, Wang Z, Tao D. 2017. dipIQ: Blind image quality assessment by learning-to-rank discriminable image pairs. IEEE Trans. Image Process. 26(8):3951–64
- (57) Ma K, Liu W, Zhang K, Duanmu Z, Wang Z, Zuo W. 2018. End-to-end blind image quality assessment using deep neural networks. IEEE Trans. Image Process. 27(3):1202–13
- (58) Ma K, Liu X, Fang Y, Simoncelli EP. 2019. Blind image quality assessment by learning from multiple annotators. Int. Conf. Image Process. pp. 2344–48. Taipei, Taiwan: IEEE
- (59) Ma K, Duanmu Z, Wang Z, Wu Q, Liu W, Yong H, Li H, Zhang L. 2020. Group maximum differentiation competition: Model comparison with few samples. IEEE Trans. Pattern Anal. Mach. Intell. 42(4):851–64
- (60) Mannos J, Sakrison D. 1974. The effects of a visual fidelity criterion of the encoding of images. IEEE Trans. Inf. Theory 20(4):525–36
- (61) Marziliano P, Dufaux F, and Winkler S, Ebrahimi T. 2004. Perceptual blur and ringing metrics: Application to JPEG2000. Signal Process. Image Commun., 19(2):163–72
- (62) Min X, Ma K, Gu K, Zhai G, Wang Z, Lin W. 2017. Unified blind quality assessment of compressed natural, graphic, and screen content images. IEEE Trans. Image Process. 26(11):5462–74
- (63) Mittal A, Moorthy AK, Bovik AC. 2012. No-reference image quality assessment in the spatial domain. IEEE Trans. Image Process. 21(12):4695–708
- (64) Mittal A, Soundararajan R, Bovik AC. 2012. Making a “completely blind” image quality analyzer. IEEE Signal Process. Let. 20(3):209–12
- (65) Moorthy AK, Bovik AC. 2011. Blind image quality assessment: From natural scene statistics to perceptual quality. IEEE Trans. Image Process. 20(12):3350–64
- (66) Nasiri RM, Wang Z. 2017. Perceptual aliasing factors and the impact of frame rate on video quality. Int. Conf. Image Process. pp. 3475–79. Beijing, China: IEEE
- (67) Nielsen KR, Watson AB, Ahumada AJ. 1985. Application of a computable model of human spatial vision to phase discrimination. J. Opt. Soc. Amer. 2(9):1600–06
- (68) Olshausen BA, Field DJ. 1997. Sparse coding with an overcomplete basis set: A strategy employed by V1? Vis. Res. 37(23):3311–25
- (69) Pan D, Shi P, Hou M, Ying Z, Fu S, Zhang Y. 2018. Blind predicting similar quality map for image quality assessment. Conf. Comput. Vis. Pattern Recognit. pp. 6373–82. Salt Lake City, UT: IEEE
- (70) Parraga CA, Troscianko T, Tolhurst DJ. 2000. The human visual system is optimised for processing the spatial information in natural visual images. Curr. Biol. 10(1):35–8
- (71) Ponomarenko N, Jin L, Ieremeiev O, Lukin V, Egiazarian K, Astola J, Vozel B, Chehdi K, Carli M, Battisti F, Kuo CC. 2015. Image database TID2013: Peculiarities, results and perspectives. Signal Process. Image Commun. 30:57–77
- (72) Ponomarenko N, Lukin V, Zelensky A, Egiazarian K, Carli M, Battisti F. 2009. TID2008-A database for evaluation of full-reference visual quality assessment metrics. Adv. Modern Radioelectron. 10(4):30–45
- (73) Prince SJ. 2012. Computer vision: Models, learning, and inference. Cambridge University Press
- (74) Rehman A, Wang Z. 2012. Reduced-reference image quality assessment by structural similarity estimation. IEEE Trans. Image Process. 21(8):3378–89
- (75) Rehman A, Zeng K, Wang Z. 2015. Display device-adapted video quality-of-experience assessment. Proc. SPIE 9394:1–11
- (76) Richter T. 2011. SSIM as global quality metric: A differential geometry view. Int. Workshop Quality of Multimed. Exp. pp. 189–94. Mechelen, Belgium: IEEE
- (77) Russakovsky O, Deng J, Su H, Krause J, Satheesh S, Ma S, Huang Z, Karpathy A, Khosla A, Bernstein M, Berg AC. 2015. Imagenet large scale visual recognition challenge. Int. J. Comput. Vis. 115(3):211–52
- (78) Saad MA, Bovik AC, Charrier C. 2012. Blind image quality assessment: A natural scene statistics approach in the DCT domain. IEEE Trans. Image Process. 21(8):3339–52
- (79) Safranek RJ, Johnston JD. 1989. A perceptually tuned sub-band image coder with image dependent quantization and post-quantization data compression. Int. Conf. Acoustics, Speech, and Signal Process. pp. 1945–48. Glasgow, UK: IEEE
- (80) Sampat MP, Wang Z, Gupta S, Bovik AC, Markey MK. 2009. Complex wavelet structural similarity: A new image similarity index. IEEE Trans. Image Process. 18(11):2385–401.
- (81) Sheikh HR, Bovik AC, De Veciana G. 2005. An information fidelity criterion for image quality assessment using natural scene statistics. IEEE Trans. Image Process. 14(12):2117–28
- (82) Sheikh HR, Sabir MF, Bovik AC. 2006. A statistical evaluation of recent full reference image quality assessment algorithms. IEEE Trans. Image Process. 15(11):3440–51
- (83) Sheikh HR, Bovik AC. 2006. Image information and visual quality. IEEE Trans. Image Process. 15(2):430–44
- (84) Silverstein DA, Farrell JE. 1996. The relationship between image fidelity and image quality. Int. Conf. Image Process. pp. 881–84. Lausanne, Switzerland: IEEE.
- (85) Simoncelli EP, Olshausen BA. 2001. Natural image statistics and neural representation. Annu. Rev. Neurosci. 24(1):1193–216
- (86) Soundararajan R, Bovik AC. 2011. RRED indices: Reduced reference entropic differencing for image quality assessment. IEEE Trans. Image Process. 21(2):517–26
- (87) Stocker AA, Simoncelli EP. 2006. Sensory adaptation within a Bayesian framework for perception. Proc. Adv. Neural Inf. Process. Syst. pp. 1289–96. Vancouver, BC: Curran Assoc.
- (88) Su H, Duanmu Z, Liu W, Liu Q, Wang Z. 2019. Perceptual quality assessment of 3D point clouds. Int. Conf. Image Process. pp. 3182–86. Taipei, Taiwan: IEEE.
- (89) Talebi H, Milanfar P. 2018. NIMA: Neural image assessment. IEEE Trans. Image Process. 27(8):3998–4011
- (90) Taylor CC, Pizlo Z, Allebach JP, Bouman CA. 1997. Image quality assessment with a Gabor pyramid model of the human visual system. Proc. SPIE 3016:58–69
- (91) Teo PC, Heeger DJ. 1994. Perceptual image distortion. Int. Conf. Image Process. pp. 982–86. Austin, TX: IEEE
- (92) VQEG. 2000. Final report from the video quality exports group on the validation of objective models of video quality assessment. Online. Available: http://www.vqeg.org/.
- (93) Wainwright MJ, Simoncelli EP. 2000. Scale mixtures of Gaussians and the statistics of natural images. Proc. Adv. Neural Inf. Process. Syst. pp. 855–61. Denver, CO: Curran Assoc.
- (94) Wang J, Wang S, Ma K, Wang Z. 2016. Perceptual depth quality in distorted stereoscopic images. IEEE Trans. Image Process. 26(3):1202–15
- (95) Wang Z, Sheikh HR, Bovik AC. 2002. No-reference perceptual quality assessment of JPEG compressed images. Int. Conf. Image Process. pp. 477–80. Rochester, NY: IEEE
- (96) Wang Z, Bovik AC. 2002. A universal image quality index. IEEE Signal Process. Let. 9(3):81–84
- (97) Wang Z, Simoncelli EP, AC Bovik. 2003. Multiscale structural similarity for image quality assessment. Asilomar Conf. on Signals, Systems & Comput. pp. 1398–1402. Pacific Grove, CA: IEEE
- (98) Wang Z, Bovik AC, Sheikh HR, Simoncelli EP. 2004. Image quality assessment: From error visibility to structural similarity. IEEE Trans. Image Process. 13(4):600–12
- (99) Wang Z, Simoncelli EP. 2004. Local phase coherence and the perception of blur. Proc. Adv. Neural Inf. Process. Syst pp. 1435–42. Vancouver, BC: Curran Assoc.
- (100) Wang Z, Simoncelli EP. 2004. Stimulus synthesis for efficient evaluation and refinement of perceptual image quality metrics. Proc. SPIE 5292:99–108
- (101) Wang Z, Simoncelli EP. 2005. An adaptive linear system framework for image distortion analysis. Int. Conf. Image Process. pp. 1160–63. Genova, Italy: IEEE
- (102) Wang Z, Simoncelli EP. 2005. Reduced-reference image quality assessment using a wavelet-domain natural image statistic model. Proc. SPIE 5666:149–59
- (103) Wang Z, Bovik AC. 2006. Modern image quality assessment. Synthesis Lectures on Image, Video, and Multimed. Process. 2(1):1–56
- (104) Wang Z, Wu G, Sheikh HR, Simoncelli EP, Yang EH, Bovik AC. 2006. Quality-aware images. IEEE Trans. Image Process. 15(6):1680–89
- (105) Wang Z, Shang X. 2006. Spatial pooling strategies for perceptual image quality assessment. Int. Conf. Image Process. pp. 2945–48. Atlanta, GA: IEEE
- (106) Wang Z, Simoncelli EP. 2008. Maximum differentiation (MAD) competition: A methodology for comparing computational models of perceptual quantities. J. Vis. 8(12):1–8
- (107) Wang Z, Bovik AC. 2009. Mean squared error: Love it or leave it? A new look at signal fidelity measures. IEEE Signal Process. Mag. 26(1):98–117
- (108) Wang Z, Li Q. 2010. Information content weighting for perceptual image quality assessment. IEEE Trans. Image Process. 20(5):1185–98
- (109) Wang Z, Bovik AC. 2011. Reduced-and no-reference image quality assessment: The natural scene statistic model approach. IEEE Signal Process. Mag. 28(6):29–40
- (110) Wang Z. 2016. Objective image quality assessment: Facing the real-world challenges. Electron. Imag. 2016(13):1–6
- (111) Wang Z, Athar S, Wang Z. 2019. Blind quality assessment of multiply distorted images using deep neural networks. Int. Conf. Image Anal. Recognit. pp. 89–101. Waterloo, ON: Springer
- (112) Watson AB. 1987. The cortex transform: Rapid computation of simulated neural images. Comput. Gr. Image Process. 39(3):311–27
- (113) Watson AB, Ahumada AJ. 1989. A hexagonal orthogonal-oriented pyramid as a model of image representation in visual cortex. IEEE. Trans. Biomed. Eng. 36(1):97–106
- (114) Watson AB. 1993. DCTune: A technique for visual optimization of DCT quantization matrices for individual images. Soc. Inf. Display Dig. Tech. Papers XXIV:946–49
- (115) Watson AB, Yang GY, Solomon JA. 1997. Visibility of wavelet quantization noise. IEEE Trans. Image Process. 6(8):1164–75
- (116) Winkler S. 2012. Analysis of public image and video databases for quality assessment. IEEE J. Sel. Topics Signal Process. 6(6):616–25
- (117) Wu Q, Li H, Meng F, Ngan KN, Luo B, Huang C, Zeng B. 2015. Blind image quality assessment based on multichannel feature fusion and label transfer. IEEE Trans. Circuits Syst. Video Technol. 26(3):425–40
- (118) Wu Q, Wang Z, Li H. 2015. A highly efficient method for blind image quality assessment. Int. Conf. Image Process. pp. 339–43. Quebec City, QC: IEEE
- (119) Xu J, Ye P, Li Q, Du H, Liu Y, Doermann D. 2016. Blind image quality assessment based on high order statistics aggregation. IEEE Trans. Image Process. 25(9):4444–57
- (120) Xu M, Li C, Zhang S, Le Callet P. 2020. State-of-the-art in 360 video/image processing: Perception, assessment and compression. IEEE J. Sel. Topics Signal Process. 14(1):5–26
- (121) Xue W, Zhang L, Mou X. 2013. Learning without human scores for blind image quality assessment. Conf. Comput. Vis. Pattern Recognit. pp. 995–1002. Portland, OR: IEEE
- (122) Xue W, Zhang L, Mou X, Bovik AC. 2013. Gradient magnitude similarity deviation: A highly efficient perceptual image quality index. IEEE Trans. Image Process. 23(2):684–95
- (123) Ye P, Kumar J, Kang L, Doermann D. 2012. Unsupervised feature learning framework for no-reference image quality assessment. Conf. Comput. Vis. Pattern Recognit. pp. 1098–105. Providence, RI: IEEE
- (124) Ye P, Kumar J, Doermann D. 2014. Beyond human opinion scores: Blind image quality assessment based on synthetic scores. Conf. Comput. Vis. Pattern Recognit. pp. 4241–48. Columbus, OH: IEEE
- (125) Yeganeh H, Wang Z. 2013. Objective quality assessment of tone-mapped images. IEEE Trans. Image Process. 22(2):657–67
- (126) Yeganeh H, Rostami M, Wang Z. 2015. Objective quality assessment of interpolated natural images. IEEE Trans. Image Process. 24(11):4651–63
- (127) Zeng K, Zhao T, Rehman A, Wang Z. 2014. Characterizing perceptual artifacts in compressed video streams. Proc. SPIE 9014:1–10
- (128) Zhai G, Min X. 2020. Perceptual image quality assessment: A survey. Sci. China Info. Sci. 63(11):211301
- (129) Zhang L, Zhang L, Mou X, Zhang D. 2011. FSIM: A feature similarity index for image quality assessment. IEEE Trans. Image Process. 20(8):2378–86
- (130) Zhang L, Zhang L, Bovik AC. 2015. A feature-enriched completely blind image quality evaluator. IEEE Trans. Image Process. 24(8):2579–91
- (131) Zhang P, Zhou W, Wu L, Li H. 2015. SOM: Semantic obviousness metric for image quality assessment. Conf. Comput. Vis. Pattern Recognit. pp. 2394–402. Boston, MA: IEEE
- (132) Zhang R, Isola P, Efros AA, Shechtman E, Wang O. 2018. The unreasonable effectiveness of deep features as a perceptual metric. Conf. Comput. Vis. Pattern Recognit. pp. 586–95. Salt Lake City, UT: IEEE
- (133) Zhang W, Borji A, Wang Z, Le Callet P, Liu H. 2016. The application of visual saliency models in objective image quality assessment: A statistical evaluation. IEEE Trans. Neural Netw. Learn. Syst. 27(6):1266–78
- (134) Zhang W, Liu H. 2017. Learning picture quality from visual distraction: Psychophysical studies and computational models. Neurocomput. 247:183–91
- (135) Zhang X, Feng X, Wang W, Xue W. 2013. Edge strength similarity for image quality assessment. IEEE Signal Process. Let. 20(4):319–22
- (136) Zhang X, Wandell BA. 1997. A spatial extension of CIELAB for digital color-image reproduction. J. Soc. Inform. Display 5(1):61–3
- (137) Zujovic J, Pappas TN, Neuhoff DL. 2013. Structural texture similarity metrics for image analysis and retrieval. IEEE Trans. Image Process. 22(7):2545–58