In-situ measurements of whole-dish reflectivity for VERITASJournal: Astroparticle Physics
Abstract
The VERITAS array is a set of four imaging atmospheric Cherenkov telescopes (IACTs) sensitive to gamma rays with energies above 80 GeV. Each telescope is based on a tessellated mirror, 12 metres in diameter, which reflects light from a gamma-ray-induced air shower to form an image on a pixellated ‘camera’ comprising 499 photomultiplier tubes. The image brightness is the primary measure of the gamma ray’s energy so a knowledge of the mirror reflectivity is important. We describe here a method, pioneered by members of the MAGIC collaboration, to measure the whole-dish reflectivity, quickly and regularly, so that effects of mirror aging can be monitored. A CCD camera attached near the centre of the dish simultaneously acquires an image of both a star and its reflection on a target made of Spectralon, a highly-reflective material, placed at the focus of the telescope. The ratio of their brightnesses, as recorded by the CCD, along with geometric factors, provides an estimate of the dish reflectivity with few systematic errors. A filter wheel is deployed with the CCD camera, allowing one to measure the reflectivity as a function of wavelength. We present results obtained with the VERITAS telescopes since 2014.
Keywords:
VERITAS, Cherenkov Telescope, Reflectivity1 Introduction
Very-high-energy (VHE) gamma-ray astronomy makes use of arrays of imaging atmospheric Cherenkov telescopes (IACTs). A telescope consists of a large tesseleted mirror that focusses Cherenkov light from extensive air showers onto a camera comprising an array of photomultiplier tubes (PMTs). The sum of signals from the PMTs is proportional to the energy of the incident gamma ray, so a key parameter needed to extract science from the data acquired using such telescopes is the effective reflectivity of the mirror, the “whole-dish” reflectivity. This number can be estimated using measurements on a representative set of facets made periodically with a laboratory setup. Calculated corrections to account for the shadowing effects of the PMT camera and its support structure can also be included. However it is desirable to have alternative ways of determining the mirror reflectivity if only to build confidence in one’s understanding of the instrument and as a way of estimating systematic errors.
In this report we describe our experience with a system developed to measure the whole-dish reflectivity of the VERITAS telescopes. The method we follow was first suggested by members of the MAGIC collaboration [1, 2, 3]. The basic idea is to mount a digital camera on the telescope to record, in the same image, light coming directly from a bright star as well as the light from that star that has reflected off the main mirror and subsequently off a target of known reflectivity placed at the mirror focus. Up to numerical factors, the whole-dish reflectivity is determined from the ratio of the two signals. The use of a single camera to simultaneously record both the direct and reflected images eliminates many possible systematic errors.
2 Apparatus
VERITAS comprises an array of four IACTs located at the Whipple Observatory on Mount Hopkins in southern Arizona [4, 5]. Each of the telescopes is based on a 12-m diameter Davies-Cotton reflector focussing light onto a 499-pixel camera made from close-packed Hamamatsu R10560 PMTs coupled to light concentrators. The reflector is made up of 345 identical mirror facets; when they are perfectly aligned the on-axis point-spread-function is smaller than a pixel diameter [6].
2.1 Digital Camera
The digital camera used for this work is the ST402ME model from Santa Barbara Instrument Group (SBIG - now Diffraction Limitedⓒ), an “entry-level” model which nevertheless incorporates some fairly advanced features. Given that we wanted to equip all four telescopes in the VERITAS array with its own permanently-mounted camera to allow parallel data taking and stability between measurement sessions, the relatively low price was a factor in its choice.
The camera is based on a Kodak KAF-0402ME CCD chip with 765 512 pixels and 85% peak quantum efficiency. An important feature of this camera is its on-board thermo-electric cooling system which can cool the CCD chip to approximately 25 C below ambient temperature, thus lowering the dark current considerably. Automatic dark-frame subtraction is available to obviate the effects of stuck or hot pixels.
The lens is a Ricoh C32500 machine vision lens with 25 mm focal length and 2/3” format. It is used with maximum iris opening (f/1.4) and is focussed on the Spectralon at a distance of 12 m.
The camera is equipped with an integrated RGB filter wheel to allow measurements at different wavelengths. The transmission bands, shown in Figure 1, are rather wide so wavelength-dependence investigations are consequently approximate. The use of third-party filters with narrower transmission windows is precluded by the small size of the filter wheel; the filters provided by SBIG are custom-made to fit.

The camera is controlled and read out by a small form-factor computer built from the following commercially available components:
- 1.
Motherboard with integrated CPU: ASRock E350M1 AMD E-350 APU
- 2.
Power supply: APEVIA ITX-AP250W
- 3.
Hard drive: ADATA SP900 ASP900S3-64GB-C 64GB SSD
The computer uses the Ubuntu 12.04 LTS operating system and has an ethernet connection for control signals and data retrieval.
The computer and camera are contained in a weatherproof box (Pelco model EH5700) mounted on the optical support structure of the telescope, approximately 1.7 m from the centre of the dish, as shown in Figure 2.

2.2 Reflective Target
The secondary reflector onto which starlight is focussed is a square piece of Spectralon, supplied by Labsphere Inc., 30 cm on a side. It is a fluoropolymer with diffuse (Lambertian) reflectance greater than 99% over the wavelength range of interest. The target is attached to an aluminum plate that can be temporarily mounted at the focal point of the telescope, as shown in Figure 3. When not in use, the target is stored with a protective cover to prevent any dirt or dust from reducing its reflectivity. The targets were returned to the manufacturer for recalibration two years after purchase and showed no significant deterioration. In 2020, a new target was purchased and used for a set of measurements on one of the VERITAS telescopes, as a check. Reflectivity values for the telescope were consistent with those obtained with the old target. We conclude that any apparent drop in the dish reflectivity is due to the mirror facets and not to any changes in the Spectralon targets.

3 Data Acquisition
Figure 4 shows a sample of the type of image used in the reflectivity measurements. A logarithmic intensity scale and inverted grey-scale highlight the key features. One sees an intense black object in the lower right quadrant; this is the direct image of the target star. Its finite extent is due to its being out of focus because the CCD camera is focussed on the Spectralon target seen in the upper left quadrant. This out-of-focus feature allows one to avoid saturation when dealing with bright stars or long exposures, both needed for improving signal to noise.
The telescope focus box and supporting quadrupod arms are clearly visible, as is the square shape of the Spectralon target. The reflection of the starlight focussed thereon is seen as a round black object in the middle. Its size is largely due to the PSF of the reflector dish.
The reflectivity measurement protocol involves the acquisition of images from four or five bright stars at elevations greater than 50∘. The angle cut reduces any atmospheric effects and anthropogenic backgrounds. The images are usually obtained when there is partial moonlight in order not to interfere with gamma-ray observing. For each star, an unfiltered image is acquired and the exposure is checked for saturation, with adjustments to the exposure time being made, automatically, if necessary. Quasi real time feedback is supplied to the operator via SAOImage DS9 [7]. The first image is obtained without dark-frame subtraction activated to allow an easy check for saturation. Next, two or more additional images are obtained with the subtraction feature switched on. This procedure is repeated with the R, G, and B filters in the optical path. All data are stored as FITS files on the local disk and are later transferred to an archive.
All four telescopes are equipped with identical apparatus and the entire procedure takes on the order of thirty minutes for a complete data set.

4 Data Analysis
4.1 Signal extraction
The off-line analysis proceeds as follows. The dark-frame-subtracted files are combined and the centres of the stars and their reflections are determined. Concentric squares are positioned around the centre, an inner one typically 24 24 pixels and an outer one 36 36 pixels. The sum of the pixel values from the inner square, minus the geometrically-scaled sum of pixel values from the region between the inner and outer square boundaries, used as an estimate of the background, constitutes the signal. The results are independent of the precise values of the square sizes, as long as the reflection image is fully contained within the inner square.
The whole-dish reflectivity is calculated from the direct and reflected signals, and , respectively, using the formula where is the area of the dish (115 m2) and is the distance from the Spectralon to the CCD camera (12 m). This assumes that the reflectivity of the Spectralon is 100% and that the angle between the CCD camera axis and the normal to the Spectralon target is approximately zero, so that there is no cosine-dependent correction for the Lambertian distribution of light coming from the target. Note that this formula for is for the effective reflectivity of the dish. It includes the effects of any missing or misaligned mirror facets or of shadowing of the PMT-based camera due to the camera itself and its support structure. Both of these result in a reduction of light reflecting off the dish and onto the Spectralon, with a consequent reduction in but not . is the parameter of most use in the analysis of gamma-ray data. It is agnostic as to the reason light was lost, whether it be to degradation of the facet reflectivity, misalignment, or shadowing.
4.2 Vignetting correction
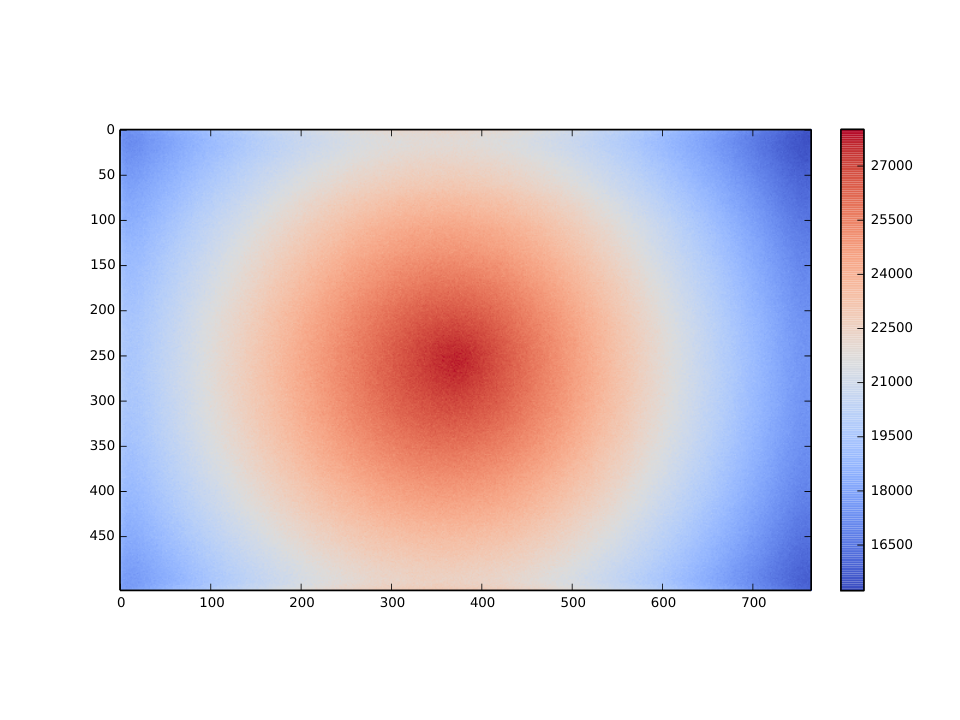
The CCD camera produces images that suffer from vignetting effects and this must be accounted for in calculating the reflectivity of the mirror. To do this we use flat-field images obtained by photographing the zenith at twilight using the same focus and aperture settings as with normal data. A typical image is shown in Figure 5. The difference in intensities between the centre of the image and the corners is almost a factor of two, indicating the importance of corrections. The data are well parameterized by a conical fit. The fit parameters are the centre of cone and a single slope which describes the fall-off of intensity with radius from the centre. The inverse of this function is used to unfold the vignetting effects.
The correction factors can be reduced by careful aiming of the camera. With the star image and the reflection image approximately equidistant from the centre of the camera’s field-of-view, each suffers approximately the same amount of vignetting. Since we use the ratio of measured intensities, the correction amounts to a second-order effect.
4.3 Statistical uncertainties
The data from Figure 5 are useful for determining statistical uncertainties. We assume that adjacent pixels should report approximately the same number in a flat-field image since the twilight sky is uniform and vignetting effects vary slowly across the image plane. The largest contribution to any difference between adjacent values should be due to statistical fluctuations. Thus we can histogram the differences between values from neighbouring pixels in a row (or column) of the CCD and use the width of the resulting distribution as an estimator of the statistical error. The effect varies, as expected, with the magnitudes of the pixel values and can be parameterized as , where is the pixel value. This dependence is used in assigning uncertainties to pixel values in the analysis.
5 Results
In this section we present results obtained since January, 2014, when development of the measurement system was completed.
Figure 6 shows a sample of results from a single observing night made with one of the VERITAS telescopes. Reflectivities, measured using four different stars and four band-pass filters, are displayed, with results grouped by filter colour. A flat line indicates the weighted mean for each group. Statistical uncertainties are plotted.
Similar plots exist for the three other telescopes in the array and for different observing sessions. In all cases the reflectivity values are highest for the blue-filter data and lowest for the red-filter data, consistent with the canonical wavelength dependence for aluminum. Values obtained without filters show more scatter due to the effects of the different colours of the stars used.

The average values for each filter and each data set can be plotted vs time to show the evolution of the reflectivity with time. Here we show results from blue-filter data, the most relevant for Cherenkov telescopes since most of the detected light is from the UV and blue parts of the spectrum. (Note that the CCD camera is insensitive to UV wavelengths; there is a sharp cutoff in quantum efficiency at 400 nm.)
In Figure 7, we have results from one of the VERITAS telescopes plotted vs days since the begining of 2014. There is a clear secular decline caused by weathering of the mirror coatings. Monthly washing of the mirrors helps to keep the effects of dust and dirt from making the decline more rapid and may contribute to some of the scatter seen in these plots. The decline is gradual but significant; the red line is not a fit but is drawn to show that the decline is approximately exponential and to indicate the level of systematic uncertainties that remain. All four VERITAS telescopes show similar long-term behaviour.
The scatter of points about the line indicates the level of systematic uncertainties. Chief among them is the effect of vignetting. This can be seen in the differences from season to season that are not fully corrected. This results from taking down the cameras during summer shut-downs; with the current setup it is difficult to aim them precisely when they are reinstalled at the start of the observing season. A better mounting system would help with this situation.
VERITAS has approximately 100 spare mirror facets and these are used in a program wherein facets are taken off the telescopes and replaced by the spare facets [8]. The replaced facets are then recoated and used as replacements in the next facet swap. A facet swap was performed on this telescope just after day 250 and the effect of this operation can be seen in the figure.
6 Conclusion
We have successfully implemented a system to measure the reflectivity of the VERITAS telescope mirrors. The measurements can be carried out in less than one hour and at times that do not interfere with gamma-ray observations (late twilight or under partial moonlight). The use of band-pass filters to restrict the wavelengths observed lessen any confounding effects arising from the use of stars of different spectral type and ensure that reflectivities obtained from different stars are consistent within errors. Our observations over seven years indicate that the system is relatively stable and is able to track mirror degradation at a level of a few percent. Systematic errors are mainly due to vignetting effects and could be reduced by using a camera mounting system that would allow precision adjustment to where the target star and its reflection appear in the camera image.
7 Acknowledgements
This research is supported by grants from the U.S. Department of Energy Office of Science, the U.S. National Science Foundation and the Smithsonian Institution, by NSERC in Canada, and by the Helmholtz Association in Germany. We acknowledge the excellent work of the technical support staff at the Fred Lawrence Whipple Observatory and at the collaborating institutions in the construction and operation of the instrument. We are grateful to our VERITAS colleagues for help with acquiring the data for the studies described here. Conversations with R. Mirzoyan have been very helpful.
References
- [1] R. Mirzoyan, M. Garczarczyk, J. Hose and D. Paneque, A method to measure the mirror reflectivity of a prime focus telescope, Astropart. Phys. 27 (2007) 509.
- [2] H. Kellermann, Praezise Vermessung der fokussierten Reflektivitaet der MAGIC-Teleskopspiegel und Charakterisierung des hierfuer verwendeten diffusen Reflektors, Diploma Thesis, University of Applied Sciences Munich (2011)
- [3] R. Mirzoyan, C. Arcaro, H. Kellermann, and M. Garczarczyk, Absolute reflectance of a concave mirror used for astroparticle physics experiments, Astropart. Phys. 105 (2019) 1.
- [4] N. Park, Performance of the VERITAS experiment, Proceedings of the 34th International Cosmic Ray Conference, arXiv:1508.07070v2
- [5] J. Holder et al., The First VERITAS Telescope, Astropart. Phys. 25 (2006) 391.
- [6] A. McCann, D. Hanna, J. Kildea and M. McCutcheon, A new mirror alignment system for the VERITAS telescopes, Astropart. Phys. 32 (2010) 325.
- [7] W.A. Joye, E. Mandel, New Features of SAOImage DS9, in: H.E. Payne, R.I. Jedrzejewski, R.N. Hook (Eds.), Astronomical Data Analysis Software and Systems XII, 295, Astronomical Society of the Pacific, 2003, p. 489.
- [8] E. Roache, et al., Mirror Facets for the VERITAS telescopes, Proceedings of the 30th International Cosmic Ray Conference, (ICRC 2007): Merida, Yucatan, Mexico, July 3–11, Universidad Nacional Autónoma de México, 2007