[ orcid=0000-0002-9963-8682] [ orcid=0000-0002-8770-1429] [ orcid=0000-0001-5785-7732]
The wake of a transversely oscillating circular cylinder in a flowing soap film at low Reynolds number
Abstract
An inclined gravity-driven soap film channel was used to study the wake patterns formed behind a transversely oscillating cylinder at . The natural frequency of vortex shedding from a stationary cylinder, , was used to identify the oscillation frequencies of interest. The (dimensionless) frequency, , and amplitude, , of the cylinder’s motion was varied over a large portion of the fundamental synchronization region (i.e., for ), and a ‘map’ of wake patterns was constructed in space. Lock-on between the frequency of the cylinder’s motion and the dominant frequency of the resulting vortex wake was observed for a large range of this parameter space, predominantly manifested as synchronized ‘2S’ and ‘2P’ wake modes. Synchronized ‘P+S’, ‘2T’, and ‘transitional’ wakes were also found in smaller regions of parameter space. Unsynchronized ‘coalescing’ and ‘perturbed von Kármán’ wakes were observed as the oscillation frequency became sufficiently different from . The wake patterns and vortex formation processes found in this study, particularly the 2P mode wakes, bear a strong resemblance to previous three-dimensional experimental results, despite the physical constraint from the soap film that limits three-dimensional effects in the wake.
keywords
bluff body wakes ,fluid-structure interaction ,vortex-induced vibrations ,vortex dynamics ,vortex wakes1 Introduction
Steady, uniform flow moving with speed past a fixed circular cylinder with diameter produces, for a wide range of Reynolds numbers, an unsteady wake consisting of coherent vortical structures that are shed from the cylinder with a clearly defined frequency, ; see, e.g., the review by Williamson 1996b and the textbook by Zdravkovich 1997. When the cylinder is also allowed to oscillate transverse to the flow direction in response to the periodic vortex shedding — or, as is the case in the present work, when it is forced to oscillate at a prescribed frequency, , and amplitude, — the resulting wake structure can be significantly more complicated than when the cylinder is held stationary (Williamson and Roshko 1988). Equivalent flow behavior is observed when the cylinder is pulled through a fluid at rest along a sinusoidal path with amplitude and wavelength , where is the constant cylinder speed in the direction of the path’s centerline, as illustrated in Fig. 1; this approach is, in fact, the one used by Williamson and Roshko 1988. In both cases, the velocity of the cylinder with respect to the background flow is given by
| (1) |
where and are the streamwise and transverse velocity components, respectively. This classic problem is relevant to a wide range of applications, including oil riser motion (Wu et al. 2012), aeroelastic stability (Zhang et al. 2017), wind turbines (Heinz et al. 2016), and small-scale energy harvesting (Antoine et al. 2016), among others.
The oscillating cylinder problem can be characterized by the following three dimensionless groups: the Reynolds number, , where is the kinematic viscosity of the fluid; the normalized oscillation amplitude ; and the frequency ratio . The natural frequency of vortex shedding from a single stationary cylinder, , is often expressed in terms of the Strouhal number, , which is an empirically known function of the Reynolds number (Williamson and Brown 1998, see, e.g.,). In some studies, the wavelength ratio, , or, equivalently, the reduced velocity, , is used instead of . Note that , so that for the wide range of Re over which St is approximately constant the parameters and can be used interchangeably; however, for , as considered here, the relationship between these parameters varies with the Reynolds number.
Two different methodologies have been used to investigate the flow-induced vibration of a circular cylinder submerged in a steady, uniform fluid flow. In the free vibrations approach, one considers the response of an elastically-mounted cylinder to the fluid forcing; see Williamson and Govardhan 2004 for a comprehensive review of these ‘Vortex-Induced Vibrations’ (VIV). The independent variable in these experiments is usually the reduced velocity , which relates the time scale of the cylinder’s oscillation, , to the convective time scale, . A key result of such studies is the maximum amplitude of motion experienced by the cylinder; in other words, free vibration studies often aim to determine the maximum amplitude of flow-induced vibration for a given system and the value(s) of the reduced velocity at which this maximum occurs. These parameters are of considerable practical importance.
The second approach to studying flow-induced vibrations, which was the one adopted for this study, is the controlled oscillations approach (Bishop and Hassan 1964; Williamson and Roshko 1988). In this approach, the cylinder is prescribed to move at particular values of frequency, , and amplitude, , for a specified inflow velocity, . Studies that use this approach are able to access as much of the frequency-amplitude parameter space as experimental (or computational) considerations allow, rather than being constrained by the frequency and amplitude response of a given system, which is typically not known in advance. By judiciously choosing the region of frequency-amplitude space to explore (i.e., frequencies that one wishes to suppress or hopes to excite), these studies serve as a laboratory for artificially-constructed ‘flow-induced’ vibrations. If the amplitude and frequency of a cylinder undergoing controlled oscillation are made to mimic the response of the same cylinder under free vibrations (at a certain reduced velocity), the two problems are commensurate, and one can provide insight into the other (Govardhan and Williamson 2000; Jiao and Wu 2018). Thus, controlled oscillations allow one to create ‘what-if’ scenarios of practical importance that may be difficult to test in the laboratory using free-vibration experiments.
Building on the seminal work of Bishop and Hassan 1964, Williamson and Roshko 1988 conducted an extensive, systematic study of flow past a circular cylinder undergoing controlled oscillations over a large range of and values for . They found that different exotic vortex patterns appear in the cylinder wake for distinct regions of the parameter space. In the fundamental synchronization region (i.e., for ), three main patterns were identified: 2S wakes, with two (single) vortices shed per cycle of oscillation; P+S wakes, with a pair of vortices and a single vortex shed per cycle; and 2P wakes, with two pairs of vortices shed per cycle of oscillation. This general organization of the parameter space was confirmed with a highly-resolved study by Morse and Williamson 2009 at , who identified an additional ‘2P overlap’ regime containing wakes with two pairs of very different strength vortices (a ‘weak 2P’ mode) that appeared intermittently with the typical 2P wake. Leontini et al. 2006 conducted a similar two-dimensional computational study for and found the primary synchronization region to be populated only by 2S and P+S wakes. The results of the two studies by Williamson and Roshko 1988 and Leontini et al. 2006 are summarized in figure 2(a,b).
One noticeable difference between the results in figure 2(a,b) is the presence of 2P mode wakes in the three-dimensional experiments at higher Re values. By forcing the flow to be planar, Leontini et al. 2006 appeared to completely suppress the occurrence of 2P wakes. Williamson and Roshko 1988 also noted that in their experiments the symmetry-breaking P+S mode was observed to replace the symmetric 2P mode for . It is generally accepted that the 2P mode wake is absent in low Reynolds number and/or two-dimensional wakes (see, e.g., low-Re experiments by Griffin and Ramberg 1974 and computations by Blackburn and Henderson 1999). However, Placzek et al. 2009 have described the appearance of a weak 2P mode for forced oscillations in a 2D computational model at , and Dorogi and Baranyi 2020 show a weak 2P mode occurring in a 2D computational model at under both forced and free oscillations. An illustration of the structure observed by Dorogi and Baranyi 2020 is shown in figure 2(c).

The forces experienced by isolated bodies undergoing flow-induced vibrations are largely caused by vortex shedding at the rear of the body and the subsequent organization of the shed vorticity in the wake. Thus, changes observed in the forces experienced by an immersed body have been attributed to changes in the presence, nature, intermittency, and magnitude of vortex shedding. Abrupt changes in the magnitude of oscillations experienced by a freely-vibrating cylinder while a controlling parameter is varied were first documented by Bishop and Hassan 1964. Williamson and Roshko 1988 provided preliminary evidence that this ‘jump’ in forcing may be related to a change from the 2S to the 2P mode of vortex shedding, a relationship that has been confirmed in free-vibration experiments with a flexibly-mounted circular cylinder in a wind tunnel (Brika and Laneville 1993) and in controlled-oscillation experiments with a rigid cylinder in a water tunnel (Morse and Williamson 2009). Thus, investigations of wake patterns, particularly regarding the appearance (or absence) of the 2P mode, are relevant for understanding and predicting the fluid forces on oscillating bluff bodies.
In this work, we extend previous studies by considering the wake patterns formed behind an oscillating cylinder in an experimental system at for the parameter ranges and . We restrict the flow to be (quasi) two-dimensional by conducting the experiments in a gravity-driven soap film. Our approach can be considered a complement to the 3D experimental work of Williamson and Roshko 1988 that facilitates comparison with the 2D computational study of Leontini et al. 2006. The region of parameter space examined here overlaps much of that explored by Williamson and Roshko 1988 and includes the entirety of the region explored by Leontini et al. 2006, as shown in figure 7.
Soap films have been used as a ‘laboratory’ for studying two-dimensional flows since their introduction by the seminal work of Couder (Couder et al. 1984; Couder and Basdevant 1986; Couder et al. 1989). The utility of soap film systems was enhanced by the introduction of the flowing film ‘tunnel’ by Gharib and Derango 1989. Vertical, gravity-driven soap films were first utilized by Kellay et al. 1995, and Georgiev and Vorobieff 2002 extended the available parameter space by designing an inclined flowing film system. Auliel et al. 2015 have shown that the equations describing the motion of a flowing soap film are analogous to the two-dimensional incompressible Navier–Stokes equations, provided that the Marangoni effect due to surface tension is small. A number of important hydrodynamics results have been shown or replicated in soap films, including those by Yang et al. 2001, who showed that the streamlines produced by steady flow over a backward-facing step correlate well with numerical simulations; Vorobieff and Ecke 1999, who found that the Strouhal-Reynolds number relationship for a stationary circular cylinder in a soap film corresponds well to the two-dimensional St-Re relationship for a circular cylinder in a viscous fluid; Wu et al. 2004, who determined that the time-varying angle of separation from a stationary circular cylinder agreed with results from a spectral numerical method; and Yang and Stremler 2019, who established experimental values of critical spacing between tandem cylinders and showed good agreement with two-dimensional simulations.
The remainder of the manuscript is organized as follows. In Section 2 we describe the soap film system and the cylinder oscillation mechanism, explain the flow visualization and velocity measurement techniques, and detail the method used to estimate the Reynolds number. Section 3 documents the results of our exploration of the parameter space, arranged according to the type of wake pattern observed. In this soap film system and over the range of parameters covered by this study, documented wake patterns include ‘2S’, weak and strong ‘2P’, ‘P+S’, ‘2T’, ‘transitional’, ‘coalescing’, and ‘perturbed von Kármán’ types. Finally, section 4 sets out the main physical insights and conclusions that can be drawn from this study regarding low-Reynolds number flows past transversely-oscillating circular cylinders.
2 Methods
The results presented in section 3 were obtained from experiments conducted in a flowing soap film channel that was developed following the design introduced by Georgiev and Vorobieff 2002 and informed by the work of Jia and Yin 2008 and Wang et al. 2010.
2.1 Soap film apparatus

Figure 3 shows a schematic of our inclined gravity-driven soap film system, which is identical to that used by Yang and Stremler 2019. To generate a flowing film, soap solution consisting of 1% (by volume) Dawn Escapes dish soap (Proctor & Gamble) mixed in water was first pumped to a top reservoir, consisting of an open plastic container held inside a larger, open, overflow container; the solution was continually pumped from the overflow into the main container to maintain a constant head in the reservoir throughout each experiment. A valve at the outlet of the reservoir provided control of the volumetric flow rate. A soap film was developed between two nylon guide wires (with diameter 1 mm) that were tensioned at the bottom of the system by a spring. The guide wires were separated using four horizontal nylon pull lines (with diameter 0.3 mm) to form a 58 cm long triangular expansion section, a 10 cm wide by 1 m long rectangular test section, and a 56 cm long triangular contraction section. The expansion section was inclined 57∘ from the horizontal axis, the test section had a 14∘ inclination angle, and the contraction section had a 68∘ inclination angle. The outline of the blue region in figure 3 shows the overall shape of the ‘channel’ to which the soap film was thus confined. We were able to vary the flow speed in the inclined soap film over the range . The inclination angle of 14∘ in the test section was the minimum angle for which out-of-plane displacement of the film (by gravity) was fully obscured by the nylon guide wires when viewed from the side. In this configuration the curvature of the film surface was approximately 0.4 m-1, which we consider to be negligible.
An acrylic rod with diameter mm was mounted on a plate oriented parallel to the test section of the soap film channel, so that the cylinder penetrated the soap film at a 90∘ angle. The cylinder was placed approximately 30 cm from the entrance of the rectangular test section. Wakes were imaged as described in section 2.2. For the oscillation experiments, cylinder motion was driven by a Scotch-yoke mechanism (see section 2.5).
The validity of using this soap film flow as an analog for the two-dimensional flow of a Newtonian fluid requires that the elastic Mach number, (Auliel et al. 2015), where is the Marangoni wave speed given by
The fluid density is , is the (average) thickness of the soap film, and is the Marangoni elasticity. The average flow speed for the experiments reported here was determined to be m/s (see Section 2.3). By mass conservation, this average flow speed corresponds to an average film thickness of m. Kim and Mandre 2017 have shown that for flowing soap film systems similar to the one used here, the Marangoni elasticity is mN/m, and we have assumed this value in our estimate of . Taking g/cm3, the Marangoni wave speed for these experiments is estimated to be m/s, which gives an elastic Mach number value of . We thus have for the experiments reported here, supporting the interpretation of these results as corresponding to those for a two-dimensional Newtonian flow.
2.2 Flow visualization and quantification
The wake patterns were documented by recording videos 8.2 seconds long at 170 frames per second for a total of 1400 frames per case, with each frame having an image resolution of 2352 600 pixels. During each recording, the flow speed , cylinder oscillation frequency , and cylinder oscillation amplitude were held fixed. A monochromatic light source positioned perpendicular to the experimental plane was used to illuminate the soap film, and the reflected patterns of light were recorded with a high-speed camera positioned near the light source. Three low-pressure sodium lamps (SOX 180, Philips; wavelength 590 nm), which were wired to each phase of an alternating current power source, provided monochromatic illumination of the soap film. The phase delay between the lamps produced a nearly constant light intensity; the small fluctuations in intensity had a frequency of 120Hz, as documented in Yang and Stremler 2019. The camera (Falcon 4M60, Teledyne DALSA) recorded the interference fringe patterns produced by the light source as it reflected off the top and the bottom surfaces of the soap film; the resultant changes in the scalar field of light intensity were caused by variations in the thickness field of the soap film. Figure 4(a) shows a sample of the flow visualizations obtained in our experiments.
The thickness variations enabling the flow visualization are produced by the flow physics, but these variations are not expected to influence the interpretation of the flow as being two-dimensional and incompressible. Wu et al. 2001 and Georgiev and Vorobieff 2002 have demonstrated that a flowing soap film without obstructions produces an approximately uniform film thickness throughout the test section. Eshraghi et al. 2021 showed that thickness variations in the wake of a fixed circular cylinder are less than approximately 25% of the average film thickness for . These thickness variations in the wake introduce a Boussinesq-type behavior, but the flow time scale is fast enough that buoyancy effects can be considered negligible (Auliel et al. 2015). Thus these thickness variations, while crucial for the flow visualization, do not play a significant role in the physics of the flow, which can be assumed to approximate that of an incompressible fluid (see Section 2.1).

The oscillation of the cylinder caused some time-dependent, spatially-varying, out-of-plane displacement of the film. For sufficiently high amplitudes of oscillation frequency and amplitude, this deformation of the film prevented reflected light from reaching the camera, leaving dark areas in the interferometry images (see Masroor et al. 2021). Using an end-on view of the film, we determined the maximum peak-to-peak out-of-plane displacement to be mm in the neighborhood of the cylinder for and . From these observations we estimated that the out-of-plane displacement in this system had a negligible effect on the wake dynamics in the regions of interest.
Quantification of the wake frequencies was accomplished by examining the spatially-averaged, time-dependent pixel intensity (with value ) from a limited portion of the imaged flow. The interrogation window used for quantifying the fixed cylinder wakes, for example, was the rectangular domain measuring 1 pixel wide (in the streamwise direction) by 49 pixels high (in the transverse direction) shown as a white rectangle in figure 4(a). An example time trace of is shown in figure 4(b). Variations in the wake that occurred on a time scale s corresponded to flow features with a length scale of m, which was approximately the distance from the cylinder to the exit of the rectangular test section. We thus applied a low-pass filter to the data in every case to exclude frequencies less than 1 Hz. A Fast Fourier Transform (FFT) of the filtered data was then performed using MATLAB (MathWorks) to determine the corresponding power spectrum, such as shown in figure 4(c). Every FFT in this manuscript was applied to the low-pass-filtered data taken from a specific interrogation window using the full experimental run, s, for that case.
2.3 Determining background flow speed
The undisturbed background flow speed of the soap film was measured directly using Particle Tracking Velocimetry (PTV). For these measurements, the soap film solution was seeded during preparation with 10 m-diameter hollow glass spheres, and these spheres were illuminated in the film with an Elinchrom modeling lamp (EL23006). Representative particles were identified in successive video frames using the Image Processing Toolbox in MATLAB (Mathworks). Flow speed was calculated as the average distance traveled by these particles per unit time.
We found that the seeding particles interfered with the interferometry flow visualization, making it impractical to directly measure the flow speed when conducting the oscillation experiments. We thus correlated flow speed with the vortex shedding frequency for a stationary cylinder with diameter mm in our specific study. Multiple trials were conducted at various flow speeds in the range , with videos of the wake patterns recorded as described in section 2.2. The vortex shedding frequency, , was identified here as the primary peak in the FFT data, as described in section 2.2. This approach to determining was validated through direct, manual calculations of vortex shedding frequency in a few select cases. The resulting relationship between and observed for this system is shown in figure 5 with taken as the dependent variable, which can be represented by the linear fit
| (2) |
with correlation coefficient . Although this relationship is expected to be a function of channel inclination angle, channel aspect ratio, and soap solution composition, these parameters were held fixed for all of the experiments used in this study, and thus this relationship was assumed to hold for all cases presented here.
For the oscillation experiments, the background flow speed was estimated by first determining the shedding frequency with the cylinder held stationary and then using the relationship in (2). Flow speed was adjusted via the flow control valve to obtain a (fixed cylinder) shedding frequency for each consecutive set of experimental runs in the range . Several successive video recordings were analyzed to determine a precise value of for each set of runs. The average shedding frequency for all experimental runs was Hz, which by equation (2) corresponds to an average flow speed of m/s.
2.4 Determining the Reynolds number
The standard approach to calculating Reynolds number requires an accurate value for the fluid viscosity. In a flowing soap film, the viscosity value depends strongly on the thickness of the film; Trapeznikov 1957 has shown that the viscosity of a soap film can be represented as , where is the bulk viscosity of water, is the viscosity of the surfactant-dominated free-surface layers, and is the thickness of the film (Vorobieff and Ecke 1999, see also). For the very thin films generated in soap film experiments, the thickness is difficult to measure precisely but plays an important role in determining viscosity.
Gharib and Derango 1989 were the first to suggest that the Reynolds number for the flow past a cylinder in a flowing soap film could be estimated by observing the Strouhal number and then estimating the Reynolds number using the empirically-known relationship between Re and St. This indirect approach to determining the Reynolds number for flow past a circular cylinder in a flowing soap film has since been used by several investigators; see, e.g., Vorobieff and Ecke 1999, Wen and Lin 2001, Jia et al. 2007, and Wang et al. 2010. We followed this approach for estimating the Reynolds number in our system. We first used the observed vortex-shedding frequency, , the corresponding flow speed of the soap film from (2), and the cylinder’s diameter to calculate the Strouhal number, . We then used the St-Re relationship from Williamson and Brown 1998,
| (3) |
to determine the Reynolds number. The range of vortex-shedding frequencies observed in our experiments corresponds to an average Reynolds number of .
2.5 Cylinder oscillation
As noted above, an acrylic rod with diameter mm was mounted on a plate oriented parallel to the test section of the soap film channel, so that the cylinder penetrated the soap film at a 90∘ angle. For the oscillation experiments, the plate was attached to the shaft of a motor via a Scotch-yoke mechanism that converted the circular motion of the shaft to sinusoidal translation of the cylinder. The plate and motor were mounted to a vibration-isolation table, and care was taken to ensure that the frame supporting the soap film did not come into contact with the motor mount or the vibration-isolation table.
The cylinder’s oscillation frequency, , was verified using image analysis of the recorded videos as described in section 2.2. We extracted from each video frame a small spatial region (150 600 pixels) within which the motion of the cylinder was contained, as shown in figure 6(a). A Hough transform was performed on this frame region to track the position of the cylinder, giving a time trace of the cylinder such as illustrated by the solid circles in figure 6(b). We then used a Fast Fourier Transform (FFT) on this time series to extract a power spectrum, which in every case had a single well-defined peak at the oscillation frequency like that shown in figure 6(c).

The frequency-amplitude values used for the experiments reported here are shown in figure 7. The amplitude of the cylinder’s oscillation was determined by the offset of the cylinder’s axis from the axis of the motor’s rotation, which for a given Scotch yoke mechanism is fixed. Therefore, we varied the amplitude of oscillation by fabricating yokes with different eccentricities, for a total of thirteen different amplitudes 1.0 mm, 1.5 mm, 2.0 mm, 2.5 mm, 3.0 mm, 3.5 mm, 4.0 mm, 4.5 mm, 5.0 mm, 5.5 mm, 6.0 mm, 7.0 mm, 8.0 mm. The frequency of oscillation was varied along a continuum for each amplitude by varying the amount of power provided to the motor from case to case. In these experiments, the frequency of oscillation was kept in the range to avoid the out-of-plane vibrations of the soap film that interfered with the interferometry when exciting at high frequencies, especially at large amplitudes. The relationship between our experiments and the region of parameter space explored by previous studies is also shown in figure 7. Note that the comparison with the parameter space studied by Williamson and Roshko 1988 is only approximate, since they report results in terms of the reduced velocity and the Strouhal number varies with Reynolds number for this data.
The position of the cylinder in its motion can be characterized by a dimensionless time, . We chose to define when the cylinder was located at the centerline of its motion and moving in the downstroke. Throughout this manuscript we restrict and use this variable to represent the relative position of the cylinder in its cycle.
2.6 A note on cylinder diameter
The cylinder was surrounded by a meniscus at the cross-section where it intersected with the soap film, and this meniscus moved with the cylinder as it oscillated. Couder and Basdevant 1986 proposed calculating an effective diameter of the cylinder in such a case by comparing the vortex shedding of the fixed cylinder with that of a thin fixed disk aligned with the plane of the film. The resulting (larger) effective diameter is then used in place of the physical diameter in all calculations.
We estimated an effective diameter for our system using the following procedure. We conducted fixed cylinder wake experiments using a very thin circular disk made from clear polyester film (McMaster–Carr, USA) with diameter mm and thickness m. The disk was held in the plane of the film by surface tension. Since the disk thickness was close to the film thickness, the meniscus effect was assumed to be negligible. Using the St–Re relationship from (3), the effective viscosity was estimated to be mm2/s. The relationships between , , St and Re then give a non-linear system of equations for the unknown effective diameter, , which we solved using an iterative process to find mm.
Replacing the cylinder diameter, mm, in our calculations with the effective diameter, mm, increases the estimated Reynolds number and decreases the dimensionless oscillation amplitude, . This change does not affect the interpretation of our results, except as it impacts direct comparisons with the results of others. Since our experimental parameters are not an exact match with any other work, and since there is some subjectivity in the interpretation of the effective diameter, particularly for a moving cylinder, we have chosen to report all results in terms of the physical cylinder diameter, .
3 Results
Over a large portion of the parameter space explored in this study, coherent vortices formed in the wake of an oscillating cylinder in patterns that were observed to repeat periodically and synchronously with the cylinder motion. In figure 8 we show the regions of parameter space where we observed the same vortex shedding patterns to occur consistently. We follow the terminology of Williamson and Roshko 1988 and Williamson and Jauvtis 2004 by denoting a single vortex with ‘S’, a pair of vortices with ‘P’, and a triplet of vortices with ‘T’. The frequency axis decreases from left to right in accordance with the convention used in the literature for controlled-oscillation experiments and simulations.
The boundaries shown in figure 8 do not mark abrupt changes in the wake structure. Rather, they denote the approximate locations of “transition zones” over which the wake structure transitions from one type to another. We speculate that this smooth shift in wake type is related to the topological bifurcation that occurs as the wake of a stationary cylinder transitions from a time-periodic wake to the von Kármán vortex street (Heil et al. 2017).
The primary synchronization region — in the neighborhood of — was found to be dominated by 2S wakes at low amplitudes and 2P wakes at higher amplitudes. For the mid-range amplitudes in the regime identified as ‘(weak) 2P’, one vortex in each pair is considerably weaker than its partner. As described in section 3.2, the weak 2P mode is not clearly distinct from the 2S mode, and the approximate boundary between these two regimes is shown as a hatched region in figure 8. At the high frequencies and small amplitudes in the coalescing (clsc) region, multiple vortices are shed from the cylinder per oscillation, and these vortices quickly merge to form a secondary street. At high frequencies and large amplitudes (i.e., the empty upper-left portion of figure 8), out-of-plane vibrations in the soap film interfered with visualization of the wake structure, so this region was excluded from our analysis. The edges of this region are dictated by limitations in our experimental capabilities, not a known change in wake structure, so this region is bounded by dashed lines. At low frequencies and small amplitudes, the 2S and (weak) 2P structures transition to what we refer to as a ‘perturbed von Kármán’ (pvK) wake, in which the vortex formation is not locked on to the cylinder’s motion; the pvK pattern does not appear to be discussed in the existing literature. Finally, for large amplitudes and decreasing frequencies, the wake patterns consisted progressively of a transitional mode in which complex or unclear wake structures were observed, a ‘2T’ mode with two triplets of vortices shed during each cycle of the cylinder’s motion, and the pvK mode. More highly resolved data would be needed to resolve the tr-2T boundary more accurately, and thus we show this approximate boundary as a dotted line. No data were collected below the dashed line at . The extension of the 2S region’s boundaries to is based on the fact that a stationary cylinder will shed vortices only at and the assumption that in our system a small amplitude oscillation will produce vortex shedding with . This extension is similar to that of Leontini et al. 2006; see figure 2(b). However, this extension is purely speculative, and in a three-dimensional system a critical oscillation amplitude of is needed to achieve ‘lock on’ (Koopmann 1967). In the following sections, representative examples are discussed from each region of space identified in figure 8. The experimental videos for each of the twenty examples enumerated in figure 8 and discussed below are documented in Masroor et al. 2021.
At any given amplitude of oscillation, the wake wavelength was found to decrease with increasing oscillation frequency. This dependence of wake wavelength on cylinder oscillation frequency is broadly consistent with the observations of Griffin and Votaw 1972, and a comparison for is shown in figure 9. The good agreement that is shown despite the differences in Reynolds number and experimental method supports the validity of using a flowing soap film system for quantitative descriptions of two-dimensional wakes.
3.1 2S mode

The low-amplitude region of parameter space at oscillation frequencies close to the natural frequency of vortex shedding was found to be populated by synchronized 2S wakes, in which two vortices of equal and oppositely-signed strengths are formed from the vorticity shed during each half-cycle of cylinder motion. The clockwise vortex is shed during the cylinder’s upstroke (for left-to-right flow), and the counter-clockwise vortex is formed from vorticity shed during the downstroke. Three example cases, for the parameter values labeled I–III in figure 8, are shown in figure 10. Synchronized 2S wakes such as these have been widely reported to be observed in the vicinity of the low-amplitude primary resonance in studies of both controlled (Williamson and Roshko 1988; Govardhan and Williamson 2000; Leontini et al. 2006) and free oscillations (Khalak and Williamson 1999). Typically, the power spectra from these wakes are strongest at the oscillation frequency despite the low amplitude of oscillation, which suggests that these wakes are strongly locked-on to the cylinder oscillation. These power spectra, such as shown in figure 10(c), were determined for our examples by taking an FFT of the average image intensity in a 1 150 pixel rectangle located a distance downstream of the cylinder (see figure 10(b)); thus, the cylinder oscillation frequency can appear in the power spectra only through its influence on the cylinder wake.
The synchronized 2S mode of vortex shedding in the wake of an oscillating cylinder is physically quite distinct from what is known as the von Kármán mode of vortex shedding in the wake of a fixed cylinder. Although the resulting flow looks quite similar (compare figure 10(b) with figure 4), the 2S mode occurs due to an interplay between the motion of the cylinder and the motion of the fluid, with the cylinder’s motion causing the shear layers from each side of the cylinder to roll up into exactly two counter-rotating eddies during each period of the cylinder’s motion. In the von Kármán wake, there is no motion of the cylinder, and the shear layers independently arrange themselves into a series of counter-rotating eddies at the Strouhal frequency. In other words, the fixed-cylinder vortex wake formation is a ‘shear layer instability’ phenomenon (Heil et al. 2017), while the 2S wake of an oscillating cylinder relies also on a ‘resonance’ phenomenon.
Some variation in the detailed structure of the near wake was observed within the region labeled 2S. When and was low (see, for example, case I in figure 10), the clockwise and counterclockwise shear layers from the top and bottom of the cylinder rolled up discretely into single vortices of opposite sense, resulting in a ‘clean’ structure in the far wake that strongly resembles the von Kármán street. Increasing the amplitude (e.g., case II) and also reducing the oscillation frequency (e.g., case III) resulted in each shear layer splitting into a weak and a strong vortex of opposite sense, giving two oppositely-signed pairs of vortices in the near wake for each period of oscillation. However, in the 2S region of figure 8, this appearance of a weak 2P structure immediately after the cylinder was short-lived, and within two periods of motion the wake assumed a clear 2S structure. This near-wake behavior appears to be consistent with that shown in corresponding 2D computational results (Leontini et al. 2006, figure 7), in which each newly-shed vortex had a weak ‘tail’ that was not counted when classifying the wake. In section 3.2 we show that a modified form of this same process was responsible for the formation of 2P wakes.
3.2 2P mode
The largest portion of the primary synchronization region was found to exhibit the 2P mode of vortex shedding, in which two pairs of oppositely-signed vortices were shed per oscillation cycle. This wake mode was observed primarily in the high-amplitude range () of the primary synchronization region (), which is similar to the results reported by Williamson and Roshko 1988 for . In contrast, Leontini et al. 2006 did not find any 2P wakes in their two-dimensional computations. Two main types of 2P wake were identified in our experiments: a ‘weak 2P’ mode and a ‘strong 2P’ mode that are distinguished primarily by the structure and relative strength of the pairs in the mid- and far- wake. A similar weak 2P mode has been identified in other studies (Morse and Williamson 2009, see, e.g., the mode in figure 4 of) when spatially-resolved data in the near wake have been available.
3.2.1 Weak 2P mode

A ‘weak 2P’ mode was observed in the low-frequency, mid-amplitude region of the parameter space, as shown in figure 8. Three examples of these weak 2P wakes are shown in figure 11. Four coherent vortex structures are shed during each cylinder oscillation cycle. The weaker, secondary vortices survive the roll-up process to a greater extent than in the 2S region, leading to a mid- and far-wake structure that differs from the von Kármán street. Each secondary vortex, although shed as its own coherent structure, is significantly strained by the stronger neighboring vortices as it moves to a location mid-way between these successive strong vortices.
As described at the beginning of section 3, changes between regimes occur continuously over a (narrow) range of parameter space rather than abruptly at a distinct point. For the transition between the 2S and weak 2P modes, this change occurs over a broader range of parameter space than for the other transitions. A certain subjectivity in the distinction between the 2S mode and the low-amplitude weak 2P mode, therefore, is unavoidable, and we have denoted our estimate of the boundary between these two regions by a hatched region in figure 8.
The weak 2P region shows a significant degree of variation in the wake details across the corresponding region of parameter space. The far-wake structure for case IV — which is close to the boundary with the 2S region — is not very different from that of case III (see figure 10). At higher amplitudes and lower frequencies, placing the system farther away from the 2S region of parameter space, a more distinct ‘weak 2P’ structure emerges in the far wake, with the weaker member of the pair persisting for longer convective times (compare cases V and VI with case IV). However, in all parts of the weak 2P region the weaker vortex does eventually distort into a braid shear layer between successive strong vortices, with the process happening further downstream with greater distance (in parameter space) from the 2S region. The fact that this persistence of the weak vortices increases with decreasing frequency suggests that the transition from 2S to weak 2P wakes is a result of the slower transverse motion of the cylinder, which produces a greater distance between successive strong vortices and reduces their inductive effect on the weak vortices.
3.2.2 Strong 2P mode

The second type of 2P wake — which we refer to as the ‘strong 2P’ mode — occurs at higher amplitudes and oscillation frequencies relative to the weak 2P mode, as shown in figure 8. We identify this mode as distinct from the weak 2P mode because the wake structure in this strong mode consists clearly of vortex pairs well into the far wake region, as shown in figure 12 for three representative examples. The vortices in each pair were of noticeably unequal strength throughout the entire parameter space, even in this strong 2P region. However, in the strong 2P mode the strength of the weaker vortex and its distance from the paired stronger vortex remain large enough to prevent the weaker vortex from being strained into a braid shear layer in the mid-wake region.
The relative motion of vortices in each of cases VII and IX is reminiscent of the ‘orbiting’ and ‘exchanging’ modes identified by Basu and Stremler 2015 in the motion of two pairs of point vortices with glide-reflective symmetry in a periodic strip. Due to the near-periodicity of the 2P wake (in most cases), the relative vortex positions in successive downstream pairs can be interpreted as representing the stroboscopic time evolution of a single pair. In case VII, the weaker vortex of each pair orbits the stronger vortex for less than one full revolution when it appears to exchange partners with the strong vortex in the neighboring (downstream) pair just as it leaves the frame, giving rise to relative vortex motion in an ‘exchanging’ mode. In case IX, the weaker vortex orbits the stronger vortex and remains in close proximity to its original partner throughout the visible wake, showing behavior in an ‘orbiting’ mode. This progression from an exchanging mode to an orbiting mode for increasing with is consistent with the relative vortex strengths in each pair becoming more similar as the oscillation amplitude is increased.
3.2.3 2P wake formation

In order to better understand the process of vortex shedding in the strong 2P mode, which dominated the primary synchronization region in our experiments, nine successive video frames of the cylinder and its near wake were analyzed for an oscillation amplitude mm ( and frequency Hz. For this case, , giving . The point is marked by a filled square in figure 8. Additional processing to highlight the flow structure gives the images shown in figure 13, which the reader is encouraged to compare with figure 11 of Williamson and Roshko 1988.
The nine frames capture approximately one full cycle of the cylinder’s motion, comprising one period of the sine curve traced by the cylinder in a frame moving with the free stream, as illustrated in figure 13 (top panel). Due to a parallax effect, the top of the cylinder, which appears clearly in the images, does not coincide with the location at which the circular cross-section intersects the soap film; a solid circle has been added in each frame to mark this location. The periodic nature of vortex shedding can be verified by the similarity between frames 1 and 9, which are at approximately the same phase of the cyclic motion. Each vortex is identified by an alphanumeric label, with syntax chosen to mirror that in Williamson and Roshko 1988.
Figure 13 shows the cylinder starting near the beginning of its downstroke. Vortex has already been formed, while vortex is observed shedding and forming over the first two frames as the cylinder moves downward. Then, under the influence of its stronger neighboring vortex , vortex is rapidly pulled away from the cylinder between the second and third frames. Thus paired together, these two vortices subsequently convect away from the cylinder without much relative motion.
The shedding and convecting away of the counterclockwise vortex relatively early in the cylinder downstroke allows enough time for another counterclockwise region of vorticity to develop on the cylinder’s edge during the remainder of the downstroke; the beginnings of this development can be seen at time . This new vortex, labeled , is then shed from the cylinder not due to the induction of a neighboring vortex (as was ) but due to the ‘jerk’ of the cylinder during the turning point in its sinusoidal motion, which occurs between the fourth and fifth frames. In later frames, it can be seen that is a much stronger counterclockwise vortex than , and these two vortices remain connected to each other via a braid shear layer with like-signed vorticity owing to them being shed during the same downstroke.
During the cylinder’s upstroke, clockwise vorticity is shed. The incipient clockwise vorticity (labeled ) can already be seen developing in the third frame as the cylinder’s downward motion slows, but remains attached to the cylinder until the fifth frame. Vortex is shed at some point between the fifth and sixth frames. This vortex is relatively weak and appears to have been ‘prematurely’ pulled away from the cylinder under the influence of its larger counterclockwise neighbor . Then, in the remainder of the cylinder’s upstroke, clockwise vorticity continues to develop along its top edge and remains connected to via a braid shear layer. Once again, the stronger vortex is shed not under the influence of a neighboring vortex, but due to the ‘jerk’ of the cylinder, now in the opposite direction. This cylinder motion results in being a relatively strong counterclockwise vortex, analogous to the clockwise vortex . As the cylinder executes its downward stroke, is once again positioned to draw away the counterclockwise vorticity, which can be seen developing in the ninth frame, labeled , exactly analogous to in the first frame.
These observations show that counterclockwise vorticity is mostly generated during the downstroke, while clockwise vorticity is mostly generated during the upstroke. At each turning point, the ‘jerk’ causes a strong vortex to be shed, which goes on to become the larger vortex in each pair comprising the 2P vortex street. A corresponding smaller vortex is shed during roughly the first half of each stroke, and this weak vortex rapidly convects away from the cylinder under the influence of the stronger neighbor shed just previously.
3.3 P+S mode
A ‘P+S’ mode, in which three vortices are shed per oscillation cycle, was observed at high oscillation frequencies and moderately high amplitudes of oscillation. Two representative examples of P+S wakes are shown in figure 14. The vortices that formed in the P+S mode were observed to be quite sensitive to perturbations and would often become significantly distorted in the mid- to far- wake; see, e.g., case XI in figure 14. The near-wake regions show that the pair of vortices shed from one side of the cylinder often had ‘stray’ concentrations of vorticity manifested as “cat’s eye” shear layers or even small individual vortices. This additional vorticity tended to have a noticeable effect on wake periodicity and stability, as illustrated by the presence of multiple incommensurate peaks in the power spectrum for case XI in figure 14(c). In general, the P+S wakes observed in these experiments were not as regular as the 2P wakes and, in contrast to the 2S and 2P mode wakes, the power spectrum for case XI is not dominated by the oscillation frequency.


The P+S wake formation process for case X is illustrated in figure 15 over one period of cylinder motion. The similarities between frames 1 and 8 clearly shows the (near) periodicity of the shedding process in this case and allows one to view frame 1 as a continuation of frame 7. For the sequence shown here, the first coherent vortex, with counterclockwise rotation, appears to have formed between times and , either during the turning point of the downstroke or early in the upstroke. A weak clockwise vortex was shed very quickly thereafter, between and . A second, much stronger clockwise vortex began forming during the second half of the upstroke and was shed around at the turning point of the upstroke. These two vortices merged into one clockwise vortex within one period, as can be seen in the progression from to or (by making use of the periodicity of the shedding process), and then to . The final counterclockwise vortex (of the period) was shed during the first half of the downstroke (see frames 6–7); the proximity of this vortex to the strong clockwise vortex led to these two vortices moving into the wake as a pair.
As figure 8 shows, the P+S region of the parameter space manifested itself in our experiments as a narrow horizontal band in the high-frequency, mid-amplitude range of the plane. This range of parameter space corresponds roughly to a portion of the coalescing P+S mode in Williamson and Roshko 1988 and a portion of the unlabeled region in Leontini et al. 2006. The irregular behavior of the P+S mode in our system thus bears some resemblance to prior results.
We speculate that the P+S wake region of parameter space for an oscillating cylinder in a soap film extends into the high-frequency, high-amplitude region of the plane that we were not able to explore. If this region of parameter space does indeed consist of P+S mode wakes, it would increase the similarities between our results and those of Williamson and Roshko 1988 and Leontini et al. 2006. It should be possible to modify the inclined soap film channel to access this region of parameter space. However, in the interest of keeping as many experimental variables constant as possible (e.g., angle of inclination, soap solution composition, diameter of the cylinder, approximate average speed of the soap solution, length and width of the test section) across as much of the space as possible, we have not pursued such modifications in this work.
3.4 2T mode

Another synchronized pattern of vortex-shedding was observed for the region of parameter space labeled ‘2T’ in figure 8, in which six vortices were shed during each cycle of the cylinder’s oscillation. As shown for two examples in figure 16, these six vortices organized into two groups of three vortices each. As the vortices moved into the far wake region their structure became noticeably distorted, yet they still maintained a clear ‘2T’ pattern consisting of two sets of vortex triplets. The dominant frequency in the power spectra, shown in figure 16(c), was again the oscillation frequency of the cylinder, showing a wake structure that was synchronized with the cylinder motion.

Panels numbered 1–12 in figure 17 show the formation of vortices during one half-cycle of the cylinder’s motion for case XIII, comprising 7 frames of the upstroke and 5 frames of the downstroke. In the first frame, the triplet formed in the previous half-cycle can be seen, and in frames 2–4 this triplet moves downstream away from the cylinder while the counter-clockwise vortex labeled develops on the lower surface. As the cylinder decelerates to a complete stop and turns around in frames 5 through 8, remains attached while a clockwise vortex, labeled , rolls up on the upper surface of the cylinder and progressively strengthens. By frame 8, when the cylinder has begun the downstroke, has become strong enough to distort , which in frame 9 has been pinched off into a weak counter-clockwise vortex labeled that rapidly ejects away from the cylinder. As the cylinder accelerates downward, slowly detaches from the cylinder while the attached remainder of rolls up into another counter-clockwise vortex, labeled . By frame 12, the triplet comprised of can be clearly seen.
Panels labeled 13–16 in figure 17 were selected from the remaining half-cycle of the cylinder’s motion to show the glide-reflective symmetry of this mode. Frame 13 is approximately a ‘mirror image’ of frame 3, frame 14 of frame 6, and frame 15 of frame 8; frame 16 is nearly identical to frame 1. The vortices in frame 13–15 have been labeled with a prime to indicate that they are analogous to the previously-seen vortices (albeit with opposite sign). For example, between frames 14 and 15, clockwise vortex begins to stretch and split into two, similar to the way counterclockwise vortex stretches and splits into two between frames 6 and 8.
This vortex formation process for the 2T wakes appears to be quite regular, and it is our observation that the irregularity of the far wake in the 2T region — compare, e.g., figure 16 with figure 12 — was caused not by aperiodicity in the vortex shedding but by sensitivity of the subsequent vortex arrangements to disturbances in the flow.
This type of high-amplitude synchronized mode, in which a triplet of vortices forms from the vorticity shed during each half-cycle of cylinder motion, was first observed in experiments with a circular cylinder that was flexibly mounted and allowed to oscillate in both the streamwise and transverse directions (Williamson and Jauvtis 2004). The same mode of vortex-shedding has been observed in three-dimensional computations of the flow over a cylinder undergoing controlled ‘figure-8’ motion oscillations including both streamwise and transverse oscillation (Huang and Larsen 2010). Our results show that in-line movement of the cylinder is not necessary for the appearance of the 2T mode, at least for this soap film system. Leontini et al. 2006 did not include in their study the region of parameter space for which we observed the 2T mode (); it is possible that the 2T mode would be found in low-Reynolds number two-dimensional Navier-Stokes computations for .
3.5 Transitional (tr) mode
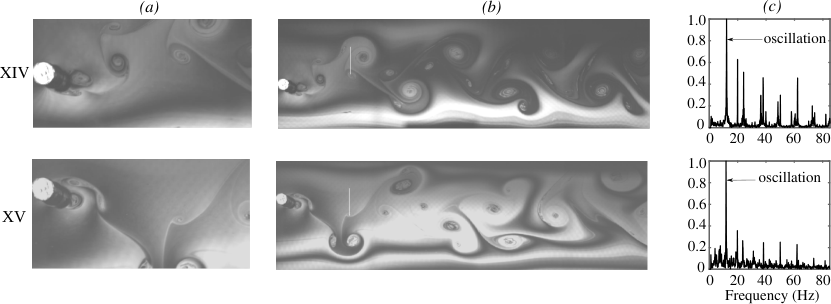
A portion of the primary synchronization region is marked ‘transitional’ in figure 8, representing a transition from the synchronized 2T mode to the synchronized 2P mode as the oscillation frequency was increased. This transition regime consisted of synchronous vortex shedding with complex and often asynchronous wake structure. Two examples of transitional wakes are shown in figure 18. The power spectra in the transitional regime continued to be dominated by the cylinder oscillation frequency, leading us to classify these wakes as ‘synchronized’ despite the typical lack of coherence in the resulting wake structure.
In some cases, intermittent loss of lock-on was observed during the course of a single (8.2-seconds-long) experiment: for short periods of time, vortex shedding would occur clearly synchronized with the cylinder’s motion, but this lock-on would be lost after irregular periods, leading to an overall incoherent wake structure. Case XV in figure 18 is an example of such a result: the near wake contains a clear vortex pair shed in the most recent cycle, but in the mid-wake there are several haphazardly-arranged vortices from the previous few cycles. This example shows that, although vortex shedding did occur in correlation with the cylinder’s motion, it was not necessarily periodic, with different numbers of vortices being shed during various cycles of the cylinder’s motion.
In other cases, we observed what appear to be other modes of synchronization, such as periodic vortex shedding that does not fit the descriptions of modes 2S, P+S, 2P or 2T; see, e.g., case XIV in figure 18. However, these modes were either temporally short-lived — i.e., consistent wake structure was not sustained for an extended period of time — or they did not persist over a large enough range of the frequency-amplitude space to be properly identified with our limited resolution in space.
It is likely that a closer examination of the transitional region with small increments in oscillation frequency will show clearly defined synchronization regions corresponding to commensurate ratios of . Schnipper et al. 2009 found periodically repeating vortex patterns in the wake of an oscillating airfoil at low Reynolds numbers with up to 16 vortices per period. Such high-order synchronization modes have yet to be observed in the wakes of transversely-oscillating cylinders.
3.6 Coalescing (clsc) mode


The low-amplitude (, high-frequency () region of figure 8 was dominated by a ‘coalescing’ mode of vortex shedding. As illustrated for two example cases in figure 19, this regime is characterized by multiple vortices being shed in each oscillation cycle with no discernible consistency in the near-wake patterns. In contrast to every regime considered thus far, the oscillation frequency does not dominate the power spectra, showing that these wakes are not synchronized with the cylinder motion.
A representative temporal sequence over approximately 1.5 oscillation cycles of case XVII is shown in figure 20. The lack of synchronization between the cylinder motion and the initial wake structure can be seen by comparing panels 3 and 10, which occur at approximately the same relative time in the cylinder’s motion ( and , approximately one full period later). After some complicated inter-vortex motions in the near-wake, the vortices then coalesced together into a ‘2S-like’ arrangement, with multiple individual vortices combining to form each element of the newly-formed vortex street. This amalgamation of many small vortices into large vortices was also reported by Williamson and Roshko 1988 in the low-amplitude, high-frequency region of the parameter space. The coalescence of small vortices into a new ‘vortex street’-like arrangement downstream may occur due to the same processes that lead to the well-known breakdown of the von Kármán street and its subsequent reorganization into a ‘secondary vortex street’ (see, for example, Kumar and Mittal 2012).
The coalescing mode of vortex shedding exhibits both disorder — in the rapid shedding of multiple vortices into the near wake in each oscillation cycle — and order, in the later reorganization of those vortices into a (relatively) regular vortex street. A von Kármán-like wake was the most commonly observed structure for the coalesced wakes, but the structure was also observed to vary with time. In case XVI, for example, the merged vortices formed a very consistent 2S-like far wake. Despite this coalesced structure not emerging until downstream of the interrogation window, the power spectrum for case XVI in figure 19(c) shows a strong peak at the frequency of the far wake, which is lower than both and . For case XVII, in contrast, the merged vortices cluster into various patterns that vary with time; the instant shown in figure 19(b) suggests the vortices were arranging into a pattern that is more ‘2T-like’ than ‘2S-like’. This lack of a consistent wake pattern is reflected in the power spectra being dominated by and for case XVII.
3.7 Perturbed von Kármán (pvK) mode

At extremely low oscillation frequencies, the wake does not synchronize with the motion of the cylinder; the transverse motion is too slow to affect the vortex shedding, which remains independent of the cylinder’s motion. Instead, vortex shedding continues to occur at its natural frequency and does not synchronize with the cylinder’s motion. As shown by the three examples in figure 21, the wake structure resembles that of a fixed cylinder but superimposed along a sinusoidal ‘centerline’ caused by the cylinder’s motion. We thus refer to these wakes as being in a ‘perturbed von Kármán’ (pvK) mode. The organization of these vortices into distinct patterns in the far wake is the result of post-shedding vortex dynamics, rather than the interplay between cylinder motion and vortex shedding, as was the case with the synchronized modes discussed earlier. In the pvK region of parameter space labeled in figure 8, the peak in the power spectrum associated with the Strouhal frequency ( Hz) is comparable to the peak occurring at the oscillation frequency, as can be seen in figure 21(c).
Although the perturbed von Kármán mode can look similar to the 2S mode at low amplitudes, there is a crucial difference between these modes. In the 2S mode, clockwise vortices are only shed during the upstroke and counterclockwise ones only during the downstroke; in the perturbed von Kármán mode, vortices of either sign are shed during any part of the cylinder’s cycle. At these low amplitudes, the power spectra of wakes in the (unsynchronized) pvK mode exhibit stronger peaks at the shedding frequency than at the oscillation frequency (see figure 21(c) panels XVIII and XIX), in contradistinction to wakes in the synchronized modes, whose spectra always have a stronger peak at the oscillation frequency. In particular, this criterion was used to classify wakes as pvK as opposed to 2S in cases where the two are visually similar (compare figure 21 XVIII (b) with figure 10 I (b)).
At high amplitudes, the window in which the perturbed von Kármán mode occurs shifts further toward the low-frequency edge of the parameter space, but it still exists; cases XVII and XVIII represent experiments at and , respectively. The resulting wakes shown in figure 21 can be interpreted as long-wavelength, high-amplitude sinusoidal perturbations of a double row of counter-rotating vortices. At these high amplitudes in the pvK mode, the peak at the shedding frequency is not necessarily stronger than that at the oscillation frequency, but the wake is visually identifiable as a ‘sinusoidally perturbed’ von Kármán street in which the vortex shedding occurs at rather than at the oscillation frequency.
The infinite counter-rotating double row of point vortices in an ideal fluid is known to be unstable to large-amplitude sinusoidal disturbances. However, the growth rate of disturbances decreases with increasing wavelength (Aref 1995), which implies that the Kármán street is least unstable to the longest-wavelength disturbances. Therefore, we believe that the persistence and repeatability of the perturbed von Kármán mode is due to the low growth rate of sinusoidal disturbances when the wavelength is large relative to the distance between successive vortices. At these low growth rates, the time scale of the break-up of the vortex street is much longer than the convective time scale, allowing the vortices to be swept downstream long before the instability can set in.
4 Conclusions
We have presented results for the wake structure of a circular cylinder undergoing controlled transverse oscillations with normalized amplitudes in the range and normalized frequencies in the range at in a flowing soap film. This Reynolds number value complements previous experimental results (Williamson and Roshko 1988) and facilitates comparisons with computational results (Leontini et al. 2006). An unconstrained wake is likely to develop three-dimensional features at this value of Re (Williamson 1996a; Leweke and Williamson 1998), but at a two-dimensional analysis remains physically relevant (Leontini et al. 2006). The ranges for and were chosen to focus on the primary synchronization region, which is of significant interest owing to its connection with the phenomenon of vortex-induced vibrations in freely-oscillating bluff bodies.
Our results show the wake of a circular cylinder in a soap film being ‘locked-on’ to the cylinder’s motion over a significant portion of the explored space. Lock-in leads to a variety of synchronized patterns of coherent vortices in the wake. For and , the wakes synchronized to a 2S mode, with a wake frequency corresponding to the cylinder oscillation, not the vortex shedding frequency for the corresponding fixed cylinder (i.e., not ). Increasing the amplitude to with led to the production of 2P wakes. For the lower amplitudes and frequencies in this range, the secondary vortex in each pair was quite weak (in the ‘weak 2P’ region), and the boundary between the 2S and weak 2P structures is highly subjective. The remainder of the 2P regime gave a clear two-pair structure per shedding cycle, and the relative vortex motion gave evidence of both ‘orbiting’ and ‘exchanging’ modes. With , increasing the oscillation frequency from the 2P regime produced P+S mode wakes. Experimental limitations confined our observations of P+S wakes to and ; determining if P+S wakes can be produced in a soap film for remains to be determined. Maintaining and decreasing the oscillation frequency from the 2P regime led to the production of transitional wakes, for which vortex generation was synchronized to the cylinder oscillation but consistent wake patterns were not identified. Decreasing the oscillation frequency further to produced synchronized 2T wakes; this observation appears to be the first documentation of 2T wake production by a cylinder undergoing purely transverse oscillations.
Moving sufficiently far from produced wakes that were not synchronized with the cylinder motion. For very low-frequency oscillations, vortices were shed at a frequency corresponding to that for a fixed cylinder, giving rise to perturbed von Kármán (pvK) wakes consisting of a 2S pattern superimposed on a sine wave. For large oscillation frequencies () with , each oscillation cycle produced multiple closely-spaced vortices that merged into a smaller number of large vortices, forming a coalesced (clsc) structure in the far wake that typically resembled a 2S wake. Even though the vortex shedding was not synchronized with the cylinder motion, both the pvK and clsc wakes typically displayed a stable, periodic structure in the far wake; in fact, these unsynchronized wakes tended to exhibit a more regular far-wake structure than the synchronized transitional wakes. For the unsychronized wakes, both the vortex shedding frequency, , and the cylinder oscillation frequency, , play an important role in the exact structure of the far wake; the details of this dependence remain to be determined.
The results of our soap film experiments show strong correlations with prior experimental and computational results. At the same time, there are several differences in these results that suggest interesting topics for further investigation. The occurrence of the 2T mode wakes is one such topic. For another, while the shape of the synchronization region is consistent with previous results (compare the boundaries of the 2S and weak 2P regions in figure 8 with those in figure 2(a,b)), the synchronization region in the soap film covers a considerably wider range in than in the traditional flows. Finally, despite the physical constraints of the soap film system, which prevent any span-wise structure in the wake wider than the thickness of the film, the results presented here are more similar to three-dimensional experimental results (Williamson and Roshko 1988) than to two-dimensional computational results (Leontini et al. 2006), which show at most a weak 2P mode (Placzek et al. 2009; Dorogi and Baranyi 2020). An exploration of this intriguing dichotomy will be the subject of a future manuscript. One major conclusion that can be drawn from this work is that the presence of span-wise three-dimensional effects in the wake, such as the mode A and mode B instabilities (Williamson 1996a; Leweke and Williamson 1998), is not necessary for generation of a 2P wake structure.
Acknowledgements
This material is based upon work supported in part by the National Science Foundation (NSF)’s Graduate Research Fellowship under Grant No. 1840995, NSF Grant No. DGE-0966125, and the Virginia Tech Graduate Research Development Fund. The authors thank Drs. Yanyun Chen, Saikat Basu, and Sunny Jung for their assistance in developing the experimental system.
References
- Antoine et al. (2016) Antoine, G.O., de Langre, E., Michelin, S., 2016. Optimal energy harvesting from vortex-induced vibrations of cables. Proc. R. Soc. A Math. Phys. Eng. Sci. 472, 20160583. URL: https://royalsocietypublishing.org/doi/10.1098/rspa.2016.0583, doi:10.1098/rspa.2016.0583.
- Aref (1995) Aref, H., 1995. On the equilibrium and stability of a row of point vortices. Journal of Fluid Mechanics 290, 167. URL: http://www.journals.cambridge.org/abstract{_}S002211209500245X, doi:10.1017/S002211209500245X.
- Auliel et al. (2015) Auliel, M.I., Castro, F., Sosa, R., Artana, G., 2015. Gravity-driven soap film dynamics in subcritical regimes. Physical Review E - Statistical, Nonlinear, and Soft Matter Physics 92, 1–8. doi:10.1103/PhysRevE.92.043009.
- Basu and Stremler (2015) Basu, S., Stremler, M.A., 2015. On the motion of two point vortex pairs with glide-reflective symmetry in a periodic strip. Physics of Fluids 27. doi:10.1063/1.4932534.
- Bishop and Hassan (1964) Bishop, R.E.D., Hassan, A.Y., 1964. The lift and drag forces on a circular cylinder oscillating in a flowing fluid. Proceedings of the Royal Society of London. Series A. Mathematical and Physical Sciences 277, 51–75. URL: http://rspa.royalsocietypublishing.org/cgi/doi/10.1098/rspa.1964.0005, doi:10.1098/rspa.1964.0005.
- Blackburn and Henderson (1999) Blackburn, H.M., Henderson, R.D., 1999. A study of two-dimensional flow past an oscillating cylinder. J. Fluid Mech. 385, 255–286. doi:10.1017/S0022112099004309.
- Brika and Laneville (1993) Brika, D., Laneville, A., 1993. Vortex-induced vibrations of a long flexible circular cylinder. Journal of Fluid Mechanics 250, 481–508. doi:10.1017/S0022112093001533.
- Couder and Basdevant (1986) Couder, Y., Basdevant, C., 1986. Experimental and numerical study of vortex couples in two-dimensional flows. J. Fluid Mech. 173, 225–251. doi:10.1017/S0022112086001155.
- Couder et al. (1984) Couder, Y., Basdevant, C., Thome, H., 1984. Sur l’apparition de couples solitaires de tourbillons dans les sillages bidimensionnels turbulents. Comptes Rendus l’Academie des Sci. Ser. II, Mec. Phys. Chim. Astron. 299, 1–15.
- Couder et al. (1989) Couder, Y., Chomaz, J., Rabaud, M., 1989. On the hydrodynamics of soap films. Phys. D Nonlinear Phenom. 37, 384–405. doi:10.1098/rspl.1877.0052.
- Dorogi and Baranyi (2020) Dorogi, D., Baranyi, L., 2020. Identification of upper branch for vortex-induced vibration of a circular cylinder at Re=300. J. Fluids Struct. 98, 103135. URL: https://doi.org/10.1016/j.jfluidstructs.2020.103135, doi:10.1016/j.jfluidstructs.2020.103135.
- Eshraghi et al. (2021) Eshraghi, J., Rajendran, L.K., Yang, W., Stremler, M.A., Vlachos, P.V., 2021. On flowing soap films as experimental models of 2D Navier-Stokes flows. Experiments in Fluids (in revision).
- Georgiev and Vorobieff (2002) Georgiev, D., Vorobieff, P., 2002. The slowest soap-film tunnel in the Southwest. Review of Scientific Instruments 73, 1177–1184. URL: http://aip.scitation.org/doi/10.1063/1.1446040, doi:10.1063/1.1446040.
- Gharib and Derango (1989) Gharib, M., Derango, P., 1989. A liquid film (soap film) tunnel to study two-dimensional laminar and turbulent shear flows. Physica D: Nonlinear Phenomena 37, 406–416. doi:10.1016/0167-2789(89)90145-0.
- Govardhan and Williamson (2000) Govardhan, R., Williamson, C.H., 2000. Modes of vortex formation and frequency response of a freely vibrating cylinder. Journal of Fluid Mechanics 420, 85–130. doi:10.1017/S0022112000001233.
- Griffin and Ramberg (1974) Griffin, O.M., Ramberg, S.E., 1974. The vortex-street wakes of vibrating cylinders. J. Fluid Mech. 66, 553–576. doi:10.1017/S002211207400036X.
- Griffin and Votaw (1972) Griffin, O.M., Votaw, C.W., 1972. The vortex street in the wake of a vibrating cylinder. Journal of Fluid Mechanics 55, 31–48. URL: https://www.cambridge.org/core/product/identifier/S0022112072001636/type/journal{_}article, doi:10.1017/S0022112072001636.
- Heil et al. (2017) Heil, M., Rosso, J., Hazel, A.L., Brøns, M., 2017. Topological fluid mechanics of the formation of the Kármán-vortex street. Journal of Fluid Mechanics 812, 199–221. doi:10.1017/jfm.2016.792.
- Heinz et al. (2016) Heinz, J.C., Sørensen, N.N., Zahle, F., Skrzypiński, W., 2016. Vortex-induced vibrations on a modern wind turbine blade. Wind Energy 19, 2041–2051. URL: http://doi.wiley.com/10.1002/we.1967, doi:10.1002/we.1967.
- Huang and Larsen (2010) Huang, Z.y., Larsen, C.M., 2010. Large Eddy Simulation on Interaction Between in-Line and Cross-Flow Oscillation of A Circular Cylinder. China Ocean Eng. 24, 663–676. URL: http://www.chinaoceanengin.cn//article/id/fb95e7f8-9a99-41a0-abd3-9236b3e08e14.
- Jia et al. (2007) Jia, L.B., Li, F., Yin, X.Z., Yin, X.Y., 2007. Coupling modes between two flapping filaments. J. Fluid Mech. 581, 199–220. doi:10.1017/S0022112007005563.
- Jia and Yin (2008) Jia, L.B., Yin, X.Z., 2008. Passive oscillations of two tandem flexible filaments in a flowing soap film. Physical Review Letters 100, 228104. doi:10.1103/PhysRevLett.100.228104.
- Jiao and Wu (2018) Jiao, H., Wu, G.X., 2018. Free vibration predicted using forced oscillation in the lock-in region. Physics of Fluids 30. doi:10.1063/1.5056203.
- Kellay et al. (1995) Kellay, H., Wu, X.l., Goldburg, W.I., 1995. Experiments with turbulent soap films. Physical Review Letters 74, 3975–3978. URL: https://journals.aps.org/prl/pdf/10.1103/PhysRevLett.80.277https://link.aps.org/doi/10.1103/PhysRevLett.74.3975, doi:10.1103/PhysRevLett.74.3975.
- Khalak and Williamson (1999) Khalak, A., Williamson, C.H., 1999. Motions, Forces and Mode Transitions in Vortex-Induced Vibrations At Low Mass-Damping. Journal of Fluids and Structures 13, 813–851. doi:10.1006/jfls.1999.0236.
- Kim and Mandre (2017) Kim, I., Mandre, S., 2017. Marangoni elasticity of flowing soap films. Physical Review Fluids 2, 1–9. doi:10.1103/PhysRevFluids.2.082001, arXiv:1610.00178.
- Koopmann (1967) Koopmann, G.H., 1967. The vortex wakes of vibrating cylinders at low Reynolds numbers. J. Fluid Mech. 28, 501–512. doi:10.1017/S0022112067002253.
- Kumar and Mittal (2012) Kumar, B., Mittal, S., 2012. On the origin of the secondary vortex street. Journal of Fluid Mechanics 711, 641–666. doi:10.1017/jfm.2012.421.
- Leontini et al. (2006) Leontini, J.S., Stewart, B.E., Thompson, M.C., Hourigan, K., 2006. Wake state and energy transitions of an oscillating cylinder at low Reynolds number. Physics of Fluids 18. doi:10.1063/1.2204632.
- Leweke and Williamson (1998) Leweke, T., Williamson, C.H.K., 1998. Three-dimensional instabilities in wake transition. Eur. J. Mech. - B/Fluids 17, 571–586. URL: https://www-sciencedirect-com.ezproxy.lib.vt.edu/science/article/pii/S0997754698800125, doi:10.1016/S0997-7546(98)80012-5.
- Masroor et al. (2021) Masroor, E. Yang, W., , Stremler, M.A., 2021. Flow visualization data from experiments with an oscillating circular cylinder in a gravity-driven flowing soap film at low reynolds number. Journal of Fluids and Structures (in revision).
- Morse and Williamson (2009) Morse, T.L., Williamson, C.H., 2009. Fluid forcing, wake modes, and transitions for a cylinder undergoing controlled oscillations. Journal of Fluids and Structures 25, 697–712. URL: http://dx.doi.org/10.1016/j.jfluidstructs.2008.12.003, doi:10.1016/j.jfluidstructs.2008.12.003.
- Placzek et al. (2009) Placzek, A., Sigrist, J.F., Hamdouni, A., 2009. Numerical simulation of an oscillating cylinder in a cross-flow at low Reynolds number: Forced and free oscillations. Comput. Fluids 38, 80–100. doi:10.1016/j.compfluid.2008.01.007.
- Schnipper et al. (2009) Schnipper, T., Andersen, A., Bohr, T., 2009. Vortex wakes of a flapping foil. Journal of Fluid Mechanics 633, 411–423. doi:10.1017/S0022112009007964.
- Trapeznikov (1957) Trapeznikov, A.A., 1957. Application of the method of two-dimensional viscosity and shear strength to the investigation of the structure and composition of two-sided films and surface layers in solutions of soaps and saponins. Proceedings of the 2nd International Congress on Surface Activity , 242–258URL: citeulike-article-id:3206466.
- Vorobieff and Ecke (1999) Vorobieff, P., Ecke, R.E., 1999. Cylinder wakes in flowing soap films. Physical Review E - Statistical Physics, Plasmas, Fluids, and Related Interdisciplinary Topics 60, 2953–2956. doi:10.1103/PhysRevE.60.2953.
- Wang et al. (2010) Wang, S.Y., Tian, F.B., Jia, L.B., Lu, X.Y., Yin, X.Z., 2010. Secondary vortex street in the wake of two tandem circular cylinders at low Reynolds number. Phys. Rev. E 81, 036305. URL: https://link.aps.org/doi/10.1103/PhysRevE.81.036305, doi:10.1103/PhysRevE.81.036305.
- Wen and Lin (2001) Wen, C.Y., Lin, C.Y., 2001. Two-dimensional vortex shedding of a circular cylinder. Phys. Fluids 13, 557–558. doi:10.1063/1.1338544.
- Williamson and Brown (1998) Williamson, C.H., Brown, G.L., 1998. A series in 1/sqrt(Re) to represent the Strouhal-Reynolds number relationship of the cylinder wake. Journal of Fluids and Structures 12, 1073–1085. doi:10.1006/jfls.1998.0184.
- Williamson and Jauvtis (2004) Williamson, C.H., Jauvtis, N., 2004. A high-amplitude 2T mode of vortex-induced vibration for a light body in XY motion. European Journal of Mechanics, B/Fluids 23, 107–114. doi:10.1016/j.euromechflu.2003.09.008.
- Williamson and Roshko (1988) Williamson, C.H., Roshko, A., 1988. Vortex formation in the wake of an oscillating cylinder. Journal of Fluids and Structures 2, 355–381. doi:10.1016/S0889-9746(88)90058-8, arXiv:arXiv:1011.1669v3.
- Williamson (1996a) Williamson, C.H.K., 1996a. Three-dimensional wake transition. J. Fluid Mech. 328, 345. URL: http://www.journals.cambridge.org/abstract_S0022112096008750, doi:10.1017/S0022112096008750.
- Williamson (1996b) Williamson, C.H.K., 1996b. Vortex Dynamics in the Cylinder Wake. Annu. Rev. Fluid Mech. 28, 477–539. URL: http://www.annualreviews.org/doi/10.1146/annurev.fl.28.010196.002401, doi:10.1146/annurev.fl.28.010196.002401, arXiv:arXiv:1011.1669v3.
- Williamson and Govardhan (2004) Williamson, C.H.K., Govardhan, R., 2004. VORTEX-INDUCED VIBRATIONS. Annu. Rev. Fluid Mech. 36, 413–455. URL: http://arjournals.annualreviews.org/doi/abs/10.1146%2Fannurev.fluid.36.050802.122128, doi:10.1007/978-3-319-16649-0_36, arXiv:arXiv:1011.1669v3.
- Wu et al. (2012) Wu, H., Sun, D.P., Lu, L., Teng, B., Tang, G.Q., Song, J.N., 2012. Experimental investigation on the suppression of vortex-induced vibration of long flexible riser by multiple control rods. J. Fluids Struct. 30, 115–132. doi:10.1016/j.jfluidstructs.2012.02.004.
- Wu et al. (2004) Wu, M.H., Wen, C.Y., Yen, R.H., Weng, M.C., Wang, A.B., 2004. Experimental and numerical study of the separation angle for flow around a circular cylinder at low Reynolds number. Journal of Fluid Mechanics 515, 233–260. doi:10.1017/S0022112004000436.
- Wu et al. (2001) Wu, X.L., Levine, R., Rutgers, M., Kellay, H., Goldburg, W.I., 2001. Infrared technique for measuring thickness of a flowing soap film. Rev. Sci. Instrum. 72, 2467–2471. doi:10.1063/1.1366634.
- Yang et al. (2001) Yang, T.S., Wen, C.Y., Lin, C.Y., 2001. Interpretation of color fringes in flowing soap films. Experimental Thermal and Fluid Science 25, 141–149. doi:10.1016/S0894-1777(01)00087-5.
- Yang and Stremler (2019) Yang, W., Stremler, M.A., 2019. Critical spacing of stationary tandem circular cylinders at Re=100. Journal of Fluids and Structures 89, 49–60. URL: https://www.sciencedirect.com/science/article/pii/S088997461830817X{#}sec4, doi:10.1016/J.JFLUIDSTRUCTS.2019.02.023.
- Zdravkovich (1997) Zdravkovich, M.M., 1997. Flow around circular cylinders. Oxford University Press.
- Zhang et al. (2017) Zhang, L.B., Dai, H.L., Abdelkefi, A., Wang, L., 2017. Improving the performance of aeroelastic energy harvesters by an interference cylinder. Appl. Phys. Lett. 111, 073904. URL: http://aip.scitation.org/doi/10.1063/1.4999765, doi:10.1063/1.4999765.