WiForce: Wireless Sensing and Localization of Contact Forces
on a Space Continuum
Abstract
Contact force is a natural way for humans to interact with the physical world around us. However, most of our interactions with the digital world are largely based on a simple binary sense of touch (contact or no contact). Similarly, when interacting with robots to perform complex tasks, such as surgery, richer force information that includes both magnitude and contact location is important for task performance. To address these challenges, we present the design and fabrication of WiForce which is a ‘wireless’ sensor, sentient to contact force magnitude and location. WiForce achieves this by transducing force magnitude and location, to phase changes of an incident RF signal of a backscattering tag. The phase changes are thus modulated into the backscattered RF signal, which enables measurement of force magnitude and contact location by inferring the phases of the reflected RF signal. WiForce’s sensor is designed to support wide-band frequencies all the way up to 3 GHz. We evaluate the force sensing wirelessly in different environments, including through phantom tissue, and achieve force accuracy of 0.3 N and contact location accuracy of 0.6 mm.
1 Introduction
Our sense of touch is critical for understanding and interacting with the world around us. While interacting with the physical world, force-sensitive mechanoreceptors in the skin respond to various vibrations, motions, pressures, and stretching of the skin to provide us with critical information on the location and magnitude of the stimuli [1]. Thus, if we want the next generation of tactile sensors to emulate how our skin reacts to stimuli, we need to both sense the magnitude and location of contact forces acting on the sensing surface.
Current skin-like continuum tactile sensors enable numerous critical applications. These applications mostly involve dexterous tasks to be performed via mechanical tools or robotic manipulators, rather than via human hands. For example, in order to grasp and manipulate an object, a robot must be able to sense where and how firmly it is pressing the object [2, 3]. Another example can be seen during minimally invasive surgery, where a surgeon must operate inside the body with a surgical tool that naturally contacts numerous tissues throughout the procedure. A sensing layer which acts like a skin covering the entire surgical tool could enable safer surgeries [4, 5, 6], since the surgeon would know exactly where the tool is in contact with the tissues and with how much force. In addition to these robotics applications, tactile sensing can supplement our interactions with the digital world. Most of our current interactions with digital technologies occur with aid of a touchscreen, which binarizes human contact into simply touch/no-touch, and the richer information on contact force is typically lost. Augmenting our digital interfaces with the capability to sense the magnitude of the forces with which we interact with them could lead to more natural, intuitive, and realistic interactions, creating new possibilities for the evolving AR/VR settings [7, 8, 9].
Driven by these applications, design of such continuum sensor skins has been an active area of research over the past decade [10, 11, 12, 13, 14, 15, 16, 17, 18, 19, 20]. The common approach has been to create a sensing surface consisting of an array of discrete force sensitive resistors or electrodes, whose measurements are interpolated to reconstruct a continuum force profile. However, this approach has prohibitive wiring costs [10, 11, 12, 13, 14, 15, 16], since it requires a wired link to obtain data from each individual sensor, as well as wires for satisfying the power requirements. In scenarios where space is a premium, including surgical robotic applications, this wiring challenge is exacerbated, and force sensing for the surgical robotics has been acknowledged as a ‘Grand-Challenge’ [21]. One way to address the wiring requirements is to reduce the density of sensors in the surface and improve the interpolating algorithms [10, 11, 12]. A more drastic solution is to eliminate the wiring problem completely by creating new sensing modalities with modest power requirements such that both the sensor feedback and power can be delivered wirelessly [13, 14, 16].
Motivated by these challenges, we present WiForce, which makes progress in this direction by sensing force magnitude and location over a 1-D continuum by leveraging backscattering techniques. Rather than generating a wireless signal to feed back the sensor readings, which would require power-hungry electronics, WiForce’s sensor transduces force magnitude and location directly onto the reflections of the incident RF signals. The design has very minimal power requirements, and consists of only one antenna, a small identification unit, and a force continuum surface. Thus, WiForce presents a new tactile sensing modality, which makes headway towards batteryless wire-free sensor skins.
The key enabler for such a low-powered design is the transduction mechanism, which modulates the reflected signal with information on the contact force and its location, by altering the RF signal parameters as applied force on the sensor changes. To achieve this, WiForce links contact force, a mechanical entity, to RF signal parameters by combining classical beam bending models and RF transmission line concepts, using a novel sensor surface. This sensor surface consists of two parallel conductive traces, similar to a microstrip line, augmented with a soft specialized polymer beam. As a force is applied at a specific location on the sensor surface, the beam bends, causing the traces to connect (Fig. 1). From the RF perspective, this beam bending leads to shorting of the traces, which causes reflection of signals. From the mechanical perspective, the soft beam allows us to use beam bending models to characterize how the shorting phenomenon changes as the applied force increases.
Essentially, the shorting points shift towards the ends of the sensor, as the applied force increases and the soft layer of the beam bends and flattens on the bottom trace (Fig. 1). By estimating the shorting lengths from both ends of the sensor, we can determine the magnitude and location of the applied force. The shorting lengths are related to the signal phases measured on both the ends of the sensor. Basically, the longer the signal travels on the sensor surface, the more phase change it will accumulate. The goal at the wireless reader is to measure the accumulated phases due to signal propagation on the sensor surface from both the ends, in order to use the transduction mechanism to sense and localize the forces.
To enable sensing of these phases by the wireless reader, the phases from both ends have to be disambiguated, and thus each end has to be given an identity. To do so, a naive solution would be to have RF switches toggling on-off with different frequencies on either ends (, Fig. 2), with the toggling frequency providing the unique identity to each of the ends. However, this naive solution does not work out of the box, because the two ends are electrically connected to each other via the transmission line, causing signals to leak from one end to the other, which would in turn cause intermodulation effects. To resolve this issue, WiForce comes up with a creative RF switch toggling strategy, which not only provides electrical isolation to combat intermodulation, but also provides different identities to these ends in terms of different frequency shifts. Thus, the external wireless reader is able to view the sensor ends as having different identities in frequency domain, as envisioned by the intuitive scheme in Fig. 2, with the intermodulation problem abstracted out via the intelligent toggling scheme.

The final piece in WiForce is designing the wireless reader, such that it can use any wireless device (like WiFi (OFDM) or LoRa (FMCW)) with wide-band transmission to read the WiForce’s force and location. The task of the wireless reader is two-fold, first identify and isolate the signals coming from the sensor and second, accurately track the phase of the sensor signal. Since the wireless phase observed by the reader can also be altered by various entities in the environment, the task of reading phase changes stemming only from the sensor is non-trivial. Hence, WiForce designs a novel signal processing algorithm which utilizes periodic wide-band channel estimates to pick up the reflection signatures from the sensor to isolate the signal, as well as to read the phase changes at multiple frequencies, providing robustness to the phase sensing requirements for the proposed force transduction mechanism.
We designed and fabricated the sensor with a soft-polymer augmented microstrip line, which is ‘force-sensitive’. That is, the microstrip line sensing surface has bending properties which maximize the phase changes transduced by contact forces. This sensing surface was retrofitted with RF-switches and antenna to enable backscattered feedback. The fabricated sensor works for the entire sub-3 GHz verified with the test equipment (vector network analyzer). We evaluated the WiForce sensor abilities to report force magnitude and location in multiple settings, both indoors and inside a body-like environment using gelatin. We used USRP radios as the readers, and tested the sensor at 900 MHz and 2.4 GHz, which are the two most popular ISM bands. We show that the sensor can be read up to 5 meters of range over the air, and show the algorithm working even with propagation through the gelatin-based muscle/fat/skin tissue layers composition similar to the human body to demonstrate the surgical applications. We achieved phase sensing with an accuracy as low as , giving us a force resolution of N, and location accuracy of mm. We also showcase the ability to read from multiple sensors, by sensing forces from 2 sensors simultaneously. Finally, we even evaluated our force sensor with a user pressing with his hand, and we achieved force resolution of N, and location accuracy of mm. In fact, recent interfaces for Human-Computer Interactions (HCI) work shows that similar resolution ( N) is required to support force enabled gestures on smartphones and desktop computers [22]. We believe this is the first step towards enabling numerous force sensing applications.
2 Background and Motivation
The problem of sensing tactile phenomenon over a surface continuum has attracted considerable research interest [15, 20, 10, 11, 12, 18]. The usual approach has been to densely populate the surface with either force sensitive resistors [15], electrodes [20, 10, 11, 12], or force sensitive yarns [18]. The continuum sensing is performed by interpolating over the sensor readings of these discrete sensors. Numerous papers in the past decade have raised the issues stemming from the wiring requirements of the developed sensor skin modalities [13, 14, 16].
Researchers have tried addressing these issues by considering sparser deployments, such as considering sensors only on the boundaries [20], or populating the sensors in a minimal way across the surface [10, 23]. Although these efforts have reduced the wiring requirements for sensing considerably, these surfaces still lack a solution to both feedback the sensor readings wirelessly, as well as get rid of wired battery connections required for these sensing efforts. Recent review papers have advocated the need of powering up these sensing surfaces with energy harvesting methods to alleviate the battery requirements [14, 16], and a backscatter-enabled sensor is a promising approach to address the battery concerns.
Before re-designing the sensing modalities to be compatible with low-powered backscatter communications, a key question to answer is whether a hybrid solution would work. That is, can we take one of the sensing solutions requiring the least number of wired connections across the surface [20, 10] and feedback the sensor readings via currently developed backscattering RFICs11 1 This fusion of sensor skin + backscatter RFIC has not been yet demonstrated, however we consider it as an hypothetical scenario [24, 25]. However, this solution won’t suffice since these backscatter links typically work with a RF energy harvestor, which generates small voltages capable of powering a small RFID chip, and not a large continuum sensing surface. Further we would need to sense multiple voltages from these electrodes via an array of ADCs (Fig. 3), managed by a micro-controller, which would then digitize and buffer the data for transmission through the low capacity backscatter link.

Hence, WiForce attempts a RF-only analog approach, where the sensing modality directly transduces force and its location into wireless signal phase changes, which can be read by a radio over the air. The argument here is that, if analog phase readings can be fed back accurately, it would require much less power than procuring the analog readings, digitizing/buffering them, and then sending them over the backscatter link. Thus, the novel force to phase transduction mechanism, coupled with the analog phase feedback, fulfills both the key requirements for low powered tactile sensing – the ability to sense over a continuum and low-powered battery-free operation.
3 Design of WiForce
In this section, we present the design principles of WiForce. First, we describe WiForce’s force transduction mechanism, which translates the force and its application location to changes in the RF signal phase. Next, we present novel algorithms to measure changes in the RF properties to deduce the force and its application location wirelessly. Finally, we conclude with a robust channel measurement technique that uses a wireless waveform to read the sensors while rejecting multi-path.
3.1 Force Transduction Mechanism
As a first step towards a backscattered force sensor, WiForce has to formulate a transduction mechanism which relates force magnitude and application location, to parameters like RF signal amplitude and phase, which can then be used to modulate the sensor readings onto the reflected signals. The challenge here is to take an object (like transmission lines) which supports RF signal propagation, and make it force-sensitive. That is, RF propagation in this object should give significant changes in its signal parameters as we press the object at different locations with varying force magnitudes. In this section, we will elaborate on how WiForce makes microstrip lines ‘force-sensitive’.

A microstrip line traditionally consists of two parallel conducting traces– the signal trace and the ground trace. A force applied to the microstrip line would cause the traces to bend and come in contact with each other, which shorts the line and leads to signal reflections. The reflections produced by this shorting have different phase accumulation based on the location of pressing. However, this reflected phase is not sensitive to force magnitude at all. That is, irrespective of the contact force applied, the traces will short each other only in the vicinity of a single point (Fig. 4a). The contact point invariance leads to a near invariant phase response as force is changed (Fig. 4c), therefore preventing the measurement of force through phase changes.
WiForce modifies the traditional microstrip line by augmenting a new soft, flexible beam on top of the signal trace to address this problem and make the microstrip line force-sensitive. The key insight here is that the soft beam distributes the force along the length of the trace (Please refer to [26] for details on the mechanical implementation of the sensor). The distributed force leads to a finite length of the signal trace to come in contact with the ground trace, creating two distinct shorting points, as shown in Fig. 4b. Further, these shorting points shift towards the ends as the applied force magnitude increases. Varying shifts induce different phase changes since the signals travel less distance on the microstrip line before getting reflected at the shorting points. Hence, the reflections caused by higher magnitude forces accumulate less phase relative to the reflected phases when lower force was applied. Thus, the soft beam augmented microstrip line allows phase to force transduction (Fig. 4c).
This beam bending effect manifests itself in the form of a varying phase-force relationship depending on the contact force’s point of application (Fig. 5, top images). A force applied in the middle of the sensor compresses it symmetrically, and therefore the reflected signals from both the ends show similar phase changes. In contrast, a force that acts asymmetrically will disproportionately compress the smaller length of the beam. Therefore, the end near the smaller length shows a higher phase shift than the end near the longer one. The longer length collapses onto the bottom trace, leading to an almost stationary shorting point as the force increases (Fig. 5, bottom images). These varying phase changes that depend on the location of a contact force also allow WiForce to localize the force application point. Thus, the double-ended measurement allows us to estimate the applied force’s magnitude and its application location along the sensor length. However, at the same time, this asymmetric behavior of phase change with force contact location necessitates sensing phases from both ends of the sensor.

3.2 Two-ended backscatter modulation
As described in the previous section, sensing phases from both ends of the sensor forms the cornerstone of the phase to force transduction mechanism. This is because it allows to disambiguate the different force profiles observed as the sensor is pressed at different locations, which basically allows us to both locate and then measure how much force was being applied. In this section, we will go over how to attempt this double ended phase sensing via wireless backscatter sensing.
The first and foremost thing which any backscatter sensing solution needs, is an ability to give an identification to the reflections occurring at the sensor. This identification helps the wireless reader isolate the sensor reflections from the environmental clutter. A popular technique to do so has been to use RF switches toggling at different frequencies as identification unit [27, 28, 29]. This technique basically multiplies the incident signal with an on-off modulation of certain switching frequency.
In frequency domain, this operation leads to frequency shifts corresponding to the switching frequency. Putting this mathematically, say the sensor receives the excitation signal and reflects where is a square wave, with time period . Expanding ’s Fourier series, we get odd harmonics, where . Ignoring the high order harmonics, we get reflected signal as . Hence the reflected signal will be shifted by the switching frequency , which allows the reflected signal, , to be isolated from the excitation signal, in the frequency domain.
A naive extension of this idea to the double ended sensing problem at hand, would be to have switches at both ends of the sensor and make them switch at different frequencies (). Theoretically, this solution should give separate identities to reflections emanating from both the ends. However, the problem at hand is inherently coupled to allow for such naive de-coupled solutions, because both the ends are physically connected to each other via a microstrip line. When both the switches are toggled-on, the signals will propagate through the sensor and leak out from the other end (Fig. 6). This causes intermodulated reflections, where the reflected signal would be partially modulated by both toggling frequencies, leading to muddled up identities.
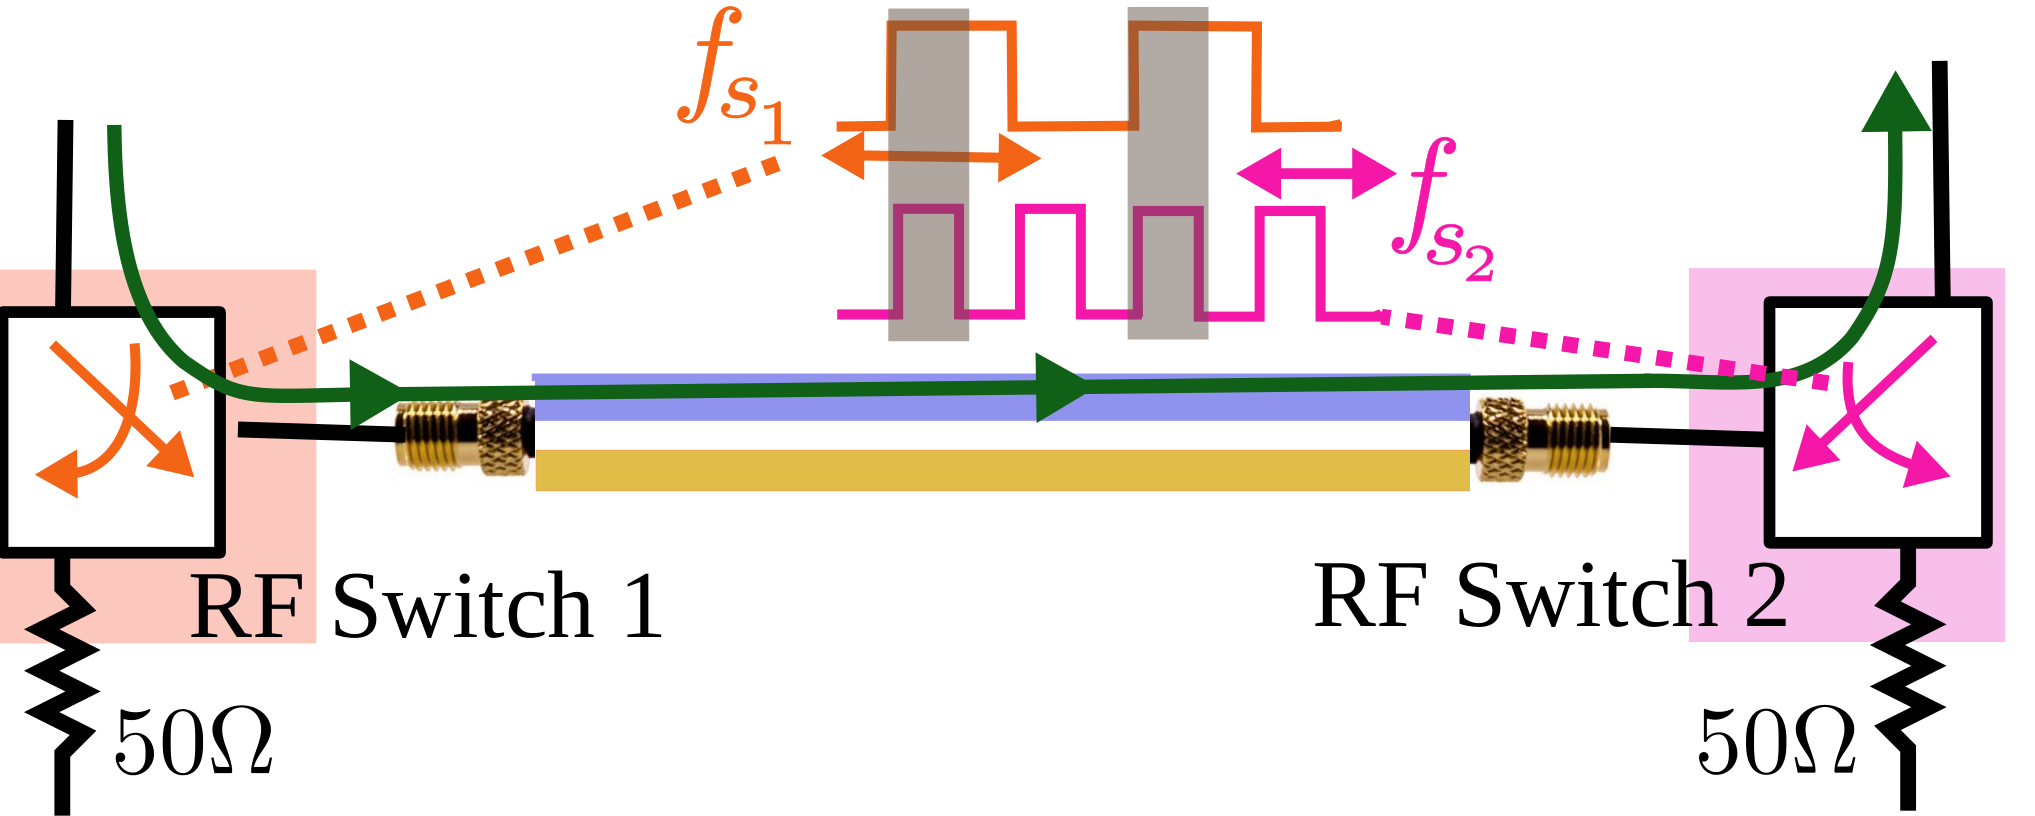
The challenge in avoiding the intermodulation effects is that the sensor has to reflect signals from the opposite end when a switch is toggled on. Using reflective RF switches in the off state allows us to make either of the ends reflective, under the restriction that the other should be off when one switch is on. Said differently, we want to design a coupled two-ended switching scheme, which gives separation in frequency domain, under the constraint that both switches are not ‘on’ at the same time. The unique insight which allows WiForce to have such an switching scheme, is the use of duty cycle properties of square wave Fourier series.
In a standard square wave, with duty cycle, all the even harmonics (i.e. every second harmonic) are absent. Similarly, in a wave with duty cycle, every fourth harmonic would be absent. Hence, a frequency , duty cycle square wave will give modulation at Similarly, a frequency , duty cycle square wave will give modulation at Observe that a combination of these 2 clocks will cause interference at , but can be read up individually at for the former clock, and for the latter clock. Hence, a combination of these 2 clocks can provide separation in the frequency domain. Also, by controlling the initial phases of these two clocks, we can suppress the intermodulation problem as well. This is possible because when one clock is high, the other clock will be guaranteed to be low and vice versa (Fig. 7). Hence, at any given time, only one port will be on, and other port will be reflective open.
Further, this clocking design allows us to reduce the form factor requirements, instead of having antennas, one for each end of the sensor, we can just have just a one antenna design using a splitter. Since the clocking strategy provides separation in the frequency domain, we can add the modulated signals from the either ends via a splitter. Thus, the wireless reader can identify the two ends by reading at frequency shifts.

3.3 Sensing Forces at the Wireless Reader
Till now, we have described the phase-force transduction mechanism, and delineated a method to give disambiguated identities to both ends of the sensor. Now, in this section, we move on to the description of how the wireless reader is designed. We design our wireless reader to detect the separate identities stemming from frequency shifts, and then extract the valuable phase information which allows us to sense and localize forces. The key insight of WiForce here is to view the frequency shifts from the sensor as ‘artificial-doppler’ and use wide-band channel estimates in order to estimate the doppler and thus isolate the signal coming from the sensor. This approach to view the backscatter tag’s frequency shift as an artificial doppler has been also utilized in some of the recent past work [28]. Finally, to obtain the required analog phase estimates required to sense and localize the forces, we utilize that fact that force, a mechanical quantity, changes slowly (at about 1 kHz rate [30, 31, 32]), as compared to MHz’s of RF bandwidth. This allows us to group the channel estimates and perform a ‘short-time phase transform’, which enables us to track the phase shifts at the two artificial doppler bins corresponding to the two ends of the sensor.
The algorithm WiForce uses to extract the backscattered phases embedded inside the wideband channel estimates is visually illustrated in Fig. 8. Say we are estimating the channel periodically after every seconds, with frequency steps of . If we use OFDM channel sounding strategy, will be the time of the OFDM frame, and will be the subcarrier spacing. We denote where is subcarrier index and is time index. If there are multipaths in addition to the signal coming from the sensor, we can write the channel estimates from geometric channel model as
| (1) |
Here, is the attenuation factor for the -th path, is the distance separation between the TX-reflector and reflector-RX, and is the phase accumulated from the RF propagation in the microstrip line sensor at time index from sensor end and sensor end . are the duty-cycle square wave modulations to give intermodulation free frequency identities at as discussed in Section 3.2. Ignoring the higher harmonics terms in , we get
| (2) |
Now, to isolate the signal from the sensor, we take FFT over the index, to obtain . We observe channel snapshots to calculate, . Assuming stay constant over the period of snapshots, at , , we have,
| (3) |
Observe that for this transform, the nyquist frequency would be , and hence, has to be chosen such that . The switching frequency can be related to an equivalent Doppler, , and thus an object in the environment moving at velocity would create interference with the sensor signal. However, the chosen is large enough so that this equivalent speed is so high to guarantee that, the signal observed in the frequency bins corresponding to are free from multipath clutter.
However, recall that while writing Eqn. (3), we assumed stay constant as goes from 1 to . That is, the transform is only valid when the phases from the sensor ends do not change much over the period of taking the transform. This is a reasonable assumption to make, since the sampling is occurring in MHz rate, whereas force will at max change in rate of kHz, since it is a mechanical quantity. However, we can not obviously assume the phase to stay constant forever, and, the phase will change as we apply force on the sensor which would move the shorting points. More importantly, we need to not only tweak the standard doppler transform to respect phase change, we also need to estimate the phase changes in order to estimate the forces.
Thus, WiForce designs an algorithm similar to the familiar short-time transforms. The algorithm divides the channel estimates into groups of , referred to as ‘phase-groups’. For each phase-group we first take the harmonics FFT as described earlier and obtain two vectors from Eqn.3 for FFT frequency , . Assume that there are such phase groups, i.e. . For all the samples of -th group, from the choice of to respect the time it takes for the force to become effective. The output at -th phase group, -th subcarrier, after harmonics FFT at , is denoted as .
| (4) |
To get rid of the air phases, we can obtain the phase change between 2 groups by conjugate multiplication:
| (5) |
Hence, we have
| (6) |
for each subcarrier . Observe that the right side of the equation is the phase change independent of , which entails that we have independent estimates of the phase change from the subcarriers. Thus, we can estimate very precise phase changes by averaging over these independent estimates, allowing WiForce to calculate very precisely the analog phase changes.

The last piece in the puzzle to conclude the design section, is to internalize how can we use differential phase to sense and localize the contact forces. In fact, since force is an event based quantity, that is, unlike quantities like temperature, moisture, which sense the ambient quantity, tactile sensors have to sense the force from an ‘touch-event’ which exerts certain force on the sensor at a given location. When we measure the differential phase between the ‘no-touch’ and ‘touch’ events, we can measure differential phase and obtain the absolute phase by simply subtracting the phase which the waves accumulate when the sensor is at rest (Fig. 9). Since this no-touch phase is a fixed quantity and depends only on the length of the trace, we measure it beforehand via a VNA setup and compensate. Hence, compensating the differential phase with the VNA calibrated no-touch phase allows us to recover phases from both the ends, which can then used by the transduction mechanism in order for estimation of force magnitude and location at the reader.
4 Implementation
4.1 Microstrip line RF Interfacing
To support the two broad applications targeted by WiForce, the sensor must give good RF propagation performances at 900 MHz (for in-body sensing applications) and at 2.4 GHz (to be compatible with Wi-Fi/Bluetooth standards). From our simulations (Section 10.2), we expect that by having the ratio between trace width and sensor height to be around , we should get good impedance matching. Hence, we design an air substrate microstrip line with trace width of 2.5 mm, ground trace width of 6 mm and height of 0.63 mm, for a sensor length of 80 mm. To verify the impedance matching, we assess the RF design performance of the sensor in terms of insertion/thru losses. For this, we perform a 2 port amplitude/phase analysis using VNA. As visible in Fig. 10, this leads to a S11/S22 ratio below -10 dB over the entire frequency range from 0 to 3 GHz, along with linear S12 phase, which justifies the broadband nature of the sensor.
4.2 Forming the sensor model with soft beam microstrip line
After having verified the RF properties of the microstrip line, we fabricate the soft layer using Ecoflex 00-30 (a commonly used elastic material [33, 34, 35]). The Ecoflex layer is placed onto the top trace to create the WiForce sensing surface with thick traces, endowed with the novel phase to force transduction mechanism.

| = 20 mm | = 40 mm | =60 mm | =55 mm (intmd. loc) | |
|
900 MHz |
||||
|
2.4 GHz |
||||
| Legend — VNA Phases Wireless trial 1 Wireless trial 2 Wireless trial 3 — Model | ||||
To verify if the sensor is following the transduction mechanism, we exert forces on the sensor at 5 locations, namely 20, 30, 40, 50 and 60 mm (20, 40, 60 marked in Fig. 11). We expect the beam to show a symmetric phase changes on both the ends when tested at the center point, and asymmetric phase changes for the end points, as described in Section 3.1. When pressed on the end points, the port near the pressing location would show more phase change, whereas the other end essentially shows a constant phase as force increases. For this testing, we use the setup visible Fig. 11, where an indenter allows us to apply a force at a given location on the sensor, and a load cell on which the sensor is attached, allows us to collect the values of force magnitudes applied. As seen clearly in the 20/40/60 mm figures in Table 1, the phases do follow the beam bending model as discussed above, since 40 mm testing shows symmetric behaviour, whereas for 20/40 mm, one of the ends show a constant phase as force magnitude is increased.
We now use the data obtained by applying forces at all 5 locations, and compute a cubic-fit to make a sensor model that allows us to compute the force magnitude and force location based on the measured phase changes. To confirm the validity of the model, we asses it at an intermediate point (55 mm), and plot the phase-force profile as predicted by the model alongside the ground-truth profile we collect from the VNA. As visible in Table 1, all graphs for force applied at 55 mm overlay on each other, which confirms the reliability of the sensor model.
4.3 Clock Design and RF Switches
To encode the phase changes caused by different shorting positions on the microstrip line due to application of a force, we utilize RF-switches with the duty cycled clocking strategy described in Section 3.2. We use the HMC544AE from Analog Devices in our prototype, which is a reflective-open switch consistent with our duty cycling requirements discussed in Section 3.2.
The final component in our prototype design is the clock source. We use the timer channels in Arduino Due with an Atmel SAM3X8E ARM Cortex-M3 processor[36] to generate the duty cycled clock source as described in Section 2. We generate a duty cycled kHz square wave, and a duty cycled kHz square wave to modulate the two RF switches. This gives us interference-free modulation at kHz.
Hence our sensor prototype consists of five components, shown in Fig. 12(b), the microstrip line sensor, 2 RF switches, 2 clock sources, a splitter to combine outputs of the 2 switches and one antenna to communicate the backscaterred phases to the wireless reader. The elements in our design which require power thus are the 2 RF switches and the 2 clock sources. For switching at kHz frequencies, we observed that the power consumed by the 2 HMC544AE switches was almost similar to the static power consumption of 3.3 W (the static current for switch at 3.3V voltage level is 0.5 A [37]). Although in our design we use a microcontroller to provide the clocks, by using low-powered oscillators, we can meet the clocking requirements with about 2 W power budget [38]. Overall, the requirements are lesser than W which are modest enough to be supported by a RF energy harvesting circuit. In recent works, papers have even shown more than 50 W power being harvested via RF signals, across 1cm of tissue [39].
4.4 Wireless Reader Implementation
The main task of the wireless reader is to transmit the OFDM waveform and periodically estimate the channel, so that phase changes at the shifted frequencies from the sensor can be read wirelessly. To perform the channel estimation, we utilize a 64 subcarrier, 12.5 MHz OFDM waveform. We test this for both center frequency of 900 MHz and 2.4 GHz. We use separate antennas for transmission and reception, and use the same USRP N210 SDR [40]22 2 We can potentially use a COTS device as well as the wireless reader. Refer to Section 10.1 for a brief discussion on the same for both functions. Since the transmit and receive chains are on the same device, they are synchronized and will not show frequency/phase offsets. We emphasize here that the arduino clock is not synchronized with the other elements of the system since the force sensor is deployed as a separate entity.
We use a 320 sample long OFDM preamble padded with 400 zeros for the channel estimate. At the sampling rate used, this translates to fresh channel estimates every s. Recall that to sense harmonics, the maximum harmonic frequency which can be sensed would be kHz due to the Nyquist Limit. We therefore chose our sensor clock frequencies to be 1,2 kHz, which would give modulation at 1,4 kHz, and falls comfortably within measurable limits.


5 Experimental Evaluation
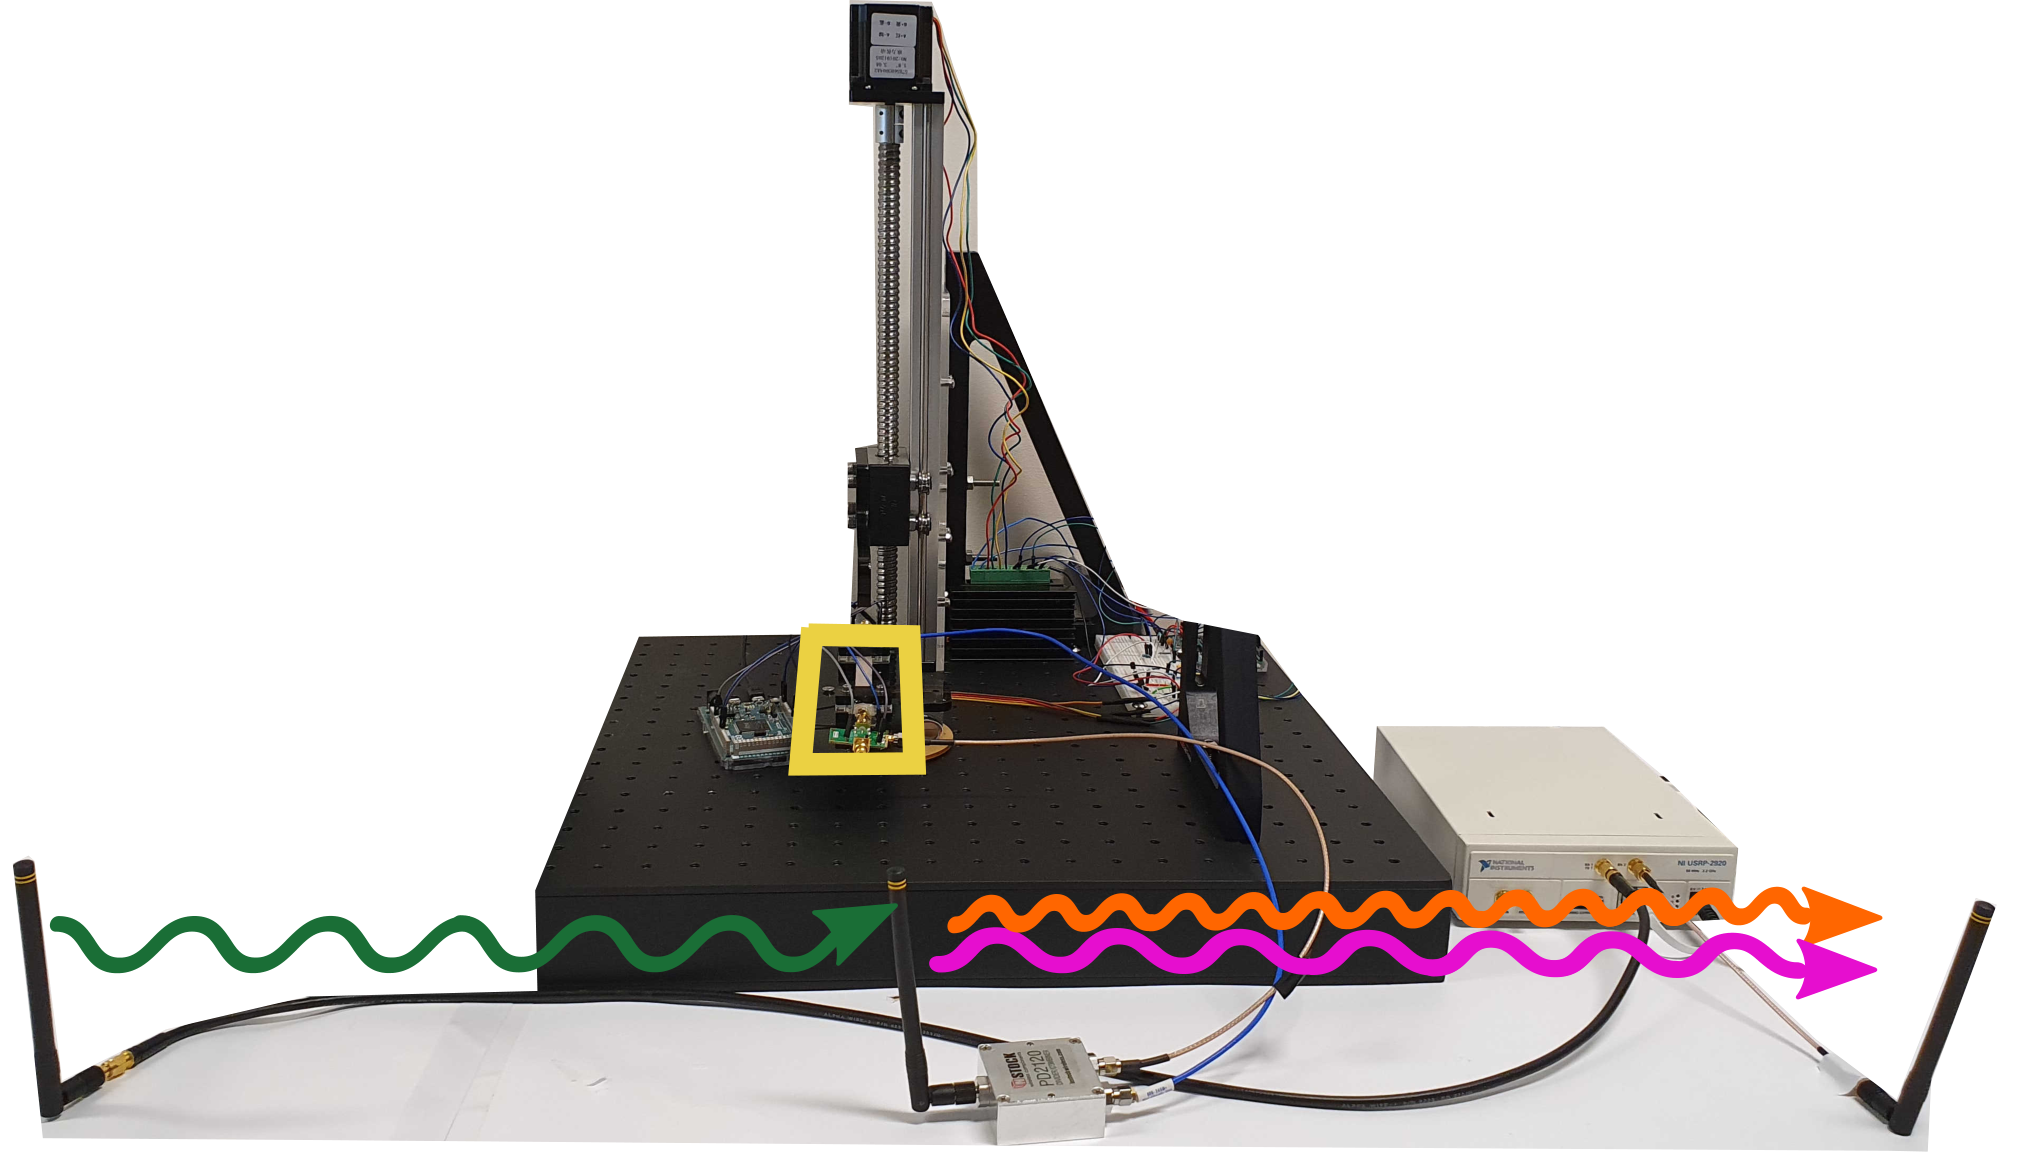
Armed with a sensor model to get from phases to force magnitude/location, as well as wireless reader and sensor implementation to enable backscatter sensing capabilities, we now evaluate the wireless performance of our sensor in different indoor environments. The developed sensor model is first used to estimate the force magnitude and location exerted on the sensor, and this predicted force magnitude/location is compared to ground truth readings from the load cell and actuator position, as shown in Fig. 12(a). In addition, we plot empirical CDFs, which allow us to understand the accuracy of our sensing solution. Not restricting to over the air evaluations, we even evaluate our sensor when the wireless propagation occurs through tissue phantoms made to emulate human tissues. We also show the capability of reading forces from two sensors simultaneously. Finally, we show that the force sensing works not only with the precision touches of the actuator, but can also detect the force and contact location when a human interacts with the sensor via finger touches.
5.1 Wireless Performance Evaluation
The first step in the wireless performance evaluation is to verify if the estimated force magnitudes and locations agree with the ground truth force-phase curves obtained via the load cell and the VNA setup. For this purpose, the setup illustrated in Fig. 12(a) is used33 3 We also evaluate the performance of the sensing algorithm over a range of distances till 2m. The results are presented in Section 10.3, with the sensor on top of a platform having load cell to give ground truth readings for the experiment, similar to the VNA experiment in Section 4.2. Forces are applied between 0 and 8 N at 20, 40, 55 and 60 mm positions on the sensor. From Table 1, we can clearly see that wireless sensing is able to follow the VNA force-phase curves. Hence, this allows to validate the wireless implementation.
Using the estimated values of force magnitudes and force location to the ground truth, i.e. load cell readings and indenter location, we plot emperical CDFs to evaluate the wireless performance metrics. In Fig. 13a, Fig. 13b, we see that median error of force magnitude estimation of WiForce is 0.56 N when being read at 900 MHz, and 0.34 N when being read at 2.4 GHz. These results are satisfactory, since the errors are a fraction of the operating range of the sensor, which is approximately 8 N. One can observe that the error is lower at high frequency. Since higher frequency signals accumulate more phases for the same travelled distance, the required granularity for phase sensing is more relaxed, leading to lower error than sensing at low frequencies. Another observation from Fig. 13a, Fig. 13b, is that the sensor works uniformly across its length, i.e. error CDFs are similar when plotted for touching at individual locations with increasing magnitude of forces.
Proceeding similarly, the median errors on the estimated force location is 0.86 mm at 900 MHz, and 0.59 mm at 2.4 GHz, as visible in Fig. 13c. Similar to force magnitude CDFs, performance is better at a higher frequency, since more phase change is accumulated per unit length at higher frequencies, enabling finer location estimation. These location results are satisfactory, with about 5 times higher accuracy than reported in recent work [41, 42], where errors are in the order of magnitude of centimeters. The reasons for this improved performance are two-fold. To localize the contact location, WiForce correlates the extra separation between the shorting points caused by sensor bending in the action of a certain contact force. This correlation is enabled by the novel two-ended sensing strategy of WiForce. This is fundamentally very different from the past contact location sensing approaches [41, 42]. Furthermore, this is supported by a wideband phase sensing algorithm (Section 3.3), which is capable of sensing these phases very accurately and robustly, unlike the previous works which used a narrowband RFID reader for the evaluations [41].
5.2 Testing with Tissue Phantoms
We now assess the performance of our backscatter sensing strategy through human tissue. Propagation through human tissues necessitates using 900 MHz over 2.4GHz, as frequencies higher than 1 GHz are severely attenuated in such environments [43, 44]. Wireless signals undergo huge losses when they propagate through human tissue, since these tissues are typically materials with high dielectric constants (with ) [45]. Further, the propagation is hampered via refraction and total internal propagation effects, which exacerbate the losses. Thus, to sense the robustness of our strategy with these impairments, we use the setup visible in Fig. 13d. It consists of a tissue phantom composed of three layers (muscle, fat and skin, and thickness of 25, 10 and 2 mm, respectively), with dielectric properties selected to mimic human tissue properties, as in [46].
During these experiments, we observe that there was around 110 dB two-way backscatter loss from the TX-sensor and sensor-RX, for center frequency 900 MHz, when communicating through the tissue phantom. However, the direct path TX to RX signal had about 10-15 dB loss. The dynamic range of the USRP SDR we use was around 60 dB, because of which we can’t decode the weak backscattered signal under the presence of the much stronger direct path signal. Hence, for these experiments, we isolated the TX and RX with a metal plate for this experiment. Because of the metal plate, the direct path loss increased to about 60 dB, which allowed us to decode the 50 dB lower backscattered signal at the receiver using the 60 dB dynamic range ADC of the USRP. For this experiment, we apply contact force at 60 mm on the sensor. We obtain similar performance as with the over-the-air tests, with the median force error increasing slightly from 0.56 N to 0.62 N (Fig. 13d). These results demonstrate the robustness of WiForce’s wireless capabilities, since the sensing algorithm was able to decode force readings from a weaker signal trough the tissue phantom. In future works, the metal blockage can be replaced by self-interference canceling strategies, however, this is beyond the scope of this paper.
5.3 Multi-sensor experiments
We also evaluate the capability of WiForce to sense from multiple sensors simultaneously. The setup here consists of two sensors placed on a platform, and we use a custom designed indenture with the actuator in order to press on the two sensors simultaneously (Fig. 12(c)). A load cell is attached below the platform to measure the combined forces acting on the platform (Fig. 14), whereas via wireless sensing from the two sensors we can estimate individually. In order to have separate identities for the two ends of the other sensor, we modulate via 1400, 2800 Hz duty cycled waves (visually illustrated via red, blue waves Fig. 12(c), Fig 14).
By reading at these frequencies, we can wirelessly obtain estimates of . Because the load cell measures , we expect that adding these two estimates should allow us to compare against the ground truth load cell readings. The added estimates are expected to give a median error of , since one estimate from the sensor comes with a median error of at 900 MHz, as profiled by the CDF plots (Fig. 13). Thus, we plot as the blue shaded region as the expected median performance of the sensor to sense the added force. Indeed, we see the added up estimates respecting the median error by being confined inside the median error region (Fig. 14).
5.4 Getting More Than Finger Touch: Measuring Fingertip Forces
We now motivate a UI use case, which has the potential to improve and change the way users interact with digital devices. For this purpose, we select a center frequency of 2.4 GHz for our sensor, which is well-adapted to Wi-Fi and Bluetooth devices. To assess the relevance of our sensor for such applications, we use the fingertip, instead of the actuated indenture, to press the sensor with varying force levels. An operator presses the sensor at the 60 mm location. We plot the force readings from the load cell in real time, and use this real-time plot to give the user visual cues to settle in to some force level. Then, we estimate these force levels using WiForce to evaluate if it can support these sensing capabilities.

Fig. 15 shows the evaluation results of WiForce’s experiments. From Fig. 15(a) one can see that the sensor could accurately detect the pressing location, which was 60 mm, with sufficient accuracy, considering the fact that a typical human fingertip has a width and thickness of approximately 15-20 mm [48, 47]. That is, even though WiForce’s location sensing had sub-mm location sensing accuracy, now the error source will most likely be coming from the uncertainity of how operators press the sensor with their finite width fingertips, instead of the precise point-pressing feature of the actuator before. Since most of the readings are clustered mm near the visual cue of mm given to the operators, WiForce does operate under the practical limit of the experimental setting due to finite width of the operators.
Further, in Fig. 15(b), we see how WiForce is able to get more than just binary touch sensing results. Not only can WiForce detect the point where a finger touched the sensor, going one step ahead, WiForce is able to detect the force profiles of the touch interactions as well, which motivates much improved UI use cases by getting more than just touch/no touch information.
6 Discussions and Applications
The most natural usecase for such wireless haptic feedback lies in surgical robots and tools. Human hands are extremely dexterous, and provide unparalleled sensory feedback which enable very precise operations required for surgery. However, we need tools and robots to emulate the human hands when direct operation is not possible, such as during minimally invasive surgical operations. Ideally surgeons should receive haptic feedback from the tools/robots they are operating, which would require information of both force magnitude and contact location. However, such haptic feedback is generally not available in practice, and one reason has been that force sensing modalities are still not evolved enough to support these applications [49, 50, 5, 51, 52]. Loss of haptic feedback increases the training time for surgeons, increases risk of surgical errors, and hinders the closed-loop operation for robot assisted surgeries [53, 54, 55, 56].
The current form factor and sensor interface hinders direct use of WiForce’s sensor in more complex surgical tasks requiring force feedback, such as cardiac ablation [55] or pre-retinal membrane peeling [57]. However, the sensor can help solve a major problem in laparoscopy known as the fulcrum effect [58]. The fulcrum effect is caused due to lever effect caused by contact forces between the body and surgical tool, at the entry point of the surgical incision. Due to lack of feedback on both the magnitude of force and location, the tool tend to slip, which causes risks of tissue damage. A laparoscopic surgical tool augmented with a WiForce sensor to determine and localize the contact force can prevent this fulcrum effect since the surgeon can do a closed loop correction based on this haptic feedback.
Apart from surgical applications, sensing contact force and location can be extremely useful for robotic tasks which require a manipulator/gripper. Robotic manipulators need this haptic feedback to determine how firmly they have grasped a particular object [2, 3]. People have attempted doing this via vision induced haptics [59, 60], however, these methods typically require computationally intensive algorithms and fail to meet the required temporal rate of feedback required to determine if the grasp of the object is loosening and slipping [61]. However, since wireless sensing is not bound to such issues, and can be made near real-time. Thus, such sensors can be used for direct and low-latency haptic feedback to improve robotic manipulation operations.
Alongside the robotics centered applications, force sensing can have many latent applications in the next generation interfaces for HCI/AR-VR. Smart surfaces have been an active area of research, with touch sensing touted to a game changer for ubiquitous computing [62, 63, 64]. Force sensing will add more depth to these touch sensing solutions, and can lead to some unforeseen applications.
7 Future Work
Extending to 2-D continuum: The current sensor prototype of WiForce consists of sensing on a 1-D continuum. To extend this sensing to a 2-D continuum, we can deploy multiple WiForce sensors placed next to each other. Hence, by reading phase changes from multiple WiForce sensors, we can infer the location and contact force magnitude on the 2-D continuum spanned by these multiple sensors. A hindering factor to this 2-D extension is how to address multiple touch points simultaneously, which will be explored in future works.
Reducing the form factor: WiForce is the first work which presents such a low-powered sensor, and thus naturally leads the way to realize a battery-free haptic feedback. The current sensor prototype of WiForce is 80 mm long, and about 10 mm thick. With the current form factor, the sensor is not directly applicable for some of the medical applications which need smaller sensors. The sensors can get to the correct form-factor requirements by designing integrated circuits, antenna and the sensor fabrication. To make the sensor prototype more flexible, we will explore new fabrication strategies like flexible PCB printing and creating custom RF connectors.
8 Related Work
Force sensors have been developed using a variety of transduction mechanisms, such as capacitive, piezoresistive, piezoelectric, optical, magnetic, and inductive [65]. There are a number of tradeoffs among the various mechanisms, including, for example, sensitivity, spatial resolution, accuracy, power consumption, and size. To meet the requirements of many emerging systems, particularly those where it may be difficult to have a physical wired connection to the sensors, many researchers have been investigating the creation of wireless sensors.
Wireless force sensors: A number of wireless capacitive force sensors that leverage a change in capacitance due to deformation have been recently developed. For example, a flexible capacitive sensor was created for wirelessly measuring strain in tires [66], and a capacitive textile sensor was developed for wireless respiratory monitoring [67]. While the capacitive sensing paradigm can work well for a number of force sensing applications, it is not naturally compatible with wireless sensing. In order to wirelessly transmit force information obtained through capacitive sensing, additional hardware and circuits are needed, complicating the design.
Inductor-capacitor (LC) wireless sensors are passive devices that can remotely sense a number of parameters, including pressure. The working principle of these sensors is based on changes in the capacitance that causes a shift in the LC resonant frequency, which can be wirelessly measured [68, 69]. A number of these LC sensors have been developed for applications like monitoring of pressures during arterial blood flow [70], and the measure of finger tip forces during athletic activities [71]. However, the resonance frequency of these sensors is in the range of a few hundred kHz to a few MHz [69], which makes wireless sensing difficult. As a consequence, these sensors suffer from short interrogation distances in the range of a few centimeters [72, 69].
There has also been a large body of research on strain sensors [73, 74, 75, 76, 35]. In strain sensing, instead of sensing the normal transversal force, the longitudinal force is sensed. Longitudinal force has a tendency to stretch and elongate the object it is acting upon, hence these sensors estimate the change in the length to infer strain. Thus, most of the wireless strain sensors exploit the shifts in resonant frequencies to sense strain. That is, to infer strain, a wireless reader evaluates signal strength at multiple frequencies, to estimate the resonant frequency, where a notch will form in the signal strength measurements. It is well known that signal strength is a fickle quantity easily corrupted by multipath. Indeed, most of these works show evaluations in a controlled, anechoic environment, and the technology has not been found to be robust to static multipath [74].
Backscatter sensing systems: Recent advancements in ‘backscatter sensing’ has enabled the creation of passive, battery-free touch interfaces. Touch sensing has been a well explored use case of RFID-based sensing [77, 78, 79, 80, 42, 41, 81, 82]. IDSense [82] utilized the fact that reflected RSS and phase change in a unique way when the RFID chip is touched, and following up on this PaperId [81] even gave a simple manufacturing method by which one could simply use an inkjet printer to manufacture these RFID tags and augment everyday objects with touch interactions. RIO [41] further explored the touch to reflected signal phase mapping to extend touch sensing to multiple RFID tags by utilizing mutual coupling effects, and extended the design further to use custom designed, application specific RFID tags. Livetag [42] presented a similar touch sensing system showing how to sense these touch interactions using Wi-Fi based readers, instead of relying on expensive, dedicated RFID readers used by earlier works. However, none of these systems could sense force magnitude and were limited to sensing just the position where the tag was being touched in order to sense simple gestures/sliding movements etc.
9 Acknowledgements
We thank anonymous reviewers and our shepherd, Prof. Haitham Hassanieh, for their insightful feedback. We also thank members of WCSNG, UCSD for their feedback throughout the process, as well as analog devices for providing us HMC544AE samples. This research was supported in part by the National Science Founda-tion under Grant 1935329.
References
- [1] Victoria E Abraira and David D Ginty. The sensory neurons of touch. Neuron, 79(4):618–639, 2013.
- [2] Aude Billard and Danica Kragic. Trends and challenges in robot manipulation. Science, 364(6446), 2019.
- [3] Zhen Deng, Yannick Jonetzko, Liwei Zhang, and Jianwei Zhang. Grasping force control of multi-fingered robotic hands through tactile sensing for object stabilization. Sensors, 20(4):1050, 2020.
- [4] Yousef Al-Handarish, Olatunji Mumini Omisore, Tobore Igbe, Shipeng Han, Hui Li, Wenjing Du, Jinjie Zhang, and Lei Wang. A survey of tactile-sensing systems and their applications in biomedical engineering. Advances in Materials Science and Engineering, 2020, 2020.
- [5] Javad Dargahi, Saeed Sokhanvar, Siamak Najarian, and Siamak Arbatani. Tactile Sensing and Displays: Haptic Feedback for Minimally Invasive Surgery and Robotics. John Wiley & Sons, 2012.
- [6] Jacqueline K Koehn and Katherine J Kuchenbecker. Surgeons and non-surgeons prefer haptic feedback of instrument vibrations during robotic surgery. Surgical endoscopy, 29(10):2970–2983, 2015.
- [7] Hedan Bai, Shuo Li, Jose Barreiros, Yaqi Tu, Clifford R Pollock, and Robert F Shepherd. Stretchable distributed fiber-optic sensors. Science, 370(6518):848–852, 2020.
- [8] Minglu Zhu, Zhongda Sun, Zixuan Zhang, Qiongfeng Shi, Tianyiyi He, Huicong Liu, Tao Chen, and Chengkuo Lee. Haptic-feedback smart glove as a creative human-machine interface (hmi) for virtual/augmented reality applications. Science Advances, 6(19):eaaz8693, 2020.
- [9] Wang Dangxiao, Guo Yuan, Liu Shiyi, Yuru Zhang, Xu Weiliang, and Xiao Jing. Haptic display for virtual reality: progress and challenges. Virtual Reality & Intelligent Hardware, 1(2):136–162, 2019.
- [10] Hyosang Lee, Kyungseo Park, Jung Kim, and Katherine J Kuchenbecker. Internal array electrodes improve the spatial resolution of soft tactile sensors based on electrical resistance tomography. In 2019 International Conference on Robotics and Automation (ICRA), pages 5411–5417. IEEE, 2019.
- [11] Kyungseo Park, Hyunkyu Park, Hyosang Lee, Sungbin Park, and Jung Kim. An ert-based robotic skin with sparsely distributed electrodes: Structure, fabrication, and dnn-based signal processing. In 2020 IEEE International Conference on Robotics and Automation (ICRA), pages 1617–1624. IEEE, 2020.
- [12] Hyosang Lee, Hyunkyu Park, Gokhan Serhat, Huanbo Sun, and Katherine J Kuchenbecker. Calibrating a soft ert-based tactile sensor with a multiphysics model and sim-to-real transfer learning. In 2020 IEEE International Conference on Robotics and Automation (ICRA), pages 1632–1638. IEEE, 2020.
- [13] Ravinder S Dahiya, Philipp Mittendorfer, Maurizio Valle, Gordon Cheng, and Vladimir J Lumelsky. Directions toward effective utilization of tactile skin: A review. IEEE Sensors Journal, 13(11):4121–4138, 2013.
- [14] Mahesh Soni and Ravinder Dahiya. Soft eskin: distributed touch sensing with harmonized energy and computing. Philosophical Transactions of the Royal Society A, 378(2164):20190156, 2020.
- [15] Ilya Rosenberg and Ken Perlin. The unmousepad: an interpolating multi-touch force-sensing input pad. In ACM SIGGRAPH 2009 papers, pages 1–9. 2009.
- [16] Liang Zou, Chang Ge, Z Jane Wang, Edmond Cretu, and Xiaoou Li. Novel tactile sensor technology and smart tactile sensing systems: A review. Sensors, 17(11):2653, 2017.
- [17] Patrick Parzer, Kathrin Probst, Teo Babic, Christian Rendl, Anita Vogl, Alex Olwal, and Michael Haller. Flextiles: a flexible, stretchable, formable, pressure-sensitive, tactile input sensor. In Proceedings of the 2016 CHI Conference Extended Abstracts on Human Factors in Computing Systems, pages 3754–3757, 2016.
- [18] Patrick Parzer, Florian Perteneder, Kathrin Probst, Christian Rendl, Joanne Leong, Sarah Schuetz, Anita Vogl, Reinhard Schwoediauer, Martin Kaltenbrunner, Siegfried Bauer, et al. Resi: a highly flexible, pressure-sensitive, imperceptible textile interface based on resistive yarns. In Proceedings of the 31st Annual ACM Symposium on User Interface Software and Technology, pages 745–756, 2018.
- [19] Andreas Pointner, Thomas Preindl, Sara Mlakar, Roland Aigner, and Michael Haller. Knitted resi: A highly flexible, force-sensitive knitted textile based on resistive yarns. In ACM SIGGRAPH 2020 Emerging Technologies, pages 1–2. 2020.
- [20] Hyosang Lee, Kyungseo Park, Yunjoo Kim, and Jung Kim. Durable and repairable soft tactile skin for physical human robot interaction. In Proceedings of the Companion of the 2017 ACM/IEEE International Conference on Human-Robot Interaction, pages 183–184, 2017.
- [21] Jessica Burgner-Kahrs, D Caleb Rucker, and Howie Choset. Continuum robots for medical applications: A survey. IEEE Transactions on Robotics, 31(6):1261–1280, 2015.
- [22] Axel Antoine, Sylvain Malacria, and Géry Casiez. Forceedge: controlling autoscroll on both desktop and mobile computers using the force. In Proceedings of the 2017 CHI Conference on Human Factors in Computing Systems, pages 3281–3292, 2017.
- [23] David Silvera-Tawil, David Rye, Manuchehr Soleimani, and Mari Velonaki. Electrical impedance tomography for artificial sensitive robotic skin: A review. IEEE Sensors Journal, 15(4):2001–2016, 2014.
- [24] Po-Han Peter Wang, Chi Zhang, Hongsen Yang, Dinesh Bharadia, and Patrick P Mercier. 20.1 a 28w iot tag that can communicate with commodity wifi transceivers via a single-side-band qpsk backscatter communication technique. In 2020 IEEE International Solid-State Circuits Conference-(ISSCC), pages 312–314. IEEE, 2020.
- [25] Pengyu Zhang, Dinesh Bharadia, Kiran Joshi, and Sachin Katti. Hitchhike: Practical backscatter using commodity wifi. In Proceedings of the 14th ACM Conference on Embedded Network Sensor Systems CD-ROM, SenSys ’16, page 259–271, New York, NY, USA, 2016. Association for Computing Machinery.
- [26] C. Girerd, Q. Zhang, A. Gupta, M. Dunna, D. Bharadia, and T. K. Morimoto. Towards a wireless force sensor based on wave backscattering for medical applications. IEEE Sensors Journal, pages 1–1, 2021.
- [27] Zhihong Luo, Qiping Zhang, Yunfei Ma, Manish Singh, and Fadel Adib. 3d backscatter localization for fine-grained robotics. In 16th USENIX Symposium on Networked Systems Design and Implementation (NSDI 19), pages 765–782, 2019.
- [28] Colleen Josephson, Bradley Barnhart, Sachin Katti, Keith Winstein, and Ranveer Chandra. Rf soil moisture sensing via radar backscatter tags. arXiv preprint arXiv:1912.12382, 2019.
- [29] Pengyu Zhang, Colleen Josephson, Dinesh Bharadia, and Sachin Katti. Freerider: Backscatter communication using commodity radios. In Proceedings of the 13th International Conference on Emerging Networking EXperiments and Technologies, CoNEXT ’17, page 389–401, New York, NY, USA, 2017. Association for Computing Machinery.
- [30] Anderson Maciel, Tansel Halic, Zhonghua Lu, Luciana P Nedel, and Suvranu De. Using the physx engine for physics-based virtual surgery with force feedback. The International Journal of Medical Robotics and Computer Assisted Surgery, 5(3):341–353, 2009.
- [31] Christopher R Wagner, Robert D Howe, and Nicholas Stylopoulos. The role of force feedback in surgery: analysis of blunt dissection. In Haptic Interfaces for Virtual Environment and Teleoperator Systems, International Symposium on, pages 73–73. Citeseer, 2002.
- [32] Dangxiao Wang, Meng Song, Afzal Naqash, Yukai Zheng, Weiliang Xu, and Yuru Zhang. Toward whole-hand kinesthetic feedback: A survey of force feedback gloves. IEEE transactions on haptics, 12(2):189–204, 2018.
- [33] Yong-Lae Park, Bor-Rong Chen, and Robert J Wood. Design and fabrication of soft artificial skin using embedded microchannels and liquid conductors. IEEE Sensors journal, 12(8):2711–2718, 2012.
- [34] Yahya Elsayed, Augusto Vincensi, Constantina Lekakou, Tao Geng, CM Saaj, Tommaso Ranzani, Matteo Cianchetti, and Arianna Menciassi. Finite element analysis and design optimization of a pneumatically actuating silicone module for robotic surgery applications. Soft Robotics, 1(4):255–262, 2014.
- [35] Lijun Teng, Kewen Pan, Markus P Nemitz, Rui Song, Zhirun Hu, and Adam A Stokes. Soft radio-frequency identification sensors: Wireless long-range strain sensors using radio-frequency identification. Soft robotics, 6(1):82–94, 2019.
- [36] Atmel SAM3X8E ARM Cortex-M3. https://ww1.microchip.com/downloads/en/DeviceDoc/Atmel-11057-32-bit-Cortex-M3-Microcontroller-SAM3X-SAM3A˙Datasheet.pdf.
- [37] Analog Devices. Hmc544ae. https://www.analog.com/media/en/technical-documentation/data-sheets/hmc544ae.pdf.
- [38] Aatmesh Shrivastava and Benton H Calhoun. A 150nw, 5ppm/o c, 100khz on-chip clock source for ultra low power socs. In Proceedings of the IEEE 2012 Custom Integrated Circuits Conference, pages 1–4. IEEE, 2012.
- [39] Farah Laiwalla, Jihun Lee, Ah-Hyoung Lee, Ethan Mok, Vincent Leung, Steven Shellhammer, Yoon-Kyu Song, Lawrence Larson, and Arto Nurmikko. A distributed wireless network of implantable sub-mm cortical microstimulators for brain-computer interfaces. In 2019 41st Annual International Conference of the IEEE Engineering in Medicine and Biology Society (EMBC), pages 6876–6879. IEEE, 2019.
- [40] a National Instruments Company Ettus Research. USRP: Universal software defined radio peripheral networked series. https://www.ettus.com/product-categories/usrp-networked-series/. Accessed: 2020-09-01.
- [41] Swadhin Pradhan, Eugene Chai, Karthikeyan Sundaresan, Lili Qiu, Mohammad A Khojastepour, and Sampath Rangarajan. Rio: A pervasive rfid-based touch gesture interface. In Proceedings of the 23rd Annual International Conference on Mobile Computing and Networking, pages 261–274, 2017.
- [42] Chuhan Gao, Yilong Li, and Xinyu Zhang. Livetag: Sensing human-object interaction through passive chipless wifi tags. In 15th USENIX Symposium on Networked Systems Design and Implementation (NSDI 18), pages 533–546, 2018.
- [43] Sandeep KS Gupta, Suresh Lalwani, Yashwanth Prakash, E Elsharawy, and Loren Schwiebert. Towards a propagation model for wireless biomedical applications. In IEEE International Conference on Communications, 2003. ICC’03., volume 3, pages 1993–1997. IEEE, 2003.
- [44] Ilka Dove. Analysis of radio propagation inside the human body for in-body localization purposes. Master’s thesis, University of Twente, 2014.
- [45] Deepak Vasisht, Guo Zhang, Omid Abari, Hsiao-Ming Lu, Jacob Flanz, and Dina Katabi. In-body backscatter communication and localization. In Proceedings of the 2018 Conference of the ACM Special Interest Group on Data Communication, pages 132–146, 2018.
- [46] A. Sani, M. Rajab, R. Foster, and Y. Hao. Antennas and propagation of implanted rfids for pervasive healthcare applications. Proceedings of the IEEE, 98(9):1648–1655, 2010.
- [47] Kiran Dandekar, Balasundar I Raju, and Mandayam A Srinivasan. 3-d finite-element models of human and monkey fingertips to investigate the mechanics of tactile sense. J. Biomech. Eng., 125(5):682–691, 2003.
- [48] Eric M Young, David Gueorguiev, Katherine J Kuchenbecker, and Claudio Pacchierotti. Compensating for fingertip size to render tactile cues more accurately. IEEE transactions on haptics, 13(1):144–151, 2020.
- [49] Nazim Haouchine, Winnie Kuang, Stephane Cotin, and Michael Yip. Vision-based force feedback estimation for robot-assisted surgery using instrument-constrained biomechanical three-dimensional maps. IEEE Robotics and Automation Letters, 3(3):2160–2165, 2018.
- [50] Angelica I Aviles, Samar Alsaleh, Pilar Sobrevilla, and Alicia Casals. Sensorless force estimation using a neuro-vision-based approach for robotic-assisted surgery. In 2015 7th International IEEE/EMBS Conference on Neural Engineering (NER), pages 86–89. IEEE, 2015.
- [51] Allison M Okamura. Haptic feedback in robot-assisted minimally invasive surgery. Current opinion in urology, 19(1):102, 2009.
- [52] Carol E Reiley, Takintope Akinbiyi, Darius Burschka, David C Chang, Allison M Okamura, and David D Yuh. Effects of visual force feedback on robot-assisted surgical task performance. The Journal of thoracic and cardiovascular surgery, 135(1):196–202, 2008.
- [53] Shanu N Kothari, Brian J Kaplan, Eric J DeMaria, Timothy J Broderick, and Ronald C Merrell. Training in laparoscopic suturing skills using a new computer-based virtual reality simulator (mist-vr) provides results comparable to those with an established pelvic trainer system. Journal of laparoendoscopic & advanced surgical techniques, 12(3):167–173, 2002.
- [54] M Zhou, S Tse, A Derevianko, DB Jones, SD Schwaitzberg, and CGL Cao. Effect of haptic feedback in laparoscopic surgery skill acquisition. Surgical endoscopy, 26(4):1128–1134, 2012.
- [55] Michael Yip and David Camarillo. Model-less hybrid position/force control: a minimalist approach for continuum manipulators in unknown, constrained environments. IEEE Robotics and Automation Letters, 2016.
- [56] Gregory Tholey, Jaydev P Desai, and Andres E Castellanos. Force feedback plays a significant role in minimally invasive surgery: results and analysis. Annals of surgery, 241(1):102, 2005.
- [57] Anibal Francone, Jason Mingyi Huang, Ji Ma, Tsu-Chin Tsao, Jacob Rosen, and Jean-Pierre Hubschman. The effect of haptic feedback on efficiency and safety during preretinal membrane peeling simulation. Translational vision science & technology, 8(4):2–2, 2019.
- [58] Ilana Nisky, Felix Huang, Amit Milstein, Carla M Pugh, Ferdinando A Mussa-Ivaldi, and Amir Karniel. Perception of stiffness in laparoscopy–the fulcrum effect. Studies in health technology and informatics, 173:313, 2012.
- [59] Wenzhen Yuan, Siyuan Dong, and Edward H Adelson. Gelsight: High-resolution robot tactile sensors for estimating geometry and force. Sensors, 17(12):2762, 2017.
- [60] Yu She, Sandra Q Liu, Peiyu Yu, and Edward Adelson. Exoskeleton-covered soft finger with vision-based proprioception and tactile sensing. In 2020 IEEE International Conference on Robotics and Automation (ICRA), pages 10075–10081. IEEE, 2020.
- [61] Wei Chen, Heba Khamis, Ingvars Birznieks, Nathan F Lepora, and Stephen J Redmond. Tactile sensors for friction estimation and incipient slip detection—toward dexterous robotic manipulation: A review. IEEE Sensors Journal, 18(22):9049–9064, 2018.
- [62] Hiroshi Ishii. The tangible user interface and its evolution. Communications of the ACM, 51(6):32–36, 2008.
- [63] Yang Zhang, Yasha Iravantchi, Haojian Jin, Swarun Kumar, and Chris Harrison. Sozu: Self-powered radio tags for building-scale activity sensing. In Proceedings of the 32nd Annual ACM Symposium on User Interface Software and Technology, pages 973–985, 2019.
- [64] Chuhan Gao, Yilong Li, and Xinyu Zhang. Livetag: Sensing human-object interaction through passive chipless wi-fi tags. GetMobile: Mobile Computing and Communications, 22(3):32–35, 2019.
- [65] Cheng Chi, Xuguang Sun, Ning Xue, Tong Li, and Chang Liu. Recent progress in technologies for tactile sensors. Sensors, 18(4):948, 2018.
- [66] Ryosuke Matsuzaki and Akira Todoroki. Wireless flexible capacitive sensor based on ultra-flexible epoxy resin for strain measurement of automobile tires. Sensors and Actuators A: Physical, 140(1):32–42, 2007.
- [67] T Hoffmann, B Eilebrecht, and S Leonhardt. Respiratory monitoring system on the basis of capacitive textile force sensors. IEEE sensors journal, 11(5):1112–1119, 2010.
- [68] Chen Li, Qiulin Tan, Pinggang Jia, Wendong Zhang, Jun Liu, Chenyang Xue, and Jijun Xiong. Review of research status and development trends of wireless passive lc resonant sensors for harsh environments. Sensors, 15(6):13097–13109, 2015.
- [69] Qing-An Huang, Lei Dong, and Li-Feng Wang. Lc passive wireless sensors toward a wireless sensing platform: status, prospects, and challenges. Journal of Microelectromechanical Systems, 25(5):822–841, 2016.
- [70] Clementine M Boutry, Levent Beker, Yukitoshi Kaizawa, Christopher Vassos, Helen Tran, Allison C Hinckley, Raphael Pfattner, Simiao Niu, Junheng Li, Jean Claverie, et al. Biodegradable and flexible arterial-pulse sensor for the wireless monitoring of blood flow. Nature biomedical engineering, 3(1):47–57, 2019.
- [71] Baoqing Nie, Ting Yao, Yiqiu Zhang, Jian Liu, and Xinjian Chen. A droplet-based passive force sensor for remote tactile sensing applications. Applied Physics Letters, 112(3):031904, 2018.
- [72] Marco Baù, Marco Demori, Marco Ferrari, and Vittorio Ferrari. Contactless readout of passive lc sensors with compensation circuit for distance-independent measurements. In Multidisciplinary Digital Publishing Institute Proceedings, volume 2, page 842, 2018.
- [73] Haining Li, Jiexiong Ding, Siqi Wei, Bowen Chu, Lichao Guan, Li Du, Guangmin Liu, and Jianguo He. A miniature layered saw contact stress sensor for operation in cramped metallic slits. Instruments and Experimental Techniques, 61(4):610–617, 2018.
- [74] Xiaohua Yi, Terence Wu, Yang Wang, Roberto T Leon, Manos M Tentzeris, and Gabriel Lantz. Passive wireless smart-skin sensor using rfid-based folded patch antennas. International Journal of Smart and Nano Materials, 2(1):22–38, 2011.
- [75] Trang T Thai, Herve Aubert, Patrick Pons, Manos M Tentzeris, and Robert Plana. Design of a highly sensitive wireless passive rf strain transducer. In 2011 IEEE MTT-S International Microwave Symposium, pages 1–4. IEEE, 2011.
- [76] JR Humphries and DC Malocha. Passive, wireless saw ofc strain sensor. In 2012 IEEE International Frequency Control Symposium Proceedings, pages 1–6. IEEE, 2012.
- [77] Nicolai Marquardt, Alex S Taylor, Nicolas Villar, and Saul Greenberg. Rethinking rfid: awareness and control for interaction with rfid systems. In Proceedings of the SIGCHI Conference on Human Factors in Computing Systems, pages 2307–2316, 2010.
- [78] Alanson P Sample, Daniel J Yeager, and Joshua R Smith. A capacitive touch interface for passive rfid tags. In 2009 IEEE International Conference on RFID, pages 103–109. IEEE, 2009.
- [79] Timothy M Simon, Bruce H Thomas, Ross T Smith, and Mark Smith. Adding input controls and sensors to rfid tags to support dynamic tangible user interfaces. In Proceedings of the 8th International Conference on Tangible, Embedded and Embodied Interaction, pages 165–172, 2014.
- [80] Albrecht Schmidt, H-W Gellersen, and Christian Merz. Enabling implicit human computer interaction: a wearable rfid-tag reader. In Digest of Papers. Fourth International Symposium on Wearable Computers, pages 193–194. IEEE, 2000.
- [81] Hanchuan Li, Eric Brockmeyer, Elizabeth J Carter, Josh Fromm, Scott E Hudson, Shwetak N Patel, and Alanson Sample. Paperid: A technique for drawing functional battery-free wireless interfaces on paper. In Proceedings of the 2016 CHI Conference on Human Factors in Computing Systems, pages 5885–5896, 2016.
- [82] Hanchuan Li, Can Ye, and Alanson P Sample. Idsense: A human object interaction detection system based on passive uhf rfid. In Proceedings of the 33rd Annual ACM Conference on Human Factors in Computing Systems, pages 2555–2564, 2015.
- [83] Quantenna. QSR10GU-AX. http://www.quantenna.com/wp-content/uploads/2018/04/QSR10GU-AX-V1.1.pdf.
- [84] Eugenio Magistretti, Krishna Kant Chintalapudi, Bozidar Radunovic, and Ramachandran Ramjee. Wifi-nano: Reclaiming wifi efficiency through 800 ns slots. In Proceedings of the 17th annual international conference on Mobile computing and networking, pages 37–48, 2011.
- [85] Manikanta Kotaru and Sachin Katti. Position tracking for virtual reality using commodity wifi. In Proceedings of the IEEE Conference on Computer Vision and Pattern Recognition, pages 68–78, 2017.
- [86] Yaxiong Xie, Jie Xiong, Mo Li, and Kyle Jamieson. md-track: Leveraging multi-dimensionality for passive indoor wi-fi tracking. In The 25th Annual International Conference on Mobile Computing and Networking, pages 1–16, 2019.
- [87] Michael Steer. Microwave and RF design. NC State University, 2019.
10 Appendix
10.1 Replacing SDR with COTS
We can read the sensor using a COTS-WiFi implementation which can provide CSI, like Quantenna [83]. With COTS devices, periodic channel estimates can be obtained with similar time latency as compared to our implementation using SDRs. In our implementation, (Section 4.4), which is reasonably higher than packet sizes of achievable by 1 Gbps WiFi systems [84]. A potential issue could be MAC overheads, as also cited in [84], however, we can alter the packet structure slightly to avoid backoffs which can mitigate against the MAC overheads. However, with COTS devices, we will have to deal with CFO effects in the measured channel response.
In our implementation on USRP, we had TX and RX sharing the same RF chain. With COTS devices like quantenna, we will have TX and RX as separate devices which might not be able to share a clock, thus leading to frequency and phase offsets. Although WiForce design is robust to phase offsets due to our differential phase sensing approach, we would need to counter CFO. To counter the CFO effects, we can use the fact that CFO will remain same for both the direct path between TX and RX, and the reflected signal from the sensor. To do so, we can cnsider a differential sensing approach by caluclating phase relative to the direct path, and similar approaches have been explored to do so in past work [85, 86]
10.2 HFSS Simulations
For an air substrate microstrip transmission line, we have the following equation which governs the impedance matching, , where is the vertical separation between signal and ground trace, and is the width of the signal trace [87]. Setting in the above equation, gives us the operating ratio to be approximately . In order to interface SMA connectors to the air-substrate microstrip line designed, we have to increase the width of the ground trace so that the bottom legs of the SMA connector can be soldered directly to the ground trace.
However, we notice some deviation from this ratio when the width of ground trace is increased to allow for easier interfacing with SMA connectors. We simulate the sensor in Ansys HFSS (Fig. 16) to determine this deviation, and observe that the ideal operating ratio shifts to about 4:1 instead of 5:1 when the width of ground trace is increased.
10.3 Performance with distance
We also evaluate our sensor and wireless reader design over a range of distances. For this experiment, we place the TX antenna, sensor antenna and RX antenna along a straight line. The TX antenna is placed 4 m away from the RX antenna, and the sensor is moved from the mid-point, which is 2 m away from both to distances, closer to the RX antenna, and farther away from the TX antenna. The TX power is set to 10 dBm, and the center frequency for this experiment was 900 MHz. We can observe that the sensor gives accurate and satisfying phase stability of less than even at a distance of 1 m, 3 m from the RX/TX, and acceptable within performance even at the worst 2 m, 2 m distance from the TX/RX. These operating distances are comparable with previously shown evaluations with RFID based backscatter at 900 MHZ [41], which tested sensing at a maximum distance of 2 m from the RFID reader.